


ABSTRACT
Many young- and intermediate-age massive stellar clusters host bimodal distributions in the rotation rates of their stellar populations, with a dominant peak of rapidly rotating stars and a secondary peak of slow rotators. The origin of this bimodal rotational distribution is currently debated and two main theories have been put forward in the literature. The first is that all/most stars are born as rapid rotators and that interacting binaries break a fraction of the stars, resulting in two populations. The second is that the rotational distribution is a reflection of the early evolution of pre-main sequence stars, in particular, whether they are able to retain or lose their protoplanetary discs during the first few Myr. Here, we test the binary channel by exploiting multi-epoch Very Large Telescope/MUSE observations of NGC 1850, an ∼100 Myr massive cluster in the Large Magellanic Cloud, to search for differences in the binary fractions of the slow- and fast-rotating populations. If binarity is the cause of the rotational bimodality, we would expect that the slowly rotating population should have a much larger binary fraction than the rapid rotators. However, in our data we detect similar fractions of binary stars in the slow and rapidly rotating populations (5.9 ± 1.1 and 4.5 ± 0.6 per cent, respectively). Hence, we conclude that binarity is not a dominant mechanism in the formation of the observed bimodal rotational distributions.
1 INTRODUCTION
It has recently been established that resolved young massive clusters host stars with a bimodal rotational distribution (e.g. Dupree et al. 2017; Kamann et al. 2018) with a dominant peak of rapid rotators and a smaller peak of slow rotators (e.g. Bastian et al. 2018; Marino et al. 2018; Kamann et al. 2020). This rotational bimodality manifests itself as a split main sequence (D’Antona et al. 2015) and an extended main sequence turnoff (eMSTO; Bastian & de Mink 2009) in colour–magnitude diagrams (CMD) of massive clusters with ages of ≲300 Myr and <2 Gyr, respectively.
The origin of this rotational bimodality is still debated in the literature. D’Antona et al. (2015), D’Antona et al. (2017) suggest that all/most stars (at least those above |$\sim\!{1.5}\, {\rm M}_\odot$|) are born rapidly rotating, and that the minor peak consists of stars that were broken during their main sequence lifetimes. Motivated by an observed trend among early F to B stars in the Galactic field, which show lower rotational velocities when being part of binary systems with periods of a few to ∼500 d (Abt & Boonyarak 2004), D’Antona et al. (2015) propose that the slow rotators observed in clusters were broken via tides in similarly tight binary stars. Such a scenario has also been advocated by Sun et al. (2019) for the specific case of NGC 2287, an open cluster in the Milky Way.
Alternatively, Bastian et al. (2020) argue that such a rotational bimodality may be imprinted at very early times in a cluster’s life, and suggest that the key parameter is the time-scale on which pre-main sequence stars lose their protostellar discs, with shorter (longer) removal times resulting in fast rotators (slow rotators). These authors show that if a bimodality is set at early times it will persist for the subsequent ∼2 Gyr (for stars that are not magnetically broken, i.e. for |$M_{\star } \gtrsim 1.5\, {\rm M}_\odot$|).
The pre-main sequence origin of the bimodality can be tested through observations of the period distributions of stars in very young clusters, across a wide range of stellar masses, and ongoing surveys (e.g. of the Galactic cluster Westerlund 2 – Sabbi et al. 2020) should be able to confirm or refute this hypothesis.
Alternatively, a possible link between binarity and the origin of the bimodal distribution can be tested through time-series observations of massive clusters over a wide range of ages (from forming today to ∼2 Gyr). In this scenario, tight binaries are needed to break stars, and tight binaries are usually not destroyed via three-body encounters, even in massive clusters (e.g. Heggie & Hut 2003; Ivanova et al. 2005; Fregeau, Ivanova & Rasio 2009). To illustrate this, we follow Ivanova et al. (2005) and define the hardness η of a binary as its binding energy relative to the typical kinetic energy of a cluster star, i.e. |$\eta =\mathrm{ G}\, m_1\, m_2/(\langle m\rangle \, \sigma ^2\, a)$|. Here, m1 and m2 are the masses of the binary components, orbiting each other with a semimajor axis a, 〈m〉 is the average stellar mass inside the cluster, σ its velocity dispersion, and G the gravitational constant. If we consider a circular orbit with a period of 500 d (the upper limit for which a decrease in vsin i is observed in the Galactic field, cf. Abt & Boonyarak 2004), typical masses of |$m_1=2\, M_{\odot }$| and m2 = 〈m〉, and a velocity dispersion of |$\sigma =5\,{\rm km\, s^{-1}}$|, we find η ≈ 40. In other words, the binding energy of binaries suggested to be responsible for the formation of the sequence of slow rotators is at least 40 times higher than the kinematic energy of a typical cluster star. It is very unlikely that such binary star is destroyed in a dynamical encounter with another cluster member.1 Hence, the binary scenario predicts that the population of slow rotators is expected to display a much higher binary fraction than the rapidly rotating population.
In this work, we explicitly test the interacting binary scenario using the integral field spectrograph MUSE, on the Very Large Telescope (VLT), to study the stellar populations in the young Large Magellanic Cloud (LMC) cluster NGC 1850 (∼100 Myr). VLT/MUSE allows us to obtain the radial velocities of thousands of cluster members per pointing, and by obtaining multiple epochs we can search for radial velocity variations which would indicate binarity. In Kamann et al. (2020), such an analysis has been applied to the intermediate-age cluster NGC 1846, where no differences in the binary frequencies of the fast and slowly rotating populations of eMSTO stars were found.
2 OBSERVATIONS AND DATA REDUCTION
The observations used in this work will be presented in detail in a forthcoming paper (Kamann et al., in preparation). Here, we provide a brief description. We observed NGC 1850 with the MUSE integral field spectrograph (Bacon et al. 2010) at the European Southern Observatory VLT in wide-field mode (programs: 0102.D-0268 and 106.216T.001, PI: Bastian). The ground-layer adaptive optics system was used in order to improve the spatial resolution of the cubes.
Our observations targeted two fields within the cluster. One field was centred on the cluster centre while the second outer field was situated ∼1′ to the south-east of the centre, with a small overlap with the central field. The observations were taken over 16 nights between 2019 January 13 and 2021 February 06, with the sampling between individual periods ranging from 1 h to 25 months. This ensures that our data are sensitive to binaries over a wide range of orbital periods. Nevertheless, we also perform a thorough investigation of the selection effects inherent in our analysis (cf. Section 4, below).
During each night, one observing block (OB) was executed, consisting of 2 × 400 s exposures on the central field, followed by 3 × 500 s on the outer field. We used versions 2.6 and 2.8.3 of the official MUSE pipeline (Weilbacher et al. 2020) to create two data cubes – one for the central and one for the outer pointing – from the data observed within each OB.
We further gathered archival Hubble Space Telescope (HST) photometry of NGC 1850, taken with the WFC3 camera during programs 14069 (PI: Bastian) and 14174 (PI: Goudfrooij). The data include images taken in six filters, F275W, F336W, F343N, F438W, F656N, and F814W. All images were analysed using dolphot, a modified version of hstphot (Dolphin 2000), following the procedure described in Gossage et al. (2019) and references therein. We used the right ascension and declination as well as the F656N magnitudes from the final HST catalogue as a reference and extracted individual stellar spectra from the final MUSE data cubes using PampelMuse (Kamann, Wisotzki & Roth 2013). The reason for using the F656N magnitudes when initializing the extraction process is that the photometry in this narrow-band filter is less affected by saturation of the brightest sources than the broad-band filters overlapping with the MUSE spectral range.
We show the distribution of the entire HST sample in the (mF336W − mF438W, mF438W) CMD in the left-hand panel of Fig. 1. The split main sequence (MS) is visible between approximately 18.0 < mF438W < 20, and we show the distinction between the two branches (blue MS and red MS) as a solid (blue) line. The separation was performed by dividing the stars in the magnitude range 18.0 < mF438W < 20.0 into bins of |$0.2\, {\rm mag}$| width. In each magnitude bin, we inspected the distribution of mF336W − mF438W colours, searching for the minimum between the two sequences. As the minimum was always located around the 20th percentile of the distribution, we used this value to separate the two branches. We note that Correnti et al. (2017) measured a fraction of blue main sequence stars of approximately |$25{-}30\,\mathrm{ per}\,\mathrm{ cent}$| in NGC 1850, i.e. found a slightly higher value than the |$20\,\mathrm{ per}\,\mathrm{ cent}$| adopted in this work.
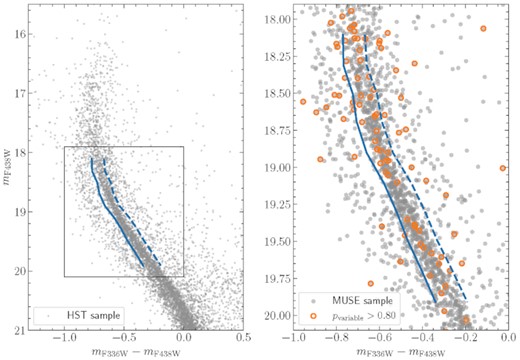
Left-hand panel: CMD of NGC 1850, generated from the HST photometry discussed in Section 2. Blue lines indicate the colours used to separate blue and red main sequence stars (solid) as well as red main sequence stars and the photometric binaries (dashed). A zoom into the area highlighted by a black square is shown in the right panel. Right-hand panel: Distribution of stars with detected radial velocity variability across the split main sequences of NGC 1850. The entire MUSE sample is shown as light grey dots. Stars with high probabilities of being variable are highlighted with orange circles. Blue lines are the same as in the left-hand panel.
The photometric binary sequence of NGC 1850 is visible to the red of the red main sequence in Fig. 1. In order to distinguish between red main sequence stars and photometric binaries, we only considered as part of the red main sequence the stars that lie bluewards of the dashed blue line included in Fig. 1. The line was constructed by shifting the dividing line between the two main sequences (i.e. the solid blue line, cf. Fig. 1) by an amount δc in mF336W − mF438W colour,2 where δc increased linearly from 0.1 at mF438W = 18.0 to 0.15 at mF438W = 20.0. This was done in order to account for the increased photometric scatter when going towards fainter magnitudes.
3 STELLAR PARAMETERS AND BINARITY
We used spexxy (Husser et al. 2016) in order to analyse the extracted spectra. The code determines radial velocities as well as stellar parameters (effective temperature, metallicity) using full-spectrum fits against a library of template spectra. We used the synthetic templates presented by Allende Prieto et al. (2018), which extend to effective temperatures of |$T_{\rm eff}=30\, 000\, {\rm K}$|, higher than what is expected along the main sequence of a 100 Myr old cluster. The initial guesses required by spexxy were taken from the comparison of the HST photometry to a MIST (Choi et al. 2016; Dotter 2016; Gossage et al. 2019) isochrone, assuming an age of 100 Myr and a metallicity of (Fe/H) = −0.24. Note that in contrast to the analysis presented in Kamann et al. (2020) for NGC 1846, no line broadening was included in the fits. Given that the synthetic templates were convolved with a model for the MUSE line spread function prior to the fits, this implies that all spectra were analysed under the assumption that vsin i = 0. An analysis of the stellar rotation measurements obtained from the MUSE data will be presented in a separate paper (Kamann et al., in preparation).
We used the radial velocities determined from the single-epoch spectra in order to search for potential binary stars. Note that we only search for signs of variability in this study, in order to perform a comparison between the fractions of potential binary stars on the blue and red main sequences. We make no effort to constrain the orbits of individual binary systems or the distribution of binary periods inside the cluster. Such an analysis requires additional epochs, which are only now becoming available as part of a follow-up program we are currently carrying out with MUSE. An in-depth analysis of the binary systems in NGC 1850 will be presented in a dedicated publication (Saracino et al., submitted).
In order to detect stars showing radial velocity variability, we need to be able to distinguish between intrinsic variability and variations caused by the finite sound-to-noise ratio (S/N) of our data. To this aim, a proper knowledge of the measurement uncertainties is key. In Kamann et al. (2020), we presented a method to calibrate the velocity uncertainties returned by the spexxy code. In brief, it works by measuring the period-to-period scatter in the measured radial velocities for all stars. Then, for each star a comparison sample is created, consisting of 100 stars with similar stellar parameters according to their position in the CMD. For each star under consideration, a correction factor for the uncertainty of each measured radial velocity is calculated as the standard deviation of the normalized velocity differences of its comparison sample. For more details about the procedure, we refer to Kamann et al. (2020). We find median uncertainties of |$21.4$| and |$18.3\, {\rm km\, s^{-1}}$| for stars on the red and blue main sequences, respectively. The values are considerably larger than what we found for eMSTO stars in NGC 1846 in Kamann et al. (2020), even though the typical S/N of the spectra is higher in the present study. The reasons behind this are twofold. First, the stars under consideration in NGC 1850 are hot stars, which in the wavelength range covered by MUSE show mainly broad Balmer and Paschen lines. Second, there is strong diffuse gas emission across the observed fields of NGC 1850, which can potentially leave residuals in the extracted spectra. For this reason, we decided to mask out the wavelength ranges where gas emission is present during the analysis with spexxy, including the cores of the strong hydrogen lines.
We used the method developed by Giesers et al. (2019) to convert the combined set of radial velocity measurements into a probability, p, for each star, that it shows radial velocity variations. The method uses the individual velocities and their uncertainties in order to calculate a reduced χ2 value for each star under the assumption it does not show radial velocity variations. The distribution of reduced χ2 values obtained this way is compared to the complementary cumulative distribution function expected for the reduced χ2 values if there were no variable stars in the sample. Essentially, for any given reduced χ2 value, the method determines the ratio between the number of stars detected above this value and the number of stars expected above this value in the absence of variable stars. Based on this comparison, each star is assigned a probability p of being variable. High ratios correspond to high p values, and vice versa. For further details, we refer to Giesers et al. (2019).
We considered each star with p > 0.8 as a likely binary star. The distribution of those stars along the split main sequences of NGC 1850 is shown in the right-hand panel of Fig. 1. As mentioned in Section 2, we used the blue line included in Fig. 1 to select two samples of blue and red main sequence stars in the magnitude range 18.0 < mF438W < 20.0 where the two sequences can be well separated.
It is obvious from the large radial velocity uncertainties that the method applied here is mainly sensitive to tight binaries, as these are the ones with the largest expected radial velocity variations, and also are expected to show such variations over the time-scales sampled by our observations. While we note that these are also the systems that are predicted to be most effective in braking rapidly rotating stars (e.g. D’Antona et al. 2015), it is evident that we have to take into account the selection effects inherent to our approach. This will be done in Section 4 below. However, we note that selection effects are expected to be equivalent for the two populations (slow/blue-MS and fast/red-MS), hence a direct comparison is still possible.
4 RESULTS
We find comparable discovery fractions for both sequences, with 20/338 (|$5.9\pm 1.1{{\ \rm per\ cent}}$|) of the blue main sequence stars (which consist presumably of slow rotators) and 44/978 (|$4.5\pm 0.6{{\ \rm per\ cent}}$|) of the red main sequence stars (fast rotators) showing variability. Note that the uncertainties provided for the individual discovery fractions account only for the statistical uncertainties due to the limited sample sizes. They do not account for the binary systems that are missed due to the limited velocity accuracy and the finite sampling of the periods. That is, the true binary fractions among the red and blue MS populations are likely considerably larger than the discovery fractions reported in this work. This is also evident from the binary fraction of |$6.6\pm 1.5{{\ \rm per\ cent}}$| that we obtain for the photometric binary stars, i.e. the stars to the red of the dashed blue line in Fig. 1. Detecting photometric binaries, i.e. systems where both stars contribute to the observed flux, via low-resolution spectroscopy is challenging. The anticyclical motion of the companion star diminishes any shift observed in the spectral lines of the primary star, to the extent that the shift completely vanishes for systems composed of two equally bright stars (see discussion in Giesers et al. 2019; Bodensteiner et al. 2021). Hence, it is not surprising that our discovery rate for such systems is low.
Considering photometric binaries, it is likely that some stars on the red main sequence are in fact binary systems composed of a blue main sequence primary and a companion bright enough to shift it on to the red main sequence. Such systems could spuriously inflate our discovery fraction for the red main sequence. However, due to our aforementioned insensitivity to such systems, we do not expect this to be the case.
While we expect incompleteness to affect our discovery fractions for both populations equally, we nevertheless decided to investigate how it impacts our results. To this aim, we created mock observations in the following way. Each star with at least one MUSE radial velocity measurement was assigned a radial velocity from a Gaussian velocity distribution with a dispersion of |$\sigma =5\, {\rm km\, s^{-1}}$| (as expected for NGC 1850). Then it was assumed that a fraction fbinary of the observed stars are in binary systems. Those were assigned a mass ratio m1/m2, a period T, and an inclination i. We assumed a flat distribution of mass ratios in the interval 0.4 < m1/m2 < 0.8, a period distribution which was uniform in log space and covered the range 0.2 < log (T/d) < 3.5, and an isotropic distribution of inclination angles. The distributions adopted for m1/m2 and T are qualitatively similar to those measured for OB stars in the Tarantula nebula (Sana et al. 2013; Dunstall et al. 2015). We sound a note of caution that the binary properties inside star clusters most likely depend on cluster age and stellar spectral type, hence there is no guarantee that the adopted values adequately describe the true properties of the binary population inside NGC 1850. However, observational studies of binarity in young massive star clusters of different ages are still lacking, thus we have chosen to reproduce the binary properties of the ‘closest environment type’ currently available.
After we assigned each observed star a mass m1, using the results from the isochrone comparison described in Section 3, and a random phase offset, we were able to calculate its projected orbital velocities at the times when we performed our measurements. Those were added to the systemic radial velocities. Finally, we created a mock data set by adding the calibrated velocity uncertainties from our true MUSE measurements to the velocities thus created. We then analysed the mock data set as described in Section 3.
For simplicity, we restrict ourselves to two mock simulations representative of the following scenarios. In the first one, we assume a global binary fraction of fbinary = 0.25,3 irrespective of stellar mass or CMD location. In the second simulation, we input a binary fraction of fbinary = 0, except for stars on the blue MS (as defined in Fig. 1), which are all assigned to a binary system (using the same period and mass ratio distributions as described above). The outcome of these two simulations is shown in Fig. 2. Note that we also highlight false positives in Fig. 2, i.e. stars that are spuriously considered to be part of binary systems due to the finite accuracy of our methodology.
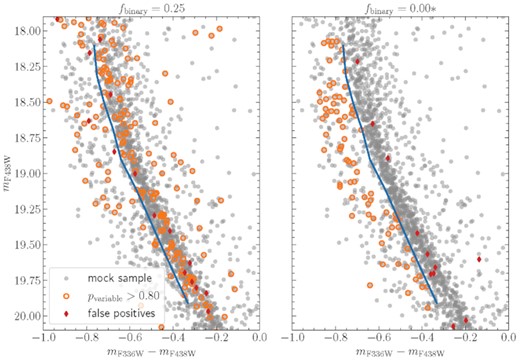
Results from the analysis of mock MUSE data sets for two different assumed binary fractions. Both panels show the stars present in the MUSE sample as grey dots. Stars correctly identified as binary stars in the mock analysis are highlighted as orange circles, while false positives are highlighted as red diamonds. The solid blue line indicates the assumed division between the blue and red main sequences. In the simulation shown in the left-hand panel, we assumed a global binary fraction of |$25\,\mathrm{ per}\,\mathrm{ cent}$| irrespective of CMD position. On the other hand, the right-hand panel shows the outcome of the simulation with a binary fraction that is |$0\,\mathrm{ per}\,\mathrm{ cent}$| everywhere but |$100\,\mathrm{ per}\,\mathrm{ cent}$| for blue main sequence stars.
The outcome of the simulation with a global binary fraction of 0.25 is shown in the left-hand panel of Fig. 2. Applying the same analysis as for the actual data yields recovery fractions of 95/1070 (|$8.9 \pm 0.7\,\mathrm{ per}\,\mathrm{ cent}$|) and 34/367 (|$9.3 \pm 1.3\,\mathrm{ per}\,\mathrm{ cent}$|) for the red and blue sequences. This is slightly higher than the discovery fractions we found for the actual data. On the other hand, in the extreme case shown in right-hand panel of Fig. 2, where every star on the blue sequence is considered as part of a binary system, we obtain discovery fractions of 8/1070 (|$0.7 \pm 0.2\,\mathrm{ per}\,\mathrm{ cent}$|) and 74/367 (|$20.2 \pm 1.8\,\mathrm{ per}\,\mathrm{ cent}$|) for the red and blue sequences, inconsistent with the results derived from the actual data. Note that our simulation is conservative in the sense that the binary systems adopted for stars on the blue MS include orbital periods |$T\gt\, 500\, {\rm d}$|, which are unlikely to break fast spinning stars. In summary, the outcome of these simulations supports the evidence for comparable binary properties among the red and blue MS stars in NGC 1850.
We can use the simulations to estimate the completeness of our binary detection as a function of period. Averaged over all companion masses and inclinations, we find that we detect |$\sim\!{80}\,\mathrm{ per}\,\mathrm{ cent}$| of the binaries on the red main sequence with simulated periods of |$T\lt\, 5\, {\rm d}$|. The efficiency drops to |$\sim\!{60}\,\mathrm{ per}\,\mathrm{ cent}$| for periods of |$10\, {\rm d}$| and |$\sim\!{15}\,\mathrm{ per}\,\mathrm{ cent}$| for periods of |$100\, {\rm d}$|. For blue main sequence stars, the recovery fraction is about |$5\,\mathrm{ per}\,\mathrm{ cent}$| higher for the period range 10 < P/d < 100, a result of the slightly smaller radial velocity uncertainties of the blue main sequence stars (cf. Section 3). Insofar, our simulations also confirm that there are no significant biases in our analysis that would cause us to miss more binaries among blue main sequence stars than among red main sequence stars. Instead, we are slightly biased against detecting red main sequence binaries. Arguably, this only applies if our assumption that binary systems in either main sequence share the same physical properties, in terms of mass ratio, inclination, or period distribution.
5 CONCLUSIONS
The similarity in the binary fractions of the red and blue main sequences is in stark contrast with expectations for the theory that the bimodal rotational distribution is due to braking by binaries. In such a case, we would expect the blue/slow rotators to show a high binary fraction while the red-/fast-rotating population should show a much lower binary frequency. We conclude that the observations of NGC 1850 are inconsistent with the idea that the observed bimodal rotational distribution of stars within clusters is due to binary interactions.
These conclusions are similar to those reached by Kamann et al. (2020) who studied the intermediate-age (∼1.5 Gyr) LMC cluster, NGC 1846. These authors split their sample of eMSTO stars into slow- and fast-rotating subpopulations and used the same method adopted here to estimate the binary fractions of each population. Similar to that found here, the authors report an observed binary fraction of 5.4 ± 1.4 and 7.3 ± 1.5 per cent for the fast- and slow-rotating subsamples of NGC 1846, respectively.
The similarity in the binary fractions amongst slow and rapidly rotating stars, in two massive clusters (with ages of ∼100 Myr and ∼1.5 Gyr) shows that interacting binaries are unlikely to play a dominant role in the origin of the bimodal rotational distribution of stars seen in clusters. Future work on the rotational properties of pre-main sequence stars across a wide stellar mass range will be able to test the alternative theory that the bimodality is present at very young ages, and may be driven by the retention or loss of the protostellar discs around young stars.
ACKNOWLEDGEMENTS
We thank the anonymous referee for a helpful report. SK gratefully acknowledges funding from UKRI in the form of a Future Leaders Fellowship (grant no. MR/T022868/1). SK, NB, and SS gratefully acknowledge financial support from the European Research Council (ERC-CoG-646928, Multi-Pop). NB also recognizes financial support from the Royal Society in the form of a University Research Fellowship. CU acknowledges the support of the Swedish Research Council, Vetenskapsrådet. Based on observations collected at the European Organisation for Astronomical Research in the Southern Hemisphere under ESO programmes 0102.D-0268(A) and 106.216T.001. Based on observations made with the NASA/ESA Hubble Space Telescope and obtained from the Hubble Legacy Archive, which is a collaboration between the Space Telescope Science Institute (STScI/NASA), the Space Telescope European Coordinating Facility (ST-ECF/ESA) and the Canadian Astronomy Data Centre (CADC/NRC/CSA).
DATA AVAILABILITY
The data underlying this article will be shared on reasonable request to the corresponding author.
Footnotes
Note that hard binaries can still be destroyed via stellar evolution, e.g. following common envelope phases or supernova explosions. However, as the division into fast and slow rotators is present among unevolved stars, we can safely ignore such effects.
We note that photometric binaries will not only appear redder, but also brighter compared to single stars. However, as visible in Fig. 1, the adopted approach still enables us to identify most photometric binaries.
The value of fbinary = 0.25 was chosen as a compromise between the high binary fractions observed in young massive clusters and the low values observed in old globular clusters
