


ABSTRACT
We present a detailed spectroscopic analysis of a galaxy at z ≃ 4.88 that is, by chance, magnified ∼30× by gravitational lensing. Only three sources at z ≳ 5 are known with such high magnification. This particular source has been shown to exhibit widespread, high equivalent width |${{\rm C\, \small {IV}}}\ \lambda 1549\, \mathring{\rm A}$| emission, implying it is a unique example of a metal-poor galaxy with a hard radiation field, likely representing the galaxy population responsible for cosmic reionization. Using ultraviolet (UV) nebular line ratio diagnostics, Very Large Telescope (VLT)/X-shooter observations rule out strong active galactic nuclei (AGN) activity, indicating a stellar origin of the hard radiation field instead. We present a new detection of |${[{\rm Ne\, \small {III}}]}\ \lambda 3870\, \mathring{\rm A}$| and use the [|${\rm Ne\, \small {III}}$|]/[|${\rm O\, \small {II}}$|] line ratio to constrain the ionization parameter and gas-phase metallicity. Closely related to the commonly used [|${\rm O\, \small {III}}$|]/[|${\rm O\, \small {II}}$|] ratio, our [|${\rm Ne\, \small {III}}$|]/[|${\rm O\, \small {II}}$|] measurement shows this source is similar to local ‘Green Pea’ galaxies and Lyman-continuum leakers. It furthermore suggests this galaxy is more metal poor than expected from the fundamental metallicity relation, possibly as a consequence of excess gas accretion diluting the metallicity. Finally, we present the highest redshift detection of |${{\rm Mg\, \small {II}}}\ \lambda 2796\, \mathring{\rm A}$|, observed at high equivalent width in emission, in contrast to more evolved systems predominantly exhibiting |${\rm Mg\, \small {II}}$| absorption. Strong |${\rm Mg\, \small {II}}$| emission has been observed in most z ∼ 0 Lyman-continuum leakers known and has recently been proposed as an indirect tracer of escaping ionizing radiation. In conclusion, this strongly lensed galaxy, observed just |$300\, \mathrm{Myr}$| after reionization ends, enables testing of observational diagnostics proposed to constrain the physical properties of distant galaxies in the James Webb Space Telescope (JWST)/Extremely Large Telescope (ELT) era.
1 INTRODUCTION
Space-based observatories such as Hubble Space Telescope (HST) and Spitzer and ground-based |$8\hbox{-}\mathrm{m}$| class telescopes have transformed our view of galaxy evolution in the high-redshift Universe, identifying statistically substantial samples of distant galaxies in deep imaging surveys beyond z > 4 (Madau & Dickinson 2014). At this epoch, covering the first |$\sim \!10{{\ \rm per\ cent}}$| of the current age of the Universe, the physical properties of galaxies were likely to be very different to those today, with metal-poor stellar populations, low stellar masses, and hard radiation fields. These conditions are favourable to strong nebular emission, despite the weak stellar continuum (e.g. Stark 2016). Equally, this suggests the faint galaxy population in the Epoch of Reionization (EoR) can contribute significantly to reionization (e.g. Bouwens et al. 2015).
This picture has mainly emerged from spectroscopic follow-up observations of individual distant sources selected in deep photometric surveys, although this poses several challenges. From the ground, near-infrared (NIR) spectrometers are restricted by Earth’s atmosphere to observe key rest-frame optical emission line features, such as Hα, |${[{\rm O\, \small {III}}]}\ \lambda 5008 \, \mathring{\rm A}$|, and |${[{\rm O\, \small {II}}]}\ \lambda \lambda 3727, 3730 \, \mathring{\rm A}$| (simply [|${\rm O\, \small {II}}$|] hereafter) out to redshifts of about 2.5, 3.6, and 5.2, respectively. The much-anticipated James Webb Space Telescope (JWST) will explore the rest-frame optical spectra of more distant objects (z ∼ 4–12), which will enable the use of many emission line diagnostics that are carefully calibrated with the wealth of data for more nearby galaxies, like the optical classification schemes that distinguish spectra of star-forming galaxies shaped by nebular emission from |${\rm H\, \small {II}}$| regions from those dominated by emission of the narrow-line region of active galactic nuclei (AGN; Baldwin, Phillips & Terlevich 1981, hereafter BPT; Veilleux & Osterbrock 1987).
Meanwhile, several new methods have been explored, which even as JWST is launched will prove valuable in the era of Extremely Large Telescopes [i.e. Extremely Large Telescope (ELT), Giant Magellan Telescope (GMT), and Thirty-Meter Telescope (TMT)]. For example, alternative classification schemes to the BPT classification have been proposed, targeting the rest-frame ultraviolet (UV) instead: these use highly ionized gas lines such as |${{\rm C\, \small {III}}]}\ \lambda 1907 \, \mathring{\rm A}, \ {[{\rm C\, \small {III}}]}\ \lambda 1909 \, \mathring{\rm A}$| (|${\rm C\, \small {III}}$| collectively), |${{\rm C\, \small {IV}}}\ \lambda \lambda 1548, 1551 \, \mathring{\rm A}$| (|${\rm C\, \small {IV}}$|), and |${{\rm He\, \small {II}}}\ \lambda 1640 \, \mathring{\rm A}$| (|${\rm He\, \small {II}}$|) to separate star-forming galaxies from AGN (e.g. Feltre, Charlot & Gutkin 2016). These lines are much brighter in the composite spectra of z ∼ 3 Lyman-break galaxies than observed in the local Universe (e.g. Shapley et al. 2003). Another pressing challenge is to find a reliable method to uncover the sources responsible for reionization by indirectly identifying Lyman-continuum (LyC) leakage in the EoR, where LyC and |${\rm H\, \small {I}}$| Lyman α (Lyα) become inaccessible due to absorption by the neutral intergalactic medium (IGM). Methods aimed at characterizing EoR galaxies, such as the UV classification schemes and indirect proxies of LyC escape, can be tested at (slightly) lower redshift where features are readily observable with current instrumentation, ideally with analogues of high-redshift galaxies.
In this work, we present one such case study, investigating in detail the emission line properties of RCS0224z5, a strongly lensed galaxy at redshift z ≃ 4.88 in the background of the RCS 0224–0002 cluster. RCS 0224–0002, a galaxy cluster at z = 0.773, was discovered in the Red-Sequence Cluster Survey (RCS; Gladders, Yee & Ellingson 2002). Several arc-like structures were found in this study, among which an arc consisting of four images of a gravitationally lensed background galaxy at z ≃ 4.88, identified via its Lyα emission. The magnification of the four images ranges from μ = 1.30 to ∼140, making this only one of three known sources at z ≳ 5 with a comparably high magnification (Franx et al. 1997; Swinbank et al. 2009; Khullar et al. 2021) – and placing this galaxy at less than |$300 \, \mathrm{Myr}$| after the end of reionization. Follow-up observations with Very Large Telescope (VLT)/Multi-Unit Spectroscopic Explorer (MUSE) have furthermore revealed spatially widespread and narrow [full width at half-maximum |$\text{(FWHM)} \simeq 156 \, \mathrm{km\, s^{-1}}$|] |${\rm C\, \small {IV}}$| emission with a high equivalent width (EW) of |$\sim \!10 \, \mathring{\rm A}$| in the rest frame (Smit et al. 2017), similar to what is being observed in an increasing number of z ∼ 6–8 galaxies (Stark et al. 2015; Laporte et al. 2017; Mainali et al. 2017), but rarely seen in the local Universe (Berg et al. 2019a; Senchyna et al. 2019).
We present new VLT/X-shooter observations that constrain the rest-frame UV emission line diagnostics that are inaccessible within the MUSE wavelength range. Unlike sources at higher redshift, where no rest-frame optical features are accessible from the ground, Swinbank et al. (2007) presented widespread [|${\rm O\, \small {II}}$|] detected in the deep Spectrograph for INtegral Field Observations in the Near Infrared (SINFONI) observations. We present the additional detection of |${[{\rm Ne\, \small {III}}]}\ \lambda 3870 \, \mathring{\rm A}$| emission and corresponding new measurement of the [|${\rm Ne\, \small {III}}$|]/[|${\rm O\, \small {II}}$|] line diagnostic to place this system in the context of the local galaxy population, in order to gain insight into the origin of high EW |${\rm C\, \small {IV}}$| emission in the early Universe. Finally, we report the detection of |${{\rm Mg\, \small {II}}}\ \lambda 2796 \, \mathring{\rm A}$| in emission: a remarkable finding, as this is in stark contrast with the local galaxy population, where it is mostly observed in absorption (e.g. Kinney et al. 1993). Being a resonant transition like Lyα, it has the potential to be an indirect tracer of LyC escape (e.g. Henry et al. 2018).
The outline of this paper is as follows. In Section 2, we describe the observations, and in Section 3, we present the results. In Section 4, we discuss the outcomes, and we finally summarize our findings in Section 5. In our analysis, we adopt the cosmological parameters Ωm = 0.3, |$\Omega _\Lambda = 0.7$|, and |$H_0 = 70 \, \mathrm{km \, s^{-1} \, Mpc^{-1}}$| throughout (implying an angular scale of |$6.4 \, \mathrm{kpc\,arcsec}^{-1}$| at z = 4.88), to ease comparison with previous studies. All magnitudes are in the AB system (Oke & Gunn 1983).
2 OBSERVATIONS
2.1 X-shooter spectroscopy
Observations of the lensed image 1 of RCS0224z5, amplified by |$\mu = 29_{-11}^{+9}$| (luminosity-weighted; see Smit et al. 2017), were taken with the VLT/X-shooter (Vernet et al. 2011) on 2018 October 11, 14, and 16 with a total on-source time of |$3.5 \, \mathrm{h}$|, under ESO programme ID 0102.A-0704(A) (PI: Smit); the slit was centred at α = 02:24:33.83, δ = −00:02:17.91 (Fig. 1) and using slit widths of 1.2 and 0.9 arcsec in the visible (VIS) and near-infrared (NIR), resulting in a spectral resolution R ≡ λ/Δλ ≈ 6500 and R ≈ 5600, respectively, in the two arms. Observations were taken with AB nodding with an offset of 3.8 arcsec and individual exposures were |$383 \, \mathrm{s}$| in the VIS and |$230 \, \mathrm{s}$| NIR arm. Observations were taken with an average airmass of 1.14 and seeing of 0.8 arcsec. Data reduction was performed using the standard esoreflex X-shooter pipeline (Freudling et al. 2013). We apply the nodding-mode reduction, as well as stare-mode reduction with a manual algorithm to combine frames from the ‘ABBA’ nodding pattern, depending on which yields the best results; the manual stare-mode reduction is used throughout, except for the |${\rm C\, \small {IV}}$| line. Individual observation blocks (OBs) were separately corrected for telluric absorption in the VIS and NIR arms using molecfit (Kausch et al. 2015; Smette et al. 2015).
![Overview of the observations discussed in Sections 2.1–2.3. Top left: HST false-colour I814, J125, and H160 image of RCS 0224–0002, indicating the lensed galaxy images 1–4 and the field of view (FOV) of the observations covering the arc of RCS0224z5. Top right: [${\rm O\, \small {II}}$] and [${\rm Ne\, \small {III}}$] in both X-shooter and SINFONI spectra. Bottom row: spectra of Lyα, ${\rm C\, \small {IV}}$, and ${\rm Mg\, \small {II}}$ emission lines observed with VLT/X-shooter. An arrow marks a tentative ∼3σ redshifted component of ${\rm C\, \small {IV}}$, see Section 3.1. In two-dimensional X-shooter spectra, the dark–light–dark signature of detected lines is highlighted with coloured ellipses (Section 2.1). Labels indicate the significance of each detection measured in a signal-to-noise ratio (SNR)-optimized aperture (larger for Lyα, smaller for ${\rm C\, \small {IV}}$ and ${\rm Mg\, \small {II}}$), while all one-dimensional spectra shown are extracted from a larger aperture to capture the entire flux as reported in Table 1 (see Section 3.1 for details). The grey filled-in area shows the 1σ uncertainty level. The rest-frame UV continuum fit is shown with a blue line. Velocities are based on the corresponding systemic redshift of [${\rm O\, \small {II}}$] (Section 3) and are centred on the brightest line for doublets.](https://oup.silverchair-cdn.com/oup/backfile/Content_public/Journal/mnras/508/2/10.1093_mnras_stab2591/2/m_stab2591fig1.jpeg?Expires=1750183031&Signature=amjeLTmtT3kVH~9OD~i-JjCNwWkngbvFiOpMEi5RtkkoiUQpczEJTW1z2SuLjdZBUNmv8wHCIm1mNZhuUgwEt~V4pa-l9CUziywfykaKaVzcRPZCHMI66aYKsxHi~MpqaZKz2L9BgQORF32K-ZXnu4XwwBrsstIr1IjnCM3M7WnLbG1VLYWVQkJoRY3kyfKT7sHQeuLxD-jihQmoVJghbzgcexFfJbxGB3sM-JO7lmIDGRh~SCrxRJgxVQNw8MJFLrpN63n0Sib9VU9qrZr2xzq-BRCZw0N8t6RaHRJi1xCt~7QwMasBfQum1Z6P6lbdzFAlPY9EQGZV7E96lbvKPA__&Key-Pair-Id=APKAIE5G5CRDK6RD3PGA)
Overview of the observations discussed in Sections 2.1–2.3. Top left: HST false-colour I814, J125, and H160 image of RCS 0224–0002, indicating the lensed galaxy images 1–4 and the field of view (FOV) of the observations covering the arc of RCS0224z5. Top right: [|${\rm O\, \small {II}}$|] and [|${\rm Ne\, \small {III}}$|] in both X-shooter and SINFONI spectra. Bottom row: spectra of Lyα, |${\rm C\, \small {IV}}$|, and |${\rm Mg\, \small {II}}$| emission lines observed with VLT/X-shooter. An arrow marks a tentative ∼3σ redshifted component of |${\rm C\, \small {IV}}$|, see Section 3.1. In two-dimensional X-shooter spectra, the dark–light–dark signature of detected lines is highlighted with coloured ellipses (Section 2.1). Labels indicate the significance of each detection measured in a signal-to-noise ratio (SNR)-optimized aperture (larger for Lyα, smaller for |${\rm C\, \small {IV}}$| and |${\rm Mg\, \small {II}}$|), while all one-dimensional spectra shown are extracted from a larger aperture to capture the entire flux as reported in Table 1 (see Section 3.1 for details). The grey filled-in area shows the 1σ uncertainty level. The rest-frame UV continuum fit is shown with a blue line. Velocities are based on the corresponding systemic redshift of [|${\rm O\, \small {II}}$|] (Section 3) and are centred on the brightest line for doublets.
2.2 SINFONI spectroscopy
Reduction of the Spectrograph for INtegral Field Observations in the Near Infrared (SINFONI) integral field unit (IFU) spectroscopy is described in Swinbank et al. (2007). In short, IFU spectroscopy was performed for a total of |$12 \, \mathrm{h}$| on source with VLT/SINFONI (Eisenhauer et al. 2003; Bonnet et al. 2004) under ESO programme ID 075.B-0636(B). The data were taken in the HK grating, resulting in a spectral resolution of R ≈ 1700, with a |$\sim \!8 \times 8 \, \mathrm{arcsec^2}$| field of view (FOV; at a spatial sampling of |$0.25 \, \mathrm{arcsec\,pixel}^{-1}$|), covering the lensed images 2 and 3 of RCS0224z5 (luminosity-weighted amplifications of |$\mu = 21_{-8}^{+12}$| and |$\mu = 138_{-74}^{+7}$|, respectively; Smit et al. 2017). Lensed image 3 has a particularly high amplification (and corresponding uncertainty), as the arc crosses the lensing critical curve. We note that the source plane image of the galaxy is fully recovered by lensed image 1, but only partially in images 2 and 3: out of the two clumps seen in image 1, the one in north-east is not reproduced in 2 and 3 (see Smit et al. 2017, for details).
2.3 HST imaging
HST imaging of RCS 0224–0002 is available on the Space Telescope Science Institute data archive1 (GO 14497, PI: Smit; see Smit et al. 2017). Observations were performed with the Advanced Camera for Surveys (ACS) using the F814W (I814) filter (|$2.2 \, \mathrm{ks}$| exposure), and with the Wide Field Camera 3 (WFC3) using the F125W (J125) and F160W (H160) filters (both |$2.6 \, \mathrm{ks}$| exposures). The resulting images reach a depth of |$26.3 $|, |$26.8 $|, and |$26.7 \, \mathrm{mag}$| in the I814, J125, and H160 bands (5σ for a 0.5-arcsec-diameter aperture). A false-colour image of these three bands is shown in the bottom left of Fig. 1.
3 RESULTS
In this study, we are mainly interested in line diagnostics using Lyα, |${\rm C\, \small {IV}}$|, |${\rm He\, \small {II}}$|, |${\rm C\, \small {III}}$| doublet, |${{\rm Mg\, \small {II}}}\ \lambda 2796, 2804 \, \mathring{\rm A}$| (|${\rm Mg\, \small {II}}$|), [|${\rm O\, \small {II}}$|], and |${[{\rm Ne\, \small {III}}]}\ \lambda 3870 \, \mathring{\rm A}$| ([|${\rm Ne\, \small {III}}$|]).2 The measured velocity offsets, line fluxes, and rest-frame EWs (or upper limits) of these lines presented in Fig. 1 are summarized in Table 1. In the following paragraphs, we will discuss the results for the X-shooter and SINFONI data sets individually.
Overview of the observed emission lines in the X-shooter and SINFONI spectra. For non-detections, upper limits are given (see Section 3.1 for details).
| Instrument | Image(s)a | Feature | |$\lambda _\text{vac} \, (\mathring{\rm A})^b$| | |$\Delta v \, (\mathrm{km\, s^{-1}})^c$| | |$\mathrm{Flux} \, (10^{-18} \, \mathrm{erg \, s^{-1} \, cm^{-2}})^d$| | |$\mathrm{EW} \, (\mathring{\rm A})^e$| |
|---|---|---|---|---|---|---|
| X-shooter | 1 | Lyα | 1215.67 | 156 ± 52 | 440.4 ± 5.9 | 143.3 ± 12.9 |
| |${\rm C\, \small {IV}}$| | 1548.19 | 104 ± 53 | 12.7 ± 3.1 | 11.9 ± 3.2 | ||
| |${\rm C\, \small {IV}}$| | 1550.77 | 104 ± 53 | 6.18 ± 3.48 | 5.78 ± 3.34 | ||
| |${\rm He\, \small {II}}$| | 1640.42 | … | <6.11 | <6.21 | ||
| [|${\rm C\, \small {III}}$|] | 1906.68 | … | <26.7 | <35.2 | ||
| |${\rm C\, \small {III}}$|] | 1908.73 | … | <46.0f | <25.4f | ||
| |${\rm Mg\, \small {II}}$| | 2796.35 | 52 ± 54 | 5.00 ± 1.49 | 16.2 ± 5.1 | ||
| SINFONI | 2 and 3 | [|${\rm O\, \small {II}}$|] | 3727.09 | 0 ± 13 | 60.5 ± 4.5 | … |
| [|${\rm O\, \small {II}}$|] | 3729.88 | 0 ± 13 | 71.4 ± 4.5 | … | ||
| [|${\rm Ne\, \small {III}}$|] | 3869.85 | 0 ± 13 | 60.4 ± 12.6 | … |
Lensed image(s) from which the spectroscopic measurements were taken (see Sections 2.1 and 2.2 for details).
Vacuum rest-frame wavelength.
Velocity offset with respect to the systemic redshift as measured by the relevant instrument (X-shooter: zsys = 4.8737; SINFONI: zsys = 4.8754). Uncertainty in the velocity offsets includes the uncertainty in determining the systemic redshift (see Section 3).
Observed fluxes, uncorrected for the lensing magnification factor of |$\mu = 29_{-11}^{+9}$| of image 1, observed by X-shooter (Section 2.1), and |$\mu = 21_{-8}^{+12}$| and |$\mu = 138_{-74}^{+7}$| of image 2 and 3, respectively, observed collectively by SINFONI (Section 2.2).
Rest-frame equivalent width (EW; positive values indicating a feature is observed in emission). Note that EWs are independent of lensing magnification.
Upper limits inferred under the assumption of a minimum ratio of F1907/F1909 ≈ 1.39 for |$n_\mathrm{ e} \le 10^3 \, \mathrm{cm^{-3}}$| (see Section 3.1).
We derive the systemic redshift from the |${[{\rm O\, \small {II}}]}\ \lambda \lambda 3727, 3730 \, \mathring{\rm A}$| doublet in combination with the |${[{\rm Ne\, \small {III}}]}\ \lambda 3870 \, \mathring{\rm A}$| line for increased precision; for X-shooter, this is measured to be zsys = 4.8737 ± 0.0010 (uncorrected for a negligible barycentric velocity of 5–|$7 \, \mathrm{km\, s^{-1}}$|), while for SINFONI it is zsys = 4.8754 ± 0.0003 (again not corrected for a barycentric velocity of up to |$27 \, \mathrm{km\, s^{-1}}$| or Δz = 0.0005, but consistent with |$z_{[{\rm O\, \small {II}}]}= 4.8757 \pm 0.0005$| measured by Swinbank et al. 2007), leaving a difference of Δz = 0.0017. In both cases, we simultaneously fit the [|${\rm O\, \small {II}}$|] and [|${\rm Ne\, \small {III}}$|] lines while fixing the [|${\rm O\, \small {II}}$|] line ratio, due to limited spectral resolution and signal-to-noise ratio (SNR). We adopt a ratio of F3730/F3727 = 1.18, the median of z ∼ 2.3 star-forming galaxies reported by Sanders et al. (2016), corresponding to an electron density |$\sim \!10^2 \, \mathrm{cm^{-3}}$|. Importantly, the [|${\rm O\, \small {II}}$|] flux, and hence the [|${\rm Ne\, \small {III}}$|]/[|${\rm O\, \small {II}}$|] line ratio, are practically invariant when fitting with a freely varying [|${\rm O\, \small {II}}$|] line ratio. For X-shooter, the fit was performed on spectra rebinned to |$150$| and |$75 \, \mathrm{km\, s^{-1}}$| for [|${\rm O\, \small {II}}$|] and [|${\rm Ne\, \small {III}}$|], respectively, using the intrinsic line widths obtained from the fit to the SINFONI spectrum. The ∼2σ discrepancy between the systemic redshifts determined by X-shooter and SINFONI, equivalent to |$88 \pm 52 \, \mathrm{km\, s^{-1}}$|, may be a calibration problem (exceeding barycentric velocity corrections); or, given that the two spectra probe different images (see Fig. 1), the velocity difference can be a consequence of real kinematic differences between the two components. In the following, we measure offsets from the systemic redshift using the consistent measurement in the same image, and by the same instrument. We include the uncertainty in determining the systemic redshift (i.e. |$52 \, \mathrm{km\, s^{-1}}$| for X-shooter) in the uncertainty on all velocity offsets.
For all line flux measurements, we fit Gaussian profiles to the one-dimensional spectra. The uncertainty is estimated by scaling the flux uncertainty of a single spectral channel, |$F_\lambda \, \Delta \lambda$|, by the square root of the number of spectral bins where line flux is detected (coloured channels in Fig. 1).
3.1 X-shooter
The relevant X-shooter data are presented in the bottom row of Fig. 1, which shows one-dimensional spectra extracted from a 2.4 arcsec aperture for all lines except Lyα, where we use a 3.2 arcsec aperture. These spectra are used to measure the velocity offsets and total fluxes (Table 1). The annotated labels show the SNR measured in a smaller 1.4 arcsec aperture, again except for Lyα where the extended aperture yields a higher SNR. We detect strong Lyα emission (at ∼80σ in a 3.2 arcsec aperture or ∼50σ in a 1.4 arcsec aperture; in the 1.4 arcsec aperture, the Lyα EW decreases to |$78 \, \mathring{\rm A}$|), as well as the |${\rm C\, \small {IV}}$| doublet, at 8.4σ and 4.4σ. Finally, we detect the |${{\rm Mg\, \small {II}}}\ \lambda 2796 \, \mathring{\rm A}$| line at 5.2σ (see Appendix A for more details on the significance of this detection). This makes RCS0224z5 the highest redshift galaxy for which |${\rm Mg\, \small {II}}$| emission has been detected. After Lyα, the |${{\rm Mg\, \small {II}}}\ \lambda 2796 \, \mathring{\rm A}$| line has the highest EW out of all emission features detected in the rest-frame UV, even though the other line of the doublet, |${{\rm Mg\, \small {II}}}\ \lambda 2804 \, \mathring{\rm A}$|, is undetected due to skylines. We show the expected signal for |${{\rm Mg\, \small {II}}}\ \lambda 2804 \, \mathring{\rm A}$| in Fig. 1 assuming a typical flux ratio of F2796/F2804 ≈ 1.9 between the |${{\rm Mg\, \small {II}}}$| lines at |$2796$| and |$2804 \, \mathring{\rm A}$| (e.g. Henry et al. 2018), which is indeed below the estimated uncertainty level.
The blue line in the |${\rm C\, \small {IV}}$| doublet, |${{\rm C\, \small {IV}}}\ \lambda 1551 \, \mathring{\rm A}$|, appears to have a weak second redshifted component (∼3σ), although the negative signature in the two-dimensional spectrum seems mostly absent, which is why we do not include it in our analysis. At the current sensitivity and spectral resolution, we cannot confidently explain the nature of this feature; however, note that if this emission feature is included in the |${\rm C\, \small {IV}}$| flux and EW, this would not affect our conclusions in Section 4.1 regarding the origin of highly ionized emission.
With X-shooter, we detect the [|${\rm O\, \small {II}}$|] doublet and [|${\rm Ne\, \small {III}}$|] at 2.2σ and 1.8σ by rebinning to |$150 $| and |$75 \, \mathrm{km\, s^{-1}}$|, respectively (both in a 1.4 arcsec aperture to maximize SNR). In our analysis, however, we will adopt the measurements of SINFONI at higher significance (see Section 3.2). Furthermore, as shown in Table 1, we obtain upper limits on emission from the |${\rm He\, \small {II}}$| line and the |${\rm C\, \small {III}}$| doublet. Since both lines of the |${\rm C\, \small {III}}$| doublet fall directly on skylines, instead of a 2σ limit from the noise as for |${\rm He\, \small {II}}$|, we take the integrated flux measured within |${-}100 \lt v \lt 100 \, \mathrm{km\, s^{-1}}$| of the expected line centre of the |$1907 \, \mathring{\rm A}$| line (which is slightly less affected by telluric absorption and skylines; see also Appendix A). We obtain an upper limit for the total flux of the doublet using the lowest physically attainable value of F1907/F1909 ≈ 1.39 for |$n_\mathrm{ e} \le 10^3 \, \mathrm{cm^{-3}}$| (Kewley et al. 2019). If we take a ratio of ∼0.34 for |$n_\mathrm{ e} \le 10^5 \, \mathrm{cm^{-3}}$|, the resulting |${\rm C\, \small {IV}}$|/|${\rm C\, \small {III}}$| ratio we measure shifts by |$0.36 \, \mathrm{dex}$|, leaving our findings unaffected (Section 4.1). The |${{\rm O\, \small {III}}]}\ \lambda \lambda 1661, 1666 \, \mathring{\rm A}$| doublet also remains undetected: the brightest line of the two, at |$1666 \, \mathring{\rm A}$|, falls on a skyline, and the second line at |$1661 \, \mathring{\rm A}$| is too faint to provide useful upper limits on the doublet.
By rebinning to a lower spectral resolution (in bins of |$\Delta \lambda _\text{obs} = 200 \, \mathring{\rm A}$|, masking skylines prior to rebinning), we detect the rest-frame UV continuum and assuming Fλ∝λβ, we measure a UV-continuum slope β = −2.36 ± 0.28, in good agreement with β = −2.19 ± 0.14 as measured from the HST J125 − H160 colour (Smit et al. 2017). This continuum fit is shown in all X-shooter spectra in Fig. 1 with a blue line. Using this fit, we deduce the EWs (or upper limits thereof) of observed lines.
3.2 SINFONI
In addition to the previously reported observation of the [|${\rm O\, \small {II}}$|] doublet with SINFONI ([|${\rm O\, \small {II}}$|]; Swinbank et al. 2007), at 13.5σ and 15.9σ, respectively, we present a new 4.8σ detection of the [|${\rm Ne\, \small {III}}$|] line (see Fig. 1), the highest redshift detection of this line to date. The [|${\rm Ne\, \small {III}}$|] feature is not confidently detected with X-shooter, likely due to the shorter exposure time (|$3.5 \, \mathrm{h}$| versus |$12 \, \mathrm{h}$|).
Conversely, even though the SINFONI observations cover the wavelength of |${\rm Mg\, \small {II}}$|, it was not detected due to the lower spectral resolution of SINFONI (R ≈ 1700 or |$\Delta \lambda _\text{obs} \approx 10 \, \mathring{\rm A}$| at the observed wavelength of |${\rm Mg\, \small {II}}$|, |$16\,426 \, \mathring{\rm A}$|) blending the signal with the strong skyline feature at |$16\,435 \, \mathring{\rm A}$|.
4 DISCUSSION
4.1 |${\rm C\, \small {IV}}$|: driven by star formation or AGN activity?
The high EW emission of |${\rm C\, \small {IV}}$| observed in RCS0224z5 (|$\sim \!20 \, \mathring{\rm A}$|) suggests the presence of a source producing ionizing photons above the ionization potential of |${\rm C\, \small {III}}$|, |$47.9 \, \mathrm{eV}$| (e.g. Berg et al. 2019b), as well as a high production efficiency of LyC photons, ξion (e.g. Stark et al. 2015). In determining the origin of such ionizing radiation – star formation (SF) or AGN activity – comparisons between observations and predictions from photoionization models (e.g. cloudy, see Ferland et al. 2013; mappings, see Dopita et al. 2013) are now widely used (e.g. Kewley et al. 2001; Feltre et al. 2016; Gutkin et al. 2016; Maiolino & Mannucci 2019).
Fig. 2 examines the origin of the hard radiation field in RCS0224z5 with our constraints on the rest-frame UV line fluxes. The top panel of Fig. 2 shows the |${\rm C\, \small {IV}}$|/|${\rm C\, \small {III}}$| and |${\rm C\, \small {IV}}$|/|${\rm He\, \small {II}}$| line ratios (a SF versus AGN diagnostic proposed by Feltre et al. 2016). We place lower limits on both ratios using the |${\rm C\, \small {IV}}$| detection and upper limits on |${\rm C\, \small {III}}$| and |${\rm He\, \small {II}}$|. For comparison we show grids and lines for modelled nebular emission and narrow-line region AGN emission coloured according to their metallicity (see legend; assuming a solar metallicity of Z = 0.01524; Bressan et al. 2012). The SF models are from Gutkin et al. (2016), which are based on the latest version of the Bruzual & Charlot (2003) stellar population synthesis models, while the AGN models are drawn from Feltre et al. (2016). All models have a fixed hydrogen density (nH; in this case |$10^3 \, \mathrm{cm^{-3}}$| for AGN and |$10^2 \, \mathrm{cm^{-3}}$| for SF models) and dust-to-heavy-element mass ratio (here, ξd = 0.3). The SF models are shown for different values of ionization parameter U, log10U ∈ { − 4, −3, −2, −1}, while the grids of narrow-line region AGN emission shown also have a varying α (ranging from −2.0 to −1.2), the power-law index of the specific luminosity Sν ∝ να at rest-frame UV wavelengths, |$\lambda _\text{emit} \le 2500 \, \mathring{\rm A}$|. We note that the results do not change significantly under different combinations of parameters nH, ξd. The same is true for our assumption about the maximum electron density to establish the |${\rm C\, \small {III}}$| doublet flux (see Section 3.1), as shown by the light grey measurement (reflecting a maximum of |$n_\mathrm{ e} \le 10^5 \, \mathrm{cm^{-3}}$| instead of |$10^3 \, \mathrm{cm^{-3}}$|; see Section 3.1).
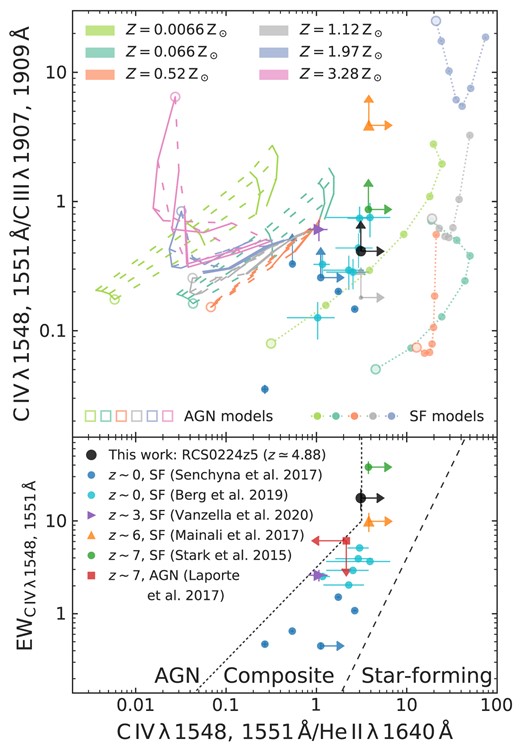
Top panel: line ratio of |${\rm C\, \small {IV}}$|/|${\rm C\, \small {III}}$| versus |${\rm C\, \small {IV}}$|/|${\rm He\, \small {II}}$|. The photoionization models show predictions for nebular emission (indicated as star forming or SF; models from Gutkin, Charlot & Bruzual 2016) and narrow-line region AGN emission (models from Feltre et al. 2016); for both, see the description in the text for details. The black and grey measurements show upper limits on the line ratios for RCS0224z5 assuming a maximum electron density of |$n_\mathrm{ e} \le 10^3 $| and |$10^5 \, \mathrm{cm^{-3}}$|, respectively (shifting the ratio by |$0.36 \, \mathrm{dex}$|, see Section 3.1), both strongly rejecting AGN model predictions. Bottom panel: a UV diagnostic comparison of the rest-frame EW of |${\rm C\, \small {IV}}$| with the |${\rm C\, \small {IV}}$|/|${\rm C\, \small {III}}$| ratio (from Hirschmann et al. 2019). This figure shows RCS0224z5 in comparison to several other extreme line emission galaxies (coloured data points, labelled in the bottom panel’s legend): star forming, high-redshift analogues in the local Universe (see text for details Senchyna et al. 2017; Berg et al. 2019a), a LyC-emitting galaxy at z ∼ 3 (Vanzella et al. 2020), two galaxies at z ∼ 6 and 7 shown to be star forming (Stark et al. 2015; Mainali et al. 2017), and a z ∼ 7 galaxy likely dominated by an AGN (Laporte et al. 2017). From these diagnostics, we conclude that there is no strong AGN activity present in RCS0224z5 and the emission is likely produced in star-forming |${\rm H\, \small {II}}$| regions. Additionally, high-redshift galaxies exhibit |${\rm C\, \small {IV}}$| EWs that are markedly higher than in any local analogues.
A confirmed LyC-emitting galaxy at z ≃ 3.21, Ion2, is shown for comparison (de Barros et al. 2016; Vanzella et al. 2016, 2020); interestingly, its line ratios indicate a composite nature even though its spectral features in the UV have been attributed to young, massive stars (Vanzella et al. 2020). Also shown are two additional galaxies, at redshifts 6.11 (Stark et al. 2015) and 7.045 (Mainali et al. 2017) that are presumably similar to RCS0224z5, with low mass and a hard ionizing radiation field found to be more likely originating from a metal-poor stellar population instead of an AGN. For these galaxies, and for RCS0224z5, the 2σ upper limits strongly reject all possibilities of pure AGN models.
The photoionization models by Gutkin et al. (2016) and Feltre et al. (2016) are coupled to cosmological simulations by Hirschmann et al. (2019) to design BPT-like UV diagnostics to differentiate star-forming galaxies from AGN. These diagnostics are specifically designed to provide an accurate classification over a wide range of redshifts (0 < z ≲ 6). Their diagnostic mapping the EW of |${\rm C\, \small {IV}}$| against the |${\rm C\, \small {IV}}$|/|${\rm He\, \small {II}}$| ratio is shown in the bottom panel of Fig. 2. We compare our measurement with local star-forming galaxies with extreme emission lines that can therefore be seen as analogues of high-redshift galaxies: a sample selected through |${{\rm He\, \small {II}}}\ \lambda 4687 \, \mathring{\rm A}$| emission (implying a hard ionizing spectrum; see Senchyna et al. 2017), and a sample of galaxies selected for high-EW |${[{\rm O\, \small {III}}]}\ \lambda 5008 \, \mathring{\rm A}$| emission (among other criteria; Berg et al. 2019a). We show the high-redshift star-forming galaxies mentioned above and, in contrast, a z = 7.149 galaxy showing evidence for AGN activity (Laporte et al. 2017). The constraints on these high-redshift galaxies are in agreement with, respectively, the star formation and AGN models. However, there is a noticeable difference in their line ratios relative to the combined sample of low-redshift ‘analogues’.
From these diagnostics, we conclude that there is no strong AGN activity present in RCS0224z5 and the emission is likely produced in |${\rm H\, \small {II}}$| regions. This finding agrees with Smit et al. (2017), who concluded that the |${\rm C\, \small {IV}}$| emission is likely nebular in origin, based on the ‘clumpy’ |${\rm C\, \small {IV}}$| morphology (as opposed to centrally concentrated emission). Instead, a young (1–|$3 \, \mathrm{Myr}$|), metal-poor stellar population likely has to account for the hard radiation field required for the |${\rm C\, \small {IV}}$| emission, providing a considerable contribution of photons reaching energies of at least |$47.9 \, \mathrm{eV}$|. This fits into the picture of the prevalence of extreme line emitters in the early Universe – both more common and more extreme than any known local analogues – and accompanying hard radiation fields that has emerged recently (e.g. Smit et al. 2014, 2015; Stark et al. 2015; Mainali et al. 2017; Hutchison et al. 2019).
4.2 The [|${\rm Ne\, \small {III}}$|]/[|${\rm O\, \small {II}}$|] line ratio as an ionization and metallicity diagnostic alternative to [|${\rm O\, \small {III}}$|]/[|${\rm O\, \small {II}}$|]
Neon is an α element, produced by heavy stars (|$M \gtrsim 8 \, \mathrm{M_\odot }$|) in their carbon burning cycle and ultimately Type II supernovae, and therefore tightly matches oxygen in abundance (Maiolino & Mannucci 2019, and references therein). Moreover, [|${\rm Ne\, \small {III}}$|] and its isoelectronic equivalent |${[{\rm O\, \small {III}}]}\ \lambda 5008 \, \mathring{\rm A}$| ([|${\rm O\, \small {III}}$|]) have a similarly high ionization potential (41.0 and |$35.1 \, \mathrm{eV}$|, respectively), meaning the luminosity ratio of [|${\rm Ne\, \small {III}}$|] and the low-ionization |${[{\rm O\, \small {II}}]}\ \lambda \lambda 3727, 3730 \, \mathring{\rm A}$| doublet ([|${\rm O\, \small {II}}$|]) is a powerful diagnostic of the ionization parameter, similar to [|${\rm O\, \small {III}}$|]/[|${\rm O\, \small {II}}$|] (Pérez-Montero et al. 2007; Levesque & Richardson 2014; Maiolino & Mannucci 2019). The observed relationship between metallicity and ionization parameter also makes it a metallicity diagnostic, albeit indirectly (causing it to exhibit a significant amount of scatter; see Nagao, Maiolino & Marconi 2006; Maiolino et al. 2008): metal-poor systems are expected to have a high [|${\rm Ne\, \small {III}}$|]/[|${\rm O\, \small {II}}$|] ratio.
The fact that [|${\rm Ne\, \small {III}}$|] and [|${\rm O\, \small {II}}$|] have both similar and short wavelengths gives the [|${\rm Ne\, \small {III}}$|]/[|${\rm O\, \small {II}}$|] diagnostic two distinct advantages over the widely used [|${\rm O\, \small {III}}$|]/[|${\rm O\, \small {II}}$|] ratio: it is practically insensitive to dust attenuation, and it can be detected at higher redshifts with ground-based near-infrared instruments (Levesque & Richardson 2014). The former has long been exploited (e.g. Hicks et al. 2002), and indeed, [|${\rm Ne\, \small {III}}$|] has been detected several times at z ≳ 3, in combination with [|${\rm O\, \small {II}}$|]: in particular, we will consider here the galaxies Ion2 at z ≃ 3.21, a confirmed LyC-emitting galaxy (as discussed in Section 4.1; de Barros et al. 2016; Vanzella et al. 2016, 2020), SMACS J2031.8−4036 at z ≃ 3.51 (Christensen et al. 2012a,b; Patrício et al. 2016), GOODSN-17940 at z ≃ 4.41 (Shapley et al. 2017), and LnA1689-2 at z ≃ 4.87 (Troncoso et al. 2014).
4.2.1 [Ne iii]/[O ii] evolution over stellar mass and cosmic time
The emission line ratio |${[{\rm Ne\, \small {III}}]}/{[{\rm O\, \small {II}}]}= 0.46 \pm 0.10$| for RCS0224z5 is shown as a function of stellar mass in Fig. 3. To find the stellar mass for images 2 and 3 independent of magnification uncertainties, we follow the derivation of Swinbank et al. (2007), who reported a dynamical mass estimate of |$M_\text{dyn} \sim 10^{10} \, \mathrm{M}_\odot$| based on the [|${\rm O\, \small {II}}$|] velocity dispersion (via equation 1 in Erb et al. 2006). We assume a fiducial C = 3 ± 2 (with high uncertainty to reflect the range of possible values depending on mass distribution and velocity field; see Erb et al. 2006), and our measured [|${\rm O\, \small {II}}$|] line width of |$\sigma _{[{\rm O\, \small {II}}]}= 151 \pm 30 \, \mathrm{km\, s^{-1}}$| within |$r = 2 \, \mathrm{kpc}$| (following Swinbank et al. 2007). We then take the typical stellar mass fraction of z ∼ 1–2 star-forming galaxies of |$27 \pm 5{{\ \rm per\ cent}}$|, reflecting the range 22–|$32{{\ \rm per\ cent}}$| reported by Stott et al. (2016, see also Wuyts et al. 2016), to derive a stellar mass of |$(9 \pm 7) \times 10^{9} \, \mathrm{M}_\odot$|. We note that with HST photometry of image 1 (high magnification uncertainties prevent us from using the incomplete images 2 and 3), we derive a stellar mass of |$4_{-3}^{+14} \times 10^8 \, \mathrm{M_\odot }$|, using the fast code (Kriek et al. 2009), assuming a constant star formation rate (SFR), a Chabrier (2003) initial mass function (IMF), a minimum age of |$10^7 \, \mathrm{yr}$| (the maximum age equal to the age of the Universe at z = 4.88), a Small Magellanic Cloud (SMC) dust law, the Bruzual & Charlot (2003) stellar libraries, and a metallicity of |$Z = 0.2 \, \mathrm{Z_\odot }$|. This estimate is marginally lower, but consistent within the uncertainty of the stellar mass obtained from the dynamical mass estimate.
![[${\rm Ne\, \small {III}}$]/[${\rm O\, \small {II}}$] ratio of selected SDSS galaxies in bins of stellar mass (star-forming galaxies in blue, Seyfert in purple), as well as measurements of local LyC leakers (Izotov et al. 2016a,b, 2018a,b; Gazagnes et al. 2020; Guseva et al. 2020). Binned samples at z = 2.3 and z = 3.3 from the MOSDEF survey (Sanders et al. 2021) and the LyC-leaking galaxy Ion2 at z ≃ 3.21 (Vanzella et al. 2020) are shown as a reference at intermediate redshift. At the very highest redshift for which measurements of [${\rm Ne\, \small {III}}$]/[${\rm O\, \small {II}}$] are currently possible, we include three star-forming galaxies, at z ≃ 3.51, z ≃ 4.41, and z ≃ 4.87 (respectively see text of Christensen et al. 2012a; Shapley et al. 2017; and Troncoso et al. 2014), and RCS0224z5. A tentative trend emerges, spanning nearly two orders of magnitude in the [${\rm Ne\, \small {III}}$]/[${\rm O\, \small {II}}$] ratio. Star-forming galaxies at z ∼ 0 have a ratio of ∼0.01 (with little scatter), whereas the ratio is significantly increased at higher redshift, ∼0.1 at z ∼ 2–3. The trend culminates at z ∼ 5: the ratio of RCS0224z5 (∼0.6), seemingly typical based on this trend, is comparable to that of local LyC leakers, which are clear outliers compared to the general z ∼ 0 galaxy population.](https://oup.silverchair-cdn.com/oup/backfile/Content_public/Journal/mnras/508/2/10.1093_mnras_stab2591/2/m_stab2591fig3.jpeg?Expires=1750183031&Signature=t72UfWKl-ligAV1sLctYf4jOexyS0IG3~cj44IqAyQ9765cdnIMJQXXQ3rwwWFYyjv3Du7FT2nLRyVgfLfL~i94As2J0oV79f3CM9fbuESKoIhir2OsAL2Fc9Meag-GBFi0cCGOWkYem0E8hqZXCcfwS9HCJ~5vDyxUBN~DSqIvd9IxCTrJQFgx513KkFxjec2qz4ru3WbVkGtEvOoIKJhVE2EZQk8RkQbwMkTG27D13b59td0hGAvmSE3JIS3cRUCPv5KTZ6V05jnAMHm7lxai5XkWIv~JsxWPX8x92hyYtclG-q7FeN6KlChbBRhoQKvgDS~K0Hk7~-bTouG70Lg__&Key-Pair-Id=APKAIE5G5CRDK6RD3PGA)
[|${\rm Ne\, \small {III}}$|]/[|${\rm O\, \small {II}}$|] ratio of selected SDSS galaxies in bins of stellar mass (star-forming galaxies in blue, Seyfert in purple), as well as measurements of local LyC leakers (Izotov et al. 2016a,b, 2018a,b; Gazagnes et al. 2020; Guseva et al. 2020). Binned samples at z = 2.3 and z = 3.3 from the MOSDEF survey (Sanders et al. 2021) and the LyC-leaking galaxy Ion2 at z ≃ 3.21 (Vanzella et al. 2020) are shown as a reference at intermediate redshift. At the very highest redshift for which measurements of [|${\rm Ne\, \small {III}}$|]/[|${\rm O\, \small {II}}$|] are currently possible, we include three star-forming galaxies, at z ≃ 3.51, z ≃ 4.41, and z ≃ 4.87 (respectively see text of Christensen et al. 2012a; Shapley et al. 2017; and Troncoso et al. 2014), and RCS0224z5. A tentative trend emerges, spanning nearly two orders of magnitude in the [|${\rm Ne\, \small {III}}$|]/[|${\rm O\, \small {II}}$|] ratio. Star-forming galaxies at z ∼ 0 have a ratio of ∼0.01 (with little scatter), whereas the ratio is significantly increased at higher redshift, ∼0.1 at z ∼ 2–3. The trend culminates at z ∼ 5: the ratio of RCS0224z5 (∼0.6), seemingly typical based on this trend, is comparable to that of local LyC leakers, which are clear outliers compared to the general z ∼ 0 galaxy population.
Furthermore, the |$\mathrm{SFR}_{[{\rm O\, \small {II}}]}$| of |$12 \pm 2 \, \mathrm{M_\odot \, yr^{-1}}$| measured for image 2 and 3 by Swinbank et al. (2007) – combined with the stellar mass estimated from the dynamical mass – places RCS0224z5 just under on the main sequence at its redshift (e.g. Salmon et al. 2015; a lower stellar mass, as suggested by the spectral energy distribution (SED) modelling, would shift it on to the main sequence). This supports the hypothesis that RCS0224z5 is a typical z ∼ 5 star-forming galaxy.
To put our measurements of the near-UV [|${\rm Ne\, \small {III}}$|] and [|${\rm O\, \small {II}}$|] lines into perspective, we turn to a large observational sample of nearby galaxies from the Sloan Digital Sky Survey Data Release 7 (SDSS DR7; Abazajian et al. 2009), retrieving line fluxes from the Max Planck Institute for Astrophysics (MPA)–Johns Hopkins University (JHU) emission line catalogue for 827 640 unique sources.3 A detailed description of the selection procedure for the galaxies used here is given in Appendix B. The [|${\rm Ne\, \small {III}}$|]/[|${\rm O\, \small {II}}$|] ratio of these nearby galaxies is shown in bins of stellar mass (for bins with at least 25 galaxies), for the two main classes (star forming and Seyfert; see Appendix B). Additionally, we compare these to local LyC-leaking galaxies; in particular, we will consider a sample compiled from Izotov et al. (2016a,b, 2018a,b), Gazagnes et al. (2020), and Guseva et al. (2020), together simply the ‘Izotov et al. sample’ hereafter. Finally, individual measurements of the aforementioned high-redshift galaxies at z ≃ 3.21, 3.51, 4.41, and 4.87 (respectively see Vanzella et al. 2020; Christensen et al. 2012a; Shapley et al. 2017; and Troncoso et al. 2014) are shown.
Fig. 3 illustrates that RCS0224z5 has a [|${\rm Ne\, \small {III}}$|]/[|${\rm O\, \small {II}}$|] ratio consistent with LyC leakers (both those at low redshift and Ion2 at z ≃ 3.21), and nearly two orders of magnitude higher than local star-forming galaxies with the same mass. This agrees with recent findings of enhanced [|${\rm Ne\, \small {III}}$|]/[|${\rm O\, \small {II}}$|] ratios in star-forming galaxies at z ∼ 2 (Zeimann et al. 2015; Jeong et al. 2020). Moreover, this is in agreement with the expectation that [|${\rm Ne\, \small {III}}$|]/[|${\rm O\, \small {II}}$|] is a proxy of [|${\rm O\, \small {III}}$|]/[|${\rm O\, \small {II}}$|], and that RCS0224z5 might have a high LyC escape fraction, as discussed further below (Section 4.3).
4.2.2 [Ne iii]/[O ii] as a proxy for the ionization state of the ISM
As evidenced by its tight correlation with [|${\rm O\, \small {III}}$|]/[|${\rm O\, \small {II}}$|] in local galaxies (e.g. Jeong et al. 2020), the [|${\rm Ne\, \small {III}}$|]/[|${\rm O\, \small {II}}$|] ratio is a robust tracer of the ionization parameter. Previous studies have proved the strong similarity between the [|${\rm Ne\, \small {III}}$|]/[|${\rm O\, \small {II}}$|] and [|${\rm O\, \small {III}}$|]/[|${\rm O\, \small {II}}$|] ratios theoretically; however, their quantitative predictions did not quite match observations, which is thought to be due to the modelled ionizing spectra being insufficiently hard (Levesque & Richardson 2014). We therefore construct an empirical relationship here by exploiting the statistics of SDSS. In Fig. 4, the distributions of [|${\rm Ne\, \small {III}}$|]/[|${\rm O\, \small {II}}$|] and [|${\rm O\, \small {III}}$|]/[|${\rm O\, \small {II}}$|] line ratios are shown for two classes of SDSS galaxies (star forming and Seyfert; see Appendix B). The LyC leakers from the Izotov et al. sample are again shown for comparison, along with six other local galaxies selected for extreme [|${\rm O\, \small {III}}$|] emission [‘Green Peas’ (GPs); Jaskot & Oey 2013], as well as the high-redshift galaxies Ion2 and SMACS J2031.8−4036 (respectively Vanzella et al. 2020; Christensen et al. 2012a). The fiducial limiting ratio of |${[{\rm O\, \small {III}}]}/{[{\rm O\, \small {II}}]}\ge 5$| used to characterize LyC leakers is shown by a vertical dashed black line.
![Correlation between the [${\rm Ne\, \small {III}}$]/[${\rm O\, \small {II}}$] and [${\rm O\, \small {III}}$]/[${\rm O\, \small {II}}$] line ratios of SDSS galaxies (star-forming galaxies in blue, Seyfert in purple). Also shown are Ion2 at z ≃ 3.21 (Vanzella et al. 2020), SMACS J2031.8−4036 at z ≃ 3.51 (Christensen et al. 2012a), the LyC leakers from the Izotov et al. sample, as well as six extreme GP galaxies from Jaskot & Oey (2013). The vertical grey dashed line shows the completeness limit of 90 per cent, while the fiducial limit ratio of ${[{\rm O\, \small {III}}]}/{[{\rm O\, \small {II}}]}\ge 5$ used to characterize LyC leakers is shown by the vertical black dashed line (see text for details on both). Ionization parameter values of log10U = −3, −2 are indicated by vertical blue lines (see equation 2, derived by Díaz et al. 2000). Direct measurements of Ion2 and SMACS J2031.8−4036 suggest the correlation between [${\rm Ne\, \small {III}}$]/[${\rm O\, \small {II}}$] and [${\rm O\, \small {III}}$]/[${\rm O\, \small {II}}$] seen in local galaxies holds well at higher redshift. Both these sources and RCS0224z5, shown by the black line with grey uncertainty, have a high ionization parameter compared to local galaxies, similar to that of LyC-leaking systems, but may very well be typical examples at high redshift as they do not seem to be as extreme outliers compared to their contemporaries (Fig. 3).](https://oup.silverchair-cdn.com/oup/backfile/Content_public/Journal/mnras/508/2/10.1093_mnras_stab2591/2/m_stab2591fig4.jpeg?Expires=1750183031&Signature=xzVjtnFz~xgsO2t28nckZJAXQ~eF003nuqEBj838l16P6Kt7H~X4DdvcXsytrmirMb0Lih0CO8QO~u1n8jqD3jmmarajVh6lMIOyoTnYjIeMlb-gMjEcWPr1GJJzsNTla44AcaaE-bUoMAs7O9Kd7Q0R23Nk1rLSXPC23n0P30vY7cPkXMoY~1xWwfrozJeeh21RqYiFXBa98EcLUQGpDyq3-lLxn0o77bpBE9DisKneJPv84TLFPN28O~uZeOjqveAP6B3H1rjK68nd0NEKnXjUWkB7cprNTWxooWoTDf5WsIdfzqDqaYa-fSGvB7bXtiJIXNenEuhqZMYWZTF6Gw__&Key-Pair-Id=APKAIE5G5CRDK6RD3PGA)
Correlation between the [|${\rm Ne\, \small {III}}$|]/[|${\rm O\, \small {II}}$|] and [|${\rm O\, \small {III}}$|]/[|${\rm O\, \small {II}}$|] line ratios of SDSS galaxies (star-forming galaxies in blue, Seyfert in purple). Also shown are Ion2 at z ≃ 3.21 (Vanzella et al. 2020), SMACS J2031.8−4036 at z ≃ 3.51 (Christensen et al. 2012a), the LyC leakers from the Izotov et al. sample, as well as six extreme GP galaxies from Jaskot & Oey (2013). The vertical grey dashed line shows the completeness limit of 90 per cent, while the fiducial limit ratio of |${[{\rm O\, \small {III}}]}/{[{\rm O\, \small {II}}]}\ge 5$| used to characterize LyC leakers is shown by the vertical black dashed line (see text for details on both). Ionization parameter values of log10U = −3, −2 are indicated by vertical blue lines (see equation 2, derived by Díaz et al. 2000). Direct measurements of Ion2 and SMACS J2031.8−4036 suggest the correlation between [|${\rm Ne\, \small {III}}$|]/[|${\rm O\, \small {II}}$|] and [|${\rm O\, \small {III}}$|]/[|${\rm O\, \small {II}}$|] seen in local galaxies holds well at higher redshift. Both these sources and RCS0224z5, shown by the black line with grey uncertainty, have a high ionization parameter compared to local galaxies, similar to that of LyC-leaking systems, but may very well be typical examples at high redshift as they do not seem to be as extreme outliers compared to their contemporaries (Fig. 3).
However, the [|${\rm Ne\, \small {III}}$|]/[|${\rm O\, \small {II}}$|] ratio is also an indirect tracer of the gas metallicity (being mostly anticorrelated with metallicity). The fact that RCS0224z5 (along with GOODSN-17940) has [|${\rm Ne\, \small {III}}$|]/[|${\rm O\, \small {II}}$|] much higher than local galaxies, and hence much lower metallicity, is also likely linked to the redshift evolution of the mass–metallicity relation (MZR). This is illustrated in Fig. 3 where binned samples are shown at intermediate redshifts, z = 2.3 and z = 3.3 [measurements from the MOSFIRE Deep Evolution Field (MOSDEF) survey; Sanders et al. 2021]. The tentative evolutionary trend of the [|${\rm Ne\, \small {III}}$|]/[|${\rm O\, \small {II}}$|] ratio with redshift seen in Fig. 3 has indeed been verified to approximately reproduce the MZR as observed with a variety of metallicity tracers (e.g. Maiolino et al. 2008). The next section will discuss the diagnosticity of [|${\rm Ne\, \small {III}}$|]/[|${\rm O\, \small {II}}$|] specifically regarding metallicity in further detail.
4.2.3 Tracing metallicity with [Ne iii]/[O ii]
By virtue of its correlation with the ionization parameter, the [|${\rm Ne\, \small {III}}$|]/[|${\rm O\, \small {II}}$|] ratio is also an indirect tracer of the metallicity. In the following we discuss the former aspect in greater detail, albeit with the caveat that the ratio is a more robust diagnostic for the ionization parameter than for metallicity.
By using the metallicity diagnostic relation for [|${\rm Ne\, \small {III}}$|]/[|${\rm O\, \small {II}}$|] from Bian, Kewley & Dopita (2018), calibrated with local analogues of high-redshift galaxies, we obtain |$12 + \log \left(\text{O/H} \right) = 8.01_{-0.21}^{+0.21}$| for RCS0224z5, where we have included a |$0.2 \, \mathrm{dex}$| systematic calibration uncertainty (see e.g. Nagao et al. 2006). This corresponds to roughly |$20{{\ \rm per\ cent}}$| of the solar metallicity: |$Z = 0.21_{-0.08}^{+0.13} \, \mathrm{Z_\odot }$|.4 The galaxies at z ∼ 4–5 with [|${\rm Ne\, \small {III}}$|] and [|${\rm O\, \small {II}}$|] measurements are clearly characterized by significantly higher line ratios (Fig. 3), and hence higher ionization parameters than z ∼ 3.5 galaxies. Using the (uncertain) strong-line calibration, we can indirectly infer they have lower metallicities too, which would confirm that they do follow the general redshift evolution of metallicity.
However, one should take into account that the metallicity of star-forming galaxies also shows a secondary dependence on SFR that, together with the primary dependence on mass, is dubbed fundamental metallicity relation (FMR; see e.g. Mannucci et al. 2010; see also a review in Maiolino & Mannucci 2019). This secondary dependence is thought to result from a more fundamental relation with the gas content (Bothwell et al. 2013, 2016a,b) and ascribed primarily to the accretion of near-pristine (or low-metallicity) gas that increases the gas content and dilutes the metallicity; the increased gas content also results into an increased SFR through the Kennicutt–Schmidt relation, which gives the observed anticorrelation between SFR and metallicity. Once this secondary dependence is taken into account then the redshift evolution of the metallicity is essentially absent, at least out to z ∼ 2.5 (Mannucci et al. 2010; Cresci, Mannucci & Curti 2019). Some deviation from the FMR was claimed at z > 3 (Troncoso et al. 2014), but more recently Sanders et al. (2021) have shown that their sample at z ∼ 3 follows the same FMR as local galaxies if metallicities are measured through the Bian et al. (2018) calibration.
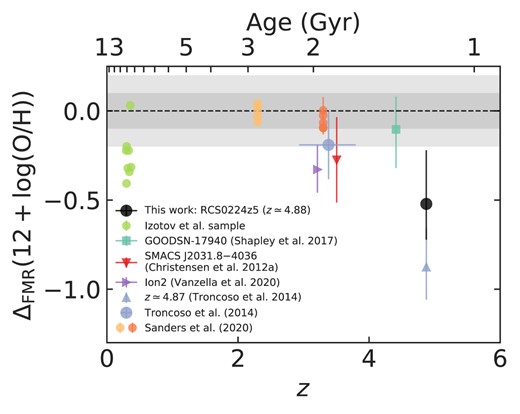
Offsets from the FMR, given by the inferred metallicity minus the one derived from the FMR. Intrinsic uncertainty of the FMR (which varies with both stellar mass and SFR) is indicated by the grey shaded regions, the darker region typical for galaxies at high mass and low SFR, the lighter region for galaxies at low mass and high SFR (for details, see Curti et al. 2020). At low redshift, the LyC leakers from the Izotov et al. sample are shown. Samples binned by stellar mass at z = 2.3 and z = 3.3 from the MOSDEF survey (Sanders et al. 2021) are shown, as well as a binned sample of 31 galaxies at z ∼ 3–4 from the Assessing the Mass-Abundances Z Evolution (AMAZE) and Lyman-Break Galaxies Stellar Populations and Dynamics (LSD) surveys, presented in Troncoso et al. (2014). LnA1689-2 is excluded from the latter and instead shown individually at z ≃ 4.87, as are Ion2 at z ≃ 3.21 (Vanzella et al. 2020), SMACS J2031.8−4036 at z ≃ 3.51 (Christensen et al. 2012a), and GOODSN-17940 at z ≃ 4.41 (Shapley et al. 2017). Galaxies at the highest redshift seem to show a trend towards negative differences, i.e. metallicities smaller than expected from the FMR.
While at z ∼ 2 galaxies are fully consistent with the local FMR, at z > 3 galaxies start having a larger scatter and tend to be distributed towards lower metallicities with respect to the FMR, also depending on the sample. Although the uncertainties are large, RCS0224z5 also shows some mild tension with respect to the local FMR, being more metal poor. Interestingly, the nearby LyC-leaking galaxies exhibit a significant offset in a similar direction. The other galaxy at nearly the same redshift, LnA1689-2 from the Troncoso et al. (2014) sample, likewise deviates from the FMR. Since the FMR is considered a relation describing the smooth evolution of galaxies in near-equilibrium between the inflow and outflow of gas and star formation, these findings may suggest that such young galaxies at z ∼ 5 are in an early stage of evolution in which they have not yet reached a steady equilibrium as the more evolved galaxies at lower redshifts, possibly as a consequence of an excess in gas accretion, which results in additional dilution of metals. However, these results should be confirmed with a larger sample of galaxies at z > 4 and by using additional metallicity diagnostics, which will certainly be feasible with JWST.
Finally, we note that the estimated metallicity obtained through the [|${\rm Ne\, \small {III}}$|]/[|${\rm O\, \small {II}}$|] ratio is significantly higher than the values required in stellar population synthesis models to reproduce the observed |${\rm C\, \small {IV}}$| EW (|$Z \lt 0.05 \, \mathrm{Z_\odot }$|, as shown in Smit et al. 2017). This indicates the hardness of the ionizing spectrum may currently be underestimated in such models. The lack of ionizing photons above |$47.9 \, \mathrm{eV}$| could be accounted for by physics currently not captured in models (e.g. stars stripped in binaries; Götberg et al. 2019), or it may be explained by a lower stellar iron abundance than derived using the nebular oxygen abundance and assuming solar oxygen-to-iron ratios (O/Fe). A higher oxygen-to-iron is expected in the early Universe compared to local galaxies, given that asymptotic giant branch (AGB) stars have lifetimes of only a few gigayears and metal enrichment is dominated by supernovae (Maiolino & Mannucci 2019). In particular, the discrepancy seems to agree well with the findings of Steidel et al. (2016), who demonstrate that the oxygen-to-iron ratio of their sample of star-forming galaxies at z ∼ 2.4 is elevated by a factor of ∼4 relative to the solar value (i.e. virtually the same enhancement as the ratio between the metallicities discussed here, |$20{{\ \rm per\ cent}}$| and |$5{{\ \rm per\ cent}}$| solar). While RCS0224z5 appears moderately metal enriched as measured indirectly with [|${\rm Ne\, \small {III}}$|]/[|${\rm O\, \small {II}}$|] (probing the nebular oxygen abundance), stellar atmospheres could be significantly more iron poor than expected when assuming a solar O/Fe ratio, resulting in an ionizing spectrum sufficiently hard to explain the observed |${\rm C\, \small {IV}}$| EW.
More generally, these results show the potential of [|${\rm Ne\, \small {III}}$|] as a powerful diagnostic, specifically for the study of high-redshift galaxies. Note, however, that the [|${\rm Ne\, \small {III}}$|] line can blend with |${\rm He\, \small {I}} \ \lambda 3890 \, \mathring{\rm A}$|, separated by |$\sim \!1500 \, \mathrm{km\, s^{-1}}$|, in low-resolution spectra (R ≲ 200). This effect becomes more prominent when the lines are broadened, for example with a significant contribution from the broad-line region of an AGN (e.g. Malkan et al. 2017) – this will not be the case, however, for star-forming systems dominated by narrow nebular emission lines.
4.3 LyC escape traced by Lyα and |${\mathrm{ Mg\, \small {II}}}$| emission
4.3.1 Velocity offsets of Lyα and Mg ii
Using spatially resolved MUSE spectroscopy, Smit et al. (2017) demonstrated the presence of extended, high EW Lyα emission, with a narrow, red peak emerging very close to the systemic redshift (defined by [|${\rm O\, \small {II}}$|]), regardless of position within the Lyα halo. X-shooter has a higher spectral resolution than MUSE at |$\sim \!7000 \, \mathring{\rm A}$| (R ∼ 6500 versus R ∼ 2700, respectively). We fit an asymmetric Gaussian line profile (see e.g. Shibuya et al. 2014) to the Lyα observed in image 1 by X-shooter (see Fig. 1). We find a velocity offset of |$\Delta v_\text{peak} = 156 \pm 52 \, \mathrm{km\, s^{-1}}$| from the systemic redshift (in agreement with Smit et al. 2017), FWHM of |$207 \pm 6 \, \mathrm{km\, s^{-1}}$|, and asymmetry factor aasym = 0.32 ± 0.01, indicating a skewed profile with a red wing. The asymmetric Gaussian provides an overall good fit, but does show non-vanishing residuals, particularly at the line peak, as well as the regions around 400 and |$1000 \, \mathrm{km\, s^{-1}}$|. As we lack sufficient angular resolution in the spectrum to study the Lyα line shape in depth, we will not focus on possible interpretations here and instead refer to the extensive discussion in Smit et al. (2017).
The determination of the peak offset can provide interesting constraints on properties of the neutral interstellar medium (ISM). In particular, the peak separation in a double-peaked Lyα profile (peak offset being the closest alternative to peak separation in the absence of a blue peak5 in the observed spectrum as a result of absorption in the intervening neutral IGM) is an indicator of resonant scattering of escaping Lyα photons: a higher column density of neutral hydrogen along the path of escape means more scattering, affecting the line profile shape to have its peak appear increasingly further from the systemic velocity at which the photons were produced: only photons far away from resonance (in frequency space), with a resulting low cross-section, are able to escape (e.g. Verhamme et al. 2017). In the context of the escape of LyC, which is itself governed by the same distribution of neutral hydrogen, the peak separation has proven to be a solid predictor of LyC escape fractions (Verhamme et al. 2017; Izotov et al. 2018b; Gazagnes et al. 2020). There are other indirect probes of LyC escape, though, which become necessary for application in the EoR, where Lyα (including the red peak) can be fully absorbed, as a result of the broad damping wing (e.g. Dijkstra 2014). Within this context, |${\rm Mg\, \small {II}}$|, also a resonant transition in the near-UV, presents promising features for high-redshift studies.
We detect |${{\rm Mg\, \small {II}}}\ \lambda 2796 \, \mathring{\rm A}$| as a narrow emission line close to the systemic redshift (|$\sim \!52 \, \mathrm{km\, s^{-1}}$|, see Fig. 1 and Table 1), while this feature is commonly seen in absorption in the spectra of local galaxies. |${\rm Mg\, \small {II}}$| P Cygni profiles with blueshifted absorption and redshifted emission have been discovered in more distant (z ≳ 0.5) galaxies, however, where it has been exploited to study galactic outflows (e.g. Weiner et al. 2009; Rubin et al. 2010, 2011; Giavalisco et al. 2011; Erb et al. 2012; Kornei et al. 2013; Bordoloi et al. 2016; Finley et al. 2017). Previous studies of gravitationally lensed galaxies at z ∼ 1.5–2 have also demonstrated several cases of |${\rm Mg\, \small {II}}$| emission, seen without P Cygni profiles or evidence for a redshift from the systemic velocity (Pettini et al. 2010; Rigby et al. 2014; Karman et al. 2016).
Nebular emission from |${\rm H\, \small {II}}$| regions and resonant scattering (of either |${\rm Mg\, \small {II}}$| or continuum photons) are both plausible sources of |${\rm Mg\, \small {II}}$| emission. The former scenario is supported by comparing observed |${\rm Mg\, \small {II}}$| profiles to photoionization models, while their variety, ranging from narrow, systemic emission to P Cygni and pure absorption, provides evidence for the latter (Rubin et al. 2010; Erb et al. 2012; Feltre et al. 2018). For RCS0224z5, its narrow line profile observed close to the systemic redshift suggests a nebular origin of the |${\rm Mg\, \small {II}}$| line and an ISM where little scattering takes place along the line of sight (e.g. due to a very high filling factor of ionized gas).
4.3.2 The predictive power of Lyα and Mg ii emission for unseen LyC escape processes
Considering the resonant nature of |${\rm Mg\, \small {II}}$| (and the low ionization energies of magnesium that make |${\rm Mg\, \small {II}}$| mainly a tracer of the neutral ISM), various studies have pointed out the resemblance to Lyα (e.g. Feltre et al. 2018; Henry et al. 2018). As a result, |${\rm Mg\, \small {II}}$| might provide a new way to indirectly but effectively identify sources emitting both Lyα (commonly used as a probe for measuring the conditions of the IGM; see Dijkstra 2014) and LyC radiation at z ≳ 6, before reionization is completed (McGreer, Mesinger & D’Odorico 2015), where neither may be directly observable as a result of absorption by the neutral IGM. Indeed, |${\rm Mg\, \small {II}}$| emission has been reported in 10 local LyC leakers (Izotov et al. 2016a,b, 2018a,b; Guseva et al. 2020), and in a sample of GP (see also Section 4.2.2) galaxies (Henry et al. 2018). In the latter, a correlation between the escape fractions of |${\rm Mg\, \small {II}}$| and Lyα has been found, which suggests a tentative correlation between the escape fractions of |${\rm Mg\, \small {II}}$| and LyC. If well established (promising first results have been reported; Chisholm et al. 2020; Matthee et al. 2021), this correlation could allow JWST and the generation of Extremely Large Telescopes to reveal the sources beyond (and behind) reionization, given they can detect a |${\rm Mg\, \small {II}}$| signal from sources in the EoR. Moreover, |${\rm Mg\, \small {II}}$| would provide a tool to predict the intrinsic properties of Lyα within galaxies, in order to improve the constraints on the neutral fraction in the IGM derived from the Lyα prevalence in reionization-era sources (e.g. Schenker et al. 2014; Mason et al. 2018; Pentericci et al. 2018).
Using the measured EW of |${{\rm Mg\, \small {II}}}\ \lambda 2796 \, \mathring{\rm A}$| we compare RCS0224z5 to local LyC leakers and GPs from the Izotov et al. sample and Henry et al. (2018) sample in Fig. 6. This figure illustrates the correlation between Lyα and |${\rm Mg\, \small {II}}$| EWs (although lacking an evident direct relation with LyC escape fraction shown by the colour bar), as would be expected for correlated escape fractions of the two lines.
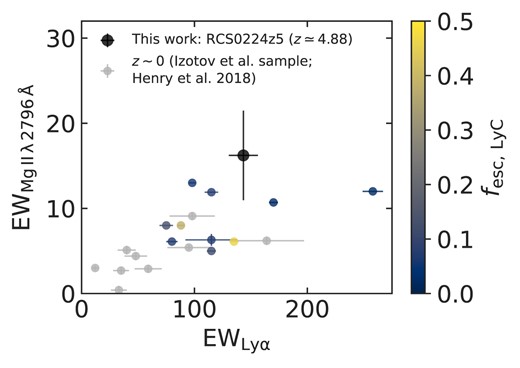
EWs of Lyα and |${{\rm Mg\, \small {II}}}\ \lambda 2796 \, \mathring{\rm A}$| of RCS0224z5, compared to local extreme emission line galaxies, among which 10 LyC-emitting sources (the Izotov et al. sample and Henry et al. 2018, coloured according to the escape fraction of LyC, if known). The correlation between Lyα and |${\rm Mg\, \small {II}}$| EWs is one of the indicators that the escape mechanisms of Lyα and |${\rm Mg\, \small {II}}$| are similar. Moreover, relatively high EWs imply that both Lyα and |${\rm Mg\, \small {II}}$| escape is comparatively high in RCS0224z5.
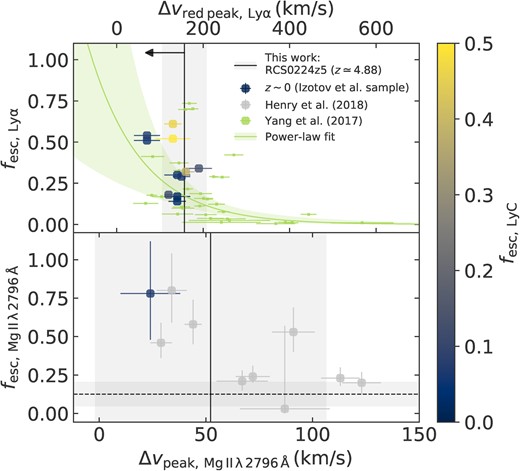
Escape fractions of Lyα radiation (top) and |${{\rm Mg\, \small {II}}}\ \lambda 2796 \, \mathring{\rm A}$| (bottom) compared to the corresponding velocity offsets of Lyα (its red peak; top) and the peak of |${{\rm Mg\, \small {II}}}\ \lambda 2796 \, \mathring{\rm A}$| (bottom), compared to local extreme emission line galaxies. Among these are 10 LyC-emitting sources (the Izotov et al. sample and Henry et al. 2018, coloured according to the escape fraction of LyC, if known). In the top panel, a sample of GP galaxies from Yang et al. (2016, 2017) is shown (the sample consists of 43 galaxies, among which five are already contained in the Izotov et al. sample), with a simple power-law fit. Both panels show a similar trend (though with considerable scatter), where a small velocity offset indicates a large escape fraction. The measured velocity offsets of RCS0224z5 (effectively an upper limit in the case of Lyα due to IGM absorption) again suggest relatively high escape fractions, which is supported by the predicted escape fraction of |${{\rm Mg\, \small {II}}}\ \lambda 2796 \, \mathring{\rm A}$| (the horizontal dashed line; see text for details).
Independently, we can estimate the |${{\rm Mg\, \small {II}}}\ \lambda 2796 \, \mathring{\rm A}$| escape fraction. Henry et al. (2018) have demonstrated a tight sequence between the [|${\rm O\, \small {III}}$|]/[|${\rm O\, \small {II}}$|] ratio and the intrinsic line flux of |${{\rm Mg\, \small {II}}}\ \lambda 2796 \, \mathring{\rm A}$| relative to |${[{\rm O\, \small {III}}]}\ \lambda 5008 \, \mathring{\rm A}$|. Although [|${\rm O\, \small {III}}$|] has not been observed directly, we can infer its flux (and the [|${\rm O\, \small {III}}$|]/[|${\rm O\, \small {II}}$|] ratio) through the observed [|${\rm Ne\, \small {III}}$|] and [|${\rm O\, \small {II}}$|] lines, as discussed in Section 4.2.2.
5 SUMMARY
We have presented new X-shooter and SINFONI observations of a 30× magnified galaxy at z ≃ 4.88, RCS0224z5. Only three sources at z ≳ 5 are known with this lensing magnification, and at the same time its redshift places RCS0224z5 just below the observational limit for accessing the bluest rest-frame optical emission lines from the ground ([|${\rm O\, \small {II}}$|] and [|${\rm Ne\, \small {III}}$|], other lines have already shifted into the mid-infrared). This particular source has been shown to exhibit widespread, high EW |${{\rm C\, \small {IV}}}\ \lambda 1549 \, \mathring{\rm A}$| emission, suggesting it is a unique example of a metal-poor galaxy, with a hard radiation field and high LyC production efficiency ξion, likely representing the galaxy population that is responsible for cosmic reionization. By virtue of its lensing magnification and redshift, RCS0224z5 is thus a unique ‘Rosetta Stone’ object that could help bridge the gap in our understanding between galaxies in the local and very early Universe. We summarize our findings as follows.
We rule out the presence of strong AGN activity in the source, based on UV BPT-like diagnostics. Instead, a young (1–|$3 \, \mathrm{Myr}$|), metal-poor stellar population is likely responsible for the hard radiation field required for the |${\rm C\, \small {IV}}$| emission, providing a considerable contribution of photons reaching energies of at least |$47.9 \, \mathrm{eV}$|.
We present the detection of [|${\rm Ne\, \small {III}}$|] (the highest redshift this line has been observed at) and discuss the potential of the [|${\rm Ne\, \small {III}}$|]/[|${\rm O\, \small {II}}$|] line ratio as a high-redshift diagnostic for the ionization parameter (and metallicity, albeit indirect). The measured ratio of RCS0224z5, |${[{\rm Ne\, \small {III}}]}/{[{\rm O\, \small {II}}]}= 0.46 \pm 0.10$|, corresponding to a likely ionization parameter of log10U = −2.37 ± 0.08, is similar to local galaxies that have been confirmed to be leaking LyC radiation, and about an order of magnitude higher than local star-forming galaxies.
When using [|${\rm Ne\, \small {III}}$|]/[|${\rm O\, \small {II}}$|] as metallicity tracer – indirectly, since the line ratio principally correlates with the ionization parameter – we estimate that RCS0224z5 has a gas metallicity of roughly |$20{{\ \rm per\ cent}}$| of the solar value (|$12 + \log \left(\text{O/H} \right) = 8.01_{-0.21}^{+0.21}$|), which is in mild tension with what is expected from the FMR. The only other galaxy known at a similar redshift (z ∼ 5) for which [|${\rm Ne\, \small {III}}$|] is detected shows a similar displacement in metallicity, as do nearby LyC leakers. Since the FMR is considered a relation describing the smooth chemical evolution of galaxies, in which galaxies are in near-equilibrium between star formation and gas inflow and outflow, the deviation of these two galaxies at z ∼ 5 suggests that primeval galaxies (and rare, LyC-leaking galaxies in the local Universe) might be out of equilibrium by being subject to an excess of gas accretion, resulting in an excess of metallicity dilution. However, more measurements at this cosmic epoch are certainly needed to verify this trend.
Our detection of |${\rm Mg\, \small {II}}$| in emission, the highest EW emission line observed in this source after Lyα (and the highest redshift detection to date), demonstrates its potential for several applications. First, it can simply act as a spectroscopic redshift confirmation at high redshift – especially in the EoR (at z ≳ 6), where Lyα will be absorbed by the neutral IGM. Secondly, since the escape of |${\rm Mg\, \small {II}}$| correlates with that of Lyα (Henry et al. 2018), it might provide a new way to indirectly but effectively identify leaking LyC radiation in the same sources during an epoch when the Universe is opaque also to LyC photons. Finally, detecting |${\rm Mg\, \small {II}}$| in these sources would provide a tool to predict the intrinsic properties of Lyα within galaxies, allowing improved constraints on the neutral fraction in the IGM derived from the Lyα prevalence.
ACKNOWLEDGEMENTS
We thank Joanna Piotrowska for assisting with the dust correction of SDSS galaxy line fluxes. We are also grateful to the anonymous referee for helpful suggestions. JW, RS, RMai, and MC acknowledge support from the ERC Advanced Grant 695671, ‘QUENCH’ and the Science and Technology Facilities Council (STFC). JW, RS, and RMai acknowledge support from the Fondation Merac. RS acknowledges support from an NWO Rubicon grant, project number 680-50-1518, and an STFC Ernest Rutherford Fellowship (ST/S004831/1). NL acknowledges support from the Kavli Foundation. RMas and MS acknowledge funding from STFC via awards ST/T000244/1 and ST/T002565/1. This work has used the following packages in python: the SciPy library (Jones, Oliphant & Peterson 2001), its packages NumPy (van der Walt, Colbert & Varoquaux 2011) and matplotlib (Hunter 2007), and the astropy package (Astropy Collaboration et al. 2013, 2018).
This study is based on observations collected at the European Southern Observatory under ESO programmes 0102.A-0704(A) and 075.B-0636(B). This work was furthermore partially based on observations made with the NASA/ESA Hubble Space Telescope, obtained at the Space Telescope Science Institute, which is operated by the Association of Universities for Research in Astronomy, Inc., under NASA contract NAS 5-26555. These observations are associated with program #14497. Funding for the SDSS and SDSS-II has been provided by the Alfred P. Sloan Foundation, the Participating Institutions, the National Science Foundation, the U.S. Department of Energy, the National Aeronautics and Space Administration, the Japanese Monbukagakusho, the Max Planck Society, and the Higher Education Funding Council for England (https://www.sdss.org/). We are furthermore grateful to the MPA-JHU group for making their catalogue public. The MPA-JHU team was made up of Stephane Charlot, Guinevere Kauffmann, Simon White, Tim Heckman, Christy Tremonti, and Jarle Brinchmann.
DATA AVAILABILITY
The X-shooter and SINFONI data underlying paper article are available in the ESO archive at https://archive.eso.org/ under ESO programme IDs 0102.A-0704(A) and 075.B-0636(B), respectively. The HST data underlying this paper are available in the MAST archive at 10.17909/T9-9KG5-HG27. The reduced data underlying this paper will be shared on reasonable request to the corresponding author.
Footnotes
Data may be obtained from the Mikulski Archive for Space Telescopes (MAST) at 10.17909/T9-9KG5-HG27.
In this work, we use vacuum wavelengths throughout (see Table 1); emission line labels reflect vacuum wavelengths, rounded to the nearest integer.
The catalogue is available at https://www.mpa-garching.mpg.de/SDSS/DR7/, while a description of the relevant methods used to compile it can be found in Tremonti et al. (2004).
We adopt a solar oxygen abundance of 12 + log (O/H)⊙ = 8.69 (Asplund et al. 2009).
The velocity offset of the blue peak actually offers the best predictive power (Verhamme et al. 2017).
JWST Exposure Time Calculator (ETC): https://jwst.etc.stsci.edu
REFERENCES
APPENDIX A: |${\rm Mg\, \small {II}}$| AND |${\rm C\, \small {III}}$| SIGNIFICANCE
In this appendix, we elaborate on the significance of the (non-)detections of the |${\rm Mg\, \small {II}}$| emission line and the |${{\rm C\, \small {III}}]}\ \lambda 1907 \, \mathring{\rm A}, \, {[{\rm C\, \small {III}}]}\ \lambda 1909 \, \mathring{\rm A}$| doublet. In Fig. A1, X-shooter spectra of |${\rm Mg\, \small {II}}$| are shown for each of the three OBs individually (first three columns) and the combined result for a smaller and extended aperture (final two columns). The measured velocity offset and flux for each different configuration are summarized in Table A1.
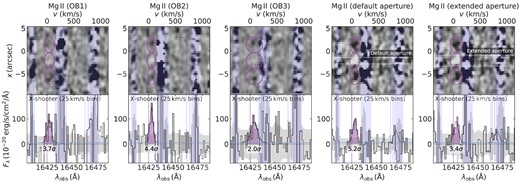
X-shooter spectra of |${\rm Mg\, \small {II}}$| for each of the three OBs individually (first three columns) and the combined spectra for a smaller and extended aperture (final two columns). One-dimensional spectra for the individual OBs have been extracted from the same smaller aperture as in the fourth column.
| Configuration | |$\Delta v \, (\mathrm{km\, s^{-1}})$| | |$\mathrm{Flux} \, (10^{-18} \, \mathrm{erg \, s^{-1} \, cm^{-2}})$| |
|---|---|---|
| OB1 | 45 ± 56 | 5.33 ± 1.45 |
| OB2 | 54 ± 53 | 6.17 ± 1.41 |
| OB3 | 79 ± 56 | 5.97 ± 3.01 |
| Default aperture | 56 ± 54 | 4.65 ± 0.90 |
| Extended aperture | 52 ± 54 | 5.00 ± 1.49 |
Furthermore, Fig. A2 shows the portion of the spectrum where the |${\rm C\, \small {III}}$| doublet would be expected, both without and with telluric absorption correction (TAC; see Section 2.1). It is unclear whether a signal is present in the spectra, which lack a clear dark–light–dark pattern (cf. Fig. 1), in part because of skyline contamination and partly owing to the strong telluric absorption. We have chosen not to attempt to measure an upper limit for the |${[{\rm C\, \small {III}}]}\ \lambda 1909 \, \mathring{\rm A}$| line directly, as it falls precisely on a region that is heavily impacted by skylines and telluric absorption. Instead, we assume a line ratio (see Section 3.1).
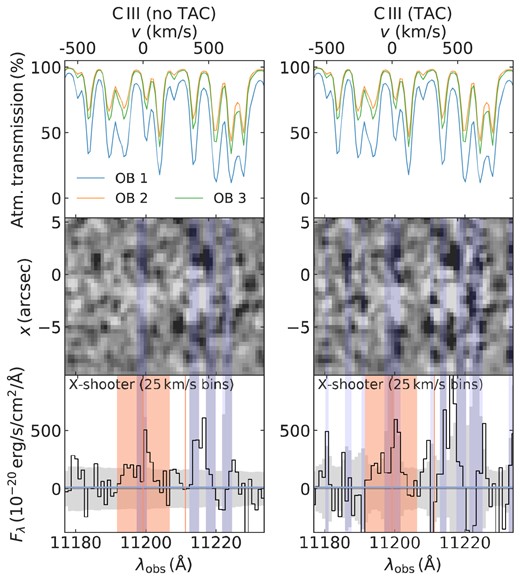
X-shooter spectra in the wavelength region where the |${\rm C\, \small {III}}$| doublet would be expected, both without and with TAC (see Section 2.1). The top row shows the resulting atmospheric transmission calculated by molecfit. A region within |${-}200 \lt v \lt 200 \, \mathrm{km\, s^{-1}}$| of the expected |$1907 \, \mathring{\rm A}$| line centre, which has been used to place an upper limit on the flux, is highlighted in the bottom row of one-dimensional spectra.
APPENDIX B: SDSS SELECTION
For the comparison sample drawn from the SDSS DR7 (discussed in Section 4.2), we outline the selection criteria here in detail. Following previous studies (e.g. Kewley et al. 2006; Juneau et al. 2014; Feltre et al. 2016), we select galaxies satisfying the following criteria:
|$\mathtt {TARGETTYPE} = \mathrm{GALAXY}$| and |$\mathtt {Z\_WARNING} = 0$|.
For all emission lines in the ratios [|${\rm O\, \small {III}}$|]/Hβ, [|${\rm N\, \small {II}}$|]/Hα, [|${\rm S\, \small {II}}$|]/Hα, and [|${\rm O\, \small {I}}$|]/Hα used in BPT diagrams, we require an SNR of |$\text{SNR} \gt 3/\sqrt{2} \approx 2.12$| on the ratios themselves (leading to a more complete sample; see Juneau et al. 2014 – additionally, formal uncertainty corrections as discussed in their appendix A have been applied). Furthermore, we only select galaxies with SNR > 30 on the [|${\rm O\, \small {II}}$|] doublet – see the discussion in Section 4.2.
In order to align with previous studies, redshifts in the range 0.04 < z < 0.2. These lower and upper limits are imposed to avoid strong fibre-aperture effects, and to cover detections of intrinsically weak lines while maintaining a good completeness for Seyfert-type galaxies, respectively (e.g. Juneau et al. 2014).
A valid stellar mass measurement (17 entries have M* = −1).
This leads to a final sample of 8960 galaxies. We classify the galaxies into star forming, composite, Seyfert, and low-ionization nuclear emission-line region (LINER) classes (although we will focus only on star forming and Seyfert types), based on the [|${\rm N\, \small {II}}$|], [|${\rm S\, \small {II}}$|], and [|${\rm O\, \small {I}}$|] BPT diagrams, following Kewley et al. (2006). Subsequently, the line fluxes are corrected for dust extinction using the Cardelli, Clayton & Mathis (1989) reddening curve assuming RV = AV/E(B − V) = 3.1, and a fiducial intrinsic Hα/Hβ ratio of 2.85 for star-forming galaxies and 3.1 for AGN-dominated systems (for case B recombination at |$T = 10^4 \, \mathrm{K}$| and ne ∼ 102–|$10^4 \, \mathrm{cm^{-3}}$|; see Kewley et al. 2006). In this sample, 2484 galaxies or 27.7 per cent have an SNR > 5 [|${\rm Ne\, \small {III}}$|] detection.
APPENDIX C: JWST ETC CALCULATION
Given the observed |${{\rm Mg\, \small {II}}}\ \lambda 2796 \, \mathring{\rm A}$| flux of |$5.0 \times 10^{-18} \, \mathrm{erg \, s^{-1} \, cm^{-2}}$| (see Table 1) and assuming a typical flux ratio of F2796/F2804 ≈ 1.9 between the |${{\rm Mg\, \small {II}}}$| lines at |$2796$| and |$2804 \, \mathring{\rm A}$| (e.g. Henry et al. 2018), the total flux of the doublet would become |$7.6 \times 10^{-18} \, \mathrm{erg \, s^{-1} \, cm^{-2}}$|. However, taking into account the lensing magnification of μ = 29, we derive an intrinsic flux of |$2.6 \times 10^{-19} \, \mathrm{erg \, s^{-1} \, cm^{-2}}$| at z = 4.88. We note that the uncertainty and spatial variation of the lensing magnification make this only a rough estimate of the true intrinsic flux. Assuming an object with the same luminosity at z = 7 (in which case |${\rm Mg\, \small {II}}$| would be observed at |$\lambda _\text{obs} = 2.24 \, \mathrm{\mu m}$|), this would lead to an observed flux of |$1.13 \times 10^{-19} \, \mathrm{erg \, s^{-1} \, cm^{-2}}$|. The continuum flux density from our fit is |$2.29 \times 10^{-20} \, \mathrm{erg \, s^{-1} \, cm^{-2} \, \mathring{\rm A}^{-1}}$| or |$383 \, \mathrm{nJy}$| at |$\lambda _\text{obs} = 2.24 \, \mathrm{\mu m}$|, which translates to |$2.5 \times 10^{-22} \, \mathrm{erg \, s^{-1} \, cm^{-2} \, \mathring{\rm A}^{-1}}$| or |$4.18 \, \mathrm{nJy}$| if it were unlensed at z = 7.
Alternatively, our estimate implies |$F_{2796} = 7.4 \times 10^{-20} \, \mathrm{erg \, s^{-1} \, cm^{-2}}$|. This is inconsistent with a recent estimate from Chisholm et al. (2020), the difference being explained by the fact that their higher flux estimate (by a factor of ∼8) arises from considering a source with a H-band magnitude of 25 (in the F160W filter; this corresponds to MUV ≃ −21.9 at z = 7). The unlensed observed magnitude of RCS0224z5 is |$\sim \!26.8 \, \mathrm{mag}$|, which at z ≃ 4.88 translates to MUV ≃ −19.6. This implies an observed magnitude of 27.4 at z = 7 – a factor of ∼9 fainter than a |$25 \, \mathrm{mag}$| source – and is instead appropriate when considering intrinsically fainter and hence more common sources. In a typical extremely deep field, one would on average expect less than one source at z ∼ 7 with magnitude 25, and the order of N ∼ 1 in a medium-deep field, compared to N ∼ 2 and N ≳ 70, respectively, for a |$m_\text{UV} \sim 27.4 \, \mathrm{mag}$| source [derived from the z ∼ 7 number counts in the |$5 \, \mathrm{arcmin^2}$| eXtreme Deep Field (XDF) and |$\sim \!120 \, \mathrm{arcmin^2}$| Cosmic Assembly Near-infrared Deep Extragalactic Legacy Survey (CANDELS)-DEEP fields presented in Bouwens et al. 2015].
Simulations of the NIRSpec on JWST point out that for an (intrinsically) relatively faint object like RCS0224z5, detecting |${\rm Mg\, \small {II}}$| spectroscopically would be challenging: for example, a |$10 \, \mathrm{ks}$| exposure with the multi-object spectrograph observing mode at low resolution would result in a signal of |${\rm Mg\, \small {II}}$| at the level of 0.65σ per spectral pixel (but we note that integrating over the few pixels containing the line could slightly increase the overall SNR). At R ∼ 100, this would render the doublet (separated by |$\sim \!770 \, \mathrm{km\, s^{-1}}$|) unresolved as well. The same exposure would yield an SNR of 0.56 per spectral pixel at medium spectral resolution (the F170LP/G235M grating achieving R ∼ 1000 at |$\lambda _\text{obs} = 2.24 \, \mathrm{\mu m}$|), which would resolve the doublet down to |$\sim \!300 \, \mathrm{km\, s^{-1}}$|. Finally, a deep (|$10 \, \mathrm{h}$|) exposure allow an SNR of 0.67 per spectral pixel at high resolution (R ∼ 2000 or |$\sim \!150 \, \mathrm{km\, s^{-1}}$|). Still, for objects with a more intense episode of ongoing star formation (possibly boosting the flux by a factor of a few, up to a factor of ∼8 for a MUV ≃ −21.9 source as in Chisholm et al. 2020, as discussed above), or for lensed objects (like RCS0224z5), observations of |${\rm Mg\, \small {II}}$| would be feasible in deep spectroscopic surveys.
