


ABSTRACT
We present results from high signal-to-noise optical spectropolarimetric observations of the Seyfert 1 galaxies NGC 3783 and Mrk 509 in the 3500–7000 Å range. We find complex structure in the polarized emission for both objects. In particular, Position Angle (PA) changes across the Balmer lines show a distinctive ‘M’-shaped profile that had not been observed in this detail before, but could represent a common trait in Seyfert 1 galaxies. In fact, while this shape is observed in all Balmer lines in NGC 3783, Mrk 509 transitions into a ‘M’-shaped PA profile for higher transitions lines. We have modelled the observed profiles using the STOKES radiative transfer code and assuming that the scattering region is co-spatial with the BLR and outflowing. The results give compelling new evidence for the presence of nuclear winds in these two Seyfert 1 galaxies.
1 INTRODUCTION
Arguably, the results from spectropolarimetry of Active Galactic Nuclei (AGNs) has been the primary observational evidence that has led to the acceptance of the standard ‘Unified Model’ of AGNs: to a first order, the accretion disc is surrounded by a similarly oriented optically thick dusty torus, with the collimated radio emission being coincident with the system axis. The Broad Line Region (BLR) would also lie within the opaque torus and for Type 1 AGN a direct view of the nuclear source and BLR is only possible in the polar direction. For Type 2 AGNs the BLR can be observed in polarized light, after scattering takes place somewhere in the vicinity of the central source. The position angle (PA) of this polarized emission is generally perpendicular to the radio axis of the source. The rather flat wavelength dependence of the continuum polarization suggests that the nuclear light is scattered by electrons, while the observed PAs indicate that the scattering occurs somewhere along the throat of a torus, i.e. in the polar directions as seen from the nucleus.
Even Type 1 AGNs sometimes show the same evidence for such ‘polar scattering’ (Smith et al. 2002). However, spectropolarimetric studies of Type 1 AGNs have found that a significant fraction presents continuum position angles which are, to first order, parallel rather than perpendicular to the radio axis of the system, suggesting that besides the ‘polar scatterer’ there is another, much more compact ‘equatorial scattering’ region, that can dominate the polarized spectrum in a significant fraction of Seyfert 1 galaxies (Smith et al. 2002, 2004). An early claim of such equatorial scattering was presented by Antonucci (1984) from the study of polarization in radio galaxies. He argues for a group of objects with ‘parallel’ scattering, referring to the orientation of the polarization PA with respect to the radio jet. In those cases where strong emission lines were detected in polarized light (e.g. 3C 382), Antonucci (1984) notices they were significantly broader than any broad component seen in polarized light, and explained it by scattering taking place in a thin disc aligned with the plane of symmetry of the central source.
But, more importantly, the spectropolarimetric results show that in sources with an equatorial scattering region, the polarization PA often rotates significantly across the broad emission lines. This happens for near-field scattering, i.e. with the scatterer being close enough to the H α emitting region to resolve it so that the radiation from the two opposite sides of the, presumably flattened BLR, is scattered at different angles. The early modelling by Smith et al. (2004, 2005) nicely reproduced the sinusoidal PA rotation that characterized the emission lines observed in some sources, although no actual fit to the data was ever attempted until much later (Savić et al. 2018).
As the level of polarization in Type 1 AGN is rather low (|$\sim 1{{\ \rm per\ cent}}$|), previous studies using 4-m class telescopes have had a limited number of sources accessible to spectropolarimetry of adequate signal-to-noise. This problem is particularly acute in the blue region of the optical spectrum. We have selected two bright Seyfert 1 galaxies with a known degree of polarization to further study the characteristics of their polarized emission using 8-m facilities. NGC 3783 and Mrk 509 are two well studied, southern Seyfert 1 galaxies for which emission-line lags for several BLR lines have been measured from reverberation mapping (Reichert et al. 1994; Stirpe et al. 1994; Onken & Peterson 2002; Peterson et al. 2004). Updated black hole masses for both Seyferts can be found in the AGN Black Hole Mass Database (Bentz & Katz 2015). Hence, physical scales for various line emitting regions are available. This is potentially of great importance in understanding the near-field polarization since it could lead to a determination of a physical size for the scatterer and, hopefully, the identification of its nature. Spectropolarimetry of Mrk 509 has already been presented by Goodrich & Miller (1994), Young et al. (1999), Schmid et al. (2000), Smith et al. (2002), and Afanasiev, Popović & Shapovalova (2019), while previous results for NGC 3783 have been presented by Smith et al. (2002).
2 OBSERVATIONS AND DATA REDUCTION
2.1 NGC 3783 observations
We observed NGC 3783 (z = 0.009730) on 2006 April 3 using the FORS1/600B spectropolarimetry mode on the Unit Telescope 2 of the VLT (resolution ∼6 Å), covering the H β and higher order Balmer emission lines, and on the 2006 April 30 and May 1 using EFOSC2/Gr#4 on the 3.6m telescope at La Silla (resolution ∼12 Å), covering the H α emission line.1
We implemented sequences of observations consisting of four frames with different waveplate positions (0, 45, 22.5, and 67.5 degrees). The total exposure time was 3.4 h with FORS 1 and 6.2 h using EFOSC2. At the VLT, the 1.5 arcsec slit was fixed in the north–south direction, and the atmospheric dispersion compensator was reset at the start of each sequence. At the 3.6 m the slit was approximately parallel to the parallactic angle. No observations were taken at airmass in excess of 1.2.
The CCD frames were bias-subtracted using an averaged bias frame, and flat-fielded using the flat-field frames taken with external calibration units during day time. The pixels with obvious cosmic ray hits were fixed using neighbouring pixels. There was no need to correct for CCD distortions previous to the spectrum subtraction as o- and e-rays were located close to each other on the detectors (∼116 pixels ∼23 arcsec ∼ 2.8 mm for FORS1 and ∼62 pixels ∼10 arcsec ∼ 4.1 mm for EFOSC2). Inspection of sky lines showed that these had a standard deviation of 0.4 and 0.6 pixels for FORS1 and EFOSC2, respectively, when comparing positions above and below the double spectra and for a wide range of airmasses. Sky subtraction was achieved in the standard way by defining windows on either side of the object spectra. Notice that the individual slits for the o- and e-rays were wide enough to be able to determine the sky level from the same slit where the spectra were found. No residuals were observed at the positions of the sky lines. The sky-subtracted o- and e-ray spectra were combined to produce normalized Stokes parameters q and u and the Stokes parameter I, following Miller, Robinson & Goodrich (1988). The polarization level and position angle, p and PA, were obtained in the standard way (|$p = \sqrt{(}q^2+u^2)$|, PA = 1/2 tan −1(u/q)). p was also obtained using ‘unbiased’ prescriptions (Miller et al. 1988), but the resulting spectra did not show any significant differences, so the standard definition was finally adopted. The zero-point of the polarization signal was checked using the polarized standard star Hiltner 652 (|$p=6.3{{\ \rm per\ cent}}$| at 5500 Å) in both runs. The measurement of unpolarized standard stars showed a low instrumental polarization as already reported in previous works (e.g. Lamy & Hutsemékers 2000; Fossati et al. 2007): in the 5200–5800 Å range HD94851 gave |$p=0.07\pm 0.02{{\ \rm per\ cent}}$| for FORS1 (VLT), while HD97689 gave |$p=0.02\pm 0.01{{\ \rm per\ cent}}$| for EFOSC2 (3.6 m).
No order-sorting filter was available for the EFOSC2 observations, and thus the measurements at long wavelengths might be slightly affected by a second-order contamination. However we note that the observation of the blue unpolarized star above did not show any systematic polarization at λ ≲ 7200 Å.
Flux calibration was achieved using the flux standard stars EG274 (VLT), and LTT4816 and Feige67 (3.6 m). The data were corrected for Galactic extinction assuming EB − V = 0.119 and using the extinction curve derived by Cardelli, Clayton & Mathis (1989) with AV/EB − V = 3.1.
2.2 Mrk 509 observations
We observed Mrk 509 (z= 0.034397) on 2006 August 23 using FORS1 on the UT2 at the VLT. Exposure times were 6.2 and 0.3 h, for the 600B and 600R grisms (resolution ∼6 Å for both settings), respectively. No observations were taken at airmass in excess of 1.5.
Images were reduced in the same manner as described above for NGC 3783. The zero-point of the polarization signal was checked using the polarized standard star BD-125133 (|$p=4.4{{\ \rm per\ cent}}$| at 5500 Å). The star EGRR 274 was used as unpolarized and flux standard. The measurement confirmed the low instrumental polarization at p = 0.10 ± 0.05 (per cent) in the 5200–5800 Å range. As before, the data were also corrected for a foreground extinction of EB − V = 0.057.
2.3 Intervening polarization and atmospheric depolarization
An important concern when analysing polarimetric data is that dust-induced Inter-Stellar Polarization (ISP) along the line of sight to the active nucleus must be taken into account (Hoffman et al. 2005).
To quantify the amount of ISP in our Galaxy towards NGC 3783 (b = 23°), we observed a few Galactic stars in the same field. They are close in projection to NGC 3783 and have spectroscopically determined distances large enough to probe most of the interstellar polarization within the Galactic disc. These observations suggest the Galactic interstellar polarization towards NGC 3783 to be ∼ 0.25 per cent at PA ∼105°. The same exercise along the line of sight towards Mrk 509 (b = −29°) gives a Galactic interstellar polarization of ∼0.18 per cent at PA ∼ 100°.
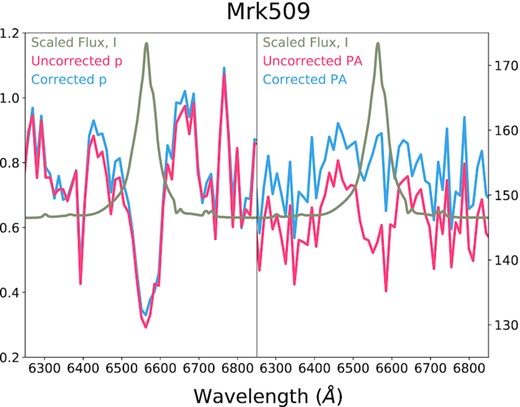
We examined the level of polarization in the O iii lines after ISP correction. For this, it is necessary to first subtract the continuum in the original polarized flux spectra, which was achieved by fitting a low degree polinomium to the data. The results show that the intrinsic polarization of these lines is very low, at p ∼ 0.001 ± 0.0003 per cent for NGC 3783 and p ∼ 0.002 ± 0.0006 per cent for Mrk 509, in agreement with their noisy appearance in the p × I spectra of both sources. This is expected considering that the Narrow Line Region (NLR) is sufficiently large so that geometrical cancellation (this is, the depolarization due to the combination of rather random polarized signals) can be very efficient. This is a good indication that there are no further sources of intervening ISP contamination towards the nucleus of these two galaxies. Corrected and uncorrected observations are presented in Figs 1 and 2, while unnormalized, ISP-uncorrected Q and U spectra for our sources are presented in the Appendix.
Finally, we also tried to correct for the amount of atmospheric depolarization affecting our observations. As explained by Afanasiev & Amirkhanyan (2012), the atmosphere introduces a variable amount of transmission between consecutive frames, which leads to a time-dependent differential intensity in the o- and e-ray spectra. As shown by Afanasiev & Amirkhanyan (2012) the time-scale for these changes is about 30 min and appears as low amplitude oscillations in the Stokes spectra. As repeated visits to our sources correspond to about the same time-scale (cycling through four frames with different waveplate positions in order to determine the Stokes vectors, with individual exposures of 400 and 500 s for NGC 3783 and Mrk 509, respectively), it was not feasible to correct for this effect. However, as we will show in the next section, the amplitude of the features observed in the spectra of NGC 3783 and Mrk 509 are not only large and abrupt, but also they clearly coincide with the presence of emission lines in the spectra and have common patterns (see also the Q and U Stokes parameters presented in the Appendix), therefore demonstrating that they must be intrinsic in nature.
3 RESULTS
Figs 1 and 2 show the total flux (I), degree of polarization (p in percentage), polarized flux (p × I) and polarization position angle (PA) obtained from our observations of NGC 3783 and Mrk 509, before and after applying the corrections for polarization along the line of sight detailed in Section 2.3. In what follows, we will discuss the main results from the ISP-corrected observations.
3.1 Common features
The median value of the corrected PA spectra gives important information about the location of the scatterer medium when it can be contrasted with information about the geometry of the systems. In Fig. 3 we show the mean PA obtained through our spectropolarimetric observations and the projected axis of symmetry of the systems as obtained from dynamical evidence for NGC 3783 (Fischer et al. 2013) and radio observations for Mrk509 (Singh & Veestergard 1992). In both cases, we see that the angles are almost aligned, confirming that these two objects are dominated by equatorial scattering.
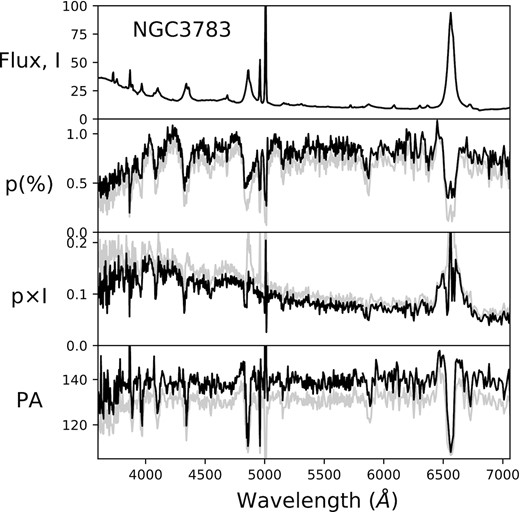
Rest-frame spectropolarimetry of NGC 3783. From top to bottom: total flux (I – in units of 10−15 erg s−1 cm−2 Å−1), degree of polarization (p in percentage), polarized flux (p × I in units of 10−15 erg s−1 cm−2 Å−1) and polarization position angle (PA in degrees). Black spectra correspond to data corrected for intervening ISP polarization, while grey spectra correspond to the data as observed.
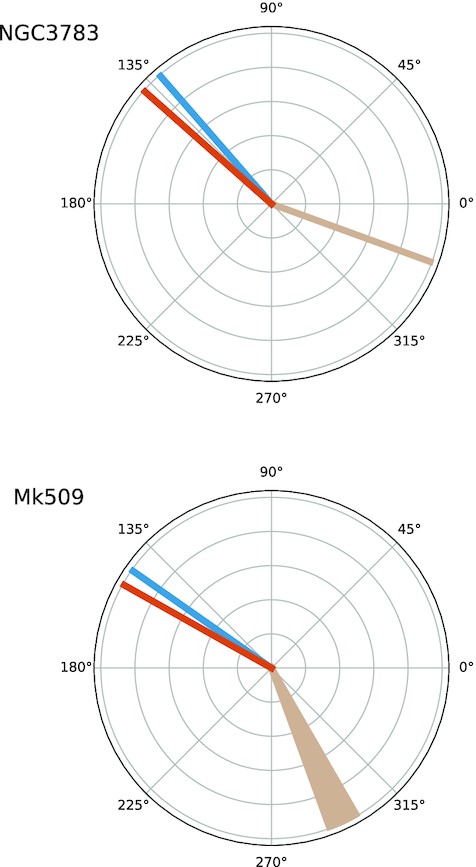
Comparison of the mean PA values determined from spectropolarimetry and other methods for our sources. The axis of symmetry of the systems as determined by Fischer et al. (2013) for NGC 3783 and Singh & Veestergard (1992) for Mrk 509, are shown in brown. Position Angles (PAs) derived by our observations are presented in blue (uncorrected values) and orange (corrected by Galactic ISP).
Our observations of both Seyfert 1 galaxies also show that the degree of continuum polarization p is essentially flat above ∼4000 Å arguing that electron scattering is responsible for the observed polarization. The p spectra also show strong decrements at the position of the core of the emission lines, indicating that the lines have a lower fraction of polarized flux than the continuum. There is also evidence, particularly clear in the case of NGC 3783, that the broad Balmer lines are flanked by high polarization shoulders coincident with the line wings. This is similar to what is found in other Seyfert galaxies, where the broad-line components seem more polarized than the surrounding continuum (e.g. Schmid et al. 2000), resulting in broader emission lines in polarized flux, as has been already discussed by Goodrich & Miller (1994) and Young et al. (1999) for the case of Mrk 509.
As observed by Young et al. (1999) the lower polarization at the line cores is indicative of an intrinsic lower polarization or of polarization at a significantly different position angle. To explain this further, consider the intensity of the polarized continuum and line flux as fcont and fline, respectively. Then for a ΔPA ∼ 0°, p × I ∼ fcont + fline; but if ΔPA ∼ ±90°, then p × I ∼ ±(fcont − fline). For 0 < ΔPA < ±90°, intermediate cases would be found.2 Hence, depolarization occurs for ΔPA ≠ 0, and therefore it is a direct consequence of a different spatial distribution of the emitting and/or scattering regions.3 Our observations clearly show that depolarization strongly affects the broad components of the emission lines.
PA rotation across the broad lines has long being recognized as common in Seyfert 1 galaxies (Goodrich & Miller 1994; Young et al. 1999; Schmid et al. 2000; Smith et al. 2002, 2004) and Afanasiev et al. (2019) recently published a compilation of spectropolarimetric data for 30 Seyfert 1 galaxies showing H α PA rotation from which black hole masses were derived. We observe PA rotation in both, Mrk 509 and NGC 3783 and will discuss the details in Sections 3.2 and 3.3.
The lower polarization below 4000 Å seen in Figs 1 and 2 is in striking contrast with the behaviour of the continuum observed in direct light, which rises steeply towards the blue in both galaxies. This has not been noticed in other Seyfert 1 galaxies before, although a marginal slope change in p might be present in previous observations of objects with spectra obtained below 4000 Å: Mrk 376, Mrk 704, I Zw 1 (Goodrich & Miller 1994; Smith et al. 1997), the exception being Fairall 51, whose p spectrum raises continuously towards the blue (Schmid et al. 2001; Smith et al. 2004).
A similar behaviour to that observed in the p spectra of NGC 3783 and Mrk 509 has already been observed in quasars (Antonucci 1988; Schmidt & Smith 2000; Kishimoto, Antonucci & Blaes 2003), and has been suggested as due to the presence of ‘small blue bump’4 (SBB) emission, which can dominate the continuum flux below 4000 Å. The SBB should be polarized in the same way as the BLR, as it appears as direct consequence of the emission line formation processes. Therefore, this pseudo-continuum will depolarize the continuum in the same manner as the broad emission lines, resulting in a lower polarized flux at the blue end of the spectra.
3.2 NGC 3783
Essentially no variation was found between the data obtained during our VLT and 3.6 m runs, which overlap in the 4060–5870 Å region. Hence, in what follows we directly compare the structure observed in the H α and H β emission lines obtained in the different runs.
The observed continuum polarization level is clearly higher than that observed by Smith et al. (2002), who reported observations obtained with the AAT. Our data (2006 April) show p ∼ 0.9 per cent at ∼131° before ISP correction, while Smith’s observations (1997 May; no ISP correction introduced) show |$p \sim 0.5{{\ \rm per\ cent}}$| at ∼136°. After correcting for ISP (see Section 2.3), the mean polarization is found to be |$p = 0.7 \pm 0.1{{\ \rm per\ cent}}$| in the 5300–5600 Å range. The PA spectrum is centred around 138 ± 2.5°. H α and H β clearly show a ‘M-shaped’ PA profile, with very deep central troughs. In higher order Balmer lines, the ‘shoulders’ of the M feature might however not be present, but the central deep troughs are still very conspicuous. This peculiar shape had already been seen in the H α line presented in the work of Smith et al. (2002), who interpreted it as possibly due to the effects introduced by the N ii doublet. This is clearly not the case, as we have shown that the NLR shows negligible polarization and the same profile is repeatedly seen in all Balmer transitions.
Fig. 4 shows the I, p, p × I, and PA spectra for NGC 3783 in arbitrary units. All spectra were continuum-subtracted using a low-degree spline polynomial fit for better inspection of the emission line features.
The presence of depolarization features at the location of emission lines and the SBB is more clearly appreciated in Fig. 4. For example, there seems to be hint of depolarization coincident with the He ii line at 4686 Å, while a much stronger signal is seem for He i at 5876 Å.
In the p × I spectrum the FWHM of H α is very broad, at ∼220 Å, almost three times the width of the line seen in total flux. Together with the coincidence of the PA with the projected axis of symmetry of the system, this is confirmation of scattering taking place in the equatorial plane of the system, as the velocity difference between the BLR and scattering material is not diminished by projection effects (Smith et al. 2005). The p × I spectrum is also fairly unusual in that the Balmer lines are seen only ‘in absorption’, with the exception of H α. Clearly, the depolarization in NGC 3783 at the line positions is very strong, suggesting that the lines and the continuum are polarized at very different angles. This is consistent with the very strong PA changes (∼30°) seen across the lines.
Notice also how the depolarization of the Balmer lines is blue-shifted with respect to the peak position of the lines seen in total flux. This can be seen when comparing the p and p × I spectra presented in Fig. 4. The PA troughs, however, are symmetric with respect to line centres.
3.3 Mrk 509
For Mrk 509 the H α and H β spectral regions were observed during the same observing run and therefore can be examined together. The red spectrum is however of low quality, and we present heavily binned data in Figs 2 and 4.
Variability in the scattering properties of Mrk 509 indicates that at least one scattering component corresponds to a compact region, probably located close to the BLR. In fact, Young et al. (1999) showed that the polarization level and position angle in the 4350–7100 Å range present a clear correlation in data compiled from 1985 to 1997, with p increasing from |$\sim 0.5{{\ \rm per\ cent}}$| at ∼140° to |$\sim 0.9{{\ \rm per\ cent}}$| at ∼155°, previous to any correction to the polarized signal due to an ISP component. Our uncorrected spectropolarimetric observations for Mrk 509 with |$p \sim 0.9 \pm 0.1 {{\ \rm per\ cent}}$| at ∼145 ± 2° in the 5300–5600 Å range, are in agreement with the previous trend. The ISP corrected values are |$p = 0.86 \pm 0.04 {{\ \rm per\ cent}}$| and PA = 150 ± 1°.
As with NGC 3783, the p spectrum of Mrk 509 is characterized by strong depolarization at the position of the emission lines. In the p × I spectrum the FWHM for H α is ∼120 Å, almost twice the width of the line seen in total flux, as expected for equatorial scattering. Contrary to what is observed in NGC 3783, no strong break is seen in the continuum at wavelengths ≲ 4000 Å in p × I flux shown in Figs 2 and 4, but some flattening is present.
The profiles of the Balmer lines change significantly along the PA spectrum, starting with a slightly asymmetric bump for H α (the quality of the data does not allow further characterization), to the appearance of a trough at the centre of the H β profile, with deeper troughs appearing in higher Balmer transitions. Notice that these troughs cannot be caused by the narrow line components, as it was already established that the polarization level of the NLR is very low. The PA shape for the higher transition Balmer lines resembles the ‘M-shaped’ profile observed in NGC 3783. This is particularly clear in the H γ, H δ, and H ϵ transitions. The pattern is, however, more symmetric than in the case of NGC 3783, with the central trough and the shoulders of the M feature showing similar amplitudes.
Several previous spectropolarimetric observations of Mrk 509 have been published (Goodrich & Miller 1994; Young et al. 1999; Schmid et al. 2000; Smith et al. 2002; Afanasiev et al. 2019). Of particular particular interest are those by Goodrich & Miller (1994) and Schmid et al. (2000), taken in 1985–1987 and 1999, respectively, because of the high signal-to-noise ratio of the data and because the observations by Goodrich & Miller (1994) extend to the blue and include the H β line.
Since none of the works mentioned above corrected their observations for ISP effects, it is important first to look at the changes introduced by this correction. As can be seen in Fig. 2, and in more detail in Fig. 5, the ISP correction flattens the PA signal across the H α emission line, although little change is seen in p. Fig. 2 also shows that the changes in the PA profile shape of the H β line are less significant. Since the PA profile is of particular interest it is safer to refer only to the uncorrected spectra in what follows.
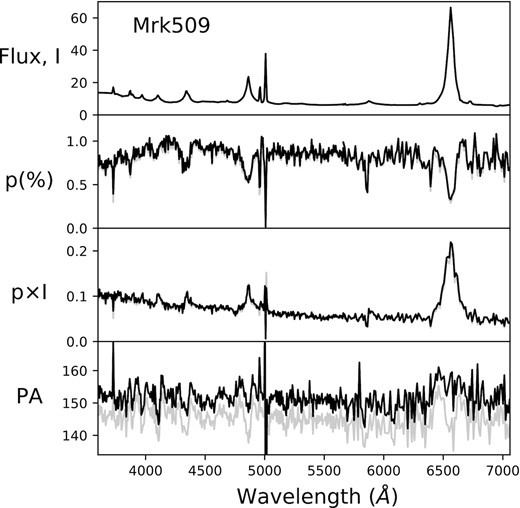
Rest-frame spectropolarimetry of Mrk 509. From top to bottom: total flux (I in units of 10−15 erg s−1 cm−2 Å−1), degree of polarization (p in percentage), polarized flux (p × I in units of 10−15 erg s−1 cm−2 Å−1) and polarization position angle (PA in degrees). Black spectra correspond to data corrected for intervening ISP polarization, while grey spectra corresponds to the data as observed.
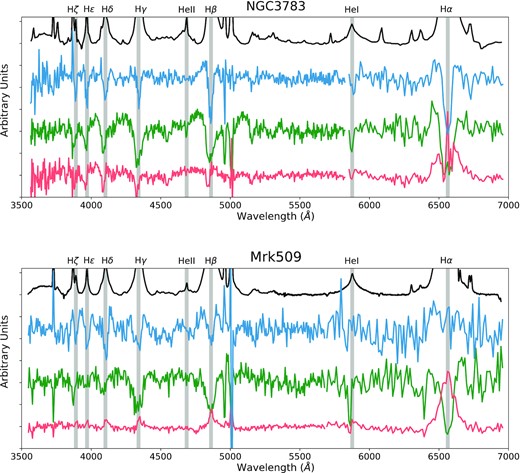
I (black), PA (blue), p (green), and p × I (red) spectra for NGC 3783 (top) and Mrk509 (bottom). All spectra have been continuum subtracted to allow for a better inspection of the line features. Vertical lines have been drawn to coincide with the central wavelength of the Balmer and He emission lines.
ISP corrected and uncorrected p (left-hand panel) and PA (right-hand panel) spectra of Mrk 509 in the H α spectral region.
Comparing the PA spectra of Goodrich & Miller (1994), Schmid et al. (2000), and our uncorrected data (grey lines in Fig. 2) shows that the blue side of the H α line is very similar in all three cases: a rise followed by a drop that coincides with the centre of the emission line and with a total amplitude of ∼20–25 degrees. The red side in our data, however, differs from the other two cases, with a second rise centred at ∼6635 Å that reaches above the continuum level and that is not seen in Goodrich & Miller or Schmid’s spectra. This could be explained by noise, as our data obtained for the red (600R grism) spectrum are of low quality. However, it is also important to notice that a pure equatorial scattering model predicts that the centre of the line should coincide with the point where the sinusoidal PA profile crosses the level of the continuum emission (Smith et al. 2005; Savić et al. 2018; Lira et al. 2020), and not with the lowest point of the trough, which is the case of Mrk 509 and seen in all observations. This is already indication of a departure from the basic equatorial scattering picture.
Besides, the PA spectrum presented in Goodrich & Miller (1994) hints that the H β profile seems different from that seen in H α, with a narrow drop and wings that quickly rise back to the continuum level on both sides of the line, as it is also the case when inspecting our observations presented in Fig. 2.
4 MODELLING
Recently, Lira et al. (2020) have explored the BLR polarized signal for different geometrical and dynamical scenarios, and have found that equatorial scattering can give rise to a wide range of PA profiles. In particular, they have been able to obtain profiles similar to those first proposed by Smith et al. (2002, 2004), but also M-type profiles that resemble those observed in NGC 3783 and Mrk 509. These last models required that (1) the BLR and a scattering media are coincident, (2) both regions undergo Keplerian rotation, (3) the scatterer must be optically thin in the polar direction but offer enough optical depth to photons escaping at low angles with respect to the disc geometry, and (4) the scattering medium presents a significant outflowing velocity.
4.1 Exploration of parameter space
In this section, we will present variations to the modelling carried out in Lira et al. (2020) in order to fit our observations. Essentially, we would like to determine the physical characteristics of the BLR and the scatterer invoking a model that is able to reproduce most of the key aspects of the data, such as the behaviour observed in the p and PA spectra at the location of the BLR emission lines. All models have been obtained using the stokes software (Goosmann & Gaskell 2007; Marin et al. 2012). Other examples of stokes modelling and capabilities can be found in Marin, Goosmann & Gaskell (2015), Marin (2018), Rojas Lobos et al. (2018) and Savić et al. (2018, 2020).
One caveat that needs to be explained at this point is that while the BLR is an optically thick emitting source, stokes does not allow for such structures. Instead, once an emitting source is defined, all its volume is responsible for emitting line photons at random directions. Hence, the anisotropic nature of the emission from BLR clouds (e.g. Pancoast et al. 2014) cannot be incorporated in our models. Furthermore, as the scattering region is required to be optically thin in the polar direction, ultra thin BLR and scattering discs are adopted. This is not a good physical representation of the sources, but it is required by the current limitations of the modelling. A better motivated representation would correspond to optically thick emitting clouds surrounded by a thin atmosphere of outflowing gas.
In Fig. 6, we present the PA and p spectra for several variations of the base model already presented in Lira et al. (2020). The base model consists of what is known for NGC 3783 in terms of its central black hole and the location of the BLR: a 4 × 10⁷ M⊙ in mass surrounded by a Keplerian-rotating, thin-disc-like BLR. The line emission generated by this BLR is centred at 6563 Å and has an intrinsic width of 50 Å or 2286 km s−1. The scattering region is coincident with the BLR, has a density of at least 5 × 10⁶ electrons per cm−3, and presents Keplerian rotation as well as an equatorial outflowing wind. Crucially, the PA profile from this base model shows a M-type PA profile, characterized by the peaks and central trough having similar amplitudes (see Lira et al. 2020), which is close to what is seen in the higher order Balmer lines in Mrk 509 but a bad match for the profile seen in NGC 3783, which is characterized by a very deep central trough, and so variations to this base model need to be explored.
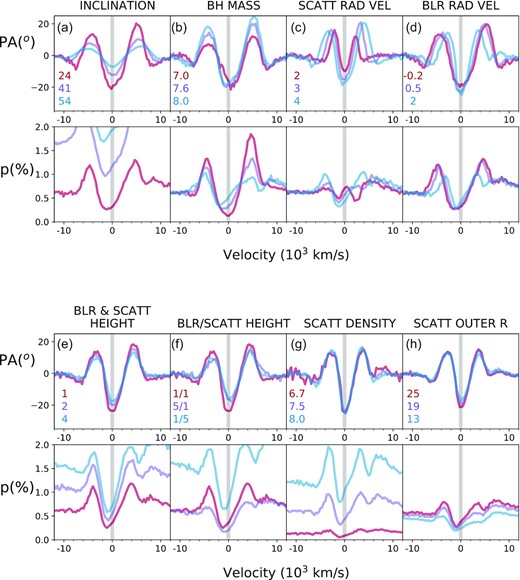
Changes in PA and p spectra as a function of the following model parameters: (a) inclination (viewing) angle (in degrees; notice that the p spectrum for the 54 degree inclination is off the plot), (b) log of BH mass (in M⊙), (c) scatterer radial velocity (in 103 km s−1), (d) BLR radial velocity (in 103 km s−1), (e) BLR and scatterer height (in milli-pc), (e) BLR/scatterer height ratio (in milli-pc), (g) log of scatterer density (in cm−3), (h) scatterer outer radius (in milli-pc). Colour-coded values are presented in each panel. For further details see Table 1.
In Fig. 6, panel a, we show that the amplitude of the M feature is a strong function of the line-of-sight angle (i), as the PA is subject to a scaling by a cos (i) factor (i ∼ 0 corresponds to a face-on disc). The level of polarization, p, suffers the opposite effect, as a face-on orientation gives a null p value due to complete geometrical cancellation for a perfectly circular geometry (notice that in panel a the p spectrum for a 54 degree inclination angle is off the plot).
BH mass has a great impact on both, the PA and p spectra (panel b in Fig. 6) for a BLR located at the same physical radius from the central BH. The PA spectrum develops stronger shoulders for massive BHs, with the redwards shoulder being more prominent. The p line shape shows a strong asymmetric ‘U’ shape for low BH masses, becoming less prominent and skewed towards the blue for larger BH masses. Notice that the continuum p level remains constant regardless of the BH mass.
Panels c and d in Fig. 6 show that the shape of the PA and p profiles strongly respond to the radial speeds of the BLR and scatterer. In general terms, as the radial velocity vrad of the scatterer increases (panel c), the M profile gets amplified, becoming broader and with larger peaks and troughs. In all cases, the continuum p level remains constant, while at the line position complex, although low-amplitude structure appears. The p profile develops a M-type profile for vrad > 3000 km s−1. Notice also how the trough of the p profile becomes skewed towards the blue for the largest vrad value.
Strong changes in PA are also seen for different values of the BLR radial velocity (panel d in Fig. 6). The profile becomes wide and less deep for negative (inflow) velocities. Likewise, it becomes narrower and deeper for larger outward speeds. Similar trends are seen in the p spectra.
Panels (e)–(h) in Fig. 6 present the dependency on the disc height, outer radii, and electron density. As can be seen, these changes mostly affect the p spectra, with only small changes introduced to the PA morphology.
The heights of the BLR and scattering media have a large effect on the observed value of the continuum of the p spectra. For equal height of both media (panel e), the continuum level rises by |$\sim 50{{\ \rm per\ cent}}$| each time the height is doubled (from 0.001 to 0.002 to 0.004 pc). The ratio between the thickness of the BLR and scattering media shows that while a BLR spatially thinner than the scatterer boosts the p continuum, the opposite happens when the BLR is thicker than the scatterer (panel f). Interestingly, the profile of the line in the p spectrum shows reduced shoulders in this last case, which seems a closer match to the Mrk 509 data.
It is found that the physical thickness of the disc is somewhat degenerate with the electron density ρe (panel g) in that both parameters largely control the level of continuum polarization p without altering the PA spectrum. Changes in electron density, however, introduces strong changes in the line observed in the p spectrum, with the amplitude of the profile becoming larger for higher values of ρe, and also resulting in the appearance of very strong and sharp shoulders, which is not seen by increasing the BLR and/or scatterer height. Notice also that any structure with a height larger than 0.001 pc will become optically thick in the vertical direction for electron densities above ρe = 108 cm−3.
The radial location of the scattering medium also impacts the observed profiles, but to a lesser degree. Panel (h) of Fig. 6 presents models for a scatterer starting at 0.005 pc and with outer edges at 0.025, 0.019, and 0.013 pc. It shows that the impact in the PA profiles is insignificant, while some changes are observed in the p spectra. As expected, the larger the overlap between BLR and scatterer, the higher the polarization fraction.
Table 1 summarizes the different parameter values presented in Fig. 6. Variations of several parameters, however, do not simply correspond to the combination of the different features shown in Fig. 6 as this is clearly a non-linear problem. In particular, it was found that varying velocity radial profiles were needed to properly account for the observed properties when modelling NGC 3783 and Mrk 509 in the following sections.
Parameter values for Fig. 6.
| General parameters | BLR parameters | Scatterer parameters | |||||||||
|---|---|---|---|---|---|---|---|---|---|---|---|
| Panel | Inclination | log MBH | Rin | Rout | Height | vrad | Rin | Rout | Height | log ρe | vrad |
| degs | M⊙ | mpc | mpc | mpc | 103 km s−1 | mpc | mpc | mpc | cm−3 | 103 km s−1 | |
| a) | 24 41 54 | 7.6 | 4 | 30 | 1 | 0 | 4 | 30 | 1 | 7.5 | 5 |
| b) | 24 | 7.0 7.6 8.0 | 4 | 30 | 1 | 0 | 4 | 30 | 1 | 7.5 | 5 |
| c) | 24 | 7.6 | 4 | 30 | 1 | 0 | 4 | 30 | 1 | 7.5 | 2 3 4 |
| d) | 24 | 7.6 | 4 | 30 | 1 | −0.2 0.5 2 | 4 | 30 | 1 | 7.5 | 5 |
| e) | 24 | 7.6 | 4 | 30 | 1 2 4 | 2 | 4 | 30 | 1 2 4 | 7.5 | 5 |
| f) | 24 | 7.6 | 4 | 30 | 1 5 1 | 2 | 4 | 30 | 1 1 5 | 7.5 | 5 |
| g) | 24 | 7.6 | 4 | 30 | 1 | 2 | 4 | 30 | 1 | 6.7 7.5 8.0 | 5 |
| h) | 24 | 7.6 | 4 | 30 | 1 | 2 | 4 | 25 19 13 | 1 | 7.5 | 5 |
4.2 Spectropolarimetric modelling of NGC 3783 and Mrk 509
In what follows, we will present the best-fitting modelling obtained for several emission lines observed in polarimetric mode for NGC 3783 and Mrk 509. We will not attempt to give a physical interpretation of how the polarized signal arises as a result of the different adopted parameters, as Lira et al. (2020) showed that the complex nature of these models makes a straightforward analysis a rather difficult task. Instead, we will interpret the best-fitting parameters in the context of what is already known about these two sources.
The parameter space was explored carefully in order to determine the ‘best fit’ models. Unfortunately, an MCMC procedure was not adopted because of time restrictions given the large number of possible variables and the expense of every single simulation. Instead, we manually tested different parameter combinations after identifying how the models responded to parameter changes, as already shown in Fig. 6. The most important observational constraints come from the Reverberation Mapping (RM) results for both sources, as presented by Onken & Peterson (2002) for NGC 3783 and Peterson et al. (2004) for Mrk 509.
One aspect of the modelling that is important to address now is that different emissivity profiles as a function of radius will be adopted for the different lines in the Balmer series. This seems counterintuitive at first, since all of them are produced by electron recombination to the same ion, H+. However, it is well established that for very high electron and flux densities, as is the case of the BLR, the Balmer lines are not produced under the same physical conditions. This is because the populations of excited states of neutral Hydrogen not only cannot be neglected, but also are proportional to the flux of ionizing photons (e.g. Ferland, Netzer & Shields 1979; Ferland et al. 1992). An important consequence is that different Balmer lines are formed at different distances from the central nucleus, which is clearly demonstrated by reverberation mapping results, with the weighted mean delays for the first three lines in the series found to be τ(H α):τ(H β):τ(H γ) = 1.54: 1.00: 0.61 (Bentz et al. 2010). It is then natural that different emissivity radial profiles are also adopted when analysing different lines of the Balmer series.
The goodness of the fits were checked applying χ2 tests to the features observed in the normalized Stokes Q/I (q) and U/I (u) data. Using q and u instead of the PA and p is less problematic since it does not suffer from degeneracies, p being always positive (while q and u can be positive or negative) and PA also presenting a sign degeneracy. By normalizing the Q and U spectra by the total intensity I, the results become independent of the brightness of the source (and model, as the strength of the line is given by the number of simulated photons, which is completely arbitrary) and allows us to examine only the level of fractional polarized flux. In what follows, we present and discuss the best-fitting results as seen in the p and PA spectra, but the reader can also find the q and u fitting results in the Appendix.
Fits to the data were obtained within ± 15 000 km s−1 of the line centres, which ensures that the line features as well as the continuum level were properly taken into account. The intrinsic PA value corresponding to the continuum level was subtracted from the PA spectra so that it became consistent with a position of 0 degrees. The regions corresponding to the O iii emission lines near H β have been masked from the fitting procedure for both sources. Physical parameters of the BLR and scattering regions are found in Table 2. As was already discussed in the previous section, the outer radii of the scatterer region does not change the modelling results significantly as long as the value is at least a few times that of the inner radii and hence are not included in Table 2.
Best-fitting parameters for NGC 3783 and Mrk 509.
| Object / Model parameter value | Observed value | Reference |
|---|---|---|
| NGC 3783 | ||
| MBH = 3.5 × 10⁷ M⊙ | 2.4–3.5 × 10⁷ M⊙ | Onken & Peterson (2002) |
| Assumed inclination angle = 24 degrees | |$23^{+16}_{-10}$| degrees | GRAVITY Collaboration (2021) |
| BLR innermost radius Rin = 0.003 pc (1 × 10³RSch) | – | – |
| BLR line emissivity profile ∼r−1/2 | – | – |
| BLR peak emissivity radii (H γ, H β, H α) = 4, 6, 10 × 10−3 pc (1, 2, 3 × 10⁶ RSch) | H β RM results = 6–8 × 10⁻³ pc | Onken & Peterson (2002) |
| BLR radial velocity = 2500 km s−1 | – | – |
| BLR and scatterer height = 0.001 pc (335 RSch) | – | – |
| Scatterer innermost radius Rin = 0.001 pc (1 × 10³RSch) | – | – |
| Scatterer electron density ne = 3 × 107 cm−3 | – | – |
| Scatterer vertical Thompson opacity τ = 0.07 | – | – |
| Scatterer horizontal Thompson opacity τ = 2.0 | – | – |
| Mean free path of photons = 0.015 pc (5 × 10³RSch) | – | – |
| Scatterer outflow velocity = 8000 km s−1 at 0.002 pc; 4000 km s−1 at 0.035 pc | – | – |
| Mrk 509 | – | – |
| MBH = 1.4 × 10⁸ M⊙ | 1.4 × 10⁸ M⊙ | Peterson et al. (2004) |
| Assumed inclination angle = 24 degrees | – | – |
| BLR innermost radius Rin = 0.02 pc (2 × 10³RSch) | – | – |
| BLR line emissivity profile ∼r−1/2 | – | – |
| BLR peak emissivity radii (H δ, H γ, H β) = 2, 6, 10 × 10−2 pc (2, 6, 10 × 105 RSch) | H β RM results = 6–8 × 10⁻² pc | Peterson et al. (2004) |
| BLR radial velocity = 2000 km s−1 at 0.02 pc; −1500 km s−1 at 0.1 pc | – | – |
| BLR and Scatterer height = 0.0015 and 0.003-0.005 pc (150 and 300-500, RSch) | – | – |
| Scatterer innermost radius Rin = 0.02 pc (2 × 10³RSch) | – | – |
| Scatterer electron density ne = 4 × 107 cm−3 at 0.02 pc; 6 × 106 cm−3 at 0.1 pc | – | – |
| Scatterer vertical Thompson opacity (at 0.1 pc) τ = 0.05 | – | – |
| Scatterer horizontal Thompson opacity τ = 3.2 | – | – |
| Mean free path of photons (at 0.1 pc) = 0.077 pc (8 × 10³RSch) | – | – |
| Scatterer outflow velocity = 6000 km s−1 at 0.02 pc; 1000 km s−1 at 0.15 pc | – | – |
One observational constraint for both, NGC 3783 and Mrk 509 is that the level of fractional polarization p remains relatively constant throughout most of the observed wavelength range (although it shows a slight increase towards the blue in Mrk 509), except below 4000 Å where it presents a clear drop, as previously discussed. This means that the height and electron density of the BLR and scattering region cannot vary strongly with radii, otherwise the level of the continuum p would not stay at the same level, unless opposite effects just cancel each other.
4.3 Best fit to NGC 3783
The best-fitting solutions for the H α, H β, and H γ PA and p spectra are presented in Fig. 7. We adopted the highest BH mass allowed by the derivation of Onken & Peterson (2002) and an inclination angle of 24 degrees, both values in very good agreement with the new estimates by the GRAVITY Collaboration (2021). The reduced χ2 is given for each Balmer line and spectrum. The only difference between the modelling of the H α, H β, and H γ emission lines is in their emissivity profiles. They are all characterized by a ∼r−1/2 function but have different starting radii and normalizations. All other parameters defining the BLR and scatterer remained fixed for the best-fitting model shown in Fig. 7.
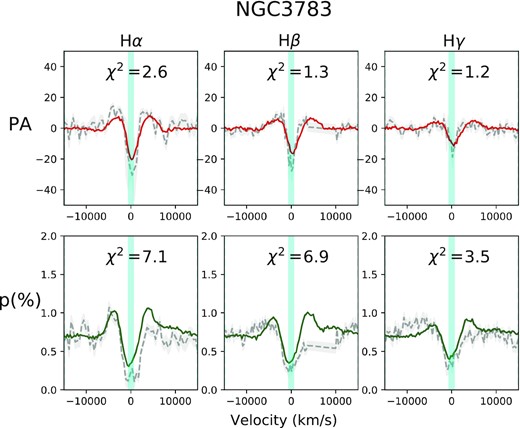
Best-fitting model for NGC 3783 PA (top row) and p spectra (bottom row). Data are shown with grey dashed lines and errors are presented as a grey region around the data. A best-fitting model corresponds to the model with the best sum of χ2 from all fits to H α, H β, and H γ. Data between −15 000 and +15 000 km s−1 from the line centres were considered in the fits, with the O iii lines masked out bluewards of H β.
NGC 3783 shows a persistent decrease in the amplitude of the M-type profiles towards higher transition Balmer lines, as seen in the PA as well as the p spectra. The shoulders of the M features also become less sharp. On the other hand, the p continuum remains largely constant. The main challenge was to find a parameter combination that would yield sufficient p continuum without too sharp and large shoulders in the PA and p lines but still a large trough for the PA M profile.
It is found that a deep trough in the line profiles can be achieved by the combination of a small BH mass and large radial outflows in both, the BLR and scattering medium. The scatterer wind velocity changes from 8000 km s−1 close to the nucleus to 4000 km s−1 at 0.03 pc in radius. This profile was modelled as an equally spaced step function with steps of 1000 km s−1. The BLR wind velocity was explored in steps of 500 km s−1 and it did not vary with radius. Gaussian and exponential emissivity profiles were also tested besides the ∼r−1/2 law, but gave poor results. The width of the scattering region is found to be 0.4 times its innermost radius, although we remind the reader that this width is more representative of the width of an atmosphere around the BLR region than an actual disc width. The innermost radius of the scattering region was found to be 0.003 pc, which corresponds to half of the distance to the accretion disc B-band emission peak, and 2.5 times smaller than the outskirts of the disc as detected in the Jband (Lira et al. 2011), which is also coincident with the RM lag for H β (Onken & Peterson 2002). Interestingly, using polarization RM for NGC 4151 it has been shown that the location of the equatorial scatterer is found to coincide with the lag measurements for C iv and H β (Gaskell et al. 2012).
In general, the models better reproduce the PA signatures than the structure observed in the p spectra, in particular the continuum p in the vicinity of the line. This could be due to the limiting geometrical options available to our modelling, as already discussed above. Besides, no flaring or warping of the Scatterer can be explored. Still, the model follows well the general shape of the troughs and it shows the slight asymmetry observed at the centre of the line, particularly in the profiles of H β and H γ.
4.4 Best fit to Mrk 509
The PA and p line features in Mrk 509 are broader and show less amplitude than those seen in NGC 3783. As already discussed in Section 4.1, it would seem that the BH mass would be sufficient to explain the differences in PA profile between NGC 3783 and Mrk 509. However, just as their BH masses differ by a factor of ∼5, the location of their BLRs differ by a factor of ∼10 (Onken & Peterson 2002; Peterson et al. 2004). Normalizing by their Schwarzschild radii, the BLRs are found at 2 × 10³ and 7 × 10³ RSch for NGC 3783 and Mrk 509, respectively. As a result, the Keplerian velocities imparted by the BHs at the distance of the BLR formation are rather similar in both objects.
Mrk 509 does not show an M-type PA profile in H α (see Figs 2,4,and 5 and the discussion in Section 3.3). Instead, the shape seems to be somewhat closer to the profile proposed by Smith et al. (2005). In H β a clear M PA profile is present and the troughs become more and more prominent in higher order Balmer lines. Given the low signal-to-noise of the H α data, in Mrk 509 we will model the H β, H γ, and H δ observed polarized features.
The observations show that while the PA profile seems to show an increase in trough amplitude when moving from H β to higher order Balmer transitions (H γ, H δ, and further), the opposite trend is seen in the p line profile. Unfortunately, we were not able to find a unique BLR–scatterer model that would reproduce this behaviour. The final model presented in Fig. 8 shows a successful fit the the features observed in the p spectra (continuum level and line features) but which is not able to follow the PA profile changes seen across Balmer lines.
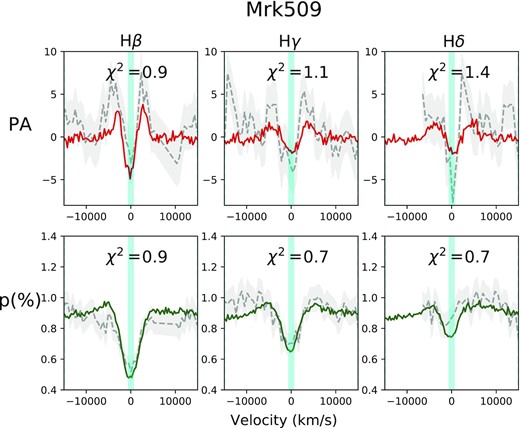
Same as Fig. 7 but for Mrk 509 for the H β, H γ, and H δ Balmer lines. Notice that the data for this object is of lower signal-to-noise than NGC 3783.
Comparison between our models presented in Section 5.1 and the PA profiles in Mrk 509 would suggest that the BLR radial velocity should change from an outflow at the radius where higher order Balmer lines are produced to an inflow at the distance where H α arises (see Fig. 6, panel d). This however, does not take into account that photons are not scattered in-situ, but where the optical depth in the scattering medium becomes ∼1. Choosing different scatterer electron densities the location where this condition is met can be modified. To obtain the correct p line profile and p continuum level, we found that the required parameters are: a ρe ∼ a few times 106 cm−3 and a disc height of at least 0.005 pc. Therefore the mean free path of photons along the mid-plane of the scattering disc is ∼0.1 pc and changes in the velocity field would be smeared within this spatial scale. Since RM results show that all Balmer emission lines should be produced within ∼0.1 pc from the nucleus in Mrk 509, for ρe ∼ 106 cm−3 photons will travel freely from regions characterized by inflowing motions to those characterized by outflowing motions without preserving a characteristic kinematics.
In order to decrease the level of smearing of the distinct kinematics within the BLR and scattering disc, we opted for models where larger electron densities were found at smaller radii. Hence those regions became more optically thick and photons were scattered closer to the characteristic radius where they were produced. This strategy reduced by about half the characteristic radii inside which higher order Balmer lines were scattered, but it was not effective enough to solve our problem of the mismatch between the behaviour of the PA and p spectra. MCMC exploration of the parameter space might solve this issue but it is beyond what can be presently done.
The final model is presented in Fig. 8. As with NGC 3783, emissivity profiles were described by a r−1/2 law with different starting radii for different Balmer lines. To isolate regions with different kinematics, the starting (and peak) emissivity for H β was chosen to be 0.1 pc, slightly larger than the 0.06–0.08 pc determined from RM results. The scatterer density decreases from 4 × 107 cm−3 at 0.02 pc to 6 × 106 cm−3 at 0.1 pc and it stays constant at larger radii. The BLR radial velocity also varies from an outflow of 2000 km s−1 in the inner part to an inflow of −1500 km s−1 at 0.1 pc. The scatterer, on the other hand, always presents an outflowing radial motion with speeds of 6000 km s−1 in the inner part and reaching a velocity of 1000 km s−1 at ∼ 0.15 pc. Keeping the scatterer and BLR compact (<0.15 pc) resulted in less pronounced shoulders around the p profile. The typical width of the scattering region is found to be 0.2 times its innermost radius, half the value found for NGC 3783.
5 DISCUSSION
One of the most remarkable results from our spectropolarimetric observations is the change in the line profiles along the Balmer sequence, as observed in Mrk 509. This clearly reinforces the notion that the BLR is an extended source and that physical and dynamical conditions can rapidly change with radius in AGN nuclei. Furthermore, it demonstrates that powerful nuclear winds might exist in many Seyfert galaxies but their presence might only be revealed by observing high-order Balmer lines in polarized light.
The signatures of inflows and particularly outflows have been found in many AGNs. Their presence is also invoked by numerical simulations that require the AGN to modulate the star formation rate in their host galaxies (e.g. Harrison 2017; Veilleux et al. 2020), as well as holistic models of the AGN phenomenology (Elvis 2000, 2017). The so-called Warm Absorbers represent one of the most commonly observed nuclear winds: photoionized gas distances of ∼1–1000 pc, outflowing with velocities of hundreds of km s−1, are detected in the UV and X-ray spectra of |$\sim 50{{\ \rm per\ cent}}$| of Seyfert nuclei (Crenshaw & Kraemer 1999). Nuclear winds with more extreme properties, detected much closer to the accretion disc and with velocities of thousands of km s−1, have been observed in only a few sources such as NGC 5548 (Kaastra et al. 2014), NGC 985 (Ebrero et al. 2016), Mrk 335 (Longinotti et al. 2019), and NGC 3783 (Mehdipour et al. 2017; Kriss et al. 2019). They have been interpreted as clumpy outflows associated to the accretion disc (Laha et al. 2021), however, their exact nature remains unclear. The scarcity of these results might change with further spectropolarimetric observations of Seyfert 1 nuclei, while the larger collective area of future 30 m-class telescopes will be able to probe this in many nearby AGNs.
We have also shown that the modelling of the data obtained for NGC 3783 and Mrk 509 offers the opportunity to put significant constraints into the properties of these two sources. Even though we have not been able to fully explore the parameter space that governs the emission from these nuclei, and our models still suffer from many simplifications, we have shown that nuclear high-velocity winds are necessary to explain the observations. Our exploration of the parameter space demonstrate that variations in geometrical and dynamical quantities that characterize the BLR and the scatterer leaves a clear imprint in the PA and p spectra. Besides, as already discussed in Savić et al. (2018) and Lira et al. (2020), the modelling shows that in the absence of a strong radial wind the profile of the lines seen in spectropolarimetric observations reverts to that proposed by Smith et al. (2002, 2004, 2005).
As already mentioned, recent Swift, XMM–Newton, NuSTAR, and HST observations of NGC 3783 have detected the presence of a nuclear wind in this source from the follow up of an obscuring event taking place in 2016 December (Mehdipour et al. 2017). The event allowed for the findings of several new absorption features that revealed the existence of outflowing material with velocities of a few thousand km s−1 at distance of about 10 light days (∼10−3 pc), in excellent agreement with the results from our stokes modelling. The changing features in the spectropolarimetric observations of Mrk 509 also demonstrate that these winds might be transient phenomena. Obscuring events such as the one observed in NGC 3738 are extremely rare, and reinforces the idea that spectropolarimetry might be the best tool to search for powerful nuclear winds in AGN.
ACKNOWLEDGEMENTS
PL acknowledges funding from Fondo Nacional de Desarrollo Científico y Tecnológico project #1201748. MK acknowledges support from Japan Society for the Promotion of Science grant 20K04029.
DATA AVAILABILITY STATEMENTS
The raw data underlying this article can be downloaded from the ESO Archive. The processed data will be shared on reasonable request to the corresponding author.
Footnotes
Details of the instrument optical components can be found here https://www.eso.org/sci/facilities/paranal/instruments/fors/inst/pola.html and here https://www.eso.org/sci/facilities/lasilla/instruments/efosc/inst/Efosc2PolarElements.html.
Note that this happens because the two signals are incoherent, and therefore their sum is not the result of the vectorial addition of plain waves, but of their Stokes vectors.
In the modelling presented in Section 4, depolarization will result from the different spatial distribution of the continuum and line emitting regions.
The ‘small blue bump’ corresponds to the Balmer continuum and a blend of higher order Balmer and Fe ii emission lines (Wills, Netzer & Wills 1985).
REFERENCES
APPENDIX A: Q AND U SPECTRA
Total flux and unnormalized Q and U ISP-uncorrected spectra are presented in Fig. A1. The zero level is shown in the Q and U figures with a grey line.
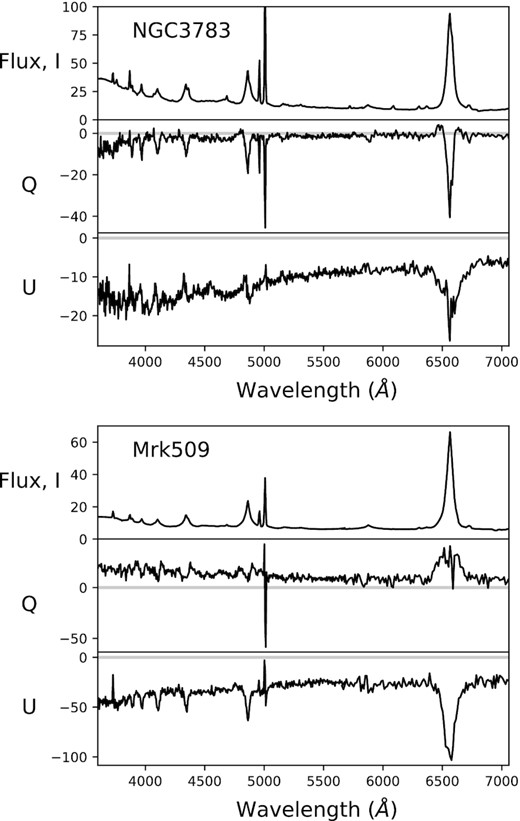
Total flux and unnormalized Q and U ISP-uncorrected spectra for NGC 3783 (top) and Mrk 509 (bottom). The I spectra is presented in units of 10−15 erg s−1 cm−2 Å−1 while the Stokes spectra are shown in units of 10−17 erg s−1 cm−2 Å−1 for both objects.
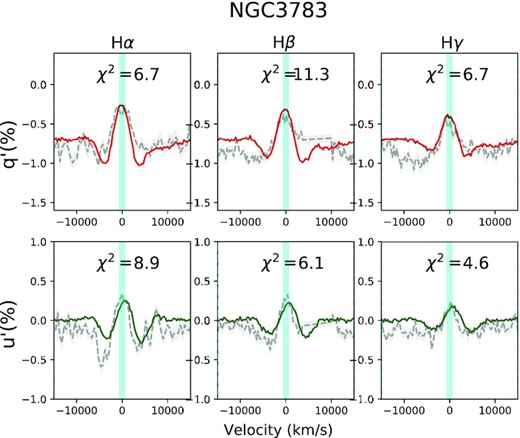
Best-fitting model for NGC 3783 q′ and u′ spectra (top and bottom row, respectively). Data are shown with grey dashed lines and errors are presented as a grey region around the data. A best-fitting model corresponds to the model with the best sum of χ2 from all fits to H α, H β, and H γ. Data between −15 000 and +15 000 km s−1 from the line centres were considered in the fits, with the O iii lines masked out bluewards of H β.
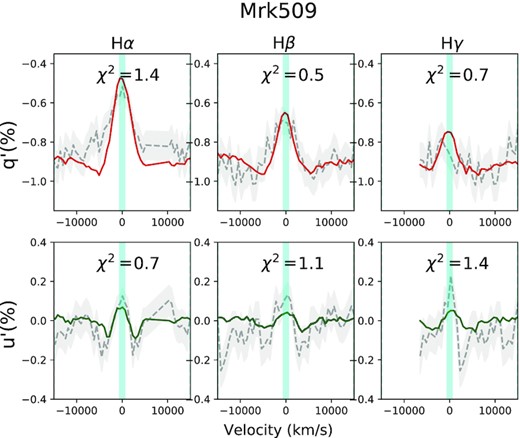
Same as Fig. B1 but for Mrk 509 showing the q′ and u′ spectra and modelling for the H β, H γ, and H δ Balmer lines.
The Q spectrum of NGC 3783 and U spectrum of Mrk 509 show strickingly clear the coincidence of strong changes in polarized flux at the position of the full Balmer series.
APPENDIX B: Best-fitting results in q and u space
In the same manner that the PA spectral continuum level was taken to zero degrees in order to be compared with model results in Section 4.2, the q and u spectra were rotated so that the continuum level in the u spectra corresponded to zero flux (e.g. Landi Degl’Innocenti, Bagnulo & Fossati 2007). These new spectra are denoted as q′ and u′.
The q′ and u′ spectra for NGC 3783 and Mrk 509 are shown in Figs B1 and B2, respectively. The fractional fluxes are expressed in percentage. For NGC 3783 q′ and u′ look remarkably similar, while for Mrk 509 the q′ spectrum shows more strongly polarized lines and more symmetric profiles than the u′ spectrum.
The best-fitting models to the q′ and u′ spectra are overplotted and the best-fitting χ2 values for each line are shown in the subpanels. NGC 3783 presents rather high values of χ2 and several wiggles seen in the data are not seen in the model and viceversa. This could be due to non-negligible atmospheric depolarization (Section 2.3), a non-perfect rotation of the q and u spectra, and shortcomings in our modelling capabilities, among other. The lower signal-to-noise data for Mrk 509 results in lower χ2 values.
Author notes
Deceased on 5 April 2012.
