


ABSTRACT
We present a pilot search of CO emission in three H2-absorbing, long-duration gamma-ray burst (GRB) host galaxies at z ∼ 2–3. We used the Atacama Large Millimeter/submillimeter Array (ALMA) to target the CO(3 − 2) emission line and report non-detections for all three hosts. These are used to place limits on the host molecular gas masses, assuming a metallicity-dependent CO-to-H2 conversion factor (αCO). We find, |$M_{\rm mol} \lt 3.5\times 10^{10}\, M_{\odot }$| (GRB 080607), |$M_{\rm mol} \lt 4.7\times 10^{11}\, M_{\odot }$| (GRB 120815A), and |$M_{\rm mol} \lt 8.9\times 10^{11}\, M_{\odot }$| (GRB 181020A). The high limits on the molecular gas mass for the latter two cases are a consequence of their low stellar masses M⋆ (|$M_\star \lesssim 10^{8}\, M_{\odot }$|) and low gas-phase metallicities (|$Z\sim 0.03\, Z_{\odot }$|). The limit on the Mmol/M⋆ ratio derived for GRB 080607, however, is consistent with the average population of star-forming galaxies at similar redshifts and stellar masses. We discuss the broader implications for a metallicity-dependent CO-to-H2 conversion factor and demonstrate that the canonical Galactic αCO will severely underestimate the actual molecular gas mass for all galaxies at z > 1 with |$M_\star \lt 10^{10}\, M_\odot$|. To better quantify this we develop a simple approach to estimate the relevant αCO factor based only on the redshift and stellar mass of individual galaxies. The elevated conversion factors will make these galaxies appear CO-‘dark’ and difficult to detect in emission, as is the case for the majority of GRB hosts. GRB spectroscopy thus offers a complementary approach to identify low-metallicity, star-forming galaxies with abundant molecular gas reservoirs at high redshifts that are otherwise missed by current ALMA surveys.
1 INTRODUCTION
Since long-duration gamma-ray bursts (GRBs) are linked to the death of massive stars (Hjorth et al. 2003; Stanek et al. 2003; Woosley & Bloom 2006; Cano et al. 2017), they are expected to trace star formation through cosmic time (Wijers et al. 1998; Kistler et al. 2009; Robertson & Ellis 2012; Greiner et al. 2015). GRB-selected galaxies therefore probe the underlying population of star-forming galaxies that are not biased towards the most luminous and massive galaxies unlike traditional emission-selected galaxy surveys. Moreover, the short-lived optical afterglows following GRBs are so bright that the plethora of absorption features that are imprinted from the interstellar medium (ISM) of the GRB host on the afterglow spectrum can be studied in detail (e.g. Jakobsson et al. 2004; Prochaska et al. 2007; Vreeswijk et al. 2007; Fynbo et al. 2009).
After the first few afterglow spectra were obtained it was clear that GRB-host absorption systems typically probe sightlines with the highest H i column densities of the so-called damped Ly α absorbers (DLAs; Vreeswijk et al. 2004; Jakobsson et al. 2006; Fynbo et al. 2009), related to their small impact parameters. DLAs provide the most effective and detailed probe of neutral gas in high-redshift galaxies and contain most of the neutral gas at high redshift (Noterdaeme et al. 2009). Given their direct link to star formation and the very high column densities of gas typically detected in GRB afterglow spectra, the low detection rate of molecular hydrogen H2 (from the UV Lyman–Werner bands) was initially a puzzle (e.g. Tumlinson et al. 2007; Ledoux et al. 2009). The first detection of H2 in a GRB absorber was observed in the remarkable afterglow spectrum of GRB 080607 (Prochaska et al. 2009).1 Since then, eight more H2-bearing GRB absorbers have been detected (Krühler et al. 2013; D’Elia et al. 2014; Friis et al. 2015; Bolmer et al. 2019; Heintz et al. 2019), largely owing to the extensive VLT/X-shooter GRB afterglow legacy survey (XS-GRB; Selsing et al. 2019). This GRB-selected sample of star-forming galaxies provides a unique way to study the molecular gas properties of high-z galaxies in absorption.
To fully exploit the detailed information of intervening or host galaxy DLAs, it is important to study the association with their galaxy counterparts in emission. This has been done extensively for GRB hosts at UV to optical wavelengths (e.g. Krühler et al. 2015; Arabsalmani et al. 2018a; Corre et al. 2018). Similarly, surveys targeting GRB hosts at sub-mm wavelengths, in particular the molecular emission from carbon monoxide (CO) have advanced over the last few years (Kohno et al. 2005; Endo et al. 2007; Hatsukade et al. 2007, 2011, 2014, 2019, 2020; Stanway et al. 2011, 2015; Michałowski et al. 2016, 2018; Arabsalmani et al. 2018b; de Ugarte Postigo et al. 2020), largely due to the commissioning of the Atacama Large Millimeter/submillimeter Array (ALMA). Until now, however, only blind surveys or individual detections of CO emission in GRB host galaxies have been carried out.
In the pilot study presented here, we target a uniformly selected sample of GRB hosts, all at z > 2, and identified solely on the basis of H2 in absorption. Contrary to the majority of absorption systems in quasar sightlines (but see Ranjan et al. 2020), we expect the bulk of the absorbing material to probe the ISM within the host galaxy, close to luminous regions of star-formation (e.g. Fruchter et al. 2006; Svensson et al. 2010). These systems will thus allow us to study the molecular gas-phase in the central-most regions of star-forming galaxies, for which information can be obtained from the two complementary methods relying on molecular absorption and emission features.
This paper is structured as follows. In Section 2, we present the sample criteria of our pilot study and the observational set-up. Section 3 presents the results in terms of the inferred molecular gas masses and how they compare to the overall population of GRB host galaxies. In Section 4, we place the GRB hosts in the context of the underlying population of star-forming galaxies and discuss how they allow us to probe the elusive high-z, low-metallicity regime. In Section 5, we summarize and conclude on our work.
2 SAMPLE AND OBSERVATIONS
2.1 GRB hosts with strong H2 absorption
We targeted the three GRB-hosts with strongest H2 absorption known to date, all at z > 2. These are: GRB 080607 (Prochaska et al. 2009), GRB 120815A (Krühler et al. 2013), and GRB 181020A (Heintz et al. 2019). All show H2 column densities above N(H2) > 1020 cm−2 and also constitute the GRB absorbers with the largest molecular-hydrogen fractions, |$f_{\rm H_2}$| (Bolmer et al. 2019; Heintz et al. 2019). GRB 080607 also shows a high absorption-derived gas-phase metallicity consistent with Solar ([X/H] >−0.2) and significant dust extinction AV ∼ 3 mag. On the contrary, GRBs 120815A and 181020A show relatively low metallicities of [X/H] ≈−1.5 and modest extinction in the line of sight (AV = 0.2 − 0.3 mag).
The host-galaxy emission counterpart of GRB 080607 is well detected in several bands (Chen et al. 2010; Wang, Chen & Huang 2012). Here, we adopt the stellar population properties derived by Corre et al. (2018), inferring log (M⋆/M⊙) = 10.45 ± 0.10. For the other two, more recently detected GRBs, no host-galaxy counterpart has been identified yet. For these, we instead rely on previous work connecting DLAs to their emission counterparts (Møller et al. 2013; Neeleman et al. 2013; Christensen et al. 2014). Following Arabsalmani et al. (2015), we assign an impact parameter of 2.3 kpc and compute the predicted stellar masses based on the prescription by Christensen et al. (2014, their equation 3). This yield stellar masses of log (M⋆/M⊙) = 7.9 ± 0.4 (GRB 120815A) and log (M⋆/M⊙) = 7.8 ± 0.4 (GRB 181020A), where the uncertainties are dominated by the internal scatter in log M⋆.
2.2 ALMA observations
We observed the fields surrounding GRBs 080607, 120815A, and 181020A, targeting the CO(3 − 2) emission line as part of a dedicated ALMA Cycle 7 programme (ALMA Programme ID: 2019.1.00407.S, PI: Heintz). At the redshifts of the GRB hosts (z ∼ 2–3), this line falls within the ALMA band 3 receiver. For each of the GRBs, we tuned one of the 1.875 GHz spectral windows to the redshifted CO(3 − 2) emission with a correlator setup yielding 960 channels with a width of 1.95 MHz. The remaining three bands were used to detect |$\approx \,$|95 GHz continuum emission in the fields. Observations were done in a compact configuration with maximum baselines ranging between 300 and 500 m depending on the observing block. Total on-source integration times were 3.1, 2.4, and 1.6 h for GRBs 080607, 120815A, and 181020A, respectively.
The raw data were calibrated using the ALMA Pipeline, which is part of the Common Astronomy Software Application package (CASA; McMullin et al. 2007). After the initial calibration, additional manual data editing was performed using the flagging routines within CASA. Both the continuum image as well as the spectral cube centred around the redshifted CO(3 − 2) line were obtained using the task tclean within CASA by applying natural weighting to maximize sensitivity to point sources. This resulted in spatial resolutions of (4.0 arcsec × 3.6 arcsec), (2.3 arcsec × 2.1 arcsec), and (3.8 arcsec × 3.5 arcsec) for GRBs 080607, 120815A, and 181020A, respectively. For all GRBs, we also Hanning-smoothed the spectral cube to a velocity resolution of 25 and 100 km s−1. The resultant sensitivities per 100 km s−1 are 94, 85, and |$94\, \mu$|Jy beam−1 for the spectral cube and 5.8, 5.7, and |$6.3\, \mu$|Jy beam−1 at 92.6, 96.0, and 92.9 GHz for the continuum image, for GRBs 080607, 120815A, and 181020A, respectively.
3 RESULTS
We searched both the 25 and 100 km s−1 channel width ALMA spectral data cubes for emission originating from CO(3 − 2) at the relevant redshifts for the GRBs in our sample. No line emission is detected at the position of any of the GRBs (but see, e.g. Neeleman et al., in preparation, for a detection of CO(2 − 1) from the strong intervening Mg ii absorber towards GRB 120815A). We also did not detect continuum emission at the positions of any of the three GRBs, but there appears to be continuum emission from an unrelated galaxy in the field of GRB 120815A.
We extracted 1D spectra from the ALMA spectral data cube centred on the positions of the GRB afterglows or host galaxies, shown in Fig. 1. We derived 3σ upper limits on the velocity-integrated flux densities of <0.09 Jy km s−1 (GRB 080607), <0.018 Jy km s−1 (GRB 120815A), and <0.016 Jy km s−1 (GRB 181020A), assuming line widths for the emission-line profiles of |${\rm FWHM} = 300\, {\rm km\, s^{-1}}$| (GRB 080607) and |${\rm FWHM} = 50\, {\rm km\, s^{-1}}$| (GRBs 120815A and 181020A), appropriate for galaxies in their given mass ranges (e.g. Tiley et al. 2016). We then derived the corresponding CO(3 − 2) line luminosities (following equation 3 from Solomon & Vanden Bout 2005) of |$L^\prime _{\rm CO(3-2)} \lt 4.56\times 10^{9}$| K km s−1 pc2 (GRB 080607), |$L^\prime _{\rm CO(3-2)} \lt 5.51\times 10^{8}$| K km s−1 pc2 (GRB 120815A), and |$L^\prime _{\rm CO(3-2)} \lt 7.12\times 10^{8}$| K km s−1 pc2 (GRB 181020A).
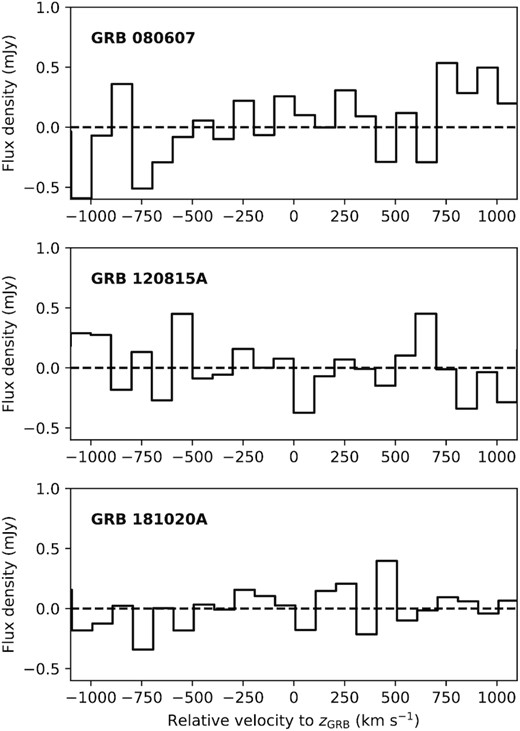
CO flux density as a function of velocity, where vrel = 0 km s−1 corresponds to the redshift of the absorbers, zGRB. None of the spectra show detection of CO(3 − 2) lines at the redshifts of the GRBs.
Sample properties of the H2-bearing GRB host galaxies.
| GRB | zGRB | log N(H2) | |$\log f_{\rm H_2}$| | [X/H] | AV | log M⋆ | |$L^\prime _{\rm CO(3-2)}$| | log Mmol |
|---|---|---|---|---|---|---|---|---|
| (cm−2) | (mag) | (M⊙) | (109 K km s−1 pc2) | (M⊙) | ||||
| 080607 | 3.0363 | 21.20 ± 0.20 | −1.23 ± 0.24 | >−0.2 | 2.58 ± 0.45 | 10.45 ± 0.10 | <4.56 | <10.54 |
| 120815A | 2.3582 | 20.42 ± 0.08 | −1.39 ± 0.09 | −1.45 ± 0.03 | 0.19 ± 0.04 | 7.90 ± 0.40 | <0.55 | <11.67 |
| 181020A | 2.9379 | 20.40 ± 0.04 | −1.51 ± 0.06 | −1.57 ± 0.06 | 0.27 ± 0.02 | 7.80 ± 0.40 | <0.71 | <11.95 |
In Fig. 2, we show the upper limits of the molecular gas-to-stellar mass ratio of the three GRB hosts. In each case, the molecular gas mass ratio is determined by using either the above αCO-metallicity relation and the host absorption-derived metallicities, or by assuming a constant MW-like conversion factor of αCO, MW = 4.3 |$M_{\odot }\, \mathrm{(K\, km\, s^{-1}\, pc^2)}^{-1}$| (Bolatto et al. 2013). For comparison, we overplot the recent compilation of CO observations of GRB host galaxies from Hatsukade et al. (2020), spanning the redshift range z = 0.0–2.5. In addition, we show the track that broadly characterizes the molecular gas mass evolution of M⋆ > 1010M⊙ main-sequence star-forming galaxies, Mmol/M⋆ = 0.1 × (1 + z)2 (Geach et al. 2011; Carilli & Walter 2013).
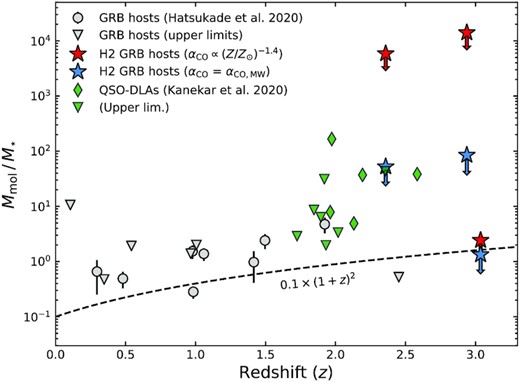
Molecular gas-to-stellar mass ratio for our three GRB host galaxy samples (star-symbols). Shown are the ratios assuming an MW-like CO-to-H2 conversion factor (blue) and using the αCO–metallicity relation (equation 1, red). Detections and upper limits for the GRB host sample from Hatsukade et al. (2020) and quasar DLAs (Kanekar et al. 2020) are also shown. The dashed curve shows the evolutionary track broadly characterizing |$M_\star \gt 10^{10}\, M_\odot$| main-sequence star-forming galaxies (Geach et al. 2011).
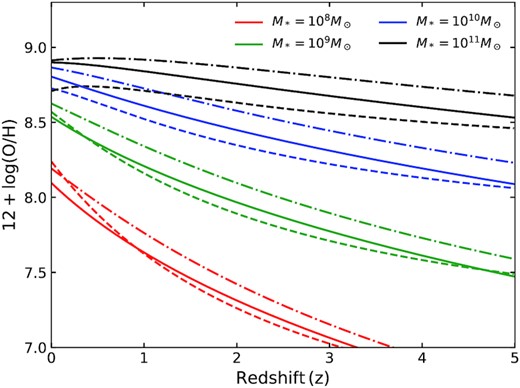
Metallicity as a function of redshift for four different galaxy stellar masses. Our fit to the relations in Maiolino et al. (2008) is shown with solid curves, while in Savaglio et al. (2005) is shown with dashed–dotted curves and in Genzel et al. (2015) is shown with dashed curves. Note that our fit lies in between the other two at all redshifts, except for the lowest masses at the lowest redshifts.
While the ratio of molecular gas mass to stellar mass of the hosts of GRBs 120815A and 181020A are poorly constrained, the host galaxy of GRB 080607 is only marginally consistent with that expected for typical star-forming galaxies at similar redshifts and stellar masses. This is in stark contrast with the population of DLAs at z ≳ 2 observed in quasar sightlines, shown as the green symbols in Fig. 2, which overall show a significant excess of molecular gas (Neeleman et al. 2018; Kanekar et al. 2020). Assuming a lower CO excitation of r31 = 0.4 (mostly representative of the z ≲ 2 population; Boogaard et al. 2020), however, results in a consistent limit on the molecular-to-stellar mass content. The high upper limits on the Mmol/M⋆ fractions of the hosts of GRBs 120815A and 181020A are mainly due to their low metallicities requiring high CO-to-H2 conversion factors to infer their molecular gas content. These host galaxies, however, also have lower stellar masses than the typical star-forming galaxies probed in CO at similar redshifts (e.g. Tacconi et al. 2013, 2018). In the next section, we will explore these particular high-redshift, low-mass, and low-metallicity hosts in context to the underlying field-galaxy population.
4 DISCUSSION
4.1 Field environment of GRB hosts
Studies of absorption-selected galaxies in the line of sight towards bright background quasars have revealed that many of these DLAs are found in environments with other nearby galaxies, both at low (Kacprzak, Murphy & Churchill 2010; Rahmani et al. 2018) and high redshifts (Francis & Hewett 1993; Møller & Warren 1993; Fynbo et al. 2003). These DLA counterparts have mostly been detected based on strong rest-frame optical emission lines, or from Ly α emission from the galaxy counterparts, but are now also being increasingly detected in CO (Fynbo et al. 2018; Klitsch et al. 2018). With the data presented here we can examine in an independent way whether GRB-DLAs also appear to be part of larger galaxy complexes.
Each ALMA cube covers ≈45 arcsec subtended on the sky, which corresponds to 350 kpc and 375 kpc at the target redshifts (z = 3 and z = 2.3), respectively. We do not detect emission from CO(3 − 2) in galaxies within the ≈±1500 km s−1 covered by the data cube, corresponding to z = ±0.02. We thus do not find evidence for galaxy clustering in this (albeit small) sample of CO-surveyed GRB hosts. The quasar-DLA bias towards CO-emitting galaxy groups could partly be explained by the preferential high-metallicity these systems were selected on. Consequently, absorption-line features in quasar sightlines could therefore be influenced by these more populated galaxy environments (e.g. Hamanowicz et al. 2020), rather than tracing the line of sight through a single galactic disc (Fynbo et al. 2018). GRB sightlines could therefore provide a cleaner probe of absorption-derived quantities and correlations (e.g. Arabsalmani et al. 2015, 2018a).
4.2 Mass and redshift dependence of αCO
One of the most promising aspects of studying the CO emission associated to GRB hosts, is that it allows us to probe the molecular gas content in low-metallicity galaxies which are otherwise missed by field-selected surveys. As metallicity decreases both with increasing redshift and decreasing galaxy mass, we expect αCO to show a strong mass and redshift dependence. In fact, even a metallicity of |$Z/Z_{\odot } \approx 10{{\ \rm per\ cent}}$| would imply an αCO value more than an order of magnitude higher than the average Milky Way conversion factor αCO, MW. The reason why this is still largely applied to high-redshift galaxies, is due to the difficulty in measuring the gas-phase metallicity in low-metallicity, low-luminosity galaxies. Below, we aim to improve on this and present a simple relation that conveniently expresses the CO-to-H2 conversion factor, in addition to the Mmol/M⋆ ratio, as a function of stellar mass and redshift.
Based on this combined relation, we explore how αCO evolves in typical star-forming galaxies as a function of redshift and stellar mass. We show these evolutionary tracks in Fig. 4 for a set of representative redshifts and stellar masses, namely z = 0, 1, 3, 5 and |$M_{\star } = 10^{8},10^{9},10^{10},10^{11}\, M_{\odot }$|. The shaded error regions on each curve represent the combined errors from the typical dispersion around the mass–metallicity relation (σMZ = 0.2 dex) and the scatter in the best-fitting αCO–metallicity relation. In the figure, we also compare the evolution of αCO to the average values observed in the Milky Way and in local galaxies (i.e. equivalent to solar metallicities) of αCO, MW = 3.5–5.5 |$M_{\odot }\, \mathrm{(K\, km\, s^{-1}\, pc^2)}^{-1}$| (Bolatto et al. 2013).
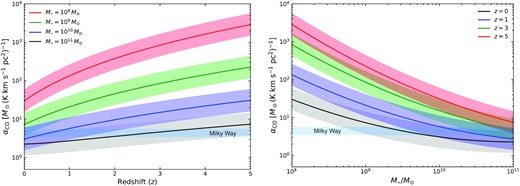
The evolution of the molecular gas mass to CO(1 − 0) luminosity ratio, αCO, for regular star-forming galaxies typical galaxy scaling relations. The left-hand panel shows the evolution as a function of redshift for selected galaxy stellar masses and the right-hand panel shows the corresponding evolution as a function of stellar mass for the given redshifts. The shaded error region on each curve represents the combined errors from the mass–metallicity relation and αCO–metallicity relation (see the main text for more details). The average value observed in the Milky Way is shown with the blue horizontal band in both panels.
As suggested by the mass–metallicity relation (equation 2), the evolution of αCO depends strongly on both galaxy mass and redshift. We find that the Galactic conversion factor αCO, MW is a suitable approximation for massive galaxies, with |$M_\star \sim 10^{11}\, M_{\odot }$|, at all redshifts in the range z = 0–5. Similarly, galaxies at z ∼ 0 with stellar masses in the range |$M_{\star } = 10^{9}\!-\!10^{11}\, M_{\odot }$| also show conversion factors consistent with that observed in the Milky Way within the uncertainties. However, we do recover an overall increase in αCO at decreasing stellar masses for fixed redshifts as expected. Galaxies with |$M_{\star } \lt 10^{9}\, M_{\odot }$| and also most galaxies at z > 1 (except the most massive ones, |$M_{\star } \sim 10^{11}\, M_{\odot }$|), i.e. the majority of GRB hosts, show αCO values significantly higher than αCO, MW. For instance, a galaxy with |$M_\star = 10^{8}\, M_{\odot }$| at z ∼ 0 will have a conversion factor of αCO = 30.5 |$M_{\odot }\, \mathrm{(K\, km\, s^{-1}\, pc^2)}^{-1}$|, almost an order of magnitude higher than the average value observed in the Milky Way. At higher redshifts, where CO is now being increasingly detected (e.g. Tacconi et al. 2010, 2013, 2018; Walter et al. 2011; Decarli et al. 2016; Bothwell et al. 2017; Pavesi et al. 2018; Valentino et al. 2018, 2020; Aravena et al. 2019; Riechers et al. 2019; Harrington et al.2021), even massive galaxies with |$M_{\star } \sim 10^{10}\, M_{\odot }$| at z = 2.5 will have conversion factors of αCO = 12.3 |$M_{\odot }\, \mathrm{(K\, km\, s^{-1}\, pc^2)}^{-1}$|, exceeding the average Galactic value by a factor of 2–3.
The redshift- and mass-dependent evolution of αCO can now be used to shed light on the observed Mmol/M⋆-redshift relation. As discussed in the previous section, it has been shown that this ratio approximately follows Mmol/M⋆ ∝ (1 + z)2.5, for star-forming galaxies (Tacconi et al. 2018). In the following analysis we assume a constant value of |$L^\prime _{\rm CO(1-0)} = 2\times 10^{10}$| |$\mathrm{K\, km\, s^{-1}\, pc^2}$|, which is the average luminosity of galaxies at z ∼ 1–3 derived from the PHIBSS sample (corrected by r31; Tacconi et al. 2013, 2018). We caution that the CO luminosity has been found to be strongly correlated with the stellar mass of each galaxy (e.g. Inami et al. 2020), and that this analysis should only be treated as a simple model to explore the evolution of Mmol/M⋆ with redshift.
In Fig. 5, we plot the resulting Mmol/M⋆-curves for a range of stellar masses, |$M_{\star } = 10^{8}, 10^{9}, 10^{10}, 10^{11}\, M_{\odot }$|, covering redshifts from z = 0–3, with the GRB hosts overplotted for reference. For the hosts of GRBs 120815A and 181020A, the upper limits are weaker than expected from their host stellar masses, whereas the limit on the molecular gas mass in GRB 080607 is close to that expected from its host stellar mass. Overall, most of the CO detections in GRB hosts do fall between the curves with |$M_{\star } = 10^{10}\!-\!10^{11}\, M_{\odot }$| (Hatsukade et al. 2020), as expected from their stellar masses, though some hosts appear to show significant molecular deficits (in particular at z ≲ 1).
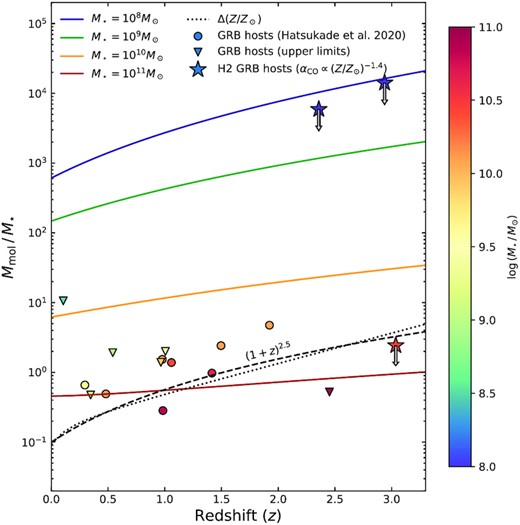
Same as Fig. 4, but with curves of constant stellar mass overplotted. Only the upper limits using the αCO–metallicity relation (equation 1) are shown for the three GRB hosts from this work. All plotted data points are colour-coded according to stellar mass. In addition, the dotted curve shows the expected evolution for a 0.2 dex metallicity decrease per unit redshift, starting at ≈1.5 × Z⊙.
Finally, in Fig. 5, we show the expected Mmol/M⋆ evolution track assuming a 0.2 dex metallicity decrease per unit redshift (as observed for absorption-selected galaxies, e.g. Rafelski et al. 2012; De Cia et al. 2018). The trend start at Z = 1.5Z⊙ at z = 0, and we again assume |$L^\prime _{\rm CO(1-0)} = 2\times 10^{10}$| |$\mathrm{K\, km\, s^{-1}\, pc^2}$| and the mass–metallicity and αCO–mass relations described above (shown as the dotted line in the figure). It is clear that this evolution track approximately follows the relation, Mmol/M⋆ ∝ (1 + z)2.5, that has been considered to broadly describe the evolution of the more massive galaxies, M⋆ > 1010M⊙. While the stellar mass is often thought to be the main factor regulating the metallicity of galaxies, we here show that the metallicity evolution of typical massive star-forming galaxies might in fact be the main driver of the observed molecular gas fraction, Mmol/M⋆, in galaxies through cosmic time.
5 CONCLUSIONS
We here presented a pilot survey targeting the CO emission counterparts of the host galaxies of strong H2-absorbing GRBs at z ∼ 2–3. We did not detect the redshifted CO(3 − 2) line in any of the three GRBs (GRBs 080607, 120815A, and 181020A). Assuming typical line ratios observed for star-forming galaxies at similar redshifts and a metallicity-dependent CO-to-H2 conversion factor, we derived upper limits on the molecular gas masses of log (Mmol/M⋆) < 10.54, 11.67, 11.95, for the hosts of GRBs 080607, 120815A, and 181020A, respectively.
To place these H2-selected GRB host galaxies into context, we compared them to the most recent compilation of GRB hosts with CO observations (Hatsukade et al. 2020, and references therein). First, the systems presented here expand the redshift range for which CO observations of GRBs have been obtained. Then, we examined them in terms of their molecular gas and stellar mass contents. While no strong conclusion can be inferred for the molecular-gas content of the hosts of GRBs 120815A and 181020A, we demonstrate that the host galaxy of GRB 080607 is globally deficient in molecules or ‘CO-dark’. This is surprising given the high metallicity ([X/H] >−0.2) and H2 abundance (N(H2) = 1021.2 cm−2) inferred from absorption, and the relatively high stellar mass inferred from emission (log (M⋆/M⊙) = 10.45).
Motivated by the high inferred limits on the molecular gas masses of the hosts of GRBs 120815A and 181020A, resulting from their low absorption-derived metallicities and a metallicity-dependent CO-to-H2 conversion factor αCO, we derived evolutionary tracks for αCO as a function of redshift and stellar mass. We found that while the Galactic conversion factor αCO, MW is suitable for massive galaxies with |$M_\star \sim 10^{11}\, M_{\odot }$| at z ∼ 0–5, lower mass galaxies will show significantly higher αCO values at all redshifts (by up to several orders of magnitudes). This will hamper the detection probability of CO in most star-forming galaxies at z > 1, since even large molecular gas reservoirs will show limited CO emission at these redshifts.
We demonstrated in the pilot survey presented here, resulting in non-detections of CO emission from GRB host galaxies, that the most feasible way to identify and study the molecular gas reservoirs in high-redshift, low-metallicity galaxies is through the detection of H2 in absorption. Due to the metallicity-dependent CO-to-H2 conversion factor αCO, these galaxies that otherwise show strong H2 absorption will be too faint to be detected in emission using typical molecular gas tracers such as CO.
ACKNOWLEDGEMENTS
KEH and PJ acknowledge support by a Project Grant (162948–051) from The Icelandic Research Fund. MN acknowledges support from ERC Advanced grant 740246 (Cosmic_Gas). JPUF thanks the Carlsberg Foundation for support. The Cosmic DAWN Center is funded by the DNRF. PN and JKK acknowledge support from the French Agence Nationale de la Recherche under grant ANR 17-CE31-0011-01/project ‘HIH2’ (PI: Noterdaeme). This paper makes use of the following ALMA data: ADS/JAO.ALMA#2019.1.00407.S. ALMA is a partnership of ESO (representing its member states), NSF (USA) and NINS (Japan), together with NRC (Canada), MOST and ASIAA (Taiwan), and KASI (Republic of Korea), in cooperation with the Republic of Chile. The Joint ALMA Observatory is operated by ESO, AUI/NRAO and NAOJ.
DATA AVAILABILITY STATEMENT
The raw ALMA data are publicly available through the ALMA science archive. The reduced spectral cubes and source codes for the figures and tables presented in this manuscript are available from the corresponding author upon reasonable request.
Footnotes
Though see also the tentative detection of H2 in the afterglow of GRB 060206 reported by Fynbo et al. (2006).
