


ABSTRACT
We have undertaken a systematic study of FR I and FR II radio galaxies with the upgraded Giant Metrewave Radio Telescope (uGMRT) and MeerKAT. The main goal is to explore whether the unprecedented few μJy sensitivity reached in the range 550–1712 MHz at the resolution of ∼4–7 arcsec reveals new features in the radio emission which might need us to revise our current classification scheme for classical radio galaxies. In this paper, we present the results for the first set of four radio galaxies, i.e. 4C 12.02, 4C 12.03, CGCG 044–046, and CGCG 021–063. The sources have been selected from the 4C sample with well-defined criteria and have been imaged with the uGMRT in the range 550–850 MHz (band 4) and with the MeerKAT in the range 856–1712 MHz (L-band). Full resolution images are presented for all sources in the sample, together with MeerKAT in-band spectral images. Additionally, the uGMRT–MeerKAT spectral image and MeerKAT L-band polarization structure are provided for CGCG 044–046. Our images contain a wealth of morphological details, such as filamentary structure in the emission from the lobes, radio emission beyond the hotspots in three sources, and misalignments. We briefly discuss the overall properties of CGCG 044–046 in the light of the local environment as well, and show possible restarted activity in 4C 12.03 which needs to be confirmed. We conclude that at least for the sources presented here, the classical FR I/FR II morphological classification still holds with the current improved imaging capabilities, but the richness in details also suggests caution in the systematic morphological classification carried out with automatic procedures in surveys with poorer sensitivity and angular resolution.
1 INTRODUCTION
The morphology of extragalactic radio sources of high and low luminosity, set out by Fanaroff & Riley (1974), has suggested the framework for the study of the physics, origin, and evolution of extragalactic radio sources. After more than 46 yr, the classification of extended extragalactic radio sources in FR I and FR II types is still used to separate low-power and high-power radio galaxies, respectively. However, our knowledge of extragalactic radio sources has improved considerably since then.
It is known that FR I radio galaxies (radio powers typically below 1024 W Hz−1 at 1.4 GHz) with their symmetric prominent jets and lobes, are associated with red passive galaxies, i.e. evolved galaxies which usually show little to no evidence of nuclear activity in other bands of the spectrum. More recently (see Best & Heckman 2012; Hardcastle & Croston 2020, for a recent review), these have been associated with low-excitation emission-line galaxies (LEGs; Heckman & Best 2014) at moderate luminosities. Deviations from the straight (180°) FR I morphology is common for optical hosts in galaxy clusters, where radio galaxies may form spectacular tails as the radio jets are exposed to a combination of effects, such as galaxy motion through the intracluster medium (ICM), a.k.a., tailed radio sources (Rudnick & Owen 1976; O’Dea & Owen 1985), bulk motions of the ICM (i.e. ‘cluster weather’; Burns et al. 1987), shocks in the ICM (Nolting et al. 2019) and other phenomena related to the formation of clusters (see the review by Brunetti & Jones 2014, for a comprehensive overview). On the other hand, FR II radio galaxies (radio powers above 1024 W Hz−1 at 1.4 GHz) are associated with both quasars and galaxies and the optical host usually shows other indicators of nuclear activity, such as high-excitation emission-line galaxies (HEGs; Heckman & Best 2014); see also Hardcastle & Croston (2020) for a recent review. The jets of these sources are often faint (sometimes barely visible) and asymmetric, and the radio spectral information indicates that the lobes are the result of back-flow from the hotspots.
A lot of work has been done to understand the different behaviour of jets in FR Is and FR IIs (Bicknell et al. 2004; Laing & Bridle 2012, and references therein). Very-long baseline interferometric studies of samples of FR I and FR II radio galaxies show that jets are relativistic at their origin in both classes of sources (Venturi et al. 1995; Giovannini et al. 2001); however, jets in FR I decelerate closer to the core compared to FR II, most likely due to differences in some combination of jet power and propagating medium. It is commonly stated that FR I preferentially reside in dense environments, such as clusters and groups of galaxies, and FR II are found in less dense environments (Hardcastle 2005), but the most famous FR II radio galaxy, Cygnus-A, is at the centre of a galaxy group (Bautz & Morgan 1970). FR IIs appear to populate the Universe to much larger redshifts. This is partly due to selection effects related to the sensitivity and resolution of the radio interferometers used so far in large surveys. Imaging of large regions of the sky with the current generation of radio interferometers, such as LOFAR (the LOw Frequency ARray), ASKAP (Australia SKA Pathfinder), and MeerKAT clearly shows a wealth of extended radio galaxies with a broad distribution of size, flux density, and distance, which might change the paradigm of redshift distribution of FR Is and FR IIs (Croston et al. 2017, 2019; Mingo et al. 2019)
A small fraction of FR I and FR II radio galaxies (of the order of a few per cent, Ishwara-Chandra & Saikia 1999; Bassani et al. 2016) shows Mpc-scale extent, posing the problem of the energy supply to the lobes, and a number of them show signs of restarted activity (Bruni et al. 2019; Mahatma et al. 2019; Dabhade et al. 2020). Equally important is a new class of low-power radio galaxies that has been recently characterized, the so-called FR 0 (Baldi, Capetti & Giovannini 2019). The radio power of these sources is typical of FR Is. However, they are compact on the scale of a few arcseconds. High sensitivity observations at high angular resolution show that a fraction of them have double-sided jets on very small angular scales, but the majority remain compact (Capetti et al. 2020). The nature of these sources and how they fit into the overall classification of radio galaxies are still uncertain.
A wealth of amazing new images has been collected over the past few years with the current generation of radio interferometers, such as LOFAR, JVLA, MeerKAT, and uGMRT, whose much improved sensitivity at arcsecond resolution over at least two orders of magnitude in frequency is revealing new features in the radio emission. A few remarkable examples are the amazing tails of NGC 326 detected with LOFAR (Hardcastle et al. 2019), the low surface brightness emission surrounding several radio galaxies at the centre of groups (for instance NGC 741, Schellenberger et al. 2017), the filamentary structure within and outside the lobes of Fornax A (Maccagni et al. 2020), and the filaments of ESO 137-006 (Ramatsoku et al. 2020).
The imaging capabilities available nowadays thus allow us to throw new light on our understanding of the radio galaxy phenomenon and address questions that have so far remained unanswered. In particular: (a) Why are the morphological classification in terms of FR I and FR II and the radio power so closely linked, and what do intermediate objects tell us? (b) Which mechanism produces radio loudness in the form of FR I or FR II in galaxies, what is the duty cycle of radio nuclear activity, and what triggers it? (c) Does the sharp classification in FR I and FR II types still hold when we improve our imaging capabilities to the level which can be currently achieved? (d) Do we need more morphological classes?
To address at least the third and fourth of these questions, we started an imaging project of classical radio galaxies with uGMRT in 550–850 MHz (band-4) and MeerKAT in 856–1712 MHz (L-band), to explore their radio morphology with unprecedented sensitivity at arcsecond resolution, and study their spectral structure in the frequency range 0.5–1.7 GHz. Here we present our results of the pilot study for the first set of four radio galaxies.
The paper is organized as follows. We present our target selection, observations and data analysis in Section 2, followed by the radio morphology in Section 3. In Section 4, we show the integrated radio spectra and spectral imaging for our sources. In Section 5, we discuss our results, and concluding remarks are given in Section 6. We assume a ΛCDM cosmology with Ωm = 0.27, ΩΛ = 0.73, and H0 = 70 km s−1 Mpc−1. We define spectral index, α, as S|$_\nu \, \propto \, \nu ^\alpha$|; where Sν is the flux density at frequency ν. Throughout, positions are given in J2000 coordinates.
2 TARGET SELECTION AND OBSERVATIONS
We selected a sample of FR I and FR II radio galaxies from the 4C catalogue (|$-7^\circ \, \lt \, \delta \, \lt $| 80°; Pilkington & Scott 1965) which meet the following selection criteria:
The source is hosted by a detected optical galaxy with spectroscopically determined redshift z in the range between 0.05 and 0.20. This ensures (a) the detection of Mpc scale extended emission with uGMRT band-4 and (b) a similar fraction of FR Is and FR IIs;
The target source is in the declination range −10° and +20° to ensure proper visibility and comparable (u, v)-coverage with both uGMRT and MeerKAT arrays at respective bands; and
A clear double radio morphology is imaged at the 45 arcsec angular resolution of the NRAO VLA Sky Survey (NVSS; Condon et al. 1998).
These well-defined selection criteria provided us with a total of 12 sources, 6 FR I and 6 FR II radio galaxies. We started our project observing the four sources reported in Table 1, which are also members of the GaLactic and Extragalactic All-sky MWA (GLEAM) 4-Jy sample (White et al. 2020a, b). We note that the morphological classification of CGCG 021–063 is challenging. The source looks like a FR II source in the new MeerKAT and uGMRT observations. This will be addressed in Section 3.1. In order to image the sample sources with matching sensitivity, (u, v)-coverage and angular resolution with the two arrays, we observed each target for ∼3 and ∼3–6 respectively with uGMRT and MeerKAT. The observing logs for the uGMRT and MeerKAT observations are detailed in Table 2.
Source properties.
| Name | Type | R.A. | Dec. | z | log P1.4 GHz | kpc (arcsec) | Alt. name |
|---|---|---|---|---|---|---|---|
| (J2000) | (W Hz−1) | ||||||
| 4C 12.02 | FR II | 00 04 50.2 | +12 48 40 | 0.143 | 26.06 | 2.530 | G4Jy 7 |
| 4C 12.03 | FR II | 00 09 52.6 | +12 44 05 | 0.156 | 25.82 | 2.721 | G4Jy 18 |
| CGCG044−046 (4C 07.32) | FR I/II (WATa) | 13 16 17.0 | +07 02 47 | 0.050145 | 25.08 | 0.986 | G4Jy 1060 |
| CGCG021−063 (4C 00.56) | FR I/II | 15 16 40.2 | +00 15 02 | 0.052489 | 25.25 | 1.030 | G4Jy 1238 |
Log of the observations using uGMRT and MeerKAT arrays.
| Source | Obs. Date | Flux cal. | Phase cal. | Bandwidth | Ch.-width | tint. | FWHM | rms |
|---|---|---|---|---|---|---|---|---|
| (MHz) | (kHz) | (h) | (arcsec × arcsec, °) | (μJy b−1) | ||||
| uGMRT array | ||||||||
| 4C 12.02 | 2019-09-05 | 3C 48 | 0054−035 | 300 | 48.83 | 3.0 | 5.17 × 3.23, 9.18 | ∼30 |
| 4C 12.03 | 2019-09-17 | 3C 48 | 0054−035 | 300 | 48.83 | 2.9 | 5.03 × 3.54, 40.85 | ∼21 |
| CGCG 044-046 | 2019-05-20 | 3C 147 | 1419+064 | 200 | 24.41 | 3.4 | 4.98 × 3.76, 53.56 | ∼15 |
| CGCG 021-063 | 2019-05-26 | 3C 286 | 1419+064 | 300 | 48.83 | 3.1 | 6.99 × 3.25, 16.38 | ∼150 |
| MeerKAT array | ||||||||
| 4C 12.02 | 2019-05-25 | PKS 0408−65 | J0022+0014 | 856 | 208.98 | 3.0 | 8.65 × 5.51, 161.95 | ∼13 |
| 4C 12.03 | 2019-05-25 | PKS 0408−65 | J0022+0014 | 856 | 208.98 | 2.7 | 8.52 × 5.44, 164.56 | ∼8 |
| CGCG 044-046 | 2019-05-13 | B1934−638 | J1347+1217 | 856 | 208.98 | 3.0 | ||
| 2019-09-15 | B1934−638 | J1347+1217 | 856 | 208.98 | 2.7 | 7.51 × 6.27, 159.50 | ∼10 | |
| CGCG 021-063 | 2019-05-13 | B1934−638 | J1512–0906 | 856 | 208.98 | 3.0 | ||
| 2019-09-15 | B1934−638 | J1512–0906 | 856 | 208.98 | 3.2 | 8.31 × 6.01, 161.77 | ∼13 | |
The upgraded GMRT has a hybrid configuration (Swarup et al. 1991; Gupta et al. 2017) with half of its 45 m diameter 30 antennas located in a central (∼1 km) compact array and with the remaining antennas distributed in a roughly ‘Y’ shaped configuration giving ∼25 km maximum baseline length. The antennas in the central square and in a ‘Y’ shaped configuration provide baselines that are comparable to the VLA D-array and B-array configurations, respectively. Hence, a single observation with the uGMRT provides good angular resolution when mapping the detailed source structure with reasonably good sensitivity. MeerKAT is also a hybrid array of 64 13.5 m diameter dish antennas. 48 of the 64 interlinked antennas are located in a core region of 1 km in diameter and the other 16 are located outside the core, giving a maximum baseline length of ∼8 km (Jonas & MeerKAT Team 2016). This configuration of MeerKAT is equivalent to a simultaneous hybrid of VLA B-, C-, and D-array configurations. The observations described in this paper were all carried out with the new dual polarization (RR and LL) 550–850 MHz band (band-4) receivers of uGMRT, and with the dual linear polarization (horizontal and vertical) 856–1712 MHz (L-band) receivers (Lehmensiek & Theron 2012, 2014) of MeerKAT.
2.1 Data reduction
The calibration of the data presented in this paper was carried out following the standard procedures. However, as the MeerKAT data reduction requires a new approach, we summarize here some of the specific steps that have been performed for both the uGMRT and the MeerKAT in reducing these data.
The uGMRT data sets were calibrated using a standard approach (see Lal 2020, for detailed methodology). Observations of a flux density calibrator at the beginning and at the end of each run were used to correct for flux density scale and bandpass shape; the phase-calibration source was used to correct for phases. The data analysis, in particular editing of bad data, gain and bandpass calibrations, were carried out using the NRAO Astronomical Image Processing System aips, following standard imaging procedures. We made an error in providing the observing set-up for the uGMRT observations of CGCG 044−046 source, which had 200 MHz bandwidth with the high spectral resolution, whereas the rest of the sources had 400 MHz bandwidth with a factor of two lower spectral resolution. Note that this error did not limit us in terms of the angular resolution or the sensitivity (see below). We used the Perley & Butler (2013) flux density scale using the coefficients in the aips task setjy. After the above preliminary calibration, the 300-MHz1 wide data set was split into six 50 MHz sub-bands for 4C 12.02, 4C 12.03 and CGCG 023−061 and four 50 MHz sub-bands for CGCG 044−046. An area of ≈ 1.5° × 1.5° was imaged, just bigger than the first null of the uGMRT primary beam in order to correct for antenna-based gains in the direction of each radio source. A standard self-calibration procedure was performed in aips on each sub-band (see also, Lal & Rao 2007). All the calibrated 50 MHz sub-bands data were further stitched together to form full-bandwidth calibrated visibility data sets. These visibilities were imaged using the tclean task in casa. A final amplitude-and-phase self-calibration was also carried out to the full-bandwidth calibrated data set on to the same flux density scale using casa, and the final images were obtained using the task tclean. We used 3D imaging (gridder = ‘widefield’) and Briggs weighting (robust = 0.5).
The MeerKAT data sets were also calibrated using a standard approach, but employing some novel software. We used the CARACal pipeline2 (Józsa et al. 2020, 2021) for the initial data reduction. CARACal orchestrates standard reduction packages into a single workflow. In this instance, it combined the Tricolour3 flagger (Hugo et al. 2021) for radio frequency interference flagging, and standard casa tasks for reference calibration. For the epochs employing B1934−638 as the primary calibrator, we used the Perley & Butler (2013) scale to set its flux density scale. For the epoch employing the other standard MeerKAT calibration source, PKS 0408−65, we used a custom component-based field model provided in CARACal, converted into model visibilities via the MeqTrees package (Noordam & Smirnov 2010). After applying all the reference calibration, the 4096 spectral channels data were averaged down to 1024 spectral channels, and imaged using the wsclean package (Offringa et al. 2014). We used Briggs weighting (robust = 0), disabled multifrequency weighting, employed the joined-channel deconvolution and (fourth order) polynomial fitting options of wsclean to make wideband multifrequency synthesis images. We imaged an area of |$\approx 2{_{.}^{\circ}}2 \times 2{_{.}^{\circ}}2$| for the CGCG 021−063 and CGCG 044−046 fields. For the 4C 12.02 and 4C 12.03 fields, we imaged a larger area of |$\approx 3{_{.}^{\circ}}1 \times 2{_{.}^{\circ}}2$|; these sources are sufficiently close that their sidelobes contribute to each other’s fields at the sensitivity levels we reach, and thus needed to be deconvolved jointly. This was followed by a round of phase and delay self-calibration using the CubiCal4 package (Kenyon et al. 2018). The 4C 12.02 field exhibited direction-dependent (DD) effects due to a 0.64 Jy (apparent) off-axis source, which was successfully peeled using CubiCal. The other fields did not require DD calibration. The 4C 12.02 and 4C 12.03 maps were then slightly improved via a round of amplitude self-calibration using CubiCal. This resulted in noise-limited maps for three of our four sample sources.
The resulting MeerKAT image of CGCG 021−063 retains some radial, north–south oriented artefacts related to the point spread function (psf) centred on the bright core of the source. We were only partially able to mitigate these via self-calibration. These are not due to DD effects, since the core is the dominant source and it is at the centre of the field, nor are they likely to be deconvolution artefacts, as the core is completely unresolved. We hypothesize that they are due to residual nonlinearities in the system response, exacerbated by the effective psf of this observation: since the source is only 15 arcmin off the equator, the psf exhibits pathologically high sidelobes in the north–south direction, at the 1–2 per cent level (compared to |$\lt 0.1{{\ \rm per\ cent}}$| level in the east–west direction). The dynamic range of |$\sim 50\, 000:1$| achieved here is comparable to that achieved with MeerKAT on other equatorial fields (Heywood, private communication). Our final images resulted in an angular resolution of ∼6 arcsec for all our target sources. The residual amplitude errors in each image are of the order of 5 per cent for uGMRT and 3 per cent for MeerKAT. The final 550–850 MHz (band-4) uGMRT and MeerKAT images are shown in Figs 1–3.
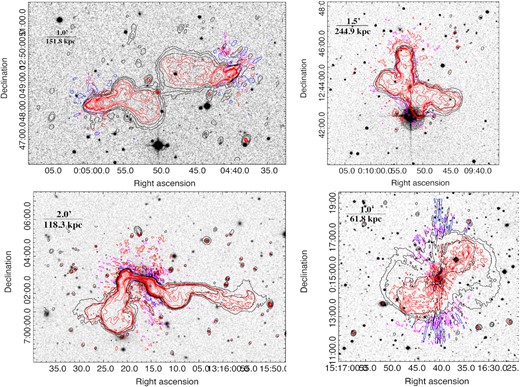
The images of our four sample sources: 4C 12.02 (top-left panel), 4C 12.03 (top-right panel), CGCG 044−046 (bottom-left panel), and CGCG 021−063 (bottom-right panel). The uGMRT and MeerKAT images have angular resolutions of ∼4 and 7 arcsec, respectively (see also Table 2). The radio contours of uGMRT and MeerKAT images are overlaid on the DSS-II (red band) optical images (in grey-scale). The red and black surface brightness contours, with magenta and blue being first negative surface brightness contours, correspond to uGMRT and MeerKAT images, respectively. The contour levels are rms|$\times \, -$|1, 1, 2, 4, etc., and increases by a factor of two. The bar in the top-left corner of each panel image depicts the physical scale for our sample source.

The image of one of our four sample source, 4C 12.02 is shown to give an idea of the capabilities of MeerKAT and uGMRT. The radio contours of the MeerKAT image (red contour), NVSS image (blue contour), and GLEAM image (black contour) are overlaid on the DSS-II (red band) optical image (in grey-scale). The red, blue, and black surface brightness contours correspond to the contour levels 0.045, 0.090, 0.18, 0.36, 0.72, 1.44, 2.88, 6.0, 12.0, 24.0, 48.0, and 100.0 mJy beam−1; 30, 60, 120, and 240 mJy beam−1; and 800 and 1600 mJy beam−1, respectively. We also show a compass at the bottom right location indicating the north and east directions. All through our uGMRT and MeerKAT images, we follow this convention.


Images of four sample sources at band-4 using the uGMRT (left panel) and at L-band using the MeerKAT (right panel). These radio sources are in the order presented in Table 1. The lowest radio contour plotted is three times the local rms noise and increasing by factors of 2. The local rms noise and the beam size (along with the position angle) are denoted in Table 2.
The MeerKAT observations of CGCG 044−046 and CGCG 021−063 included a scan of a bright polarized calibrator, 3C 286, which allowed us to perform polarization imaging. Polarization calibration was done via CARACal, using the standard CASA approach. The calibrator B1934−638 was used to derive frequency-dependent leakages (D–Jones), while 3C 286 was used to calibrate cross-hand phase and delay (K/X–Jones). The joined-polarization mode of WSClean was then used to deconvolve Stokes I, Q, U, and V maps. The Q and U images of CGCG 021−063 suffered from the same artefacts as the total intensity image, so we did not use them in our further analysis. We include here results from our polarization observations using MeerKAT for CGCG 044−046 (see Section 5).
3 THE IMAGES
Our uGMRT and MeerKAT observations revealed several new sources in the fields of view in addition to deep images of our four targets sources. Fig. 1 shows the uGMRT and MeerKAT contours overlaid on the DSS-II (red band) optical image. Fig. 2 is an image of 4C 12.02 showing the MeerKAT radio contours together with radio contours of NVSS and GLEAM images overlaid on the DSS-II (red band) optical image, to faithfully present the capabilities of MeerKAT and uGMRT. The compass depicts north and east and all through we follow this convention. Fig. 3 provides colour scale with contour levels overlaid for each data set (left and right panels showing the uGMRT and MeerKAT images, respectively). It clearly shows that in almost all cases, barring CGCG 044−046, the surface brightness declines sharply at the edges of the visible radio lobes and of the low surface brightness features. We thus conclude that we have not missed any part of the source that fades into the noise. Details on each source are provided below.
3.1 Radio morphology
3.1.1 4C 12.02
It is an FR II radio galaxy whose optical counterpart (a galaxy) is located at redshift z = 0.143. Schilizzi & McAdam (1975) first noted it as a triple source, with a radio core, and two radio lobes located on opposite sides along the east-west direction. Recently, Yang et al. (2019) reported it as a representative giant X-shaped radio source based on the GMRT TGSS_ADR1 (Intema et al. 2017).
Our uGMRT and MeerKAT images are shown in Fig. 1 (top-left panel) and Fig. 3 (top-left and top-right panels respectively). The angular resolution of the uGMRT provides important insight into the morphology of the hotspots, while the MeerKAT image is better suited to highlight the details and extent of the lobes. The morphology of the back-flows from the lobes is similar to what has been found for PKS 2014−55 (Cotton et al. 2020). Both hotspots are resolved with multiple peaks. There are at least two hotspots near the termination of the west jet and probably a string of them in the east one. Both the east and west lobes show substructure. The north-western lobe flares abruptly at the peak of the hotspot closer to the core, while the southern lobe expands perpendicular to the main axis of the radio galaxy. In the west lobe, the hotspot before the bow shock is clearly extended in an arc perpendicular to the source major axis, which may suggest some sort of reflected, internal shock. The hotspots in the east and west lobes are not exactly co-linear if the line goes through what appears to be the active galactic nucleus (AGN). It is not clear that a projection effect could do this. The total flux density of the source is S0.69 GHz = 3.50 ± 0.19 Jy and S1.28 GHz = 2.15 ± 0.07 Jy. The angular extent of the source is ∼5 arcmin, corresponding to ∼760 kpc, i.e. a giant radio galaxy (see Bassani et al. 2016).
3.1.2 4C 12.03
This X-shaped radio source is associated with an elliptical host galaxy (Heckman et al. 1994), classified as a low emission-line radio galaxy located at redshift z = 0.156 (Laing, Riley & Longair 1983). Lal & Rao (2007) reported that 240 MHz and 610 MHz GMRT images show a symmetrical structure whose extent is ∼4 arcmin along both axes, corresponding to ∼650 kpc. The overall X-shaped morphology has been explained by a million-year precession period (Gong, Li & Zhang 2011), or as a rapid realignment of a central supermassive black hole accretion disc system due to a relatively recent merger of a supermassive binary black hole (Merritt & Ekers 2002; Lal & Rao 2007) or as a result of disc instability (Dennett-Thorpe et al. 2002).
Our new uGMRT and MeerKAT images, shown in Fig. 1 (bottom-left panel) and Fig. 3 (middle-left and middle-right panels respectively), confirm the X-shaped radio morphology. The northern and southern jets leading to the north and south hotspots respectively, form the active axis, whereas the east-west axis forms the low-surface brightness wings. The overall north–south morphology of the radio galaxy seems to follow an arc, and shows a clear asymmetry: the northern component culminates in a clear hotspot, as in FR IIs. On the other hand, the southern component could be either FR I or FR II. Both the western and eastern low-surface brightness wings are suggestive of a hydrodynamic back-flow as seen in PKS 2014–55 (Cotton et al. 2020).
The angular resolution of both our images clearly shows the presence of two inner brightness peaks (labelled as ‘inner lobes’ in Fig. 3, middle-right panel), forming an inner double structure, whose total extent is ∼80 kpc. These two features are perfectly aligned with the large north–south axis (see also Schoenmakers et al. 2000). Thus, the structures of the source possibly place it in the category of restarted sources. The overall extent of this radio galaxy is comparable to the earlier images, but broader extended emission is detected in the east-west radio lobes, whose outer parts show a filamentary structure at both frequencies. The total flux density of the source is S0.69 GHz = 3.14 ± 0.18 Jy and S1.28 GHz = 2.06 ± 0.06 Jy.
3.1.3 CGCG 044−046
The source is identified as an m = 14.2 cD galaxy and is associated with the Zwicky cluster 1313.7 + 0721 at z = 0.050145 (Zwicky & Herzog 1966). Indeed the bent radio morphology is typical of radio galaxies at the centre of galaxy clusters and groups. Some notable examples are ESO 137–006 (Ramatsoku et al. 2020) and 3C 465 (Eilek et al. 1984), but see also O’Donoghue, Owen & Eilek (1990) and Garon et al. (2019) for a recent analysis.
The radio source was first studied in detail by Patnaik, Banhatti & Subrahmanya (1984) and Patnaik, Malkan & Salter (1986), who noticed the asymmetry between the sharp bend of about 90° in the eastern tail and the more gentle bend in the western one, with diffuse emission further out in both. This asymmetry is confirmed in both our images (see Fig. 1, upper-right panel, and Fig. 3, third row, left and right panels for uGMRT and MeerKAT respectively), whose sensitivity allows the detection of emission from the radio tails to much larger distances than previously detected at these frequencies (see also Section 5.3). The morphology suggests that it possibly belongs to the wide-angle tail class of radio galaxies. The extension of the western tail was also detected at lower frequencies via GLEAM though at much lower angular resolution (White et al. 2020a; Hurley-Walker et al. 2017).
The radio galaxy shows an inner pair of straight jets, similar to FR I jets, which culminate in two high surface brightness knots at ∼ 50 kpc from the core. Beyond this region, the eastern jet flares to form a tail, which bends sharply by ∼90°, heading toward the south, consistent with Patnaik et al. (1984). Our images clearly show another bend at the southern end of the tail, behind the tail itself, as is clear from the radio contours (see Fig. 3) and from the spectral analysis (see Section 4). The transition between the western jet and the tail is quite sharp. The tail shows very little transverse expansion and makes a few wiggles before fading. Both our images reveal filamentary structure in the tails, whose projected length is about 150 and 300 kpc respectively for the eastern and the western tails, as measured using the MeerKAT data. Such sharp bends cannot be explained by projection effects, and are suggestive of reflection or refraction at discontinuities. The total flux density of the source is S0.69 GHz = 3.24 ± 0.16 Jy and S1.28 GHz = 2.05 ± 0.07 Jy.
3.1.4 CGCG 021−063
Very little information is reported in the literature on the arcsecond-scale properties of this radio galaxy, characterized by a compact, i.e. <0.2 mas in size (Dodson et al. 2008), radio core. Using the FIRST survey image, Proctor (2016) reported that this source has a resolved compact component, with triple extended structure and possibly an S- or Z-shaped structure. Our uGMRT and MeerKAT images (Fig. 1, bottom-right panel, and bottom row in Fig. 3, left-hand and right-hand panels, respectively) are dynamic range limited, most likely because of the strong compact core. However, they clearly show that the radio emission of CGCG 021–063 has two components: a radio galaxy, whose projected linear size is ∼280 kpc that is embedded in a low-surface brightness cocoon of radio emission. The inner radio galaxy and the lobes have an FR II morphology, with only one visible jet and two hotspots of moderate brightness. It is interesting to note that the west jet seems to propagate beyond the hotspot or working surface of the jet. There is filamentary structure in the east lobe which is well reproduced in both images and there are also clearly beads in the west jet. We interpret the cocoon of fainter emission embedding the radio galaxy as the result of the back-flow from both jets. This emission is fairly symmetrical, suggesting that there is little relative movement of the galaxy through the intragalactic medium (IGM).
No information on the local environment of the optical host is available in the literature. The total flux density of the source is S0.69 GHz = 3.77 ± 0.20 Jy and S1.28 GHz = 2.80 ± 0.09 Jy.
4 SPECTRAL ANALYSIS
The spectral index analysis is a useful tool to investigate the life cycle of radio sources and to better understand their radio morphologies. In the following we present the integrated radio spectra for all sources. We further show uGMRT–MeerKAT spectral index imaging for CGCG 044–046 and in-band MeerKAT spectral imaging for all sources.
4.1 Integrated radio spectra
We complemented our flux density measurements with literature information. Table 3 (c2–c9) lists the integrated flux density we collected for our sources over a broad range of frequencies along with error bars. The corresponding integrated spectra are shown in Fig. 4.
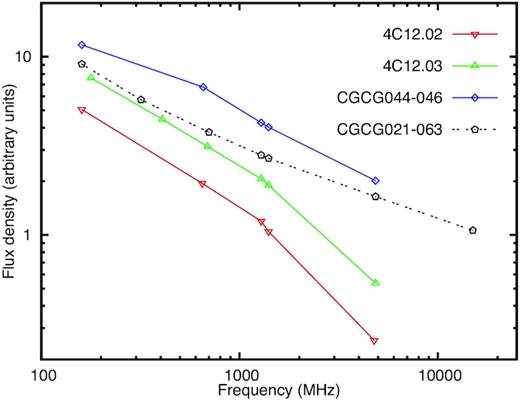
Integrated flux densities of our sample radio sources at 550–850 MHz band of the uGMRT and 856–1712 MHz band of MeerKAT; data at other frequencies are from the literature (see Table 3 for references). The error bars not plotted are less than two times the size of the symbols. The spectra (and the data points) are shifted with respect to one another for clarity.
The total intensity and spectral index for our sample sources. The integrated flux densities quoted are in Jy along with corresponding error bars when available.
| Source | |$S_{\rm 160\, MHz}$| | |$S_{\rm 318\, MHz}$| | |$S_{\rm 408\, MHz}$| | |$S_{\rm 690\, MHz}$| | |$S_{\rm 1284\, MHz}$| | |$S_{\rm 1400\, MHz}$| | |$S_{\rm 4850\, MHz}$| | |$S_{\rm 15000\, MHz}$| |
|---|---|---|---|---|---|---|---|---|
| c(Jy) | c(Jy) | c(Jy) | c(Jy) | c(Jy) | c(Jy) | c(Jy) | c(Jy) | |
| c(1) | c(2) | c(3) | c(4) | c(5) | c(6) | c(7) | c(8) | c(9) |
| 4C 12.02 | 9.1 ± 0.82a | 3.50 ± 0.19 | 2.15 ± 0.07 | 1.88 ± 0.28e | 0.46 ± 0.07g | |||
| 4C 12.03 | 7.6 ± 0.95b | 4.45 ± 0.20d | 3.14 ± 0.18 | 2.06 ± 0.06 | 1.90 ± 0.29e | 0.54 ± 0.07g | ||
| CGCG044−046 | 5.6 ± 0.84a | 3.24 ± 0.16 | 2.05 ± 0.07 | 1.93 ± 0.07f | 0.97 ± 0.15h | |||
| CGCG021−063 | 9.1 ± 0.82a | 5.74 ± 0.26c | 3.77 ± 0.20 | 2.80 ± 0.09 | 2.69 ± 0.10f | 1.64 ± 0.23i | 1.06 ± 0.01j |
Notes.The flux densities of four radio sources at 550–850 MHz band (c5) and at L-band (c6) are reported. The flux density is determined using aips task tvstat for irregular shaped radio sources. The error bar on the measurement of flux density is based on the rms noise as evaluated in the irregular shaped polygon. The rest of the measurements at 151 MHz (c2), 1400 MHz (c6) and 4850 MHz (c7) are from the NASA Extragalactic Database (NED). The spectral index (c8) corresponds to the line representing the best fitting regression to this data.
References: The references for flux density measurements from NED are as follows: (a) Slee (1995); (b) Gower, Scott & Wills (1996) and the measurement is at 178 MHz; (c) Wright & Otrupcek (1981); (d) Large et al. (1981); (e) Parkes Catalog (1990); (f) White & Becker (1992); (g) Gregory & Condon (1991); (h) White, Becker & Edwards (1991); (i) Griffith et al. (1995); (j) Richards et al. (2014).
Our data points are very well aligned with the literature data, which confirms the reliable calibration for both uGMRT and MeerKAT observations. Note that we have used an identical polygon for our uGMRT and MeerKAT images to determine integrated flux density, making sure that we do not include the obvious artefacts in the images. Inspection of Fig. 4 clearly shows that the spectra of our sources have slightly different behaviours. Those of CGCG 044–046 and CGCG 021–063 are reasonably well-fitted by a single power law, with α = −0.52 ± 0.09 and −0.44 ± 0.11, respectively. Both these values are very flat, which is remarkable if we consider that the integrated flux density measurements include the diffuse emission tails and radio lobes, whose spectra are typically steeper, i.e. α ≃ −0.8. This suggests that for both sources the active components, i.e. the core and inner jets, are the dominant source of emission over a broad range of frequencies. The spectra of 4C 12.02 and 4C 12.03 on the other hand show a clear break at ∼ 1.2 GHz. Further, for both sources the spectra have α ∼ −0.7 down to 1.284 MHz, which steepens to α ∼ −1.2 at higher frequencies, suggesting the dominant role of the radio lobes at low frequency, as qualitatively suggested by our total intensity images in both cases.
4.2 Spectral index imaging
With this approach we performed MeerKAT in-band spectral index imaging for all sources in our sample. The MeerKAT data sets were imaged using the WSCLEAN package (Offringa et al. 2014) via a joint deconvolution and 4th order polynomial fitting options of it to make wide-band multifrequency synthesis images (see also Section 2.1). This provides images at centre-frequencies and the corresponding in-band spectral index maps. The resulting images are shown in Fig. 5 for all sources, with total intensity radio contours overlaid from the 856–1712 MHz (L-band) MeerKAT data.
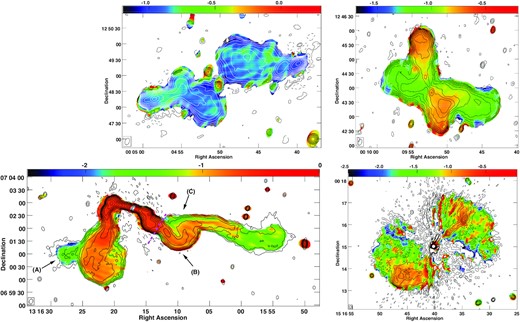
MeerKAT in-band spectral index images of our four sample sources, 4C 12.02 (top-left panel), 4C 12.03 (top-right panel), CGCG 044−046 (bottom-left panel), and CGCG 021−063 (bottom-right panel). The total intensity radio contours from the MeerKAT data are overlaid on it, with the lowest radio contour plotted is three times the local rms noise and increasing by factors of 2. We have also marked the three distinct regions of emission beyond the compact flat spectrum core, the inner jets all the way to the hotspots, the central part of the tails, and the terminating part of the tails for the CGCG 044–046 source. It highlights three different regions of emission beyond the compact flat spectrum core: (1) the inner jets all the way to the hotspots; (2) the central part of the tails, labelled as ‘B’ and ‘C’, and (3) the terminating part of the tails, labelled as ‘A’. This feature, ‘A’ is the end of the tail and is called as the eastern protrusion. Furthermore, the sharp transition from the central to the terminating part of the tail in the western radio emission is marked as dashed magenta line (see also Section 5.3).
We further produced uGMRT-MeerKAT spectral index images. The uGMRT and MeerKAT full resolution images, which on average give |$\theta \, \approx$| 4|${_{.}^{\prime\prime}}$|5 and 7|${_{.}^{\prime\prime}}$|5 at full width at half-maximum, were restored to the same angular resolution of θ = 8 arcsec at both central frequencies for the spectral index imaging. We point out that the (u, v) coverage of the two arrays is nearly identical, hence we did not need to remove baselines in the (u, v) planes to match the range of accessible angular scales in the two data sets. We use these matched resolution images to construct the spectral index images. The errors in the flux densities are approximately 5 and 3 per cent at band-4 and L-band of uGMRT and MeerKAT, respectively, including calibration errors. The final errors in the spectral indices have been estimated by propagating individual errors in quadrature. Here we show only the uGMRT-MeerKAT spectral index image which we obtained for CGCG 044–046 (Fig. 6). For this source the comparable sensitivity of the uGMRT and MeerKAT data sets provides the best result, which adds information to the MeerKAT in-band image.
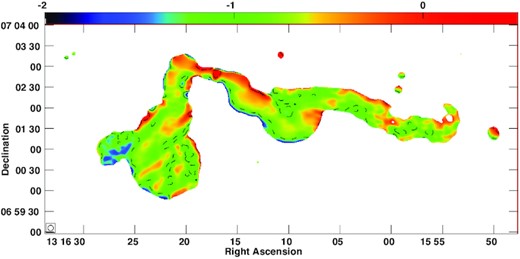
Spectral index image using the uGMRT and MeerKAT for CGCG 044−046 radio galaxy. The radio contour plotted corresponds to a spectral index of −1.0.
CGCG 021–063 is affected by residual artefacts due to the strong nuclear component, nevertheless the MeerKAT in-band spectral index image is reliable for the strongest features, i.e. the jets and the hotspots. The spectral index distribution in our sources (see Fig. 5) shows a flat spectrum core in all cases.
The spectral index image of 4C 12.02 is quite puzzling. The spectrum of the very bright hotspots is overall similar to that of the lobes, with α ≃ −0.8, suggesting that replenishment of fresh particles is reducing, or has stopped.
Radio galaxies show steepening from the hotspots towards the core, which is consistent with what is found in 4C 12.03 (Hardcastle 2005), where the lobes are back-flow emission. Our image for 4C 12.03 shows a clear separation in the spectral index distribution between the north–south and east–west axes, the latter being considerably steeper (α ≃ −1.2 to be compared to the values in the range α ≃ −0.8 and −0.9 in the north–south lobes). Our results are consistent with earlier findings in Rottmann (2001) and Lal & Rao (2007). The source will be further discussed in Section 5.
The spectral index image of CGCG 044–046 shows four clearly separated regions, with the spectral index steepening gradually from the flat to inverted spectrum core, to the ending parts of the tail, where it reaches values of α ≃ −1.5. This source will be further discussed in Section 5.
Despite the overall poorer quality of the image, the spectral index distribution of CGCG 021–063 is quite interesting, with the north-western hotspot considerably flatter than the surrounding emission from the lobe, i.e. α ≃ −0.8 and α ≃ −1.2 respectively. On the other hand, the eastern hotspot and channels of emission feeding it (see bottom-left panel of Fig. 3) have a similar spectral index, in the range α ≃ −0.9.
5 DISCUSSION
The MeerKAT and uGMRT images presented in this paper cover a frequency range from 550 to 1712 MHz at nearly identical angular resolutions and sensitivities, which is ideal for studying the radio morphology and spectral features in the jets and lobes of radio galaxies. The images obtained with the two arrays, for all the sources studied, are remarkably similar in detail, which gives us confidence in the image integrity, imaging processing, and calibration of the uGMRT and MeerKAT data. The remarkable coincidence of the radio contours with the galaxies in the optical overlay (Fig. 1) gives us confidence in even the lowest contour in our images.
Overall, our images confirm the morphological classification which is reported in Table 1, and which has been made on the basis of images at lower sensitivity and poorer angular resolution. The only exception is CGCG 021–063, which can be classified as FR II radio galaxy. At the same time, each source has revealed interesting features which open new questions and throw light on the complexity of the interplay of the radio plasma emitted by the host galaxy and the surrounding medium in which the jets propagate. Our total intensity and spectral index imaging suggest that we can broadly identify three different regimes in all our sources: a region close to the AGN (and within the optical host) where the FR I and FR II division is relevant and fairly clear, a region further from the AGN where the intragalactic medium (IGM) affects the hotspots, and a third region, which goes beyond the hotspots and bears information on the interaction between the tails and the external medium (as in the case of CGCG 044–046).
Furthermore, the high angular resolution and high sensitivity of our images clearly reveal that substructure in the hotspots is common, which we discuss below.
5.1 Multiple hotspots
The western hotspot in 4C 12.02 has two peaks (labelled in Fig. 3, upper-right panel), and the one closer to the core is perpendicular to the direction of the lobe. The eastern hotspot has three peaks along the direction of the jet flow, and it is notable that the brightest peak is not the outermost one. Some faint emission is also detected beyond the northern hotspot of 4C 12.03, while the southern hotspot is broad and uniform in surface brightness, which is unusual. The bent morphology of CGCG 044–046 is typical of radio galaxies at the centre of groups and clusters of galaxies. At the same time, the structure of the hotspots in the inner part of the source poses the question of what is really bending the jets and how the flow propagates beyond their location. Finally, the north-western hotspot in CGCG 021–063 is not the terminating point of the jet, because the radio emission is detected beyond the hotspot. The hotspot itself has two peaks of comparable brightness and is elongated along the direction of propagation of the jet. The south-eastern hotspot is misaligned with the source axis and has complex morphology perpendicular to the jet axis.
Hotspots are believed to be the result of some form of shock, such as the working surface of the jets when they hit the interstellar medium or the IGM, forming the termination shock, also called the standing or reflected shock front (Hardcastle 2005). The spectral index images shown in Fig. 5 are overall consistent with this idea, but there are some interesting trends that should be noted. On average, the hotspots have flatter spectra than the jets and lobes. However, there are remarkable deviations. For example, 4C 12.02 is intriguing, since the spectral index of the hotspots is not different from the emission of the lobes, at least in the MeerKAT frequency range (856–1712 MHz). The integrated spectrum for this source also suggests that the compact features are not dominant in the emission at high frequency. Additionally, the spectral features of the south-eastern hotspot in CGCG 021–063 are not different from the spectrum of the emission of the adjacent regions of the lobe.
Radio galaxies with multiple knots and hotspots have been known for quite some time, with the hotspots themselves detected even at wavelengths other than radio wavelengths (e.g. Kraft et al. 2005; Hardcastle, Croston & Kraft 2007; Hardcastle & Krause 2014). Our results suggest various possibilities, such as the propagation of the jets through contact discontinuities, or standing shocks. The sensitivity and resolution of our images allow detailed insight into the brightness distribution of the lobes. Furthermore, each of the sources presented here shows features that deserve attention, which are discussed in the next subsection.
5.2 Jets and lobes
The misalignment and asymmetry of the two lobes in 4C 12.02 are remarkable. Moreover, the transition between the hotspot and lobe in the western emission is very sharp. We should note that the size of this radio galaxy places it in the class of giant radio galaxies. The properties of the external medium can thus change considerably through almost 800 kpc and projection effects may play an important role (Krause, Hardcastle & Shabala 2019; Harwood, Vernstrom & Stroe 2020). Furthermore, despite the morphology with prominent hotspots in both directions of the emission, the uniform spectral index between the lobes and hotspots suggests that the latter are no longer replenished.
The X-shaped morphology of 4C 12.03, as well as its spectral index distribution, led us to investigate whether the radiative age in the north–south and in the east-west axes differ, as would be expected if they traced two different cycles of radio activity. The trend of the integrated spectral index in 4C 12.03, shown in Fig. 7 (green line) highlights the contribution of the east-west structure in the total flux density at high frequencies. Assuming an equipartition of energy between relativistic particles and magnetic field, we determine magnetic fields, Beq (and minimum energy densities, ueq, Miley 1980) for the regions encompassing hotspots along the north–south axis and ‘winged’ diffuse radio lobes along the east-west axis. The north and the south hotspots have Beq = 3.8 μG (and ueq = 13.7 × 10⁻¹³ erg cm−3) and Beq = 3.1 μG (and ueq = 9.5 × 10⁻¹³ erg cm−3) respectively, whereas the east and the west diffuse lobes have Beq = 2.1 μG (and ueq = 4.5 × 10⁻¹³ erg cm−3) and Beq = 1.4 μG (and ueq = 2.0 × 10⁻¹³ erg cm−3), respectively. Here we have assumed the ratio of energy in the heavy particles to that in the electrons and the filling factor of the emitting regions to be unity. The sizes of the four regions are symmetrical rectangular regions, each being at least ∼15–20 beams across. From Fig. 7 we estimated a break frequency νbr = 0.69 GHz for the east and west wings, and assumed νbr = 1.2 GHz for the north and south lobes. This leads to radiative lifetimes (Jaffe & Perola 1973) of 40.8 and 41.4 Myr respectively for the north and the south lobes (this value should be considered an upper limit, as the assumed break frequency is a lower limit), and 52.1 and 51.5 Myr for the east and west diffuse lobes, respectively. The estimates of both the equipartition magnetic field and the radiative age, though not conclusive, are consistent with the possibility that the east and west diffuse wings are formed due to hydrodynamic mechanism, i.e. back-flow from the north and south active lobes, as suggested also by the in-band spectral index map of 4C 12.03 (Fig. 5, top-right panel).
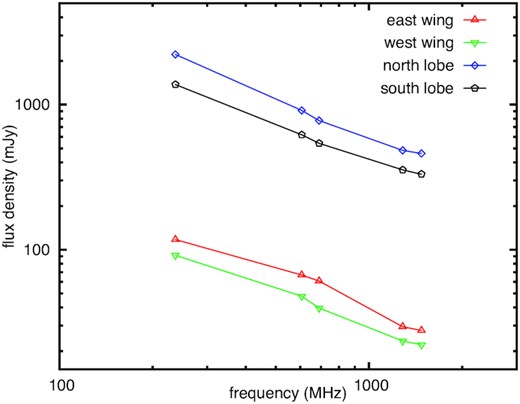
Flux densities as a function of frequency (spectra) for four distinct regions of 4C 12.03 radio galaxy at low radio frequencies (see Section 5.2). The 240 and 610 MHz measurements are from Lal & Rao (2007), the 690 and 1284 MHz measurements are using uGMRT band-4 and MeerKAT L-band images presented here, and the 1.5 GHz measurements are from Leahy & Perley (1991). The error bars are smaller than the size of the symbols.
4C 12.03 is also characterized by two peaks of emission along the north–south jet, symmetrically located with respect to the core and separated by ∼ 80 kpc (Figs 1 and 3). They are well visible also in the spectral index distribution (Fig. 5). They could be either brightness peaks of the underlying jets feeding the hotspots, or an inner double source related to a new cycle of radio activity (Schoenmakers et al. 2000). Unfortunately, our data do not allow us to discriminate between the two alternatives. Finally, we point out that the active axis is not aligned with the axis of the inner double source. The northern hotspot is aligned at ∼10°, and the southern one at ∼40°. It is unclear what could be responsible for such misalignment over scales of several hundreds of kiloparsec.
Unfortunately, the artefacts affecting the images of CGCG 021–063 do not allow a detailed analysis of its features. However, the filamentary structure of the south-eastern lobe is clear and remarkable. The uGMRT total intensity image is suggestive of two parallel channels feeding the hotspots. Alternatively, they could be the outer walls of the propagating continuous stream of radio-emitting synchrotron plasma (labelled in Fig. 3, upper-left panel). Looking more closely at the uGMRT and MeerKAT images together, the two parallel channels in the south lobe are off the line joining the north hotspot through the radio core to the south hotspot, which contradicts the simple picture that the two parallel channels in the south lobe could be feeding the hotspots. It seems more likely that the two channels are leading away from the south hotspot, rather than leading towards it, which then suggests that these parallel channels are probably the reflected shocks or back-flow emission. The MeerKAT in-band spectral index in this region is very uniform, |$\simeq \, -$|0.9, with no apparent transition between the hotspot and the emission feeding it. The jets and hotspots are surrounded by a cocoon and the cocoon could be a result of back-flow emission. It is possible that projection effects play a role in this source, as suggested by the very compact core and the strong asymmetry between the north-east and south-west jets.
5.3 CGCG 044–046
The overall observational properties of CGCG 044–046 source suggest that the local environment plays a major role. More specifically, the physical mechanism giving rise to bent tails is possibly due to the motion of the host galaxy through the ICM. The source extends ∼414 kpc to the west and ∼207 kpc to the south-east, i.e. well into the ICM. The source is remarkably similar to 3C 465, the prototype of wide-angle tail radio galaxy (Eilek et al. 1984; Giacintucci et al. 2007).
The total intensity and spectral index images highlight three different regions of emission beyond the compact flat spectrum core: (1) the inner jets all the way to the hotspots; (2) the central part of the tails, and (3) the terminating part of the tails. The overlay of the MeerKAT contours and the r-band SDSS image of the optical field shows that the hotspots are located outside the envelope of the optical galaxy, at least at the sensitivity level of the r-band SDSS image. We point out that the mg = 16.7 galaxy just north of CGCG 044–046 and within its optical envelope (at least in projection) is VIII Zw 276 and is located at the cluster redshift, z = 0.049567.
The inner jets and the hotspots (region 1) have a fairly uniform spectral index, |$\simeq \, -$|0.6, which is quite flat. The transition between the inner jet and the central part of the tail is sharp in the western part of the radio galaxy, both in the total intensity image and in the spectral index, which steepens to |$\alpha \, \simeq \, -$|0.9. This part of the tail (region 2) shows prominent bending with edge brightening. A sharp spectral transition with similar values is seen beyond the eastern hotspot, too. In the eastern lobe, we note a flatter central ridge with α ≈ −0.7 surrounded by steeper emission with α ≈ −0.9.
In the western emission, the transition from the central to the terminating part of the tail (region 3) is sharp both in the total intensity image and spectral index, which steepens from values around −1.0 to values around −1.5. The eastern lobe, on the other hand, seems to bend behind the emission itself, and we believe that the eastern protrusion (labelled ‘A’ in Fig. 5) with a spectral index as steep as −1.6/−1.8 is the end of the tail.
The origin of these sharp transitions in surface brightnesses and spectral properties is unclear. They could reflect intermittent activity in the radio emission of the AGN and/or significant interaction of the jets and lobes with discontinuities in the IGM.
Further hints of substantial bending come from the polarization properties. This source is the only one with polarization calibration source included in our MeerKAT observation. Patnaik et al. (1986) presented a polarization study at higher frequency (VLA L- and C-band), and was able to constrain rotation measures across the source to within |$\pm 30\, \mathrm{rad}\, \mathrm{m}^{-2}$|. Although these values are under the detectable range with our frequency coverage, we used full-band Q and U maps and did not perform rotation measure analysis.
The upper panel of Fig. 8 shows the electric field vectors superimposed on the MeerKAT total intensity image. There is a remarkable asymmetry in polarization between the western and eastern regions of the radio emission and the two tails differ significantly in polarization fraction. In particular, the central and terminating part of the western tail is much more polarized than the south-eastern one. Our recovered polarization vectors are consistent with Patnaik et al. (1986), but provide more detail across the lobes. Considering that this radio galaxy is at the centre of a galaxy cluster, where dense ICM is usually found, we suggest that the source is not in the plane of the sky and interpret the polarization asymmetry as due to Laing–Garrington effect (Garrington et al. 1988), i.e., an external medium that is denser against the south-eastern lobe.
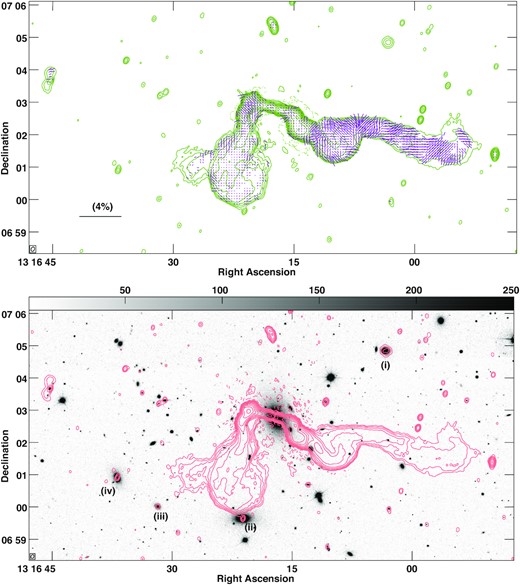
The radio polarization image (upper-panel) and the r-band SDSS (DR12) image (lower-panel) of CGCG 044−046 with the MeerKAT L-band total intensity radio contours overlaid on them. Also overlaid on the polarization image are the EVPA orientation vectors. In both images, the lowest radio contour plotted is approximately three times the local rms noise (= 18.0 μJy beam−1 and 23.5 μJy beam−1, in upper and lower panels, respectively) and increasing by factors of 2. The distribution of E vector position angles are shown, where the vectors have lengths proportional to the degree of polarization p. The length of the vector, 1 arcsec corresponds to 3.125 per cent (the length of the vector corresponding to p = 4 per cent is shown in the lower left corner). No vectors are shown where the polarized signal-to-noise is <4:1. The vectors are shown slightly undersampled, at ∼5 arcsec intervals, for clarity. Four bright galaxies that are also part of the Zwicky cluster 1313.7+0721, of which CGCG 044−046 is the dominant galaxy, are also marked (see also Section 5.3).
As a final remark, we point out that the four bright galaxies with radio emission clearly visible in the lower panel of Fig. 8 are all part of the same Zwicky cluster 1313.7+0721. In particular, using data gleaned from NED (labelled in Fig. 8, lower panel), their names from west to east are as follows: (i) WISEA J131604.49+070453.4 (mg = 18.4) at z = 0.049298; (ii) CGCG 044−047 (m = 15.6) at z = 0.049551; (iii) WISEA J131631.79+070000.9 (no magnitude available) at z = 0.049297; and (iv) WISEA J131636.85+070054.6 (m = 17.11) at z = 0.047596.
6 CONCLUDING REMARKS
In this paper we have presented uGMRT and MeerKAT images of four radio galaxies belonging to a larger sample of 12 FR I and FR II radio galaxies selected from the 4C catalogue with the main goal of investigating whether the sharp differences between the FR I and FR II morphologies still hold with the improved imaging capabilities of the current generation of radio interferometers, or if we need more morphological classes.
We have explored the radio morphology of our four targets – 4C 12.02, 4C 12.03, CGCG 044–046, and CGCG 021–063 – in the light of the superb image sensitivity reached by the uGMRT in the 550–850 MHz band, and by the MeerKAT in the 856–1712 MHz band. The collected information hence seamlessly spans more than 1 GHz in bandwidth. We have supplemented our total intensity data sets with MeerKAT in-band spectral imaging for all sources. Furthermore, for CGCG 044–046 we obtained the uGMRT-MeerKAT spectral structure and MeerKAT polarization information.
The MeerKAT and uGMRT images of all four radio galaxies presented here are remarkably similar in detail, which gives us confidence in image fidelity, imaging processes and calibration of the uGMRT and MeerKAT. Moreover, in all cases, the morphology in the uGMRT band-4 and in the MeerKAT L-band is the same, even in the finest details.
While we conclude that the overall FR I–FR II classification scheme still holds, at least for our targets, the combination of μJy beam−1 sensitivity and high (∼5–7 arcsec) angular resolution over the full 550–1712 MHz range reveals very interesting features. For example, filamentary emission in the lobes and substructure in the hotspots is common. Moreover, in CGCG 044–046, CGCG 021–063 and in the north hotspot of 4C 12.03 the radio emission extends beyond the hotspots themselves. In 4C 12.02 and 4C 12.03 the two hotspots are not at 180° with respect to the core, and it is unclear what may cause such slight misalignment over hundreds of kpc.
The MeerKAT in-band spectral imaging has complemented and confirmed the morphological classification from the total intensity radio images and provided new insights into some of the radio sources. In particular, the uniform steep spectrum in the lobes and hotspots of 4C 12.02 suggests that the hotspots are no longer replenished by fresh electrons. The radio emission in the east-west axis of 4C 12.03 is steeper than the north–south axis, and one possibility is that the former is the result of hydrodynamic back-flow, as has been recently seen in PKS 2014–55 (Cotton et al. 2020). This radio galaxy also shows two inner brightness peaks, which form an inner double ≃80 kpc in size, aligned with the north–south axis of emission. Further investigation will be required to determine if this is the signature of restarted activity.
Finally, the MeerKAT in-band spectral structure and polarization information for CGCG 044–046 shows that most likely the source is not in the plane of the sky and that the observed properties are strongly affected by the cluster environment. We interpret the asymmetries in the polarization properties as due to the Laing–Garrington effect.
Our work further shows that very good image sensitivity over a broad range of angular scales is necessary to perform a detailed study of radio galaxies, and warns against the accuracy of the morphological classification of radio galaxies made with source detection algorithms, especially for surveys made with radio telescopes which have much lower sensitivity to diffuse, low brightness emission.
At least for the sources presented in this paper, we conclude that there is probably little value in establishing a more complicated morphological classification system. It appears to us that the FR I and FR II (and possibly FR 0) morphologies are common and basic and that the complexities are introduced by the local environment, buoyancy and motions through the IGM. All are probably at play, together with reflection, refraction or bifurcation of bow shocks at discontinuities in the IGM. Adding further descriptors (e.g. wide-angle tail or narrow-angle tail) may be useful to link the morphology to the environment in which the lobes are formed or propagate, whereas the FR I/II classification probably describes conditions closer to or more intrinsic to the AGN and host galaxy.
ACKNOWLEDGEMENTS
We thank the anonymous referee for his/her comments that improved and broadened the scope of this paper. DVL acknowledges the support of the Department of Atomic Energy, Government of India, under project no. 12-R&D-TFR-5.02-0700. TV acknowledges the support from the Ministero degli Affari Esteri e della Cooperazione Internazionale, Direzione Generale per la Promozione del Sistema Paese, Progetto di Grande Rilevanza ZA18GR02. OS’s research is supported by the South African Research Chairs Initiative of the Department of Science and Technology, Republic of South Africa and National Research Foundation. DK acknowledges funding from the European Research Council (ERC) under the European Union’s Horizon 2020 research and innovation programme (grant agreement no. 679627). FL acknowledges financial support from the Italian Minister for Research and Education (MIUR), project FARE, project code R16PR59747, project name FORNAX-B. SVW acknowledges the financial assistance of the South African Radio Astronomy Observatory (SARAO). We thank the staff of the GMRT who made these observations possible. The GMRT is run by the National Centre for Radio Astrophysics of the Tata Institute of Fundamental Research. The MeerKAT telescope is operated by the South African Radio Astronomy Observatory, which is a facility of the National Research Foundation, an agency of the Department of Science and Innovation. We are grateful to the full MeerKAT team at SARAO for their work on building and commissioning MeerKAT. This research has made use of the NED, which is operated by the Jet Propulsion Laboratory, Caltech, under contract with the NASA, and NASA’s Astrophysics Data System.
DATA AVAILABILITY
The GMRT data underlying this article are available via the GMRT online archive facility.5 The MeerKAT data will be publicly available via the SARAO archive6 (proposal ID SCI-20190418-BF-01) after the end of the proprietary period in mid-2021, but may be shared earlier upon reasonable request to the corresponding author. All data analyses packages used in this work are publicly available, and their URLs have been noted in the main text.
Footnotes
The GMRT wideband correlator supports a bandwidth of 400 MHz, 200 MHz, ..., in multiples of 0.5. The usable bandwidth of band-4 is 300 MHz, from 550 to 850 MHz.
