


ABSTRACT
Andromeda XXI (And XXI) has been proposed as a dwarf spheroidal galaxy with a central dark matter density that is lower than expected in the standard |$\Lambda$| cold dark matter (|$\Lambda$|CDM) cosmology. In this work, we present dynamical observations for 77 member stars in this system, more than doubling previous studies to determine whether this galaxy is truly a low-density outlier. We measure a systemic velocity of |$v_r=-363.4\pm 1.0{\rm \, km\, s^{-1}}$| and a velocity dispersion of |$\sigma _v=6.1^{+1.0}_{-0.9}{\rm \, km\, s^{-1}}$|, consistent with previous work and within |$1\sigma$| of predictions made using the modified Newtonian dynamics framework. We also measure the metallicity of our member stars from their spectra, finding a mean value of |${\rm [Fe/H]}=-1.7\pm 0.1$| dex. We model the dark matter density profile of And XXI using an improved version of gravsphere, finding a central density of |$\rho _{\rm DM}({\rm 150 pc})=2.6_{-1.5}^{+2.4} \times 10^7 \, {\rm M_\odot \, kpc^{-3}}$| at 68 per cent confidence, and a density at two half-light radii of |$\rho _{\rm DM}({\rm 1.75 kpc})=0.9_{-0.2}^{+0.3} \times 10^6 \, {\rm M_\odot \, kpc^{-3}}$| at 68 per cent confidence. These are both a factor of|${\sim }3\!-\!5$| lower than the densities expected from abundance matching in |$\Lambda$|CDM. We show that this cannot be explained by ‘dark matter heating’ since And XXI had too little star formation to significantly lower its inner dark matter density, while dark matter heating only acts on the profile inside the half-light radius. However, And XXI’s low density can be accommodated within |$\Lambda$|CDM if it experienced extreme tidal stripping (losing |${\gt}95{{\ \rm per\ cent}}$| of its mass), or if it inhabits a low-concentration halo on a plunging orbit that experienced repeated tidal shocks.
1 INTRODUCTION
In recent years, a number of galaxies with surprisingly low central dark matter densities have been discovered in the Local Group. It has long been observed that low-surface-brightness galaxies have lower central densities than predicted by pure cold dark matter (CDM) simulations. Early work showed that their density profiles are more consistent with centrally flat cores rather than the steep cusps predicted by CDM (e.g. Flores & Primack 1994; de Blok et al. 2001; Read et al. 2017). More recently, comparisons of the dwarf spheroidal (dSph) satellites of the Milky Way (MW) and Andromeda (M31) with dark matter only simulations show that the observed dSphs also possess a lower density within in their half-light radii (|$r_{\rm half}$|) as a population than expected, and this is referred to as the ‘Too Big to Fail’ (TBTF) problem (e.g. Boylan-Kolchin, Bullock & Kaplinghat 2011; Tollerud et al. 2012; Collins et al. 2014). For most of these systems, it is likely that repeated gravitational potential fluctuations, driven by feedback from star formation, has played a role in softening their central cusps over time into flatter cores (e.g. Navarro, Eke & Frenk 1996a; Read & Gilmore 2005; Pontzen & Governato 2012; Zolotov et al. 2012; Brooks & Zolotov 2014; Oñorbe et al. 2015; Read, Agertz & Collins 2016; Read, Walker & Steger 2019). This process – that has become known as ‘dark matter heating’ – is only effective in galaxies above some stellar mass-to-halo-mass ratio threshold (|$M_*/M_{200} \sim 5 \times 10^{-4}$|; Di Cintio et al. 2014a,b), and for systems with extended star formation (Read et al. 2016, 2019).
However, the low-density problem seems particularly acute in some of the more diffuse companions of the MW and Andromeda. Around our Galaxy, two extremely diffuse satellites – Antlia 2 and Crater II (Torrealba et al. 2016, 2019) – have been uncovered, whose half-light radii far exceed that expected from their similarly bright counterparts. Both objects have a surface brightness of |$\mu _0\gt 30$| mag arcsec|$^{-2}$|, and effective radii in excess 1 kpc (|$r_{\rm half}= 1.1$| and |$2.9\, {\rm kpc}$|, respectively). Similarly, in M31, the extreme object Andromeda XIX was discovered by McConnachie et al. (2008) in the Pan-Andromeda Archaeological Survey, with |$\mu _0=29.2\pm 0.4$| mag arcsec|$^{-2}$| and |$r_{\rm half}=3.1^{+0.9}_{-1.1}\, {\rm kpc}$| (Martin et al. 2016). All three of these ‘feeble giants’ also appear to reside in surprisingly low-mass haloes. Through measured velocity dispersions, their mass within |$r_{\rm half}$| are far lower than expected for systems of their size or brightness (Caldwell et al. 2017; Fu, Simon & Alarcón Jara 2019; Torrealba et al. 2019; Collins et al. 2020), raising questions about whether they can be understood in the context of the |$\Lambda$| cold dark matter (|$\Lambda$|CDM) framework. For these systems, it is unlikely that star formation feedback alone can explain their low densities. Thus, far, detailed star formation histories are not available for these objects, but even assuming highly efficient dark matter heating, their current sizes, surface brightness, and velocity dispersions cannot be reproduced (Torrealba et al. 2019). Instead, it is assumed they must also have undergone extreme tidal interactions while orbiting their host galaxy (e.g. Fattahi et al. 2018).
There are two main tidal effects that can act to lower the density of orbiting satellites: tidal stripping and tidal shocking. Tidal stripping occurs when the tidal force from the host galaxy exceeds that from the satellite, causing dark matter and/or stars to become unbound (e.g. von Hoerner 1957; Read, Pontzen & Viel 2006b). Since this peels away stars and dark matter from the outside in, it only lowers the inner density after extreme stripping has occurred. For cuspy dark matter profiles, this means losing >99 per cent of the satellite’s initial mass (Peñarrubia, Navarro & McConnachie 2008; Peñarrubia et al. 2010a; Errani & Peñarrubia 2020). Shallower or cored dark matter profiles require less extreme mass-loss (Read et al. 2006a; Peñarrubia et al. 2010a; Brooks & Zolotov 2014). Tidal shocking occurs for satellites moving on eccentric orbits if the external gravitational field changes more rapidly than the internal dynamical time of the stars and/or dark matter. This means that tidal shocks are maximized at pericentre, where the external field changes most rapidly (e.g. Spitzer 1958; Gnedin, Hernquist & Ostriker 1999), and for low-density satellites, since the internal orbit time goes as |$\rho ^{-1/2}$|, where |$\rho$| is the total density. For this reason, in the context of |$\Lambda$|CDM, satellites on plunging orbits can only efficiently lower their density through tidal shocks if they have a central dark matter core (e.g. Read et al. 2006a; Errani et al. 2017; Errani & Peñarrubia 2020; van den Bosch & Ogiya 2018), or if they inhabit low-concentration dark matter haloes before infall (Amorisco 2019). Unlike dark matter heating, the combination of tidal stripping and shocking will lower the satellite’s density at all radii, not just in the centre (e.g. Kazantzidis et al. 2004; Read et al. 2006a). However, it can be challenging to detect, observationally, when this has occurred. The tell-tale signatures of tides – stellar streams, distorted outer stellar isophotes, and/or tangential anisotropy – all manifest in the low surface brightness stellar outskirts (e.g. Read et al. 2006a; Ural et al. 2015; Amorisco 2019; Genina et al. 2020).
For Antlia 2 and Crater II, proper motions can be measured from Gaia DR2 (Fritz et al. 2018; Fu et al. 2019; Torrealba et al. 2019), and both are consistent with being on radial orbits that bring them within a few tens of kpc from the Galactic Centre – the regime in which tidal shocks are likely important (Read et al. 2006a). As such, it has been argued that tidal processes govern the evolution of these galaxies (Sanders, Evans & Dehnen 2018; Amorisco 2019). Indeed, a plunging orbit for Antlia 2 could also explain observed disturbances in the outer H i disc of the MW (Chakrabarti et al. 2019). A precise orbit for Andromeda XIX has not been determined, but from its structural and dynamical properties, it is possible that this galaxy is also on a similarly plunging orbit (McConnachie et al. 2008; Martin et al. 2016; Collins et al. 2013, 2020). To determine whether all low-mass extended galaxies can be explained in this manner in |$\Lambda$|CDM, however, we need to study more systems.
In this work, we turn our attention to another significant low-mass outlier, Andromeda XXI (And XXI). This M31 satellite has a luminosity of |$L=3.2\times 10^5\, {\rm L_\odot }$| and a half-light radius of |$r_{\rm half}=1033^{+206}_{-181}\, {\rm pc}$| (Martin et al. 2016; Weisz et al. 2019a), approximately three times more extended than other galaxies of comparable luminosity. And, based on an earlier dynamical study, it has a low central velocity dispersion of |$\sigma _v=4.5^{+1.2}_{-1.0}\, {\rm \, km\, s^{-1}}$|, consistent with residing in a very low density halo (Collins et al. 2013, 2014). However, these findings were based on dynamics of only 32 member stars, meaning that detailed dynamical modelling of its halo could not be carried out. In this work, we reanalyse the mass for And XXI using dynamics for 77 member stars, modelling its radial dark matter density profile for the first time with an updated version of the gravsphere Jeans code (Read et al. 2017; Read & Steger 2017; Read, Walker & Steger 2018; Gregory et al. 2019; Genina et al. 2019). We combine our dynamical analysis with the measured star formation history for this galaxy from Weisz et al. (2019b) to determine whether its central density can be explained by dark matter heating driven by stellar feedback (e.g. Navarro, Eke & Frenk 1996b; Read & Gilmore 2005; Pontzen & Governato 2012; Read et al. 2016, 2019), and to assess what role – if any – tidal interactions may play in explaining its properties.
This paper is organized as follows. In Section 2, we start by discussing our observations. We then present the observed dynamics and metallicity of our member stars in Section 3. In Section 4, we describe several improvements we have made to the gravsphere code to improve its performance for modelling systems with small numbers of stars, and we present our dynamical modelling of And XXI (tests of our new method on mock data are included for completeness in Appendix A). In Section 5, we discuss our results and set them in the context of prior work in the literature. Finally, in Section 6, we present our conclusions.
2 OBSERVATIONS
2.1 DEIMOS spectroscopy
Spectroscopic observations of And XXI were undertaken using the Deep Extragalactic Imaging Multi-Object Spectrograph (DEIMOS; Faber et al. 2003; Cooper et al. 2012), which is mounted on the Keck II telescope in Mauna Kea. The multiobject mode of DEIMOS allows us to simultaneously observe |${\sim}150$| stellar targets in a single pointing, spread across the significant field of view of DEIMOS (|$16\,{\rm arcmin}\times 8\,{\rm arcmin}$|, which translates to |${\sim}3.5{\rm \, kpc}\times 1.3$| kpc at the distance of Andromeda). These aspects make DEIMOS ideal for surveying And XXI, whose half-light radius of |$1033^{+206}_{-181}\, {\rm pc}$| (Martin et al. 2016; Weisz et al. 2019a) fits comfortably within a single mask. The observations presented in this work are taken from three DEIMOS masks, which were observed in 2011 September (previously presented in Collins et al. 2013) and 2013 October as part of the Z-PAndAS spectroscopic survey (PI: Rich). The instrumental set-up for each mask was identical, and used the 1200 line mm|$^{-1}$| grating (resolution of 1.4-Å FWHM). A central wavelength of 7800 Å was used, allowing us spectral coverage from |${\sim}5600 \ {\rm to} \ 9800$| Å. This permitted us to resolve the region of the calcium triplet (Ca ii) at |$\lambda \sim 8500$| Å, a strong absorption feature that we use to determine both velocities and metallicities for our observed stars. The exposure time for the mask observed in 2011 was 3600 s (in |$3\times 1200$| s subexposures), while the two 2013 masks were observed for 7200s (in |$6\times 1200$|s subexposures). The average seeing per mask was 0.6, 0.8, and 0.7 arcsec, resulting in typical S/N values of |${\sim}5$| per pixel. We present the details of each observed mask in Table 1.
Details of And XXI spectroscopic observations (PI: Rich).
| Mask name | Date | RA | Dec. | Position angle (°) | Exposure time (|${\rm s}$|) | No. targets | No. members |
|---|---|---|---|---|---|---|---|
| 7And21 | 2011 Sep 26 | 23:54:47.70 | 42:28:33.6 | 180 | 3600 | 157 | 32 |
| A21maj | 2013 Oct 1 | 23:54:47.70 | 42:28:15.0 | 147 | 7200 | 112 | 26 |
| A21min | 2013 Oct 1 | 23:54:47.70 | 42:28:15.0 | 57 | 7200 | 110 | 30 |
Note. A total of 88 And XXI velocities were measured, for 77 independent stars (11 repeat measurements).
We reduce the resulting science spectra using a custom built pipeline, as described in Ibata et al. (2011) and Collins et al. (2013). Briefly, the pipeline identifies and removes cosmic rays, corrects for scattered light, illumination, slit function and fringing before performing flat-fielding to correct for pixel-to-pixel variations. We perform a wavelength calibration of each pixel using arc-lamp exposures. Finally, we subtract the sky from the two-dimensional spectra before extracting each spectrum – without resampling – in a small spatial region around the target. We then derive velocities for all our stars using the Ca ii triplet absorption feature. The velocities are determined using a Markov chain Monte Carlo procedure where a template Ca ii spectrum was cross-correlated with the non-resampled data, generating a most likely velocity for each star, and a likely uncertainty based on the posterior distribution that incorporates all the uncertainties for each pixel. Typically our velocity uncertainties lie in the range of 3–15 km s−1. Finally, we also correct these velocities to the heliocentric frame.
As we aim to combine kinematic data from three masks, observed at different times and in different conditions, it is imperative that we correct our final velocities for any systematic shifts caused by misalignments of stars within the slits themselves. Such misalignments can be caused by astrometry errors or from a slight offset of the position angle of the mask on the sky, and can introduce velocity shifts in our spectra of up to |${\sim}15{\rm \, km\, s^{-1}}$| (Collins et al. 2013). Such shifts can be corrected for using atmospheric telluric absorption lines, which are imprinted on each of our spectra. As they originate from the atmosphere, they should always be observed at their rest-frame wavelength. By cross-correlating the science spectra with a model telluric spectrum, one can measure and correct for any velocity shifts introduced by the types of misalignments mentioned above. As a further check for any misalignments, we also look for signatures of velocity gradients along each of our masks for our likely And XXI member stars. We find no evidence of any gradients. We also check for any change in velocity uncertainty with mask position, and again find no correlation.
Within our catalogue, we have eight stars with more than one velocity measurement. We use these to check our velocity calibrations described above are reasonable. We find a mean (median) offset velocity for these stars of |$v_{\rm offset}=1.2~(2.8)\, {\rm \, km\, s^{-1}}$|, both of which are within our typical velocity uncertainties. As we have only a small handful of duplicates, we cannot use these to re-derive an independent measurement of the systemic velocity uncertainty inherent to DEIMOS. Instead, we use the value determined from observations of stars in Galactic satellites by Simon & Geha (2007) of |$2.2\, {\rm km\, s^{-1}}$|. We find the velocity differences for our eight duplicates to be fully consistent with this value. We combine this in quadrature with the individual velocity uncertainties described above. We could instead use the value of |$3.4\, {\rm km\, s^{-1}}$| from Martin et al. (2014), which was derived from observations of M31 dSphs reduced with the same pipeline as this work. However, using a higher value will bias us to a slightly lower value for the dispersion of And XXI. As we are aiming to confirm whether this system is low mass, we find the Simon & Geha (2007) value to be a more conservative approach. We provide all measured velocities, metallicities, and other reduced properties for our member and non-member stars in an electronic file, available online at the journal website. The reduced spectra are also available upon request, while the raw data are available through the Keck archive.
2.2 Subaru SuprimeCam imaging
Finally, we extinction correct all our data using the dust maps of Schlegel, Finkbeiner & Davis (1998). Our final colour–magnitude data for these data are shown in Fig. 1.
![A colour–magnitude diagram (CMD) for And XXI, constructed from Subaru Suprime-Cam data. Likely members of And XXI with spectroscopic data are highlighted as large points, colour-coded by probability of membership (derived from imaging and spectroscopic data). The red giant branch can be clearly seen. The solid line is an isochrone from the Dartmouth data base with [Fe/H] $=-1.8$, $[\alpha /$Fe] $=0.4$, age = 12 Gyr, shifted to the distance modulus of And XXI, $m-M=24.6$ (Dotter et al. 2008; Conn et al. 2013). The stars in the possible M31 stream are highlighted as grey squares. Four of them lie along a similar RGB that would be well described with an isochrone of [Fe/H] $\sim-1.5$.](https://oup.silverchair-cdn.com/oup/backfile/Content_public/Journal/mnras/505/4/10.1093_mnras_stab1624/1/m_stab1624fig1.jpeg?Expires=1750484502&Signature=tPQ~R61TQkhCKJtLhUJtnkQfaGUiqyZSHYQfr2gwTKnY8wzszqwt-0YYGhBmkdNF942XLa1ozOLk6FIuqXd7Z6aFxL0gDPFmbSehP3-BNu-39hZRtibQBJcpQZ2Fw-nkGMvFsaQzx1yqnPHFBJHXHKsCah1mkgP~1E8SDZNjFyhLRW1~I8SnGI6DZm0rVorwT4hBO64DiTVDxfpz3jJydvAWLSP6PnKTlWKzKJxHHqh3JlEJX9pBZuiON0l8gYyKNfd6bijvnNm56erk4AJJ98oRUh3oUsPWqWVJOTw3hpJhKeSCiM-fAylpIcWRE2YJ97IUlMQvDI6-KzaZhKiNmA__&Key-Pair-Id=APKAIE5G5CRDK6RD3PGA)
A colour–magnitude diagram (CMD) for And XXI, constructed from Subaru Suprime-Cam data. Likely members of And XXI with spectroscopic data are highlighted as large points, colour-coded by probability of membership (derived from imaging and spectroscopic data). The red giant branch can be clearly seen. The solid line is an isochrone from the Dartmouth data base with [Fe/H] |$=-1.8$|, |$[\alpha /$|Fe] |$=0.4$|, age = 12 Gyr, shifted to the distance modulus of And XXI, |$m-M=24.6$| (Dotter et al. 2008; Conn et al. 2013). The stars in the possible M31 stream are highlighted as grey squares. Four of them lie along a similar RGB that would be well described with an isochrone of [Fe/H] |$\sim-1.5$|.
3 RESULTS AND ANALYSIS
In this section we present our measurements of the basic chemodynamic properties of And XXI. All numerical results are reported in Table 2. Throughout our analysis we make use of various python packages, specifically numpy, scipy, astropy, and matplotlib (Harris et al. 2020; Virtanen et al. 2020; Astropy Collaboration et al. 2018; Hunter 2007).
The properties of And XXI.
| Property | |
|---|---|
| |$\alpha ,\delta$| (J2000)|$^1$| | 23:54:47.9, +42:28:14 |
| |$m_{V,0}^a$| | |$15.5\pm 0.3$| |
| |$M_{V, 0}^a$| | |$-9.1\pm 0.3$| |
| Distance (kpc) |$^b$| | |$827^{+23}_{-25}$| |
| |$r_{\rm half}$| (arcmin) |$^a$| | |$4.1^{+0.8}_{-0.4}$| |
| |$r_{\rm half}$| (pc)|$^a$| | |$1005\pm 175$| |
| |$\mu _0$| (mag arcsec−2)|$^a$| | |$28.0\pm 0.3$| |
| L (|${\rm L}_\odot)^a$| | |$3.2^{+0.8}_{-0.7}\times 10^5$| |
| |$v_r ({\rm \, km\, s^{-1}})^c$| | |$-363.4\pm 1.0$| km s|$^{-1}$| |
| |$\sigma _v ({\rm \, km\, s^{-1}})^c$| | |$6.1^{+1.0}_{-0.9}$| km s|$^{-1}$| |
| |$M(r\lt 1.8r_{\rm half} ({\rm M}_\odot)^c$| | |$3.0^{+0.9}_{-0.8}\times 10^7$| |
| |$[M/L]_{\rm half} ({\rm M}_\odot /{\rm L}_\odot)^c$| | |$78^{+30}_{-28}$| |
| |$[{\rm Fe/H}]$| (dex) |$^c$| | |$-1.7\pm 0.1$| |
3.1 Classifying And XXI member stars
Prior values used in our emcee analysis.
| Component | Prior | |
|---|---|---|
| |$v_{r}\, ({\rm \, km\, s^{-1}})$| prior | |$\sigma _v \, ({\rm \, km\, s^{-1}})$| | |
| And XXI | |$-400\lt v_{r}\lt -340$| | |$0\lt \sigma _{v}\lt 50$| |
| Milky Way | |$-90\lt v_{r}\lt 0$| | |$0\lt \sigma _{v}\lt 150$| |
| M31 | |$-340\lt v_{r}\lt -220$| | |$0\lt \sigma _{v}\lt 150$| |
We then combine these three probabilities (|$P_{\rm CMD}, P_{\rm dist}, P_{\rm A21}$|) and calculate the likelihood of a given star being a member of And XXI. The results of this analysis are shown in Fig. 2, where we display the kinematic distribution of all stars in the left-hand panel, with the most likely stars highlighted in red. The right-hand panel shows the distance of the stars from the centre of And XXI as a function of their velocity, colour-coded by their probability of membership, |$P_{\rm member}$|. The dashed line represents |$r_{\rm half}$|. Already an interesting trend can be seen here, as the stars within the half-light radius show a far broader dispersion than those located further out. While only 10 stars contribute to this outer population, it is certainly striking.
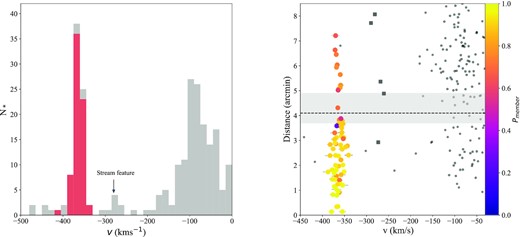
Left-hand panel: velocity histogram of all stars observed in our three DEIMOS fields, highlighting And XXI members (|$P_{\rm member}\gt 0.1$|) in red. A kinemtically cold feature in the M31 halo is also highlighted.Right-hand panel: the distance from the centre of And XXI as a function of velocity. All probable And XXI members are colour-coded by probability of membership. The half-light radius is indicated as a dashed line, with the grey shaded region indicating the |$1\sigma$| uncertainties on this value (Martin et al. 2016). Interestingly, a clear difference can already be seen at this boundary, where the stars within |$r_{\rm half}$| show a significantly larger dispersion than those beyond |$r_{\rm half}$|. The stars in the possible M31 stream are highlighted as grey squares.
In total, we identify 77 stars with |$P_{\rm member}\gt 0.1$| as probable members of And XXI (a factor of 2.5 increase compared with 32 in our previous study, Collins et al. 2013). All our non-members have |$P_{\rm member}\lt \lt 0.1$|, significantly lower than our lowest probability member. We find that our results are insensitive to this choice, as all but five members have |$P_{\rm member}\gt 0.6$|.
where |$\sigma =\sqrt{\sigma _{v}^2+\delta _{v,i}^2}$| is the combination of the underlying velocity dispersion of And XXI and the velocity uncertainty of individual stars (|$\delta _{v,i}$|). |$P_{{\rm member}, i}$| is the probability of membership of the ith star. We again use emcee to investigate the parameter space, using the results from our first pass as the initial starting guess for And XXI’s parameters, and the same uniform priors. The resulting posterior distribution can be seen in Fig. 3. Both the systemic velocity and velocity dispersion are well resolved, giving median values of |$v_r=-363.4\pm 1.0$| and |$\sigma _v=6.1^{+1.0}_{-0.9}{\rm \, km\, s^{-1}}$|, where the uncertainties are the 68 per cent percentiles of the posterior distributions. These values are nearly identical to our three-component, kinematic-only approach above. They are also consistent with C13 values derived from 32 stars of |$v_{r,C13}=-362.5\pm 0.9$| and |$\sigma _{v,C13}=4.5^{+1.2}_{-1.0}{\rm \, km\, s^{-1}}$|. Given this similarity, it is likely that And XXI still resides in a low-mass halo, as found by C13. We return to this issue in Section 4.
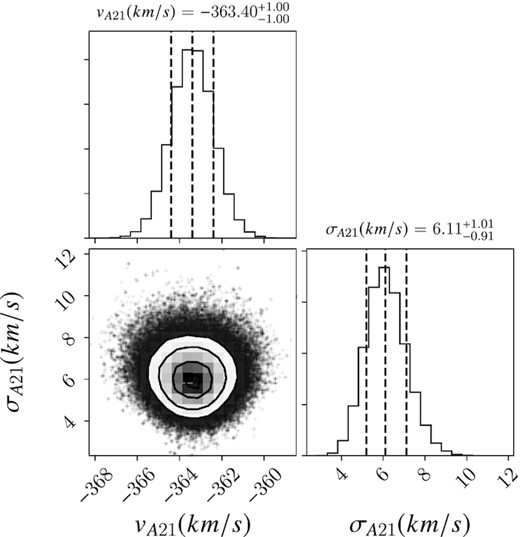
A corner plot showing the results of our kinematic analysis using emcee. Both velocity and velocity dispersion are well resolved, giving |$v_r=-363.4\pm 1.0$| and |$\sigma _v=6.1^{+1.0}_{-0.9}$|.
To investigate the visually striking change in dispersion at |$r_{\rm half}$| seen in Fig. 2, we run the same MCMC process on stars inside and outside this boundary. The results for |$v_r$| are fully consistent for both samples, but |$\sigma _v$| changes dramatically. For the 67 central stars, we measure |$\sigma _v(r\lt r_{\rm half})=6.9^{+1.1}_{-1.0}\, {\rm \, km\, s^{-1}}$|, consistent with our main analysis. However, for the 10 stars at larger radii, we find |$\sigma _v(r\gt r_{\rm half})=1.8^{+2.0}_{-1.2}\, {\rm \, km\, s^{-1}}$|. This is a puzzling difference. As we only have 10 stars in the outer sample, it is hard to draw a strong conclusion about this significant drop at this time.
3.2 The kinematic distribution of And XXI
With our sample of 77 stars in And XXI, we can measure how the radial velocity and velocity dispersion behave as a function of radius, and attempt to map its mass profile. Typically, dSphs are dispersion supported, with little to no rotation, and we expect them to have a reasonably constant systemic velocity (and velocity dispersion) as a function of radius. In Fig. 4, we show how the systemic velocity (top panel) and velocity dispersion (bottom panel) vary as a function of radius in the system. We construct this figure by arranging our stars into five equal-sized bins, each with 19 stars. We only include stars with |$P_{\rm member}\gt 0.1$|. In each bin, we compute |$v_r$| and |$\sigma _v$| using the same technique as before (equation 6). What is immediately striking is that there is a non-symmetric variation of both these quantities with respect to the global values (dashed lines) derived in Section 3.1. From the velocity profile, we note that the |$v_r$| determined for the first and third bins (at |${\sim}1$| and 3.5 arcmin) are inconsistent with one another, and the systemic velocity at a significance of |${\gt}2\sigma$|. Such fluctuations may indicate that this is not a system in dynamical equilibrium.
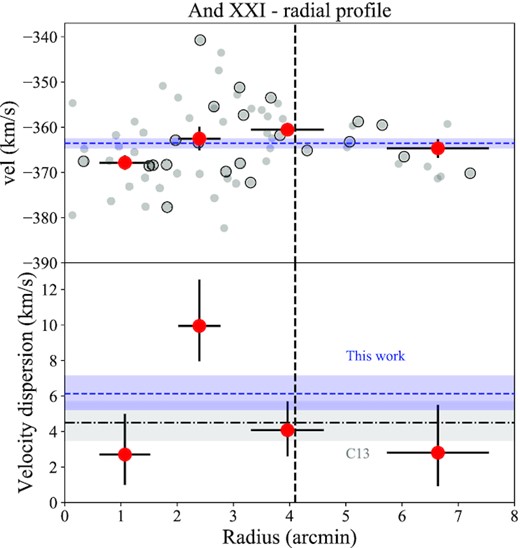
Radial velocity profile (top panel) and velocity dispersion profile (bottom panel) for And XXI. Individual stellar velocities are also shown in the top panel as small grey points, with those from our original survey highlighted as encircled points. The blue dashed lines and shaded regions represent the systemic velocity and dispersion for the whole data set, plus their |$1\sigma$| confidence intervals as calculated using our MCMC approach. In the lower panel, we also show the average dispersion derived from our previous work (C13) as a dot–dashed line and grey shaded region. Our new value is slightly higher, but perfectly consistent within the uncertainties with C13. From the velocity profile, it appears that this system is not in equilibrium, as variations around the systemic are often significant (|${\gt}1\sigma\!-\!2\sigma$|). The dispersion profile is also surprising. As all our data are within |${\sim}2\times r_{\rm half}$|, one expects the profile to remain constant as a function of radius owing to the extended dark matter halo. Instead, we see that the majority of the profile is flat, with a dispersion of |${\sim}3\!-\!5{\rm \, km\, s^{-1}}$|, with the exception of a far hotter bin at |${\sim}2\,{\rm arcmin}$|. This bin has a dispersion that is inconsistent with the others at a level of |${\sim}2\sigma$|.
Equally striking is the behaviour of the velocity dispersion as a function of radius. As dSph galaxies are thought to be deeply embedded within extended dark matter haloes, one expects the velocity dispersion of the galaxy to trace this component. As such, it should remain constant as a function of radius out to many half-light radii. However, we have already seen that the dispersion in the outskirts of And XXI is significantly lower than the central value, and this is further demonstrated here. What we see is that the majority of the stellar population has a dispersion consistent with |${\sim}2{-}4{\rm \, km\, s^{-1}}$|, with the exception of one bin at |${\sim}2\,{\rm arcmin}$| (|${\sim}480$| pc), which appears significantly dynamically hotter. This can even be seen in the raw data shown in Fig. 2. Is this some signature of substructure, or merely an artefact of small number statistics?
Such bumps and wiggles in the dynamical profiles of dSphs have previously been observed (e.g. Andromeda II and XIX; Amorisco, Evans & van de Ven 2014; Collins et al. 2020). These have been interpreted as evidence of mergers, tidal effects, substructure, or just random fluctuations in the data. To investigate how often one expects to see such variation about the mean, we run tests on mock data.
First, we measure the Χ2 goodness of fit of our velocity and dispersion data (where we compare each bin to the mean of the full sample). We measure this to be |$\chi _v=5.0$| for the velocity profile, and |$\chi _s=6.4$| for the dispersion profile. Next, we generate a mock data set for our And XXI data. We use the posteriors generated from our MCMC analysis for each of our And XXI, M31 halo, and MW contaminants to define the kinematics for each populations. We then randomly draw 77, 12, and 163 stars from these distributions for each population respectively (matching our observed sample sizes). These would represent the ‘true’ velocities. We then perturb these using uncertainties equivalent to those of our observed stars. We assign them a radial position based on the observed radial distribution of our sample (which follows the shape of a lognormal profile). We then construct radial velocity profiles for this mock data in the exact same way as our real data. This process is repeated 1000 times.
We then compare the Χ2 statistics for the radial profiles in |$v_r$| and |$\sigma _v$| for each realization with our observations. We find that 38/1000 realizations have |$\chi _v\ge 5.0$|, 35/1000 realizations have |$\chi _s\gt 6.4$|, and 13/1000 cases satisfy both criteria. We show examples of a random selection of ‘normal’ (better Χ2) and ‘outlier’ (higher Χ2) realizations in Fig. 5. Statistically, our observed distribution can be drawn from a dwarf galaxy with a flat, Gaussian profile |${\sim}1.3{{\ \rm per\ cent}}$| of the time (a 2.5|$\sigma$| event). As such, it is an interesting anomaly, but not strong evidence for substructure. More data would resolve whether this is a true feature, or merely noise in the data.
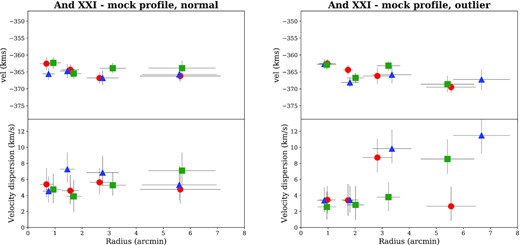
Left-hand panels: radial velocity profile (top panels) and velocity dispersion profile (bottom panels) for three random realizations of our mock data (shown with red circles, green squares and blue triangles). These profiles all have Χ2 values lower than our observed data, and so show ‘normal’ flat velocity and dispersion profiles. Right-hand panels: as the left-hand panels, but for mock realizations where the Χ2 values for both systemic velocity and velocity dispersion are similar to our observed data. We see very similar behaviour, where most of the galaxy has a dispersion of |$3{-}5{\rm \, km\, s^{-1}}$|, but one to two bins show dispersions of the order of|$10{\rm \, km\, s^{-1}}$|. This is seen in |${\sim}1.5{{\ \rm per\ cent}}$| of all mock realizations, indicating our observed distribution could merely be a statistical fluke.
Finally, we construct major and minor axis profiles of And XXI (shown in Fig. 6) to see whether there are any signs of rotation about these axes. Both appear flat, suggesting there is no (significant) rotation in And XXI. As a final check, we use the same MCMC technique from Collins et al. (2020) to search for a signature of rotation along any arbitrary axis, however no such signal is found.
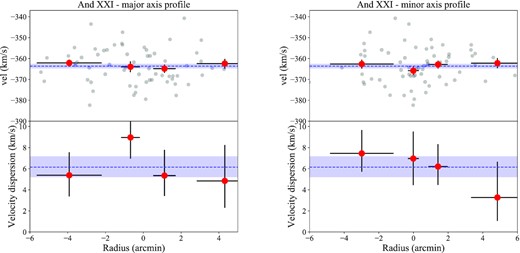
Velocity profiles and dispersion profiles along the photometric major (left-hand panels) and minor (right-hand panels) axis. Neither the major nor minor axis shows evidence for rotation or a velocity gradient, and there is significant scatter around both the systemic velocity and average dispersion.
3.3 An interesting feature in the M31 halo
Our kinematic sample also contains 13 likely M31 halo stars. There are too few to precisely determine the kinematics of the halo at this distance, but our initial MCMC process finds |$v_{\rm M31}=-273^{+40}_{-37}$| and |$\sigma _{\rm M31}=135^{+28}_{-24}\, {\rm \, km\, s^{-1}}$|, broadly consistent with previous studies of the halo (e.g. Chapman et al. 2006; Gilbert et al. 2018). But interestingly, five of these stars are quite clustered in velocity around |$v_r=-270\, {\rm \, km\, s^{-1}}$| (highlighted as grey squares in Fig. 2). Four of these stars are also very close in CMD space, lying along an isochrone of [Fe/H] |$=-1.5$| (as shown in Fig. 1. It is possible that this is a detection of an unresolved stellar stream in the M31 halo. Features like these are often seen in M31 halo fields in both imaging and dynamics, as discussed in e.g. Gilbert et al. (2012, 2018) and Ibata et al. (2014), and likely relate to ancient accretions or stripping of low-mass systems.
With so few stars, it is hard to conclude much about this feature, but the frequency of such detections in both PAndAS and SPLASH is yet further evidence for the rich merger history of Andromeda.
3.4 Metallicity
We measure the metallicity of our And XXI member stars using the equivalent widths of the three Ca ii triplet absorption lines. These features are well-known to allow a proxy for iron abundance measurements, [Fe/H], in RGB stars (e.g. Armandroff & Da Costa 1991). We perform this for all stars with |${\rm S/N}\gt 5$| per pixel, and we show a representative sample of these spectra in Fig. 7. We follow the technique of Collins et al. (2013), and begin by fitting the continuum of each spectrum, and then normalizing them (such that the mean continuum is equal to 1). We then fit the three Ca ii lines with Gaussian profiles, and use the calibration of Starkenburg et al. (2010) to convert their equivalent widths into a measure of [Fe/H]. We present the metallicity distribution function for 30 stars that pass the |${\rm S/N}$| cut, and that have metallicity uncertainties of less than 0.8 dex in Fig. 8. We see that the distribution is centred around |$[{\rm Fe/H}]=-1.7\pm 0.1$|. We cannot resolve a metallicity spread given the large uncertainties in our measurements, measuring |$\sigma _{\rm [Fe/H]}=0.1\pm 0.1$| dex. We find |$\sigma _{\rm [Fe/H]}\lt 0.5$| dex at a 99 per cent confidence. There is perhaps an interesting over density of stars with [Fe/H] |$\sim -1$|, which could imply a relatively metal-rich subpopulation and a more complex SFH than the single orbit HST imaging of And XXI imply (Weisz et al. 2019b). The mean metallicity for And XXI is perfectly consistent with the luminosity–metallicity relation for Local Group dwarf galaxies, as can be seen in Fig. 9 (with the Andromeda subsystem shown as red circles, and the MW as blue triangles, Kirby et al. 2013; Tollerud et al. 2012; Collins et al. 2013, 2017, 2020; Kirby et al. 2013; Martin et al. 2013; Ho et al. 2015; Wojno et al. 2020). The best fit to this relation from Kirby et al. (2013) is shown as a dashed black line, with the grey band representing the |$1\sigma$| scatter.
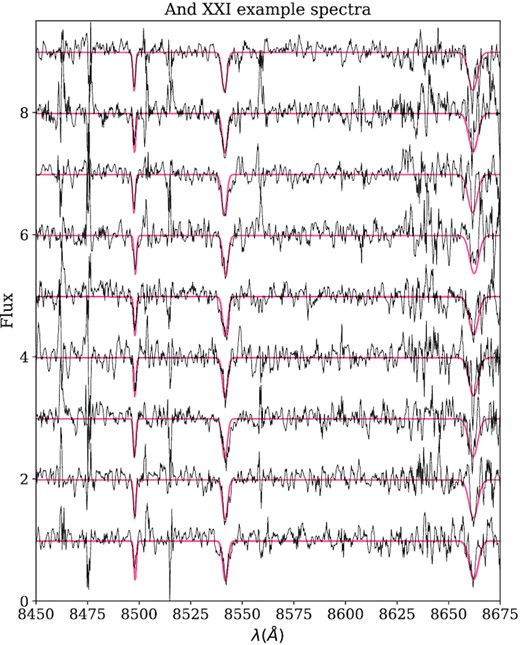
Continuum normalized spectra for a sample of And XXI member stars (|$P_{\rm member}\gt 0.1)$| with |${\rm S/N}\gt 5$| per pixel. The red line represents the fit to the three Ca ii lines.
![The metallicity distribution function for And XXI member stars with ${\rm S/N}\gt 5$ per pixel (left-hand panel), and a corner plot showing the mean and spread of the metallicity for this system (right-hand panel). We find a mean [Fe/H] $=-1.7\pm 0.1$ dex, and are unable to constrain the metallicity spread in the system. It is likely less than $\sigma _{\rm [Fe/H]}\lt 0.5$ dex at 99 per cent confidence.](https://oup.silverchair-cdn.com/oup/backfile/Content_public/Journal/mnras/505/4/10.1093_mnras_stab1624/1/m_stab1624fig8.jpeg?Expires=1750484502&Signature=Q30j45mjS4ln15IT91THtZpTOJ353H3KxiFzW6i8MZUqJQ7x-pnN2FglfDkEijQmEWGnVHONoIVIxnp1OqcGpr4f4wufz28dx14NoqcayfMCP33mEXu-KPO8YO~KRHm~ryxftzGWKFSXNg4ZF~UbJYU-2HY4Gkd4aadYLqUTeCZeCWBaqCFrd7K1H-PlCdIItq3hTB603uQrQh2d3QirZW5MElXZpbPjgBF3HDkOeBXq7mikgO8VGiYsbGArzrRy8isZdzfuK-3A2g668rtzKUdmXh0I~ttnkKH-A5i1HzUVbYGe8o9Wmlf2zh-7VAvGzO8bnOwTbCRm-utUhtFnOg__&Key-Pair-Id=APKAIE5G5CRDK6RD3PGA)
The metallicity distribution function for And XXI member stars with |${\rm S/N}\gt 5$| per pixel (left-hand panel), and a corner plot showing the mean and spread of the metallicity for this system (right-hand panel). We find a mean [Fe/H] |$=-1.7\pm 0.1$| dex, and are unable to constrain the metallicity spread in the system. It is likely less than |$\sigma _{\rm [Fe/H]}\lt 0.5$| dex at 99 per cent confidence.
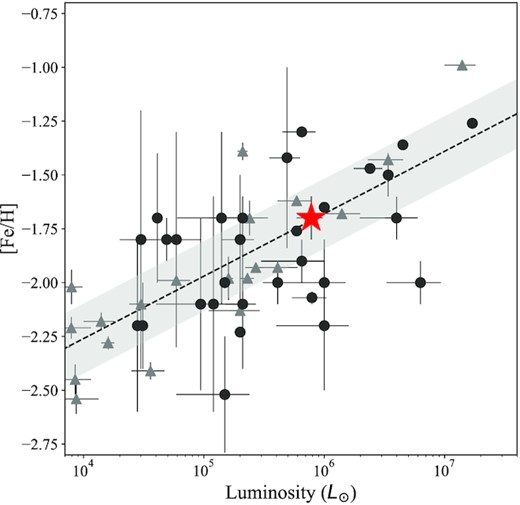
The luminosity–metallicity relation for Local Group dSphs. And XXI is shown as a red star. The dSphs of M31 are represented with dark grey circles, while those of the MW are light grey triangles. The black dashed line is the best-fitting relation for MW dSphs from Kirby et al. (2013), with the grey band showing the |$1\sigma$| scatter. And XXI is perfectly consistent with this relation.
4 THE MASS PROFILE OF AND XXI
Using this, we measure a central mass of |$M(R\lt 1.8\, r_ {\rm half})=3.0^{+0.9}_{-0.8} \times 10^7\, {\rm M}_\odot$|. This gives a central mass-to-light ratio of |$[M/L](R\lt 1.8\, r_ {\rm half})=78^{+30}_{-28}\, {\rm M}_\odot /{\rm L}_\odot$|, significantly dark matter dominated. We measure a central dark matter density of |$\rho (R\lt 1.8\, r_ {\rm half})=4.1\pm 1.7\times 10^{-4}\, {\rm M}_\odot \, {\rm pc}^{-3}$|. In our previous work, we found that And XXI had a lower central mass and density than dwarf galaxies of a comparable size or brightness. With our updated measurements, we find this remains true. In Fig. 10, we show the mass and density within |$1.8\, r_{\rm half}$| for MW (blue triangles) and M31 (red circles) dSphs, compared to the best-fitting NFW mass(/density) profiles for this population from Collins et al. (2014) in grey (Walker et al. 2007, 2009; Simon & Geha 2007; Simon et al. 2011, 2015; Martin et al. 2007, 2013, 2014; Ho et al. 2012; Tollerud et al. 2012; Collins et al. 2013, 2020; Kirby, Simon & Cohen 2015; Kirby et al. 2017). In both panels, we see that And XXI is of significantly lower mass and density than the best-fitting profile would predict. Could it be lower density because it harbours a central core, as is supposed for some low-density MW dSphs (e.g. Fornax, Crater 2, and Antlia 2; Goerdt et al. 2006; Walker & Peñarrubia 2011; Amorisco & Evans 2012; Read et al. 2019; Caldwell et al. 2017; Torrealba et al. 2019)? And is this growing number of low-density dwarf galaxies a challenge for the cold dark matter paradigm? To test this, we use Jeans modelling to measure the density profile of And XXI, and compare to |$\Lambda {\rm CDM}$| expectations.
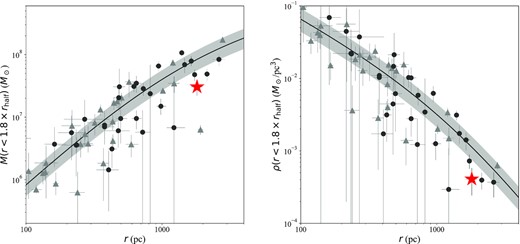
Left-hand panels: mass enclosed within |$1.8\times r_{\rm half}$| for the Local Group dSphs. The MW subsystem are shown with light grey triangles, while the M31 system are shown as dark grey circles. And XXI is highlighted as a red star. The black line shows the best-fitting NFW halo profile for the Local Group dSphs from Collins et al. (2014), with the grey band representing the |$1\sigma$| scatter, And XXI is significantly below this fit, indicating it has a lower mass than expected for its size. Right-hand panels: enclosed density for the Local Group dSphs, plus the best-fitting density profile, as in the left-hand panel. And XXI is lower density than typically expected.
4.1 Mass modelling with gravsphere
gravsphere has been extensively tested on mock data for spherical and triaxial systems (Read et al. 2017, 2021), for tidally disrupting mocks (Read et al. 2018) and for realistic mocks drawn from a cosmological simulation (Genina et al. 2019). In most cases, gravsphere is able to recover the dark matter density profile within its 95 per cent confidence intervals over the range |$0.5 \lt R/R_{1/2} \lt 2$|, where |$R_{1/2}$| is the half-light radius. However, the code has a tendency to underestimate the density at large radii |$R \gtrsim 2R_{1/2}$| (Read et al. 2017, 2021). Furthermore, for small numbers of stars, or where the measurement error on each star is large, the binning method within the code can become biased (Gregory et al. 2019; Zoutendijk et al. 2021).
To address the above concerns, for this paper, we have extensively updated and improved gravsphere. The primary change is a new data binning module, binulator, that we describe in Section 4.1.1. Smaller additional changes are (1) a switch to using the coreNFWtides profile as the default dark matter mass model, as in Read et al. (2018) and Read & Erkal (2019), rather than using the ‘non-parametric’ series of power laws centred on a set of radial bins, described in Read & Steger (2017); and (2) using tighter priors on |$\beta (r)$| by default. We describe all of our priors in Section 4.1.2 and present mock data tests of our new methodology in Section A.
The reasons for shifting away from the ‘non-parametric’ dark matter mass profile from Read & Steger (2017) is twofold. First, for |${\sim }1000+$| tracers, the results from using the coreNFWtides profile and the ‘non-parametric’ profile agree within their respective 68 per cent confidence intervals Alvarez et al. (2020), yet the coreNFWtides model fit parameters are more cosmologically useful (Read et al. 2018; Read & Erkal 2019). Secondly, in the absence of data, the default priors on the non-parametric mass profile favour a high density in the centre that falls very steeply outwards, inconsistent with expectations in most popular cosmological models. By contrast, the coreNFWtides model naturally defaults to cosmological expectations at large radii in the absence of data.
The reason for the tighter priors on |$\tilde{\beta }(r)$| is that, theoretically, we expect that dynamical systems in pseudo-equilibrium should be close to isotropic in the centre, with radial anisotropy, or weak tangential anisotropy, at large radii (e.g. Pontzen et al. 2015; Genina et al. 2019; Alvey et al. 2021). For this reason, we allow for only mild tangential anisotropy (|$\tilde{\beta }(r) \gt -0.1$|) and demand |$\tilde{\beta }(r) \rightarrow 0$| for |$r\rightarrow 0$|. This prior is also consistent with measurements of |$\tilde{\beta }(r)$| in MW satellites such as Draco and Sculptor (e.g. Massari et al. 2018, 2020).
4.1.1 The binulator
The main improvement we make to gravsphere is a complete reworking of its data binning routines into a separate code: the binulator. This improves the binning by fitting a generalized Gaussian probability distribution function (PDF) to each bin to estimate its mean, variance, and kurtosis. This has the advantages that (1) the distribution function can be readily convolved with the error PDF of each star, survey selection functions, binary star velocity PDFs, and similar; and (2) the method returns a robust estimate of the mean, variance, and kurtosis, and their uncertainties, even in the limit of a very small number of tracer stars.
![The generalized Gaussian velocity PDF (equation 25), convolved with a Gaussian error PDF of width $\sigma _{{\rm e}} = 2$ km s−1. The top panel shows example PDFs for $\alpha _v = 15$ km s−1, with varying $\beta _v$, as marked. The corresponding kurtosis, $\kappa$, for each model is marked in the legend. Notice that $\beta _v = 2$ corresponds to a Gaussian PDF. The solid lines show the exact convolved PDF; the dashed lines show the fast analytic approximation in equation (26). The bottom panel shows the percentage residuals between the exact and fast PDFs, defined as $({\rm PDFtrue} - {\rm PDFfast})/{\rm max[PDFtrue]} \times 100$. Notice that the error in this approximation is typically less than 5 per cent, and everywhere less than 10 per cent. The normalized Gaussian PDF allows us to measure the kurtosis in each bin, capturing distributions that are both more flat-topped and peakier than Gaussian. This is important for determining the virial shape parameters (Section 4.1.1), using these to break the $\rho -\beta$ degeneracy.](https://oup.silverchair-cdn.com/oup/backfile/Content_public/Journal/mnras/505/4/10.1093_mnras_stab1624/1/m_stab1624fig11.jpeg?Expires=1750484503&Signature=zTx6QAiVIoDkvNqKH2oC6hrxsxracKWPmPcbtk-4DkgwcyLTwX7I-Hnzsz5oBb93dZPQiFmEJeDmNqyNS7F4dsPp~SSM8D2xwYfuiCf4s6vydGbETzpLiLszujrToMd52hGQnLyve5xwvjRi3LFoIWs8Mf8NmjilnzLnLYFaTuR0-idI7A6oiNyPbhtKHXyMgmPmC7LwjIsBlU8Bm48jjfEItM28~1UO38B9WWvrz2Wtrwne0kXa4dQvSgR~ya~IfMuMXBj5BnoSwXCjCNNmLdfkebR0Zxs7TmSSHEGgo9iyh-R58QX-S~0JBKZktZD~8tkHBVzx6DgQjNP8eU-Vqw__&Key-Pair-Id=APKAIE5G5CRDK6RD3PGA)
The generalized Gaussian velocity PDF (equation 25), convolved with a Gaussian error PDF of width |$\sigma _{{\rm e}} = 2$| km s−1. The top panel shows example PDFs for |$\alpha _v = 15$| km s−1, with varying |$\beta _v$|, as marked. The corresponding kurtosis, |$\kappa$|, for each model is marked in the legend. Notice that |$\beta _v = 2$| corresponds to a Gaussian PDF. The solid lines show the exact convolved PDF; the dashed lines show the fast analytic approximation in equation (26). The bottom panel shows the percentage residuals between the exact and fast PDFs, defined as |$({\rm PDFtrue} - {\rm PDFfast})/{\rm max[PDFtrue]} \times 100$|. Notice that the error in this approximation is typically less than 5 per cent, and everywhere less than 10 per cent. The normalized Gaussian PDF allows us to measure the kurtosis in each bin, capturing distributions that are both more flat-topped and peakier than Gaussian. This is important for determining the virial shape parameters (Section 4.1.1), using these to break the |$\rho -\beta$| degeneracy.
We assume flat priors on the parameters: |$-0.1 \lt \mu _v / {\rm km\,s}^{-1} \lt 0.1$|, |$1 \lt \alpha _v/ {\rm km\,s}^{-1} \lt 25$|, and |$1 \lt \beta _v \lt 5$|. This allows for a kurtosis in the range |$2 \lt \kappa \lt 6$|.
Since we now fit a velocity PDF to each bin, the binulator will work equally well with very low numbers of tracers stars and/or when the velocity errors are large, resolving the issues with earlier versions of gravsphere, outlined above. We present tests of this updated binulator+gravsphere code on mock data in Appendix A.
4.1.2 Priors
We use priors on the coreNFWtides model parameters of: |$7.5 \lt \log _{10}(M_{200}/{\rm M}_\odot) \lt 11.5$|, |$7 \lt c_{200} \lt 53$|, |$-2 \lt \log _{10}(r_{\rm c}/{\rm kpc}) \lt 1$|, |$1 \lt \log _{10}(r_{\rm t}/{\rm kpc}) \lt 20$|, |$3 \lt \delta \lt 5$|, and |$-1 \lt n \lt 1$| (where |$n=-1$| is steeper than an NFW cusp, and |$n=1$| corresponds to a core). We use priors on the symmetrized velocity anisotropy of |$\tilde{\beta }(0) = 0$|, |$-0.1 \lt \tilde{\beta }_{\infty } \lt 1$|, |$-2 \lt \log _{10}(r_0/{\rm kpc}) \lt 0$|, and |$1 \lt q \lt 3$|. Finally, we use a flat prior on the stellar mass of |$5.7 \lt M_*/(10^5\,{\rm M}_\odot) \lt 9.5$| (McConnachie 2012). Our results are not sensitive to these choices.
4.1.3 gravsphere modelling of And XXI
For our sample, |$N_{\rm eff}=50$|. We bin the data radially from the centre of And XXI in two bins, using an effective 25 stars per bin. We show the |$\Sigma _*(R)$| and |$\sigma _{\rm LOS}(R)$| profiles in Fig. 12. The vertical blue line represents the half-light radius determined from the PAndAS imaging. We model And XXI under the assumption that it is a spherical, non-rotating system, and we use the stellar mass from McConnachie (2012) of |$M_*=7.6\times 10^5\, {\rm M}_\odot$|, assuming an error of 25 per cent.
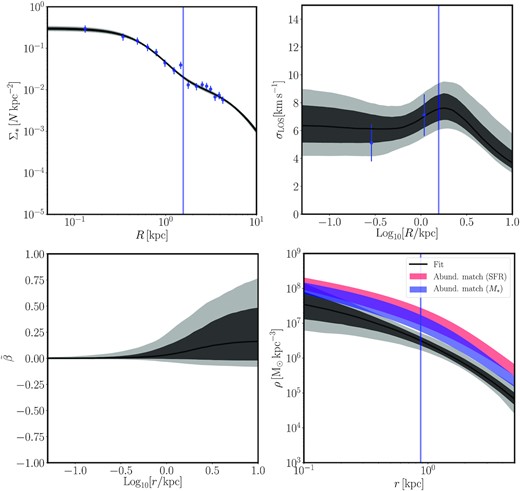
Top left-hand panel: surface brightness profile for And XXI. The blue points show photometric data from deep Subaru imaging. The best fit from gravsphere is shown as a solid black line, with the grey shaded regions showing the 68 and 95 per cent confidence intervals. Top right-hand panel: the velocity dispersion profile for And XXI. Each bin contains an effective |${\sim }25$| stars weighted by membership probability. Again, the best-fitting and confidence intervals from gravsphere are shown in black/grey. Bottom left-hand panel: the symmetrized radial anisotropy profile for And XXI. Bottom right-hand panel: the final dark matter density profile inferred by gravsphere. Notice that it is consistent with both a cusp and core within gravsphere’s 95 per cent confidence intervals (light grey). However, it is less dense at all radii than expected from abundance matching in |$\Lambda$|CDM, whether abundace matching with the stellar mass (blue) or the mean star formation rate (red). In all panels, the blue vertical line shows the half-light radius for And XXI determined from PAndAS photometry (Martin et al. 2016).
Using the above, we model the density profile of And XXI and show the result in the lower left-hand panel of Fig. 12. We measure a central dark matter density within 150 pc of |$\rho _{\rm DM}({\rm 150 pc})=2.6^{+2.4}_{-1.5} \times 10^7 \, {\rm M_\odot \, kpc^{-3}}$| at 68 per cent confidence. The data are consistent with a cusp or core within |$2\sigma$| (light grey shading). Overlaid on the figure are two density profiles determined from abundance matching in |$\Lambda$|CDM, using the stellar mass (blue) and the mean star formation rate (red), as in Read & Erkal (2019) (a more detailed description of how these are derived is presented in Section 5.1). For the latter, we use the star formation history for And XXI from Weisz et al. (2019b). Notice that in both cases, our determination of the dark matter density profile for And XXI is lower at all radii than expectations from abundance matching in |$\Lambda$|CDM by a factor of |${\sim }3\!-\!5$|.
In the following section, we discuss this low-density profile in the broader |$\Lambda$|CDM context, and investigate whether dark matter heating from star formation or tidal processes could explain this result.
5 DISCUSSION
5.1 A low-density halo from star formation
Star formation can lower the central density of a dark matter halo, gradually turning a dark cusp into a core within |${\sim }$| the half-light radius of the stars, |$R_{1/2}$| (Navarro et al. 1996b; Read & Gilmore 2005; Pontzen & Governato 2012; Read et al. 2016, 2019). The star formation history of And XXI has been measured from shallow HST data (reaching |${\sim}1$| mag below the red clump) by Weisz et al. (2019b). It formed |${\sim}50{{\ \rm per\ cent}}$| of its stars prior to 8.3 Gyr ago, and |$90{{\ \rm per\ cent}}$| prior to 5.8 Gyr ago. There is no sign of any star formation in the last |$2\!-\!3$| Gyr. Could this extended star formation be enough to lower the central density of And XXI?
To answer this question, we first need to estimate a pre-infall halo mass, |$M_{200}$|, for And XXI. For this, we use the abundance matching machinery from Read & Erkal (2019). Classic abundance matching estimates |$M_{200}$| statistically from the stellar mass, |$M_*$|. For And XXI, using the abundance matching relation from Read et al. (2017) (consistent with Behroozi, Wechsler & Conroy 2013), this yields |$M_{200} = 1.1 \pm 0.5 \times 10^9\, {\rm M}_\odot$|. However, for satellite galaxies like And XXI that quench on infall to a larger host, |$M_*$| becomes a poor proxy for the pre-infall |$M_{200}$| (e.g. Ural et al. 2015; Tomozeiu, Mayer & Quinn 2016; Read & Erkal 2019). Read & Erkal (2019) argue that using instead the mean star formation rate, |$\langle {\rm SFR} \rangle$|, evaluated over the period during which the satellite was forming stars, solves this ‘quenching problem’. They show empirically for MW satellites that |$\langle {\rm SFR} \rangle$| correlates much better with |$M_{200}$| than does |$M_*$|. If we abundance match And XXI using instead its |$\langle {\rm SFR} \rangle = 2.1 \pm 0.5 \times 10^{-4} {\rm M}_\odot\,{\rm yr}^{-1}$| (calculated from And XXI’s star formation history as in Read & Erkal 2019), we obtain a higher |$M_{200} = 2.7 \pm 1.1 \times 10^9\, {\rm M}_\odot$|.
Next, we must calculate whether or not there has been sufficient star formation within And XXI to cause its central density to be lowered significantly. For this, we use the coreNFW profile calibrated on the simulations from Read et al. 2016. Read et al. (2016) determine the amount of core formation based on the total ‘star formation time’, defined as in Read & Erkal (2019) as |$t_{\rm SF} = M_* / \langle {\rm SFR} \rangle$|. For And XXI, this gives |$t_{\rm SF} = 3.5$| Gyr. The amount of coring is then given by |$n = {\rm tanh}(0.04 t_{\rm SF} / t_{\rm dyn})$|, where |$t_{\rm dyn}$| is the dynamical time at the scale radius, |$r_s$| (equation 16; and see Read et al. 2016). (Recall that |$n = 0$| corresponds to complete core formation, while |$n=1$| corresponds to a |$r^{-1}$| density cusp.)
Assuming the Dutton & Macciò (2014) |$M_{200}\!-\!c_{200}$| relation for |$\Lambda$|CDM, and its scatter, we use the above coreNFW profile to estimate the range of theoretical expectations for And XXI’s density profile in |$\Lambda$|CDM. This is shown in Fig. 12, bottom right-hand panel. The blue band shows the expected range assuming |$M_{200}$| derived from abundance matching with |$M_*$|; the red band shows the same using abundance matching with |$\langle {\rm SFR} \rangle$|. In both cases, the width of the band incorporates uncertainties in |$M_{200}$| and the expected |$2\sigma$| scatter in |$c_{200}$|. Notice that in all models, the central density has been slightly lowered by star formation, but not enough to produce a flat core (we find that our models span the range |$n = 0.2\!-\!0.5$|). Further lowering of the inner density could be caused by late minor mergers, a new mechanism for dark matter heating reported recently in Orkney et al. (2021). However, this still cannot explain the low density we find for |$R \gt R_{1/2}$|.
The end result of this exercise is that And XXI’s density is lower than expected for isolated haloes in |$\Lambda$|CDM by a factor of |${\sim }3\!-\!5$|. This is true at better than 95 per cent confidence at the half-light radius (|$R_{1/2} = 0.875$| kpc) where the density is best constrained. And, it remains true when marginalizing over the expected |$2\sigma$| scatter in |$c_{200}$| in |$\Lambda$|CDM, and when accounting for dark matter heating lowering the central dark matter density. We conclude, therefore, that And XXI’s density at all radii is lower than expected for isolated haloes in |$\Lambda$|CDM. We discuss next whether this can be explained by tides.
5.2 A low-density halo from tidal processes?
In the discussion above, we have assumed that And XXI is unaffected by tides. Tidal stripping, and even more so tidal shocking, will act to lower And XXI’s density over time (e.g. Gnedin et al. 1999; Read et al. 2006a,b; Amorisco 2019). If we assume that significant tidal stripping (losing 90–99 per cent of its original mass) has taken place, we can use the relations for tidal evolution from Peñarrubia et al. (2010b) to assess the impact on And XXI’s density. These tidal tracks can be implemented for either cuspy or cored dark matter haloes, and the effects for these are very different. If And XXI possess an NFW cusp (|$\gamma =1$|), then tides have almost no effect on its central density. Even assuming just 5 per cent of the original halo mass remains, the cusp survives and keeps the central density high. If instead we assume a small amount of cusp weakening due to baryonic processes (cf. discussion above), then for |$\gamma = 0.5$|, and removal of 95 per cent of the original halo, we can find central density values that are consistent with our measurements for And XXI within their 68 per cent confidence intervals.
However, tidal shocking can be much more efficient than tidal stripping. The effect is maximized if And XXI is on a plunging orbit and starts out with low density, either due to some inner cusp-core transformation, or due to it inhabiting a low-concentration halo (see discussion in Section 1 and Amorisco 2019).
The above results imply that we can explain And XXI’s low density through a combination of dark matter heating and tidal processes, with the dominant effect coming from tides. But, how likely is it that And XXI is on an orbit that has allowed it to experience extreme tidal stripping or shocking? Both tidal scenarios require a highly radial orbit, with a small pericentre (<20 kpc; Read et al. 2006a). And XXI is currently far from its host, at a 3D distance of |$D_{\rm M31}=145^{+11}_{-6}\, {\rm kpc}$| (Weisz et al. 2019a). Without proper motions, it is difficult for us to place meaningful constraints on the current orbit of And XXI to determine whether it has recently passed close to M31. Even with proper motions, its current orbit is not necessarily a robust indicator of its past close interactions (e.g. Lux, Read & Lake 2010; Genina et al. 2020).
The current light profile for And XXI shows no obvious signs of tidal stripping in the outskirts, but this does not necessarily imply that tidal stripping of the stellar component has not taken place (e.g. Read et al. 2006a; Peñarrubia et al. 2009; Ural et al. 2015; Genina et al. 2020). Furthermore, significant tidal shocking can lower the density of And XXI if it is on a sufficiently plunging orbit, without any tidal stripping of stars taking place (Read et al. 2006a; Amorisco 2019). The unusual dynamics of And XXI reported in Section 3.2 could imply that the system is not in dynamical equilibrium, but this |$2\sigma$| finding is not adequate to provide unambiguous evidence of tidal stripping. With future data and modelling, better constraints can be placed on the orbit of And XXI and on its faint stellar outskirts. This will help us understand whether tidal effects have acted to lower the central density of this dwarf galaxy, or whether its low-density points to physics beyond |$\Lambda$|CDM.
5.3 Comparison to predictions from modified Newtonian dynamics
Finally, we consider other theories that may also explain And XXI’s low central density and other properties. In McGaugh & Milgrom (2013) , they calculate the velocity dispersions for Andromeda dSphs in the modified Newtonian dynamics (MOND) framework. As dwarf galaxies would be free from dark matter in this framework, one may expect to see a lower central mass or density than predicted by |$\Lambda$|CDM. Indeed, MOND has been shown to nicely reproduce the low-density cores seen in isolated low surface brightness galaxies (e.g. Sanders & McGaugh 2002; Famaey & McGaugh 2012). In general, the MOND predictions of McGaugh & Milgrom (2013) for M31 dsPhs show a good consistency with the measured velocity dispersions presented in both Tollerud et al. (2012) and Collins et al. (2013) (though note that some of the MW dwarfs are more problematic for MOND; e.g. Angus et al. 2014; Read et al. 2019). Here, we compare our updated dispersion for And XXI with these prior predictions.
McGaugh & Milgrom (2013) give two estimates for the velocity dispersion of M31 dwarfs. The first is the isolated case, and the second is for dwarf galaxies embedded in an external field (the external-field effect, EFE). For satellite galaxies, it is not clear that the isolated approximation is valid, and for And XXI in particular, they recommend using the EFE calculations. They predict a velocity dispersion of |$\sigma _{\rm EFE}=3.7^{+1.5}_{-1.1}{\rm \, km\, s^{-1}}$|, where the presented value uses an assumption of the stellar mass to light ratio of |$[M/L_*]=2\, {\rm M_\odot /L_\odot }$|, and the uncertainties use |$[M/L_*]=1~{\rm and}~4\, {\rm M_\odot /L_\odot }$|. The uncertainty on the predicted dispersion reflects this range of M/L they considered to be plausible. This value is lower than our measured value of |$\sigma _v=6.1^{+1.0}_{-0.9}{\rm \, km\, s^{-1}}$|, but it is within |$1\sigma$|. As such, the MOND prediction still agrees with our new data.
6 CONCLUSIONS
We have presented results from our chemodynamical study of the low-mass M31 satellite, And XXI. We have identified 77 probable stellar members in this galaxy, and our key findings are as follows:
We measure a systemic velocity for And XXI of |$v_r=-363.4\pm 1.0{\rm \, km\, s^{-1}}$| and a velocity dispersion of |$\sigma _v=6.1^{+1.0}_{-0.9}{\rm \, km\, s^{-1}}$|, consistent with the findings of Collins et al. (2013) from a much smaller sample.
We find that the stars in the outskirts of And XXI have a far lower velocity dispersion than those within the half-light radius. We also see that the systemic velocity and velocity dispersion vary with radius, which could indicate that it is not in dynamical equilibrium.
From those stars with high enough |${\rm S/N}$|, we additionally measure the metallicity distribution function of And XXI. We measure a mean metallicity of |${\rm [Fe/H]}=-1.7\pm 0.1$| dex. This is perfectly consistent with the stellar mass–metallicity relation for low-mass galaxies (Kirby et al. 2013). We are unable to measure the metallicity spread in And XXI, but find it to be lower than 0.5 dex at 99 per cent confidence.
We model the dark matter density profile of And XXI using an updated version of gravsphere, with the main improvement being a complete reworking of its data binning routines into a separate code: the binulator (Section 4.1.1). This fits a generalized Gaussian PDF to each bin to estimate its mean, variance and kurtosis, and their uncertainties. This has the advantages that (1) the distribution function can be readily convolved with the error PDF of each star, survey selection functions, binary star velocity PDFs, and similar; and (2) the method returns a robust estimate of the mean, variance, and kurtosis even in the limit of a very small number of tracer stars. We tested this new method on mock data in Appendix A, showing that it provides an unbiased estimate of the underlying density profile even for |${\sim }100$| tracer stars.
Using binulator+gravsphere, we find a central dark matter density for And XXI of |$\rho _{\rm DM}({\rm 150 pc})=2.6_{-1.5}^{+2.4} \times 10^7 \, {\rm M_\odot \, kpc^{-3}}$| at 68 per cent confidence, and a density at two half-light radii of |$\rho _{\rm DM}({\rm 1.75 kpc})=0.9_{-0.2}^{+0.3} \times 10^6 \, {\rm M_\odot \, kpc^{-3}}$| at 68 per cent confidence. We cannot distinguish between a cusped or cored profile, however the density at all radii is a factor of |${\sim }3\!-\!5$| lower than the densities expected from abundance matching in |$\Lambda$|CDM. We show that this cannot be explained by ‘dark matter heating’ since And XXI had too little star formation to significantly lower its inner dark matter density, while dark matter heating only acts on the profile inside the half-light radius. However, And XXI’s low density can be accommodated within |$\Lambda$|CDM if it experienced extreme tidal stripping (losing |${\gt}95{{\ \rm per\ cent}}$| of its mass), or if it inhabits a low-concentration halo on a plunging orbit that experienced repeated tidal shocks. Future work establishing the orbit of And XXI would help us understand the origin of its low inner density and thereby improve our understanding of the nature of dark matter.
When comparing our measured velocity dispersion for And XXI with expectations from MOND, we find it to be consistent with predictions by McGaugh & Milgrom (2013) within |$1\sigma$|. Given this object sits within the low acceleration regime, it will certainly be of interest for future work.
SUPPORTING INFORMATION
And21_supplementry.txt
Please note: Oxford University Press is not responsible for the content or functionality of any supporting materials supplied by the authors. Any queries (other than missing material) should be directed to the corresponding author for the article.
ACKNOWLEDGEMENTS
We thank the referee for their helpful comments, which have improved the quality of this paper.
RI and NM acknowledge funding from the European Research Council (ERC) under the European Union's Horizon 2020 research and innovation programme (grant agreement No. 834148).
The data presented herein were obtained at the W. M. Keck Observatory, which is operated as a scientific partnership among the California Institute of Technology, the University of California, and the National Aeronautics and Space Administration. The Observatory was made possible by the generous financial support of the W. M. Keck Foundation. This paper is based in part on data collected at Subaru Telescope, which is operated by the National Astronomical Observatory of Japan.
The authors wish to recognize and acknowledge the very significant cultural role and reverence that the summit of Maunakea has always had within the indigenous Hawaiian community. We are most fortunate to have the opportunity to conduct observations from this mountain.
DATA AVAILABILITY
All raw DEIMOS spectra are available via the Keck archive. An electronic table with reduced properties (coordinates, magnitudes, |${\rm S/N}$|, velocities, and metallicities) for all stars will be provided on the journal website. Fully reduced 1D spectra will be made available on reasonable request to the lead author as these are not hosted on the Keck archive. The data used in the gravsphere modelling are available (with the code) at https://github.com/justinread/gravsphere.
Footnotes
A version of the gravsphere code with the free form mass model, amongst others (Genina et al. 2019), is available to download from https://github.com/AnnaGenina/pygravsphere. The updated gravsphere code described in this paper, along with the new binulator binning method (Section 4.1.1), is available to download from https://github.com/justinread/gravsphere.
REFERENCES
APPENDIX A: TESTING binulator+gravsphere ON MOCK DATA
In Section 4.1, we introduced an updated version of the gravsphere code (Read & Steger 2017; Read et al. 2018) with a new reworked binning method, the binulator. In this Appendix, we present tests of the new code on mock data drawn from the Gaia Challenge2 spherical and triaxial suite (Read et al. 2021). We focus on two mocks that were particularly challenging for the previous version of gravsphere: PlumCuspOm and PlumCoreOm. The former is a Plummer sphere embedded in a spherical, cuspy dark matter halo; the latter is the same embedded in a dark matter halo with a central constant density core. In both cases, the velocity dispersion profile is isotropic at the centre and maximally radially anisotropic at large radii. Both mocks are described in detail in Read et al. (2021). Here, we model both assuming Gaussian velocity errors on each star of 2 km s−1 for 100, 1000, and 10 000 randomly sampled kinematic tracers. We assume that the photometric light profile is in all cases well sampled with 10 000 stars, similarly to the situation with real data for nearby dsPh galaxies (e.g. Read et al. 2019).
Previously, gravsphere struggled on these mocks. For both PlumCoreOm and PlumCuspOm with 1000 tracers, it returned a dark matter density that was systematically low for |$R \gt R_{1/2}$|, shifting, however, to |$R \gt 4 R_{1/2}$| for 10 000 tracers. The velocity anisotropy was well recovered in all cases, except PlumCoreOm for which 1000 tracers were insufficient to detect the radial anisotropy at large radii (Read et al. 2021). In Gregory et al. (2019), gravsphere was tested on mock data for fewer tracers (20, 100, and 500 tracer stars). There, a similar bias towards low densities at large radii was reported.
We show results applying the updated gravsphere with its new binulator binning module to the PlumCoreOm and PlumCuspOm mocks in Fig. A1. In all cases, we obtain an unbiased recovery of both the dark matter density profile, |$\rho _{\rm DM}(r)$|, and the symmetrized stellar velocity anisotropy, |$\tilde{\beta }(r)$|. The code is no longer biased to low density at large radii. This owes to a combination of the improved data binning, the proper inclusion of the full error PDF for the virial shape parameters, and to our switch to using the coreNFW profile (recall that the non-parametric power-law-in-bins profile used previously by default in gravsphere biases models towards falling very steeply at large radii in the absence of data). Notice that now, even with just 100 tracers, we are able to detect that the PlumCuspOm is denser and falls more steeply than PlumCoreOm. For PlumCuspOm, we are also able to weakly detect that the velocity distribution is radially anisotropic at large radii. As we move to 1000 and 10 000 tracers, we obtain an increasingly high-fidelity recovery of both the density profile and the velocity anisotropy.
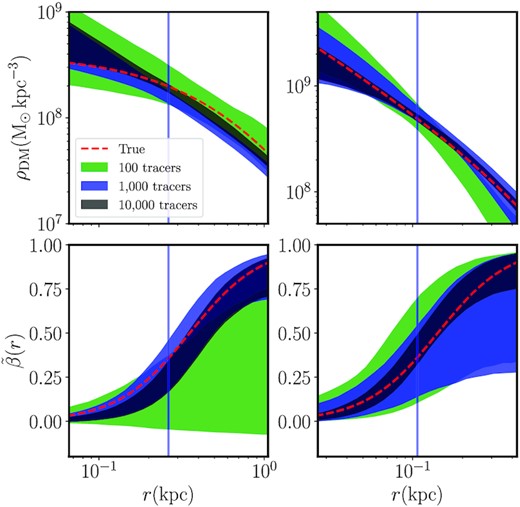
Testing the updated gravsphere code and its new binulator module on spherical mock data from the Gaia Challenge suite. The left-hand panels show results for the PlumCoreOm mock; the right-hand panels show results for the PlumCuspOm mock. The top panels show the recovery of the density profile for 100 tracers (green), 1000 tracers (blue), and 10 000 tracers (black), where the width of the bands mark the 95 per cent confidence intervals in each case. The red dashed lines show the true solutions. The bottom panels show the same for the recovery of the symmetrized velocity anisotropy profile. Notice that, even with 100 tracers, we obtain an unbiased recovery of the radial density profile. For the PlumCuspOm mock, we are also able to weakly detect the radial anisotropy at large radii. As the sampling increases, the confidence intervals narrow around the correct solution.
