


ABSTRACT
The candidate PeVatron MGRO J1908+06, which shows a hard spectrum beyond 100 TeV, is one of the most peculiar γ-ray sources in the Galactic plane. Its complex morphology and some possible counterparts spatially related with the very high energy (VHE) emission region, preclude to distinguish between a hadronic and leptonic nature of the γ-ray emission. In this paper, we illustrate a new multiwavelength analysis of MGRO J1908+06, with the aim to shed light on its nature and the origin of its ultra-high-energy emission. We performed an analysis of the 12CO and 13CO molecular line emission demonstrating the presence of dense molecular clouds spatially correlated with the source region. We also analysed 12 yr of Fermi-Large Area Telescope (LAT) data between 10 GeV and 1 TeV finding a counterpart with a hard spectrum (Γ ∼ 1.6). Our reanalysis of XMM–Newton data allowed us to put a more stringent constraint on the X-ray flux from this source. We demonstrate that a single accelerator cannot explain the whole set of multiwavelength data, regardless of whether it accelerates protons or electrons, but a two-zone model is needed to explain the emission from MGRO J1908+06. The VHE emission seems most likely the superposition of a TeV pulsar wind nebula powered by PSR J1907+0602, in the southern region, and of the interaction between the supernova remnant G40.5−0.5 and the molecular clouds, in the northern region.
1 INTRODUCTION
Cosmic rays (CRs) are high-energy atomic nuclei (90 per cent protons) moving through space at nearly the speed of light. The local CR proton spectrum is well described by a power law up to the so-called ‘knee’ around 1 PeV (=1015 eV), indicating the existence of powerful proton accelerators (‘PeVatrons’) residing in our Galaxy. However, despite decades of efforts, no specific Galactic source has been securely identified as a proton PeVatron, with the possible exception of the Galactic Centre (H. E. S. S. Collaboration et al. 2016, 2018; MAGIC Collaboration et al. 2020). The association of a γ-ray source with a PeVatron can be indicated by the absence of an exponential cut-off in the γ-ray spectrum below 100 TeV, as expected when CRs are accelerated up to PeV energies and produce γ-rays interacting with the ambient material.
The source MGRO J1908+06 is one of the best Galactic PeVatron candidates, thanks to its hard spectrum reaching energies above 100 TeV as observed by the High Altitude Water Cherenkov (HAWC; Abeysekara et al. 2020), and with no evidence of a cut-off. It was discovered by the MILAGRO collaboration (Abdo et al. 2007) and later confirmed with the High Energy Stereoscopic System (H.E.S.S.) atmospheric Cherenkov telescope (Aharonian et al. 2009). These authors reported the source detection above 300 GeV, with a large angular size (σ = |$0{_{.}^{\circ}}34$|) and a hard spectrum with a photon index of 2.1. MGRO J1908+06 was observed at very high energy (VHE) also with the Very Energetic Radiation Imaging Telescope Array System (VERITAS; Aliu et al. 2014), which revealed an extended morphology (σ = |$0{_{.}^{\circ}}44$|) with three peaks of emission and a spectrum with photon index of 2.2. Observations of this sky region with HAWC revealed emission up to 100 TeV spatially consistent with the VERITAS error box of MGRO J1908+06, indicating the presence of very energetic particles (Abeysekara et al. 2020). Because of its complex spatial structure, difficult to study with the limited angular resolution of current instruments, the origin of the γ-ray emission from MGRO J1908+06 is still uncertain. As discussed below, a few counterparts [the supernova remnant (SNR) G40.5−0.5, dense molecular clouds illuminated by CRs from the nearby SNR, and the pulsar PSR J1907+0602] are compatible with the γ-ray source error box (∼|$0{_{.}^{\circ}}5$|), preventing a secure identification of this extreme accelerator and making it difficult to distinguish between hadronic and leptonic interpretations of its emission. This source has been studied also at radio wavelength by Duvidovich, Petriella & Giacani (2020). These authors reported the presence of molecular material toward the SNR.
In this work, we investigate the molecular cloud environment of MGRO J1908+06 using data from molecular line radio surveys, modelling its multiwavelength spectral energy distribution (SED) using published TeV spectra, and our re-analysis of Fermi-Large Area Telescope (LAT) and XMM–Newton data.
2 POSSIBLE COUNTERPARTS OF MGRO J1908+06
Several possible counterparts are present in the region of MGRO J1908+06: in Fig. 1, we show the continuum emission at 1.4 GHz obtained in the VLA Galactic Plane Survey (VGPS; Stil et al. 2006) with superimposed the TeV contours obtained by VERITAS (Aliu et al. 2014). The radio data show the shell-like SNR G40.05−0.5, which is much brighter in the northern region. The positions of the two pulsars PSR J1907+0602 and PSR J1907+0631 are also indicated.
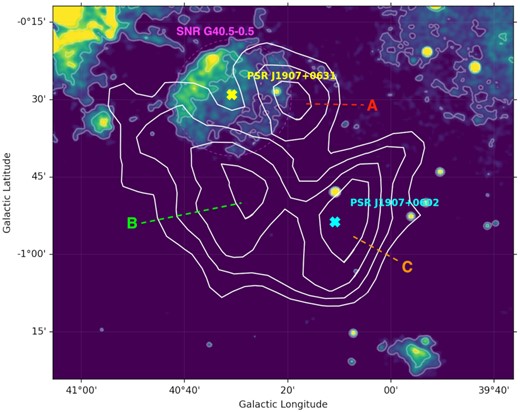
VLA Galactic Plane Survey (VGPS) at 1.4 GHz (Stil et al. 2006) map covering the entire source MGRO J1908+06. The white solid lines are the VHE contours taken from VERITAS (Aliu et al. 2014), where the significance level ranges from 3 to 5.2. The yellow and cyan crosses indicate the positions of PSR J1907+0631 and PSR J1907+0602, respectively. The thin dashed magenta line indicates the SNR G40.5−0.5 shell, while the red, green, and orange dashed lines mark the VERITAS emission lobes to which we refer in the following.
G40.05−0.5 is a middle aged SNR, with estimated age between 20 and 40 kyr (Downes, Pauls & Salter 1980) and uncertain distance. The Σ–D relation gives a distance between 5.5 and 8.5 kpc (Downes et al. 1980). A more accurate estimate can be obtained from the H i absorption spectrum (see Ranasinghe & Leahy 2017 for details), but, as reported by Duvidovich et al. (2020), for SNR G40.5−0.5 this method resulted in a very noisy spectrum, probably due to the fact that the neutral gas is patchy. The relatively young and energetic pulsar PSR J1907+0631 (characteristic age τ = 11 kyr, spin-down luminosity ∼5 × 1035 erg s−1) lies close to the centre of the SNR (Lyne et al. 2017). Its dispersion measure (DM) implies a distance of 7.9 kpc (Cordes & Lazio 2002), compatible with the range estimated for G40.05−0.5 and suggesting an association between these two objects. Duvidovich et al. (2020) showed that, in principle, PSR J1907+0631 could power the whole TeV source, since this would require a conversion efficiency from rotational energy to γ-rays of about 3 per cent, in line with the efficiency |${\le} 10{{\ \rm per\ cent}}$| of other known TeV sources associated with pulsar wind nebulae (PWNe; Gallant 2007). However, this hypothesis is disfavoured by the pulsar position slightly outside the TeV contours and significantly offset from the centroid of the γ-ray emission.
The γ-ray loud pulsar PSR J1907+0602, discovered with Fermi-LAT (Abdo et al. 2010), is located in the southern part of MGRO J1908+06, slightly offset from the peak of the γ-ray excess counts. This pulsar has a characteristic age of 19.5 kyr and a spin-down luminosity of ∼3 × 1036 erg s−1. The source distance was estimated to be 3.2 kpc (Abdo et al. 2010), as derived from the DM of ∼82 pc cm−3 with the electron distribution model of Cordes & Lazio (2002).
Another pulsar (PSR J1905+0600, not marked in Fig. 1) lies in this region, but its distance of ∼18 kpc and large characteristic age of 6 Myr (Hobbs et al. 2004) exclude it as a possible counterpart.
In conclusion, the two main candidates for the γ-ray emission from MGRO J1908+06 are the SNR G40.5−0.5, near the northern border of the TeV source, and PSR J1907+0602, lying in the southern region.
3 DATA ANALYSIS AND RESULTS
3.1 CO analysis
We have investigated the distribution of the CO gas in the environment of MGRO J1908+06 in order to identify molecular material in spatial correlation with the SNR and the γ-ray emission. Any such association would be relevant for hadronic models to explain the TeV emission and it would also provide some information on the source distance. We used the molecular line emission extracted from the FOREST Unbiased Galactic plane Imaging survey with the Nobeyama 45-m telescope (FUGIN) (Umemoto et al.2017).1 This project aims at investigating the distribution, kinematics, and physical properties of both diffuse gas and dense molecular clouds in the Galaxy by observing simultaneously the 12CO, 13CO, and 18CO J = 1−0 lines. This survey achieves the highest angular resolution to date (∼20 arcsec) for the Galactic plane, making it possible to find dense clumps located at farther distances than those seen in previous surveys.
We recovered the spectra in brightness temperature TB as a function of the local standard of rest velocity (VLSR) for the whole region corresponding to the 3σ contours of the TeV emission, both in 12CO and 13CO. As shown in Fig. 2, the bulk of the emission is concentrated between 50 and 80 km s−1.
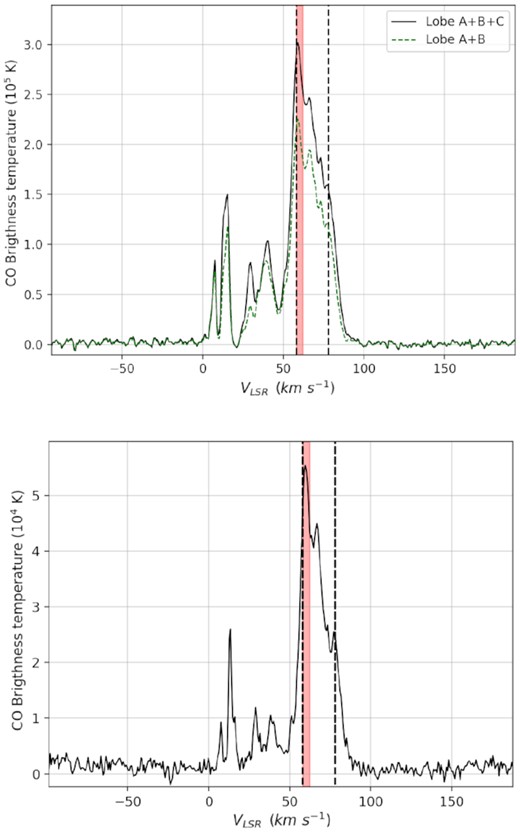
The 12CO (top) and 13CO (bottom) summed spectra in the region of MGRO J1908+06. The velocity interval between the two dashed lines (58–78 km s−1) represents the bulk of the emission, while the red zone marks the velocity range between 58 and 62 km s−1 (shown in Fig. 3) that is the velocity range considered for the molecular cloud analysis (Section 3.1).
We plot in Fig. 3 the 12CO and 13CO molecular line emission integrated from 58 to 62 km s−1. The contours presented in the figure are those of the VERITAS TeV emission (Aliu et al. 2014) and of the SNR G40.5−0.5 at 1.4 GHz from the VGPS. We denote the three maxima of γ-ray emission as lobes A, B, and C (see Fig. 1). The maps of Fig. 3 show that lobe A overlaps with CO emission, lobe B partially overlaps with CO emissions, while no obvious molecular clouds association is seen for lobe C.
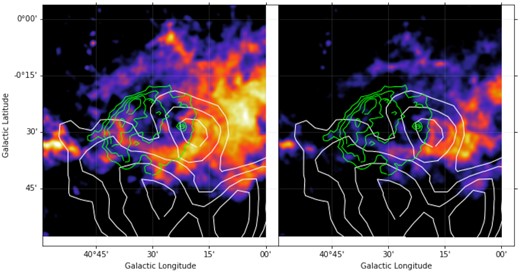
Maps of 12CO (left) and 13CO (right) emission in the MGRO J1908+06 region integrated between 58 and 62 km s−1. The white solid lines are the same as in Fig. 1, while the green contours are the continuum emission from SNR G40.5−0.5 at 1.4 GHz.
We concentrate on the molecular cloud in the 58–62 km s−1 velocity interval, as it overlaps both the A and B lobes and the southern border of the SNR. We obtain the distance of the cloud using the Galaxy rotation curve from Clemens (1985), with R⊙ = 8.5 kpc and v⊙ = 220 km s−1. The first Galactic quadrant presents distance ambiguity for positive radial velocities, so adopting 60 km s−1, we obtain near and far distances of 3.0 and 9.4 kpc, respectively.
To study the properties of the molecular gas, and in particular to estimate their density, we use the dendrogram technique (Rosolowsky et al. 2008). A dendrogram is a topological representation of the significant local maxima in N-dimensional intensity data and the way these local maxima are connected along contours (or isosurfaces) of constant intensity. A local maximum, by definition, has a small region around it containing no data greater than its value and, hence, a distinct isosurface containing only that local maximum can be drawn. The local maxima determines the top level of the dendrogram, which we refer to as the ‘leaves’, defined as the set of isosurfaces that contains a single local maximum. We identify and characterize molecular clouds in the CO data cube between 58 and 62 km s−1 using astrodendro2. This python algorithm efficiently constructs a dendrogram representation of all the emission in the selected region. The minimum value to consider (any value lower than this will not be considered in the dendrogram) is set as the ‘detection level’, namely 5σT, where σT is the median rms noise level in the data set, so that only significant values are included in the dendrogram (Tmin = 3 K). Another consideration is about how significant a leaf has to be in order to be considered an independent entity. The significance of a leaf is measured from the difference between its peak flux and the value at which it is being merged into the tree. This parameter is set to 1σT, which means that any leaf that is locally less than 1σT high is combined with its neighbouring leaf (or branch) and is no longer considered as a separate entity.
Once an index of structures in the data has been produced by the algorithm, it can be used to catalogue the properties of each structure, such as integrated intensity, centroid position, spatial position angle, spatial extent, and spectral linewidth.
3.2 Fermi-LAT data analysis
We analysed 12 yr of Fermi-LAT data, obtained from 2008 September 1 to 2020 December 16, exploiting the Pass 8 data processing (P8R3) with the public fermitools (v2.0.0) and fermipy packages (v1.0.0). We selected the Pass 8 ‘source’ class and ‘front+back’-type events coming from zenith angles smaller than 90° and from a circular region of interest (ROI) with radius of 10° centred at RA = |$286{_{.}^{\circ}}97$| and Dec. = |$6{_{.}^{\circ}}03$| (J2000). The instrument response function version P8R3-SOURCE-V3 was used. We selected only the events in the 10 GeV–1 TeV energy range, to avoid the contribution from PSR J1907+0602 (see fig. 4 of Abdo et al. 2010). We included in the background model all the sources from the fourth Fermi Large Area Telescope (4FGL) catalogue within the ROI, as well as the Galactic (gll-iem-v07.fits) and the isotropic (P8R3-SOURCE-V3-v1) diffuse components.
![Multiwavelength spectral energy distribution (SED) of MGRO J1908+06 fitted with the leptonic scenario [inverse Compton (IC)+synchrotron] with B = 1.2 $\mu$G. The black line shows the total IC emission, whose components are indicated by the thin solid, dashed, and dotted black line for the cosmic microwave background (CMB), far-infrared (FIR), and near-infrared (NIR), respectively. The red solid line is for the synchrotron emission. The XMM–Newton upper limit (black arrow) and the Fermi-LAT data (red squares) are from this work. The other data are taken from Aliu et al. (2014) (VERITAS – green diamonds) and Abdo et al. (2007) (MILAGRO – pink hexagons). The blue and grey butterflies are the HAWC models from Abeysekara et al. (2020) and from Abeysekara et al. (2017), plotted for comparison, but not used in the fit.](https://oup.silverchair-cdn.com/oup/backfile/Content_public/Journal/mnras/505/2/10.1093_mnras_stab1422/1/m_stab1422fig4.jpeg?Expires=1750039121&Signature=Oda0MUGSOfRFVMzFTRaExIocmBsKMXZinFyyKXXUKWPd~iNCH8Q1MyTybaOZQt6cFOJZTrLrbS-zj6RsRf8Cf7ZPDHsypv4Iee4PYAtjIp7s-DLz~k7cIXclkM7qikXCRI0KWoDVEVjzmZ7QCQIy3DT2QivcHLLQpkRZCF7X-q0am2zxCHHBUB8RwbJi4-0lTB29RcYZ8EnsC147tnpOpOoiTUwGZPfW0I0pCSAUnTGIZ5jv10c6-DWCkw95oJT5BhqXrpKBjwmOeVnfcOdHESaPLkt0kHk2fQXo40S0bVw-zuB6uu4-MLM3fnqbRrPJbE0PyBRKmtfXgA19nLP1MQ__&Key-Pair-Id=APKAIE5G5CRDK6RD3PGA)
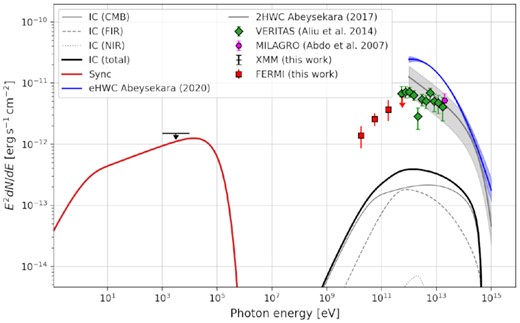
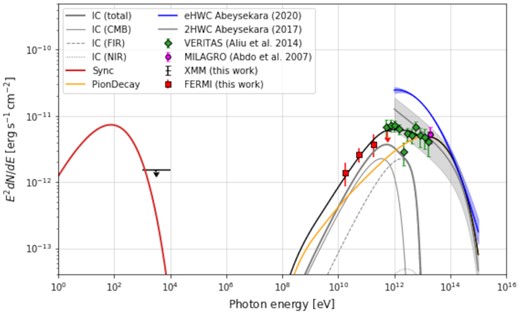
Multiwavelength spectral energy distribution (SED) of MGRO J1908+06 fitted with the leptonic scenario [inverse Compton (IC)+synchrotron] with B = 1.2 |$\mu$|G. The black line shows the total IC emission, whose components are indicated by the thin solid, dashed, and dotted black line for the cosmic microwave background (CMB), far-infrared (FIR), and near-infrared (NIR), respectively. The red solid line is for the synchrotron emission. The XMM–Newton upper limit (black arrow) and the Fermi-LAT data (red squares) are from this work. The other data are taken from Aliu et al. (2014) (VERITAS – green diamonds) and Abdo et al. (2007) (MILAGRO – pink hexagons). The blue and grey butterflies are the HAWC models from Abeysekara et al. (2020) and from Abeysekara et al. (2017), plotted for comparison, but not used in the fit.
We performed a binned analysis with five bins per energy decade and spatial pixel size of |$0{_{.}^{\circ}}05$|. In the maximum likelihood fitting, the normalization parameter of all the sources within 3° of the ROI centre, as well as the diffuse emission components, was left free to vary. Instead the parameters of all the other sources at more than 3° were fixed to the values given in the 4FGL catalogue (Abdollahi et al. 2020). To describe the spatial morphology of MGRO J1908+06, we used the VERITAS emission region at 3σ level (i.e. the outermost contour in Fig. 1), while for the spectral model we assumed a power law with photon index Γ = 1.6. This leads to a detection significance |$\sqrt{{ TS}}\sim 6$| in the energy band considered. The γ-ray flux was obtained by binning the γ-ray data in the range from 10 to 1000 GeV into four energy intervals, and performing a binned likelihood analysis in each energy bin. The resulting Fermi-LAT SED is plotted in Fig. 4.
3.3 X-ray analysis
To study the X-ray emission in the vicinity of PSR J1907+0602, we used a 52 ks long observation carried out on 2010 April 26 with the XMM–Newton satellite. We analysed the data of the European Photon Imaging Camera (EPIC)-Metal Oxide Semiconductor (MOS) instrument that was operated in full frame imaging mode and with the medium thickness optical filter. We excluded time intervals with high background, resulting in net exposure times of 36 and 38 ks for the two MOS cameras.
Using the Extended Source Analysis Software (esas3), we extracted the spectra from a circular region of 5 arcmin radius centred at the position of PSR J1907+0602 (excluding a circle of 30 arcsec radius around the source) and from a concentric annular region with radii 5 and 12.5 arcmin. The latter was used to estimate the X-ray background (which in this sky region is dominated by the Galactic ridge diffuse emission). Comparison of the two spectra showed no evidence for diffuse emission associated with PSR J1907+0602, with an upper limit (at 95 per cent confidence level) of 1.2 × 10⁻¹⁵ erg cm−2 s−1 arcmin−2 on the surface brightness in the 1–10 keV energy range.
4 ORIGIN OF THE γ-RAY EMISSION
Emission at TeV energies indicates the presence of ultrarelativistic particles that, in principle, can produce it through inverse Compton (IC) scattering of the cosmic microwave background (CMB), infrared (IR), and/or starlight seed photons by electrons, or through the decay of neutral pions resulting from proton–proton (and/or other nuclei) interactions. In this section, we first explore the possibility that a single mechanism is responsible for the emission from the whole trilobed region in either the leptonic or hadronic scenario.
We then consider the possibility of a two-zone model, in which both components (hadronic and leptonic) are present. This scenario can be originated by a source able to efficiently accelerate both protons and electrons, or by two sources lying in the same sky region.
In the following, we use the Fermi-LAT and XMM–Newton results derived as described above and the TeV spectra obtained with VERITAS (Aliu et al. 2014) and MILAGRO (Abdo et al. 2007). We have not used the HAWC data reported in Abeysekara et al. (2020) for our fit, because they are inconsistent with both the VERITAS and H.E.S.S. data in an energy range (1–10 TeV) where these instruments proved to show reliable results. Also H.E.S.S. data were not considered in the fitting procedure as they are fully compatible with the VERITAS ones. This discrepancy is explained in Abeysekara et al. (2020) as consequence the larger source extent observed by HAWC. However, we note that our model reproduces quite well the slope of the HAWC spectrum at energies of around 100 TeV, hence in the range where there is consistency between the results reported in Abeysekara et al. (2017, 2020).
The X-ray upper limit, derived for a region of about 75 arcmin2, was rescaled for the larger area enclosed in the 3σ contours of the TeV emission (∼1400 arcmin2). This is a conservative assumption, because any diffuse X-ray emission produced by particles accelerated by the pulsar would likely decrease in intensity at larger distances.
4.1 One-zone leptonic hypothesis
In the leptonic scenario, we assume that the whole emission from MGRO J1908+06 is due to a population of relativistic electrons interacting, through IC, with the Interstellar radiation field (ISRF) photons. These electrons can be supplied by the energetic pulsar PSR J1907+0602 or by the SNR G40.5−0.5.
In order to infer the properties of the parent particle distribution, we fit the multiwavelength SED through a Markov chain Monte Carlo (MCMC) procedure using the naima python package (see Zabalza 2016 for a detailed description of the fitting procedure and of the IC radiative model). We modelled the three dominant photon fields with energy densities fixed at ϵCMB = 0.261 erg cm−3 for the cosmic microwave background (CMB), ϵFIR = 0.5 erg cm−3 for the far-infrared (FIR) dust emission, and ϵNIR = 1.0 erg cm−3 for the near-infrared (NIR) stellar emission. The electron distribution was modelled as a broken power law with an exponential cut-off with all the parameters free to vary during the fitting procedure.
We obtained a best fit (see Fig. 4) with the parameters for the electron distribution shown in Table 1.
Parameters for all emission models considered. Γ1 and Γ2 are the indices before and after the break (Eb), W is the particles total energy, E0 is the reference energy, and Ec is the cut-off energy.
| Model | Component | d | Γ1 | Γ2 | W | E0 | Eb | Ec |
|---|---|---|---|---|---|---|---|---|
| (kpc) | (erg) | (TeV) | (TeV) | (PeV) | ||||
| One-zone | Leptonic | 3 | 1.0 ± 0.4 | 2.6 ± 0.1 | 2 × 1047 | 10 | 2.7 ± 0.7 | 7.1 ± 6.0 |
| One-zone | Hadronic | 3 | 1.0 ± 0.1 | 2.1 ± 0.1 | 7 × 1047 | 30 | 2.8 ± 0.8 | 3.0 ± 0.9 |
| One-zone | Hadronic | 9 | 1.1 ± 0.2 | 2.1 ± 0.1 | 2 × 1049 | 30 | 3.4 ± 1.2 | 1.9 ± 0.5 |
| Two-component | Leptonic | 3 | 1.2 | 1.2 | 9 × 1046 | 10 | 0.2 | 0.011 |
| Hadronic | 3 | 1.6 | 2.0 | 4 × 1047 | 30 | 200 | >1 | |
| Hadronic | 9 | 1.6 | 2.0 | 1 × 1049 | 30 | 200 | >1 |
The high-energy electrons responsible for the TeV emission interact also with the ambient magnetic field producing synchrotron radiation. We found that the electron population obtained in our best fit can be reconciled with the XMM–Newton upper limit in the X-ray band only for ambient magnetic fields (B) smaller than 1.2 |$\mu$|G.
This limit is rather small compared to the typical value of the Galactic magnetic field of 5 |$\mu$|G (Haverkorn 2015). If we assume a magnetic field of 5 |$\mu$|G and the same spectral slope of the best fit, the normalization of the electrons population must be reduced by a factor of ∼15 to be consistent with the X-ray upper limit (see Fig. 5). This result shows that a one-zone leptonic model alone cannot explain the whole multiwavelength set of data.
Same as Fig. 4, but with B = 5 |$\mu$|G and the electron population normalization reduced by a factor of 15.
4.2 One-zone hadronic hypothesis
In the hadronic scenario, we assume that a population of relativistic protons interacts with dense interstellar material and produces TeV photons via pion decay. A good candidate for the acceleration of these protons is the SNR G40.5−0.5. In fact, our analysis of the molecular gas around the SNR demonstrated the presence of molecular clouds in good spatial correlation with the SNR shell. We used naima to fit the γ-ray SED, assuming a proton distribution described by a broken power law with exponential cut-off and pion decay as radiative model. The parameters of the best fit, shown in Fig. 6, are given in Table 1.
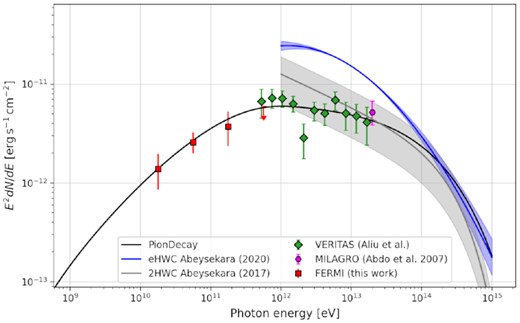
MGRO J1908+06 hadronic emission model. The black line shows the pion decay best-fitting model. Data are the same as in Fig. 4.
With the average densities of the clouds derived in Section 3.1, 180 or 60 particles cm−3 depending on the considered distance, the total proton energy required by the fit is 7 × 1047 erg or 2 × 1049 erg, respectively.
4.3 Two-zone model
Considering the complex spatial distribution of the VHE emission, it cannot be excluded that both a TeV PWN powered by PSR J1907+0602 and hadronic processes associated with the SNR G40.5−0.5 contribute to the γ-ray emission observed from this sky region. Therefore, we have also explored a hybrid emission model in which the TeV emission is due to the superposition of leptonic and hadronic components from these two sources. Of course, in this scenario, MGRO J1908+06 might consist of two physically separated sources, not necessarily at the same distance.
To fit the SED we assume that the steep spectrum at GeV energies has a leptonic origin, while the hadronic emission is responsible for the softer part at TeV energies. We used naima to recover the radiative models from a particle distribution. We used an exponential cut-off broken power law both for electrons and protons. The resulting emission model is plotted in Fig. 7, while the assumed parameters are reported in Table 1. The recovered total protons energy for distances of 3 and 9 kpc is 4 × 1047 and 1049 erg, respectively, while the total electrons energy is 9 × 1046 erg.
MGRO J1908+06 two-zone emission model. The black line shows the total emission, while the grey lines and the orange lines are for the IC and pion decay emission, respectively. Other colours are the same as in Fig. 4. The magnetic field is B = 4 |$\mu$|G.
5 DISCUSSION
The association of MGRO J1908+06 with an offset relic PWN driven by PSR J1907+0602 was initially considered the most likely origin of the VHE (Abdo et al. 2010). Our results show that, for reasonable values of the ambient magnetic field, a leptonic emission model fitting the γ-ray spectrum from the whole source would produce a synchrotron X-ray flux incompatible with the upper limit in the few keV region. The leptonic interpretation is also disfavoured by the spatial shape of the TeV emission, extending far from the pulsar position and without evident sign of spectral softening with distance from the pulsar, as it would be expected from electron cooling (Aliu et al. 2014). We further note that, due to the Klein–Nishina suppression of the IC cross-section at high energies, a rather large value of the electron maximum energy is required to fit the γ-ray spectrum.
Our analysis of the molecular gas around SNR G40.5−0.5 demonstrates the presence of molecular clouds in good spatial correlation with the SNR (see also Duvidovich et al. 2020) and motivates the exploration of a hadronic scenario. The cloud densities required by the best-fitting proton distribution used to reproduce the observed γ-ray spectrum are consistent with the ones that we derived from an analysis of the CO data, independent of the source association with the near (3 kpc) or far (9 kpc) source distance. However, the VHE emission of MGRO J1908+06 extends beyond the spatial distribution of the target material, with no obvious molecular cloud counterparts in the southern region. The very hard photon index Γ1 required to fit the Fermi-LAT data (not seen in other TeV sources associated with SNRs) also disfavours a fully hadronic model for MGRO J1908+06.
The difficulties discussed above for single-zone models are easily solved assuming that the MGRO J1908+06 spectrum is a sum of two components (hadronic and leptonic). The available data do not allow us to perform a spatially resolved spectral analysis. Thus we cannot exclude that these two components arise from different zones of the source (e.g. a TeV PWN powered by PSR J1907+0602 could be responsible for the southern lobe, and the interaction between the SNR G40.5−0.5 and the molecular clouds for the northern part).
An important result of this analysis is that for both the one-zone hadronic model and the two-component model the maximum energy of the emitting protons required to fit the γ-ray spectrum is greater than 1 PeV.
6 CONCLUSIONS
Our multiwavelength modelling of MGRO J1908+06 confirms that this source is one of the best Galactic PeVatron candidates. We found that single-zone models, although in principle justified by the presence of plausible counterparts in both the leptonic and hadronic scenarios (a pulsar wind nebula powered by PSR J1907+0602 or SNR G40.05−0.5 interacting with molecular clouds, respectively), run into problems to explain the multiwavelength and spatial morphology properties of MGRO J1908+06. Therefore a two-zone model is preferred to describe the emission from this source. Spatially resolved data, as those that will be provided by the next generation of Cherenkov telescopes such as the upcoming ASTRI mini-array and the Cherenkov Telescope Array (CTA), are needed to separate the emission components of this source.
ACKNOWLEDGEMENTS
This work made use of data from the FOREST Unbiased Galactic Plane Imaging survey with the Nobeyama 45-m telescope (FUGIN), a legacy project in the Nobeyama 45-m radio telescope.
DATA AVAILABILITY
The data underlying this paper will be shared on reasonable request to the corresponding author.
Footnotes
Available at http://jvo.nao.ac.jp/portal/.
Available at http://www.dendrograms.org/.
