


ABSTRACT
Solar analogues are important stars to study for understanding the properties of the Sun. Combined with seismic and spectroscopic analysis, evolutionary modelling becomes a powerful method to characterize stellar intrinsic parameters, such as mass, radius, metallicity and age. However, these characteristics, relevant for other aspects of astrophysics or exoplanetary system physics, for example, are difficult to obtain with high precision and/or accuracy. The goal of this study is to characterize the two solar analogues, HD 42618 and HD 43587, observed by CoRoT. In particular, we aim to infer their precise mass, radius and age, using evolutionary modelling constrained by spectroscopic, photometric and seismic analysis. These stars show evidence of being older than the Sun but with a relatively large lithium abundance. We present the seismic analysis of HD 42618, and the modelling of the two solar analogues, HD 42618 and HD 43587 using the cestam stellar evolution code. Models were computed to reproduce the spectroscopic (effective temperature and metallicity) and seismic (mode frequency) data, and the luminosity of the stars, based on Gaia parallaxes. We infer very similar values of mass and radius for both stars compared with the literature, within the uncertainties, and we reproduce correctly the seismic constraints. The modelling shows that HD 42618 is slightly less massive and older than the Sun, and that HD 43587 is more massive and older than the Sun, in agreement with previous results. The use of chemical clocks improves the reliability of our age estimates.
1 INTRODUCTION
The characterization of solar analogues and solar twins is a powerful and promising approach to better understand stellar evolution and, more specifically, the evolution of the Sun itself and the influence of leading parameters such as stellar mass and metallicity. The canonical differentiation of solar analogues with respect to solar twins comes from Cayrel de Strobel et al. (1981) and Cayrel de Strobel (1996), who described a solar twin as a star spectroscopically and photometrically indistinguishable from the Sun, within observational uncertainties. In contrast, solar analogues present up to a 10 per cent difference in their radius and mass and a difference of less than ±0.2 dex in metallicity when directly compared with the Sun (Meléndez et al. 2010; Beck et al. 2017). Among stellar properties, age is not yet taken into account in these definitions because of the intrinsic difficulties in estimating it.
The number of solar analogue stars has increased over the last decade, showing slightly different properties such as rotation period, age and magnetic activity (Schrijver & Zwaan 2008; Baumann et al. 2010; García et al. 2014) particularly in the last few years, because of the remarkable quality of the continuous photometric observations obtained by the CoRoT (Baglin et al. 2006), Kepler (Borucki et al. 2010), and on-going Transiting Exoplanet Survey Satellite (TESS; Ricker et al. 2015) space missions, as well as Gaia satellite measurements (Gaia Collaboration et al. 2016, 2018, 2021). These observatories provide time series of the stellar brightness, as light curves, for tens of thousands of stars. These data sets, and the associated signal processing techniques, allowed the measurement of fundamental parameters and acoustic oscillations for hundreds of solar-like oscillating stars (e.g. Chaplin et al. 2014).
In addition to the spectroscopic and photometric standard analyses, asteroseismology is a major tool to better define and study solar analogues and twins (Bazot et al. 2012). Appourchaux et al. (2008) and Benomar et al. (2009b) present one of the first asteroseismic analyses of a F 5V CoRoT star showing Sun-like oscillations, HD 49933. They extract several p-mode frequencies, the large frequency spacing, the frequency of maximum amplitude of the modes, and the mean rotational frequency splitting. Piau et al. (2009) compared these results with stellar models to estimate the effect of input physics on classical and seismic parameters. They pointed out that diffusion and rotation-induced mixing have to be included in the models to achieve reliable estimates of mass and age. However, they did not aim to find the best model that fit the observational constraints to estimate mass and age. Lebreton & Goupil (2014) performed a very detailed modelling of another CoRoT star, HD 52265, a metal-rich G 0V star, more massive than the Sun. They explored many of the parameters and approaches that can influence the results of modelling. Another example of astronomical analysis of a solar analogue is the characterization of 16 Cygni A and 16 Cygni B, based on Kepler observations (e.g. Metcalfe et al. 2012; do Nascimento et al. 2014; Davies et al. 2015; Bazot et al. 2019). Note that do Nascimento et al. (2014) complemented the light-curve analysis by comparing with stellar evolution models. The brightest solar twin, 18 Sco, has been studied by Bazot et al. (2018), who used spectrophotometric, interferometric and asteroseismic data to constrain stellar evolution models and to estimate physical characteristics. They reached a precision of 6 per cent on the mass and X0, 9 per cent on Y0, and 35 per cent on the mixing-length parameter. Recently, Nsamba et al. (2021), using asteroseismic inferences, quantified the effect of the treatment of the initial helium abundance on the systematic uncertainties on the inferred stellar parameters, such as radius, mass and age, in stellar model grids.
Morel et al. (2013) obtained high-resolution spectroscopy of two bright solar analogue CoRoT targets, HD 42618 and HD 43587, with the High Accuracy Radial Velocity Planet Searcher (HARPS) spectrograph. Because of the relatively high brightness of these stars and a signal-to-noise ratio (S/N) of about 300, the exploitation of these observations is made easier and more robust. They presented the atmospheric parameters and chemical composition of both stars, precisely determined using a fully differential analysis with respect to the Sun. Although both stars are confirmed to be solar analogues, they found differences in the surface abundance of lithium, which could be explained by different mixing efficiencies in their interiors. They pointed out that these results should set constraints on theoretical modelling of the internal structures and solar-like oscillations of these stars. Boumier et al. (2014) carried out a seismic analysis of HD 43587. They extracted 26 p-mode frequencies with radial degrees l = 0, 1 and 2. From modelling with the stellar evolution code cesam2k (Morel & Lebreton 2008) and the losc adiabatic pulsation code (Scuflaire et al. 2008), they determined that HD 43587 seems to be slightly more massive and older than the Sun.
In this context, we propose to deepen the combined seismic and spectroscopic analysis of bright stars by studying the two CoRoT solar analogues, HD 42618 and HD 43587, using the stellar evolution code cestam (Marques et al. 2013). For each star, we find the best-fitting model that accounts for spectroscopic, photometric and asteroseismic observations, as explained in Section 3, to infer estimates of mass, radius and age.
Our paper is organized as follows. In Section 2, we present relevant observational information about the two CoRoT targets, HD 43587 and HD 42618. In Section 3, we present the stellar evolution code cestam, used to model both stars, as well as the calibration and optimization procedures. In Section 4, we present our modelling results. Finally, we give our conclusions in Section 5.
2 TWO COROT SOLAR ANALOGUE STARS
We have studied two targets of the CoRoT mission, HD 42618 and HD 43587, observed through the so-called seismic channel aiming at bright stars (Ollivier et al. 2016), which allows precise spectroscopic observations and thus a combined seismic and spectroscopic analysis. These two targets are the closest to having solar characteristics among the CoRoT sample of bright stars. As more spectroscopic data become available, other stars such as Kepler (however fainter) or TESS targets (with generally shorter time series) could be included in future works.
2.1 HD 43587
HD 43587, a G 0V star observed by CoRoT for 145 d, has been observed with the high-resolution spectrograph, HARPS, at La Silla in 2010 December to 2011 January, to reach an S/N higher than 300. The analysis of the spectroscopic data is presented in Morel et al. (2013), from which we retain the following spectroscopic characteristics: effective temperature Teff = 5947 ± 17 K, and metallicity [Fe/H] = −0.02 ± 0.02. These small uncertainties are the result of a differential analysis of HD 43587 with respect to the Sun, both stars having very similar parameters, which is expected to minimize systematic errors (for more details, see Morel et al. 2013). Differential analyses of solar analogues with respect to the Sun in the literature quote similar – actually even (much) smaller – uncertainties (see, e.g., table 2 of Spina et al. 2018).
A first analysis of the seismic data of HD 43587 was made by Boumier et al. (2014). In the following, we use the oscillation frequencies they measured (see table 1 in Boumier et al. 2014). They derived from the seismic data a mass and a radius slightly larger than the solar values (M = 1.04 ± 0.01 M⊙, R = 1.19 R⊙) and an age larger than the solar one, 5.60 ± 0.16 Gyr, in apparent contradiction with its high lithium abundance, A(Li) = 2.05 ± 0.05 (Morel et al. 2013), which is an order of magnitude larger than solar abundance. Such enrichment is not expected for this type of star at that age (Meléndez et al. 2010).
2.2 HD 42618
Our second target is HD 42618, another CoRoT target (a G 4V star), observed twice for 79 and 94 d of the duty cycle, which has been spectroscopically characterized from several different observations. A preliminary seismic analysis was carried out by Barban et al. (2013).
For the seismic analysis of HD 42618, we used the time series provided by the CoRoT public archive.1 It corresponds to the so-called N2 data that are corrected from various instrumental effects (Chaintreuil et al. 2016; Ollivier et al. 2016). The star was observed during CoRoT periods LRa04 (2010 September 28 to December 16) and LRa05 (2010 December 17 to 2011 March 22), corresponding to a total observation duration of 184 d. The duty cycle is of about |$95{{\ \rm per\ cent}}$| so that gaps in the time series are expected to have a marginal effect on the data analysis. The light curve is prepared using the same method as in Appourchaux et al. (2008) and is analysed on the Fourier space after computing its power spectrum using the fast Fourier transform method.
Although of weak amplitude, the p-modes of HD 42618 are apparent on the power spectrum (Fig. 1). The mode identification is performed in the échelle diagram (Fig. 2), a concept introduced by Grec, Fossat & Pomerantz (1983). The échelle diagram shows two clear ridges associated with the l = 0 and l = 1 modes and a fainter one due to l = 2 modes. Modes of degree greater than l = 2 are not visible because of their low amplitudes.
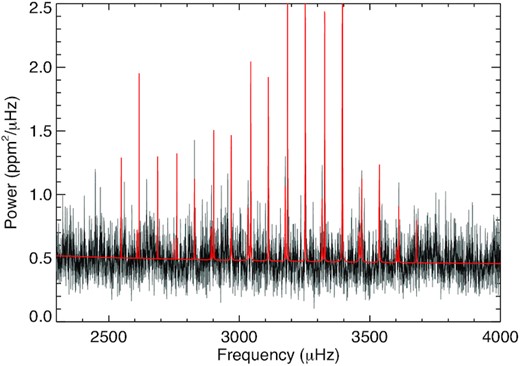
Power spectrum of HD 42618 smoothed using a box-car of width 1 |$\mu$|Hz (grey) and 3 |$\mu$|Hz (black). The best fit is shown superimposed (red).
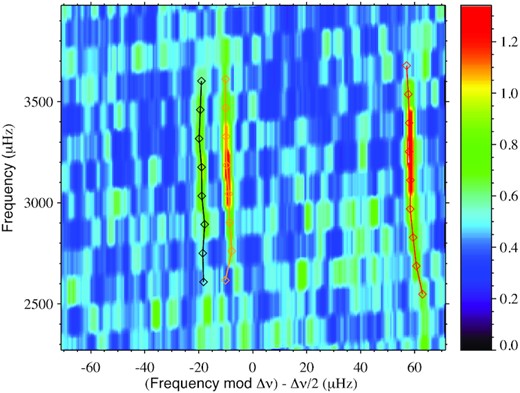
Echelle diagram for HD 42618. Frequencies for the best fit are shown in orange (l = 0), red (l = 1) and black (l = 2).
In order to reliably extract pulsation characteristics, we perform a Bayesian analysis. First, we measure the global properties of the acoustic modes using the pipeline described in Benomar et al. (2012). Mode amplitudes follow a bell-shaped function often modelled as a Gaussian, over the noise background. Here, we fit such a model, with the noise background being described by the sum of two power laws (Harvey 1985) plus white noise. This allows us to measure the frequency at maximum amplitude νmax, which relates to the mass, radius and effective temperature of the star (e.g. Huber et al. 2011). We found |$\nu _{\max} = 3157 \pm 46 \, \mu$|Hz. This is strikingly similar to the solar value (|$\nu _{\max, \odot } = 3090 \pm 30 \, \mu$|Hz), as reported in the literature (Huber et al. 2011).
Acoustic frequencies of high order and low degree |$(n \gg 1,\, l \sim 1)$| are nearly equally spaced and separated, on average, by a frequency spacing Δν. The spacing is related to the sound velocity inside the star by |$\Delta \nu = [2 \int _0^R {\rm d}r/c(r)]^{-1}$|, which is proportional to the mean stellar density |$\bar{\rho }$|. Because the solar density |$\bar{\rho }_{\odot } = (1.4060 \pm 0.0005) \times 10^3$| kg m−3 and frequency spacing |$\Delta \nu _{\odot } = 135.2 \pm 0.45 \, \mu$|Hz (Huber et al. 2011) are accurately known, it is possible to estimate reliably the mean density of any Sun-like star by the scaling relation, |$\bar{\rho } = \bar{\rho }_{\odot }(\Delta \nu /\Delta \nu _\odot)^2$|. For HD 42618, using the envelope autocorrelation function (EACF) method (Mosser & Appourchaux 2009), we found |$\Delta \nu = 141.2 \pm 0.6\, \mu$|Hz, which gives |$\bar{\rho } = (1.554 \pm 0.025) \times 10^3$| kg cm−3, a density slightly higher than that of the Sun.
The precise determination of individual pulsation properties, and in particular the frequencies, is done in a similar fashion to, for example, Appourchaux et al. (2008), Benomar et al. (2009b, 2014), Handberg & Campante (2011) and Ballot et al. (2011). More specifically, we use the Markov chain Monte Carlo (MCMC) sampling algorithm from Benomar, Appourchaux & Baudin (2009a). The power spectrum is modelled as a sum of Lorentzian profiles, with frequency, height, width, rotational splitting and the stellar inclination angle as free parameters. The noise background function is again a sum of power laws. Table 1 shows the frequencies, widths and heights of the modes for the best fit using the median as a statistical indicator, along with the 1σ uncertainties. Because of the low spectral resolution |$r=0.066\, \mu$|Hz and the important correlations between the rotational splitting δν and the stellar inclination i, it is difficult to measure these parameters individually for that star. However, the projected rotation |$\delta \nu \sin (i) =0.36 \pm 0.08 \, \mu$|Hz is well constrained. The large separation derived from the frequency list, |$\Delta \nu = 142.0 \pm 0.6\, \mu$|Hz is consistent with the result from the EACF method.
Measured mode frequency ν, height H and width Γ for modes of degree l = 0, 1, 2 for HD 42618. Symmetric uncertainties eν are given for frequencies, contrary to uncertainties on the other parameters that follow the format |$e^+_X$| and |$e^-_X$|, where X is the parameter.
| l | ν (|$\mu$|Hz) | eν (|$\mu$|Hz) | H (ppm2|$\mu$|Hz–1) | |$e^+_H$| | |$e^-_H$| | Γ (|$\mu$|Hz) | |$e^+_\Gamma$| | |$e^-_\Gamma$| |
|---|---|---|---|---|---|---|---|---|
| 0 | 2616.85 | 4.15 | 1.49 | 1.72 | 0.84 | 0.06 | 0.16 | 0.05 |
| 0 | 2761.25 | 1.10 | 0.83 | 0.53 | 0.31 | 0.26 | 0.35 | 0.16 |
| 0 | 2902.45 | 0.17 | 1.02 | 0.54 | 0.33 | 0.77 | 0.53 | 0.31 |
| 0 | 3044.13 | 0.16 | 1.56 | 0.52 | 0.39 | 0.92 | 0.29 | 0.24 |
| 0 | 3185.32 | 0.12 | 2.52 | 2.07 | 0.70 | 0.60 | 0.22 | 0.24 |
| 0 | 3327.06 | 0.24 | 1.97 | 0.75 | 0.61 | 0.79 | 0.42 | 0.21 |
| 0 | 3469.00 | 0.37 | 0.65 | 0.26 | 0.18 | 1.75 | 0.57 | 0.59 |
| 0 | 3610.99 | 0.44 | 0.44 | 0.50 | 0.34 | 0.90 | 3.77 | 0.46 |
| 1 | 2547.92 | 0.63 | 2.60 | 3.22 | 1.95 | 0.14 | 0.52 | 0.10 |
| 1 | 2687.62 | 0.27 | 2.24 | 2.57 | 1.25 | 0.06 | 0.16 | 0.05 |
| 1 | 2828.41 | 0.23 | 1.24 | 0.80 | 0.46 | 0.26 | 0.35 | 0.16 |
| 1 | 2969.33 | 0.29 | 1.52 | 0.81 | 0.50 | 0.77 | 0.53 | 0.31 |
| 1 | 3111.44 | 0.17 | 2.33 | 0.78 | 0.58 | 0.92 | 0.29 | 0.24 |
| 1 | 3252.91 | 0.18 | 3.77 | 3.10 | 1.05 | 0.60 | 0.22 | 0.24 |
| 1 | 3394.96 | 0.14 | 2.95 | 1.12 | 0.92 | 0.79 | 0.42 | 0.21 |
| 1 | 3536.67 | 0.41 | 0.98 | 0.38 | 0.27 | 1.75 | 0.57 | 0.59 |
| 1 | 3678.0 | 1.50 | 0.66 | 0.74 | 0.51 | 0.90 | 3.77 | 0.46 |
| 2 | 2608.75 | 4.15 | 0.79 | 0.91 | 0.45 | 0.06 | 0.16 | 0.05 |
| 2 | 2750.48 | 1.69 | 0.44 | 0.29 | 0.17 | 0.26 | 0.35 | 0.16 |
| 2 | 2893.19 | 0.59 | 0.54 | 0.29 | 0.18 | 0.77 | 0.53 | 0.31 |
| 2 | 3034.12 | 0.41 | 0.82 | 0.28 | 0.21 | 0.92 | 0.29 | 0.24 |
| 2 | 3176.04 | 0.17 | 1.33 | 1.10 | 0.38 | 0.60 | 0.22 | 0.24 |
| 2 | 3317.13 | 0.41 | 1.04 | 0.40 | 0.33 | 0.79 | 0.42 | 0.21 |
| 2 | 3459.57 | 0.66 | 0.34 | 0.14 | 0.10 | 1.75 | 0.57 | 0.59 |
| 2 | 3601.98 | 1.45 | 0.23 | 0.27 | 0.18 | 0.90 | 3.77 | 0.46 |
Results from the cestam modelling of HD 43587.
| cestam | Observed | |
|---|---|---|
| Mass (M⊙) | 1.04 ± 0.01 | – |
| Radius (R⊙) | 1.19 | – |
| Age (Gyr) | 6.2 ± 0.1 | – |
| Teff (K) | 5966 | 5947 ± 17 |
| L (L⊙) | 1.60 | 1.605 ± 0.03 |
| [Fe/H] | −0.034 | −0.02 ± 0.02 |
| Y0 | 0.271 ± 0.008 | – |
| (Z/X)0 | 0.0261 ± 0.0007 | – |
| α | 0.692 ± 0.005 | – |
| |$\chi ^2_{\mathrm{r}}$| | 3.1 | – |
Morel et al. (2013) performed a similar spectroscopic differential analysis as for HD 43587, based on HARPS observations, and derived an effective temperature Teff = 5765 ± 17 K, and a metallicity [Fe/H] = −0.10 ± 0.02. This star has also been observed by several other authors. Fulton et al. (2016) derived Teff = 5747 ± 44 K and [Fe/H] = −0.11 ± 0.03 from High-Resolution Echelle Spectrometer (HIRES) observations at the Keck telescope. They also claim the presence of a Neptunian planet around HD 42618. Mahdi et al. (2016) used ELODIE measurements and a differential analysis to derive Teff = 5766 ± 13 K and [Fe/H] = −0.09 ± 0.01. HD 42618 was also analysed by Ramírez et al. (2014) who found very similar results, Teff = 5758 ± 5 K and [Fe/H] = −0.096 ± 0.005, and more recently by Spina et al. (2018) who found Teff = 5762 ± 3 K and [Fe/H] = −0.112 ± 0.003. These independent results show excellent agreement, in particular those based on a differential analysis, giving confidence about effective temperature and metallicity. In order to have spectroscopic data homogeneous with those of HD 43587, we retain the values derived by Morel et al. (2013).
2.3 Luminosity estimate of both stars
To compare the observational data with the models, we need to estimate the luminosity of these two stars. For both of them, extinction was neglected because of their small distance (lower than 25 pc). For the luminosity calculation, we made use of the Gaia Data Release 2 (DR2) parallaxes, which are available for both stars (Gaia Collaboration et al. 2018; Luri et al. 2018). For HD 43587, we used the V magnitude given in the SIMBAD data base, V = 5.700 ± 0.009 (Oja 1991), the Gaia DR2 parallax |$\pi = 51.803 \pm 0.111\, \mathrm{mas}$| (Gaia Collaboration et al. 2018), and the bolometric correction computed according to VandenBerg & Clem (2003), BC = −0.048 ± 0.006. We used the prescription of Zinn et al. (2019) to calculate the magnitude-dependent zero-point offset of Gaia DR2 parallaxes due to instrumental effects, in particular basic-angle variations (Lindegren et al. 2018). We found an offset of 0.063 ± 0.014 mas, to be added to the original Gaia DR2 parallax. We obtained for the luminosity L/L⊙ = 1.605 ± 0.037.
We used the same method for HD 42618, using the V magnitude in the SIMBAD data base, V = 6.839 ± 0.012 (Koen et al. 2010). Using the Gaia DR2 parallax |$\pi = 41.063 \pm 0.042\, \mathrm{mas}$| (Gaia Collaboration et al. 2018), with a zero-point offset of 0.059 ± 0.013 mas, and the bolometric correction BC = 0.077 ± 0.008, we found L/L⊙ = 0.918 ± 0.012.
For HD 42618, a significant discrepancy appears between the Hipparcos parallax (|$\pi = 42.55 \pm 0.55\, \mathrm{mas}$|; van Leeuwen 2007) and the Gaia DR2 result. Differences between parallaxes from Hipparcos and Gaia are expected and can be positive or negative (based on few examples drawn from CoRoT targets), and Gaia error bars are always smaller by at least a factor of 2. Both parallaxes are generally consistent because of the larger Hipparcos error bars. However, in the case of HD 42618, parallaxes, and thus the derived luminosity, which is L/L⊙ = 0.858 ± 0.025 using the Hipparcos parallax, are not consistent within 1σ error bars.
3 STELLAR EVOLUTIONARY MODELS
Here, we present the stellar evolution code cestam (Morel 1997; Morel & Lebreton 2008; Marques et al. 2013) used to model the stars considered.
The input physics used in the models are the OPAL05 equation of state (Rogers & Nayfonov 2002) and the OPAL opacities (Iglesias & Rogers 1996), complemented, at temperatures lower than 104 K, by the WICHITA opacities (Ferguson et al. 2005). Nuclear reaction rates were obtained using the NACRE compilation (Angulo et al. 1999), except for 14N(p, γ)15O for which we used the rates derived by Formicola et al. (2004).
Convective instability was determined according to the Schwarzschild criterion. In convective zones, the temperature gradient was computed using the so-called CGM description, following Canuto, Goldman & Mazzitelli (1996). We adopted the solar mixture of Grevesse & Noels (1993). We also computed models based on the mixing-length convection treatment of Böhm-Vitense (1958) and the solar mixture of Asplund et al. (2009), but these did not fit the observations satisfactorily. The adopted convection treatment and initial chemical mixture allowed better agreement between the computed and observed oscillation frequencies, from the optimization described hereafter.
Following the formalism of Michaud & Proffitt (1993), models were computed that include the microscopic diffusion of helium and heavy elements by gravitational settling, thermal and concentration diffusion but no radiative levitation. cestam includes transport of angular momentum by meridional currents and shear turbulence according to Zahn (1992). However, it is well known that this prescription does not reproduce the observed rotation profile of the Sun and red giants. Moreover, it also fails to reproduce the observed lithium abundance of the Sun. For this reason, we did not follow the lithium abundance evolution in cestam models.
Oscillation frequencies were computed using the adipls adiabatic oscillation code (Christensen-Dalsgaard 2008).
A minimization algorithm, called the osm (optimal stellar model),2 based on the Levenberg–Marquardt method, was used in order to determine the optimum cestam model matching the observational constraints. In this algorithm, some model parameters are allowed to vary. In the present work, the model parameters adjusted in order to fit observational constraints were: M, the stellar mass; A, the age; αCGM, the constant used in the CGM description of the convection; Y0, the initial helium abundance; andZ0, the initial metallicity.
The free model parameters listed above are adjusted in order to minimize the differences between computed and observed constraints (also listed above) by finding the lowest value of the χ2 between them. Using this approach, uncertainties on parameters are computed for fitted parameters using the Hessian matrix. The correlation between the fitted parameters is taken into account through the covariance matrix (following Miglio & Montalbán 2005). However, some characteristics of the star, such as the radius or the effective temperature, are outputs of the optimum model. They cannot be associated with an uncertainty because they are not adjusted during the minimizing process.
4 RESULTS
In this section, we present the results of our calculations for both stars. We then compare the reults with the spectroscopic and seismic inferences from the literature.
4.1 HD 43587
The search for the best model was made using different sets of seismic constraints among the ones listed in Section 3, leading to models with optimized parameters that differed by amounts within the error bars. The best (lowest |$\chi ^2_{\mathrm{r}}$|) model matches globally quite well the observed large frequency separation (Δν) and is also in good agreement with the frequency separation ratios r01 and r02, as well as with observed spectroscopic and photometric values within 1σ (see Table 2). Fig. 3 presents the Hertzsprung–Russell (HR) diagram with the best-fitting model. Fig. 4 shows the frequency separations or ratios Δν0, r02 = δν02/Δν and r01 = δν01/Δν1 of this model compared with the observed ones. The differences with observations are quantified as |$\chi ^2_{\mathrm{r}}=3.1$|. This relatively high value can be explained by random differences in seismic differences indicating that the modelling can still be improved. However, the general slopes of the frequency ratios r01 and r02, which depend on the central hydrogen content, and thus on the stellar age (Brandão et al. 2010; Silva Aguirre et al. 2011), are correctly reproduced. The present model is also close to the one found by Boumier et al. (2014) based on a previous version of the stellar evolutionary code cestam and a different computation of seismic frequencies. Uncertainties (1σ values) are given when the considered parameter is optimized (such as the mass and the age). When no uncertainty is given, the parameter considered is not fitted and corresponds to the value obtained in the optimized model. As mentioned in Section 3, uncertainties are computed using the Hessian matrix of the fitted parameters and they do not include other sources of uncertainties. They must be considered as lower bounds. The actual uncertainty interval (accuracy) is larger (roughly estimated to be of at least 0.5 Gyr for the age), as, for example, in the case of the age that could be different for modelling using other physical descriptions or other chemical compositions (see, for instance, Lebreton & Goupil 2014).
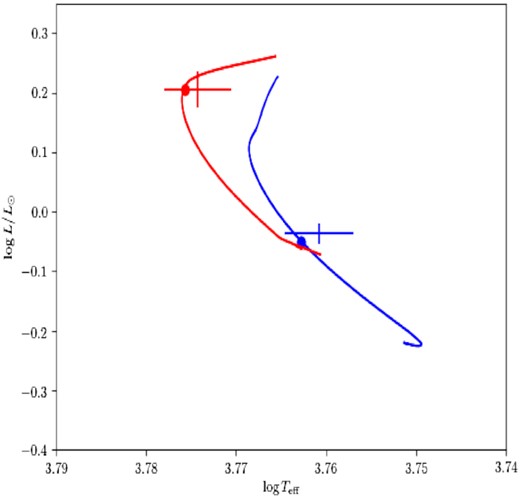
HR diagram for the stars HD 43587 (red) and HD 42618 (blue). Continuous lines are the evolution tracks of the best-fitting cestam models reproducing spectroscopic, photometric and seismic observations, represented by the filled circles (see Section 4). Crosses represent the observed values and their associated 3σ error bars, as described in Section2.
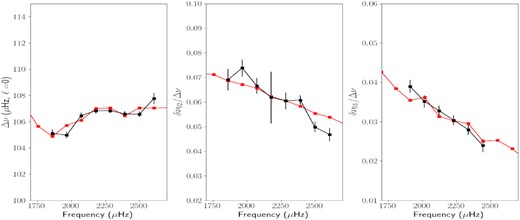
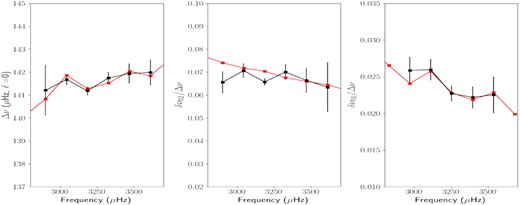
Large separations Δν0 for ℓ = 0 (left) and small separations δν02 (centre) and ratio δ01/Δν1 (right) for the star HD 43587 modelled with cestam. Red lines are for the models and black lines are for the observations, with the associated error bars.
The value of |$\chi ^2_{\mathrm{r}}$|, larger than unity, indicates a statistically bad agreement. However, as all the inferences of the global parameters (L, Teff, [Fe/H]) are within 1σ of the observations, these values mainly result from the difficulty of correctly modelling the internal structure, in particular the core and the base of the convective zone. In particular, the small-scale variations in the ratio r01, which are not correctly reproduced, are a result of changes in stratification at the base of the outer convective zone (Otí Floranes, Christensen-Dalsgaard & Thompson 2005), and may be better reproduced by including convective penetration below the convective envelope (Lebreton & Goupil 2012).
The analysis of the evolutionary status of HD 43587 in the literature is ambiguous. Because of its large lithium content, it was believed to be younger than the Sun, in contradiction with the flat light curve and the absence of chromospheric activity (Baliunas et al. 1995; Schröder et al. 2012; Boumier et al. 2014). Our modelling, including seismic constraints, implies that HD 43587 is older than the Sun, and we suggest that its large lithium abundance can be due to its slightly larger mass, compared with the Sun, which implies a thinner outer convective zone and thus a shallower mixing underneath, preventing the lithium depletion.
4.2 HD 42618
As for HD 43587, the global and seismic constraints listed in Section 3 were used for HD 42618. The results of the best model are presented in Table 3 and the evolution track is plotted in the HR diagram in Fig. 3 along with the observational point. The lowest |$\chi ^2_{\mathrm{r}}$| model with a value of 0.8 shows a statistically good agreement between observed and modelled seismic large separations and frequency ratios (see Fig. 5) with no systematic differences. Our model reproduces well the shape of the large separations curve, as well as the slope of the frequency ratios, and the small-scale variations of the ratio r01. Spectroscopic characteristics are also in very good agreement (less than or equal to 2σ uncertainty). The luminosity of the model is lower, at 3σ of the observed luminosity. For the metallicity, a difference smaller than 1σ is found.
Same as Fig. 4, but for the star HD 42618.
Results from the cestam modelling of HD 42618.
| cestam | Observed | |
|---|---|---|
| Mass (M⊙) | 0.92 ± 0.02 | – |
| Radius (R⊙) | 0.94 | – |
| Age (Gyr) | 5.5 ± 0.2 | – |
| Teff (K) | 5791 | 5765 ± 17 |
| L (L⊙) | 0.89 | 0.918 ± 0.012 |
| [Fe/H] | −0.116 | −0.10 ± 0.02 |
| Y0 | 0.281 ± 0.009 | – |
| (Z/X)0 | 0.0206 ± 0.0007 | – |
| α | 0.686 ± 0.011 | – |
| |$\chi ^2_{\mathrm{r}}$| | 0.8 | – |
We found a slightly less massive and older star than the Sun. The higher lithium content compared with the solar case can be explained by a significantly lower metallicity, which diminishes the opacity in the outer layers and makes the depth of the convective zone shallower, and thus the additional mixing beneath it.
4.3 Chemical clocks
Recent studies based on high-precision analysis of solar analogues with metallicities near the solar value (−0.15 ≲ [Fe/H] ≲ + 0.15) have shown remarkably tight and steep correlations between isochrone ages and either [Y/Mg] or [Y/Al]. The age scatter is typically less than 1 Gyr for a given abundance ratio and the relations extend over ∼10 Gyr (e.g. Nissen 2016). Similar trends are found for stars with asteroseismic ages with uncertainties within 10–20 per cent (Nissen et al. 2017; Morel et al. 2021). It is believed that the correlations arise from the chemical evolution of the Galaxy (e.g. Spina et al. 2016).
We make use of the [Y/Mg] and [Y/Al] abundances of Morel et al. (2013) and the quadratic age–abundance calibrations of Spina et al. (2018) to obtain an independent estimate of the ages of our targets (Table 4). We obtain average ages of about 5.4 and 6.3 Gyr for HD 42618 and HD 43587, respectively. Other calibrations (Nissen 2016; Spina et al. 2016; Tucci Maia et al. 2016; Nissen et al. 2017) lead to younger ages for HD 42618, but by less than 0.8 Gyr. For HD 43587, the deviations do not exceed 0.7 Gyr, with no evidence of systematic differences. Similar ages are therefore obtained despite the fact that the calibrations rely on different abundance and isochrone data sets.
Stellar ages of HD 43587 and HD 42618 derived from [Y/Mg] and [Y/Al] abundance ratios. The uncertainties in the abundance ratios and calibrations are propagated into the age estimates.
| Star | Age (Gyr) | |
|---|---|---|
| [Y/Mg] | [Y/Al] | |
| HD 43587 | 6.83 ± 0.67 | 5.72 ± 0.66 |
| HD 42618 | 5.93 ± 0.71 | 4.95 ± 0.74 |
| Star | Age (Gyr) | |
|---|---|---|
| [Y/Mg] | [Y/Al] | |
| HD 43587 | 6.83 ± 0.67 | 5.72 ± 0.66 |
| HD 42618 | 5.93 ± 0.71 | 4.95 ± 0.74 |
These results are consistent with our analysis. For both stars, our age estimates lie between the ages inferred from the [Y/Mg] and [Y/Al] abundance ratios, with differences of around 0.4–0.6 Gyr. In any case, all the ages provided by the chemical clocks are compatible within the error bars.
5 CONCLUSIONS
From the perspective of the preparation of the planetary transits and oscillations of stars (PLATO) mission (Rauer et al. 2014), the characterization of solar analogue stars is essential in the hunt for Earth-like planets. In particular, mass and age are parameters that are very difficult to estimate, with no direct observations for single field stars. To achieve a better estimate of these parameters, all types of data are useful, provided they are precise enough. In this work, we used simultaneously spectroscopic data from HARPS and seismic analyses from the CoRoT light curves of two solar analogues stars, HD 42618 and HD 43587.
A first result concerns HD 43587; we found that the star is slightly more massive and older than the Sun. This is in agreement with Boumier et al. (2014) concerning the mass but we converge to an age larger by about 0.5 Gyr. This is comparable with actual error bars but could be due to the inclusion of the ratio of frequency separations in the seismic constraints instead of individual frequencies only. However, the relatively high value of the reduced |$\chi ^2_r$| indicates that our modelling can still be improved.
In the case of HD 42618, we converge to an age very different from the estimation of Morel et al. (2013) based on isochrone fitting (2.17 Gyr but with large error bars of ±1.83 Gyr), and from Barban et al. (2013) (3.84 ± 0.12 Gyr) using the Asteroseismic Modeling Portal (AMP; Metcalfe, Creevey & Christensen-Dalsgaard 2009; Mathur et al. 2012). Our modelling, leading to a low value of reduced |$\chi ^2_r$|, points clearly to a star slightly more evolved than the Sun but less massive.
We used the [Y/Mg] and [Y/Al] abundance ratios from Morel et al. (2013), which show tight correlations with age. These chemical clocks provide age estimates in agreement with our model-inferred ages, improving the reliability of our results.
This work also confirms that to characterize a star (age, mass, radius, etc.), both spectroscopic and seismic measurements must be used, as one or the other of these constraints alone is not enough to guarantee the reliability of the result (Piau et al. 2009; Silva Aguirre et al. 2013; Lebreton & Goupil 2014; Bazot et al. 2018). These stars, which are finely modelled as a result of seismology, allow a more precise comparison between models and observations. In addition, precise knowledge of the spectroscopic and astrometric constraints, based on Gaia measurements for example, and other constraints, such as rotation or lithium and/or beryllium abundances, in order to assess hypotheses on the efficiency of the internal mixing, are important for the future characterization of stars (e.g. in the framework of the PLATO mission).
ACKNOWLEDGEMENTS
The research activities of the Ge3 stellar team at the Federal University of Rio Grande do Norte are supported by continuous grants from Brazilian scientific promotion agencies. JDN and MC acknowledge support from CNPq (Bolsa de Produtividade). TM acknowledges financial support from Belspo for contract PRODEX PLATO mission development. Funding for the DPAC has been provided by national institutions, in particular the institutions participating in the Gaia Multilateral Agreement. FB warmly thanks Louis Manchon for his help with the handling of cestam.
DATA AVAILABILITY
This work has made use of data from the European Space Agency (ESA) mission Gaia (https://www.cosmos.esa.int/gaia), processed by the Gaia Data Processing and Analysis Consortium (DPAC; https://www.cosmos.esa.int/web/gaia/dpac/consortium), and from the CoRoT public archive (http://idoc-corot.ias.u-psud.fr/).
