


ABSTRACT
We present a spectroscopic determination of the redshift of the second source in the Jackpot gravitational lens system J0946 + 1006, for which only a photometric estimate of zphot = 2.41|$^{+0.04}_{-0.21}$| has previously been available. By visually inspecting an archival Very Large Telescope (VLT) X-Shooter observation, we located a single emission line from the source in the H-band. Among the possible options, we find that this line is most likely to be [O iii] 5007 Å at zspec = 2.035. Guided by this proposal, we were able to detect the faint C iii] 1907,1909 Å emission doublet in a deep VLT Multi Unit Spectroscopic Explorer datacube. The C iii] emission is spatially coincident with the brightest parts of the second Einstein ring, and strongly supports the redshift identification. The spectroscopic redshift is only marginally consistent with the photometric estimate. Re-examining the cosmological constraints from J0946 + 1006, the revised measurement favours less negative values of the dark energy equation-of-state parameter w; when combined with a cosmic microwave background prior, we infer w = −1.04 ± 0.20. The revised redshift does not significantly help to reconcile the small discrepancy in the image positions for the even more distant third source in J0946 + 1006.
1 INTRODUCTION
In double-source-plane gravitational lenses, a foreground galaxy forms multiple images of two background objects, at different redshifts. Such systems can be used to determine ratios of angular diameter distances, which in turn can be used to constrain cosmological parameters, such as the dark-energy equation-of-state parameter, w (e.g. Collett et al. 2012).
The Jackpot lens J0946 + 1006 is the best studied example of a galaxy-scale multiple-source-plane system to date. The lens was initially identified through the presence of emission lines at zs1 = 0.609 in the Sloan Digital Sky Survey spectrum of a zl = 0.222 early-type galaxy target (Bolton et al. 2008). Follow-up imaging with Hubble Space Telescope (HST) confirmed that this source, hereafter s1, was lensed, forming two bright arcs. The HST data also revealed a second set of arcs at larger radius and hence arising from a more distant source, s2 (Gavazzi et al. 2008). Most recently in Collett & Smith (2020, hereafter CS20), we reported a third source, s3, a doubly imaged Lyman-α emitter at zs3 = 5.975. This source was discovered in a deep integral-field data cube acquired with the Multi Unit Spectroscopic Explorer (MUSE; Bacon et al. 2010) on the ESO Very Large Telescope (VLT).
While s1 and s3 were identified through their spectroscopic signatures, s2 was detected in continuum imaging, and its redshift was not known from discovery. Sonnenfeld et al. (2012) acquired a spectrum with the Keck telescope centred on the brightest of the s2 arcs, and covering the wavelength range 3500–8600 Å, but they were not able to identify any spectral features from this source. Analysing HST data in five filters from U to H, they reported a photometric redshift of zphot, s2 = |$2.41^{+0.04}_{-0.21}$|.
The photometric redshift estimate has been used to derive constraints in the (Ωm, w) cosmological parameter plane by Collett & Auger (2014, hereafter CA14), and has been used to test the mass-density profile of the main lens by Sonnenfeld et al. (2012). Since these analyses rely critically on the accuracy of the photometric redshift, it is of interest to corroborate the value spectroscopically. (A precise spectroscopic redshift will also improve the precision of these analyses, although the photometric redshift uncertainty is a sub-dominant component of the total error budget for both applications.) With this goal, in CS20, we searched the deep optical datacube for spectral features from s2, but found no convincing lines or continuum breaks. As noted there, if the published photometric redshift is broadly correct, the MUSE data cover rest wavelengths 1400–2800 Å, where no strong features are expected. Weaker lines, such as [C iii] at 1907 Å and C iii] at 1909 Å (collectively C iii] hereafter) might be present, but could not be identified when working ‘blind’, i.e. without advance clues as to the precise redshift.
In this paper, we establish a secure spectroscopic redshift determination for s2 using archival data from X-Shooter (Vernet et al. 2011) at the VLT, in combination with the CS20 MUSE observation. The treatment of the X-shooter data, and identification of a probable [O iii] emission line is described in Section 2. Using this line as a guide, Section 3 shows the MUSE detection of the faint C iii] lines at the same redshift, and co-located with the s2 arc system. Section 4 reviews the observational results in the context of prior studies, while the implications for previous lensing analyses of J0946 + 1006 are addressed in Section 5. Our conclusions are summarized in Section 6.
2 A TENTATIVE REDSHIFT FROM X-SHOOTER
As a first step towards a redshift measurement, we make use of archival X-Shooter near-infrared (NIR) spectroscopic data acquired in 2013 by Spiniello et al. (2015). These observations were taken with a 11 × 1.2 arcsec2 slit1 at a position angle of 10.3 deg, which intersects the s2 Einstein ring close to the faint southern arc (see Discussion below).
The observation comprises 15 exposures totalling 3675 s. All of the frames were taken at an identical sky position, without any dithering or nodding along the slit, which precludes the automated extraction of a clean 1D spectrum, given the numerous cosmetic defects and artefacts in the X-Shooter NIR detector. Instead, we reduced the data using the standard ESO pipeline, and then visually searched the co-added 2D spectrum for features which could be plausibly attributed to s2. In particular, we take into account the known separation from the lens centre, and the expected spatial and spectral line profile.
Through this method we identified a single emission line in the H-band, at 15 197.5 Å, offset south along the slit by ∼2 arcsec (see Fig. 1). This part of the spectrum is clear of sky residuals and not significantly contaminated by detector artifacts. The line has spectral full width at half-maximum (FWHM) ∼ 3.8 Å (cf. nominal instrumental resolution 3.5 Å) and spatial FWHM 0.66 arcsec, consistent with the nominal image quality. The integrated signal-to-noise ratio is ∼20.
![Extract from the X-Shooter NIR spectrum, showing the only emission line confidently detected from the s2 arc system (red crosshairs). The strong trace at Δx = 0 is from the lens galaxy, and the faint extension to Δx ≈ –1.5 arcsec is continuum from the bright s1 arc. As well as the expected residuals from subtracting the bright H-band sky lines, the spectrum is contaminated by numerous bad pixels and artefacts because the observation was acquired without any dither between exposures. The emission feature at (15 335 Å, −1.4 arcsec), partially obscured by sky residuals, is the [S iii] 9531 Å line from s1 at z = 0.609.](https://oup.silverchair-cdn.com/oup/backfile/Content_public/Journal/mnras/505/2/10.1093_mnras_stab1399/2/m_stab1399fig1.jpeg?Expires=1750216460&Signature=mIB~GYNjWtSL00vrSlik8j-t8D5Xpa25pfBO0cc5tJfR0gTUt72fOp~eQG4v71EIF3~EevioIbGlc0gIKw7kAiq5e-mpARIukEVS9GwX6uUyuBHUoyr8BcYVtsPb8bavaYwhyjinXmTfUIT56605sI40IQImCUG615N9ns4GCAWkHMStMxK78sfes2KKjmaIoHplzOTweF5tiXXWr14YoBs6NEd95cIU6N4FyALDpAugCEtnPkRW6cogWVPNbPFoSPJF3bmqKDg-QhTuFNTB2hGbFmsLr8MXohjSDlHPZRvrbqis2wsiVZflINqdrM8e41oKx3KjbLdBArnSOvWX1w__&Key-Pair-Id=APKAIE5G5CRDK6RD3PGA)
Extract from the X-Shooter NIR spectrum, showing the only emission line confidently detected from the s2 arc system (red crosshairs). The strong trace at Δx = 0 is from the lens galaxy, and the faint extension to Δx ≈ –1.5 arcsec is continuum from the bright s1 arc. As well as the expected residuals from subtracting the bright H-band sky lines, the spectrum is contaminated by numerous bad pixels and artefacts because the observation was acquired without any dither between exposures. The emission feature at (15 335 Å, −1.4 arcsec), partially obscured by sky residuals, is the [S iii] 9531 Å line from s1 at z = 0.609.
Among the plausible identifications for the 15 197.5 Å line, [O iii] 5007 Å at z = 2.035 [O iii] 4959 Å at z = 2.065, or H β at z = 2.126, would all be marginally consistent with the Sonnenfeld et al. (2012) photometric estimate. We examine each of these possibilities in detail in Fig. 2. In the [O iii] 5007 Å at z = 2.035 solution, the companion 4959 Å line is unfortunately coincident with a strong sky subtraction residual, and cannot provide confirmation. No convincing emission is seen at the corresponding [O ii], H α or H β wavelengths either, but these lines are not necessarily tightly linked to [O iii], so the solution cannot be excluded. The [O iii] 4959 Å at z = 2.065 solution is disfavoured because the (threefold brighter) 5007 Å companion line is not detected. (There is some contamination from bad pixels in this part of the spectrum, but such a strong line would likely be discernible.) The H β at z = 2.126 solution is also disfavoured, in this case by the absence of a corresponding (brighter) H α line.
![A matrix of tests for possible corroborating lines in the X-Shooter spectrum, given different possible identifications for the line detected at 15 197.5 Å. The top row shows extracts assuming the detected line is [O iii] 5007 Å, the row second is the equivalent for [O iii] 4959 Å, and the third is for H β. The average continuum profile of the lens galaxy has been subtracted to aid visibility. An approximate telluric absorption correction was imposed derived from the lens continuum. Red markers show the expected locations of emission lines. None of the three possibilities can be confirmed or definitively rejected from these tests.](https://oup.silverchair-cdn.com/oup/backfile/Content_public/Journal/mnras/505/2/10.1093_mnras_stab1399/2/m_stab1399fig2.jpeg?Expires=1750216460&Signature=W3iy2oWImfDlviwJUtaca~f7pWWemgieG04--HmZ-d54mO8EhqfSJQThihNoLJMv9MS~vsZ9l54IBOInoaNhbuOnaW3pgcH3P44YDcMWS3o-P~5yOxxb5UTgiHiJw~GoAfcwq9aCwVeQosp9NEhFXfANd02ct1CeFZpSR84vqBaNK~-VQUbtq0jfmHwfzSUHpbgnwlanjIRhSc5R4~S8B1EjyBbIzTRDXDlNvPnwYoRlof3QhVmrQnpGqpDWPZaD2EfXCs-Ct9w03dMbUKFoADDrEcXUYArnl6YeRi0mnqu4V0uzSW8IAjGE6LVdkW1cquXk4V0PA7byOYOwpLX9cA__&Key-Pair-Id=APKAIE5G5CRDK6RD3PGA)
A matrix of tests for possible corroborating lines in the X-Shooter spectrum, given different possible identifications for the line detected at 15 197.5 Å. The top row shows extracts assuming the detected line is [O iii] 5007 Å, the row second is the equivalent for [O iii] 4959 Å, and the third is for H β. The average continuum profile of the lens galaxy has been subtracted to aid visibility. An approximate telluric absorption correction was imposed derived from the lens continuum. Red markers show the expected locations of emission lines. None of the three possibilities can be confirmed or definitively rejected from these tests.
Other redshift solutions would be inconsistent with the photometric estimate, and are again disfavoured by the absence of neighbouring lines. For example, [O ii] 3727 Å at z = 3.077 can be excluded since the doublet profile would be well resolved by X-Shooter. If the line is H α at z = 1.316 (or [N ii] 6584 Å at z = 1.308), we would expect to have detected [O ii] in the MUSE spectrum.
We conclude that emission line shown in Fig. 1 is most likely to be [O iii] 5007 Å, though this cannot be confirmed from the X-Shooter data alone.
3 CONFIRMATION VIA THE C iii] DOUBLET IN MUSE
The tentative X-Shooter line identification leads to a candidate redshift of z = 2.035. Guided by this information, we re-analysed the CS20 MUSE observation (5.2 h exposure, 0.5 arcsec image quality), searching for the weak C iii] lines, which are often the only detectable features in the MUSE spectral range for galaxies at z = 1.5–3.0 (Maseda et al. 2017). The conditions for C iii] emission may be expected to trace those required for strong [O iii], and for a high [O iii]/[O ii] ratio (Jaskot & Ravindranath 2016), as apparently present in s2.
Constructing net narrow-band images centred on the expected C iii] wavelength indeed reveals a weak feature coincident with the brightest parts of the s2 arcs, with a peak of ∼4σ above the noise level. The upper panel of Fig. 3 shows the net emission contours overlaid on the HST image, after some tuning of the line and continuum bands. The line emission matches closely to the s2 arc configuration, with peaks near both ends of the merged-image western arc, where the continuum is also strongest, and at the corresponding point in the north-east arc. We do not detect C iii] emission from the fainter southern arc, however (and no C iii] emission was detected at this position in the X-Shooter spectrum either). Extracting a spectrum from the brightest pixels in the narrow-band image reveals a doublet structure consistent with correct line separation to be C iii]. The redshift places the lines very close to the region excised by the Na D notch filter used in MUSE to reject light from the adaptive optics (AO) laser guide sources. For the alternative redshift solutions of z = 2.065 and z = 2.126, C iii] would fall within the missing wavelength range, so the equivalent test cannot be performed for these cases. By extracting similar narrow-band images with randomly selected central wavelengths, we find that spurious ‘detections’ are fairly frequently observed somewhere in the field, as expected given the low signal level. However, comparably close matches to the arc morphology are not generated by chance.
![The weak C iii] doublet at z = 2.035 recovered in the MUSE data, guided by the X-Shooter evidence. The upper panel shows the HST F438W image in grey scale, with contours from the net narrow-band C iii] image from MUSE overlaid in red. Contours are spaced by 0.5σ in the excess flux, with the first bold contour drawn at 2.5σ, after smoothing with a Gaussian of 0.6 arcsec FWHM. The blue lines indicate the 1.2 Å slit used for the X-Shooter observation. The lower panel shows the spectrum extracted from the pixels inside the bold contour, with the doublet lines indicated. Yellow and blue regions show the on- and off-band wavelength ranges used for the narrow-band image. Pixels at λrest > 1913 Å are missing due to the MUSE Na D rejection filter.](https://oup.silverchair-cdn.com/oup/backfile/Content_public/Journal/mnras/505/2/10.1093_mnras_stab1399/2/m_stab1399fig3.jpeg?Expires=1750216460&Signature=XuWtc2W8dqeIegDrYxN8CoosNmhbDYTIDV6aLhvIUMMc-PIehX0oLPgIUliKkSno3f-JHOux8oWu-ztFsjybQhxTNFRKmxTlLljIL~OJ2qn8mlfU8tJ5jy7n42CHs35Wiv89iDv-rkvCXxTDcjE2~hytslLFkjKMlTOdl~j4stEoynrkaj6MmBx1Zip6yYrWGhMgKUyRXucBu15LBtPqqXLhFVCEeNpcm4hRWEWtuz~AygagmUrIUsrWETEoMAZ0aGbKJb8LVcxHPJuqAY-xoHPAfzuBKOLIO2Hmf2zBFW88cp-nSlpNA~jloYtTlBkBbQrisyhExFbs6aaUbw9Jtg__&Key-Pair-Id=APKAIE5G5CRDK6RD3PGA)
The weak C iii] doublet at z = 2.035 recovered in the MUSE data, guided by the X-Shooter evidence. The upper panel shows the HST F438W image in grey scale, with contours from the net narrow-band C iii] image from MUSE overlaid in red. Contours are spaced by 0.5σ in the excess flux, with the first bold contour drawn at 2.5σ, after smoothing with a Gaussian of 0.6 arcsec FWHM. The blue lines indicate the 1.2 Å slit used for the X-Shooter observation. The lower panel shows the spectrum extracted from the pixels inside the bold contour, with the doublet lines indicated. Yellow and blue regions show the on- and off-band wavelength ranges used for the narrow-band image. Pixels at λrest > 1913 Å are missing due to the MUSE Na D rejection filter.
The C iii] emission could not have been (and was not) reliably detected from the MUSE datacube alone, without the precise guidance from the X-Shooter line detection (see Section 4). Taking the two data sets in combination, however, the concordant wavelengths of [O iii] and C iii], and the spatial coincidence of C iii] with the s2 arcs, leave little doubt that the second source in the J0946 + 1006 lens system lies at zs2 = 2.035.
4 OBSERVATIONAL DISCUSSION
As shown in Fig. 3, the X-Shooter observation was made with the slit oriented at position angle + 10.3 deg, such as to not intersect with the s2 arc system as seen in the HST continuum image. Thus it may seem surprising that any line emission was detected from s2 at all.2 The most straightforward explanation is that the observed [O iii] flux was carried into the slit by convolution with the ∼0.6 arcsec ground-based seeing. If most of the line emission even from the southern arc was missed by X-Shooter, the full s2 arc system must be very bright in [O iii]. Alternatively, some of the line emission may arise in parts of the source that are not coincident with the UV continuum. A future AO-assisted NIR IFU observation, e.g. with the Enhanced Resolution Imager and Spectrograph at the VLT (Davies et al. 2018), would be able to map the [O iii] emission throughout the s2 arcs, providing further lensing information and also independent dynamical constraints on the mass in the z = 2.035 plane.3
The apparently clear detection of C iii] in this paper contrasts with the results of CS20, where we were unable to find any emission from s2 in the same MUSE datacube. Although the coincidence of the emission with the HST arc morphology seems compelling, the contours shown in Fig. 3 do reflect some adjustment of the line and continuum bandpasses and spatial smoothing scale. This treatment is only justified with the prior knowledge of the probable redshift, derived from the X-Shooter line. An equivalent degree of hand-tuning in a search over all possible redshifts, even if practical, would likely have generated many spurious matches. Note that the alternative approach, also tried by CS20, of extracting a net spectrum from all pixels which sample the arcs, yields a weaker average signal than that shown in Fig. 3, because the line emission is concentrated towards one end of the source.
Our spectroscopic measurement of zs2 is only marginally consistent (∼2σ) with the photometric estimate derived by Sonnenfeld et al. (2012). They summarize the redshift constraint as zphot, s2 = |$2.41^{+0.04}_{-0.21}$|, and the full posterior probability distribution (their fig. 4) is quite asymmetric, with a low-redshift tail extending to z = 1.5 and a small secondary peak at z = 1.75. The photometric redshift was based on images in five filters, of which the bluest are F336W and F438W. The redshift ambiguity may arise partially from the gap in coverage between these two filters at 3600–4000 Å, corresponding to a Ly α continuum break at z = 2.0–2.3. We note also that the Ly α emission line is redshifted to 3688 Å at z = 2.035, which is just within the wavelength range covered by the 3.5-h integration Keck spectrum of Sonnenfeld et al. (2012). No line is visible at that wavelength in their published 1D spectrum, nor in a stacked 2D spectrum re-reduced from their raw data. The Spiniello et al. (2015) X-Shooter UVB-arm data also show no detectable Ly α emission.
5 IMPLICATIONS OF THE REVISED REDSHIFT
In this section, we consider the implications of the revised redshift for some previous analyses of the J0946 + 1006 lens system.
Assuming a flat wCDM cosmology, where the dark energy equation of state is constant but not fixed to the ΛCDM value of −1, CA14 found w = −1.17 ± 0.20 when βCA14 is combined with a prior from Planck measurements of the cosmic microwave background (CMB; Planck Collaboration VI 2014). With the updated redshift for s2, the measured value of βCA14 maps to a less negative value of w at a given Ωm. Combined with the final Planck constraints (Planck Collaboration XVI 2020), the result now becomes w = −1.04 ± 0.20. We show the 2D (Ωm, w) parameter space in Fig. 4. As in CA14, cosmologies with very low matter density density and very negative equation of state are strongly excluded by the J0946 + 1006 result. These solutions are preferred by Planck alone, but the combination of J0946 + 1006 with the CMB data prefers a region of parameter space consistent with flat ΛCDM.
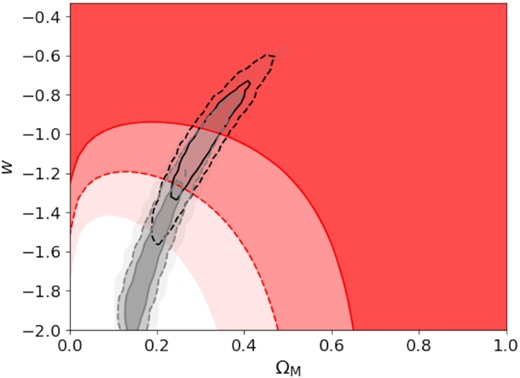
The w and ΩM plane. The red contours show the 68 per cent, 95 per cent, and 99.7 per cent confidence regions derived from the CA14 measurement of the cosmological scale factor in J0946 + 1006 and the updated redshift for s2. The Planck 2018 constraints are shown in grey, while black contours show the combined inference from J0946 + 1006 and Planck, with the solid (dashed) line encircling the combined 68 (95) per cent confidence region.
The newly measured redshift also affects the consistency test for the s3 image positions that we presented in CS20 (fig. 3 therein). We showed that the best-fitting lens model from CA14 maps the two images of the z = 5.975 galaxy back to positions which differ in the source plane by 0.15 arcsec. This is larger than the estimated astrometric errors, but can be accounted for by adjusting the most influential model parameters within their 1σ errors. In particular, the s3 image positions can be reconciled either by flattening the primary lens mass-density profile, or by increasing the value of βCA14. The new redshift of s2 does not change the value of βCA14 inferred from the lens model, only its mapping to the cosmological parameters. However, for a lower zs2, a larger mass of s1 is necessary to produce the same lensing effect on s2. This in turn increases its deflection of rays from s3 by 5 per cent. Since lensing by s1 is only a perturbation in the J0946 + 1006 system, this effect only brings the delensed image positions in the s3 plane 0.02 arcsec closer together than before. Thus the new redshift for s2 does not change the conclusions of CS20: the best-fitting lens model from CA14 is a good but not perfect description of the lensing of s3. A full four-plane lens model is still required to exploit fully the lensing information of all three sources (Ballard et al., in preparation).
Finally, we recall that Sonnenfeld et al. (2012) used the J0946 + 1006 system to constrain the stellar and dark-matter mass distribution in the lens galaxy itself. In this work, the cosmology is assumed to be known, so the change in zs2 enters directly through decreasing Dl, s2/Ds2 by 1.7 per cent compared to their adopted zs2 = 2.4. To balance this, the lensing mass within the second ring is increased by 1.7 per cent, which will lead to a very slightly flatter inferred total mass profile. This change is only marginally significant for the analysis of Sonnenfeld et al. (2012) since their uncertain Einstein radius measurement already maps to a 2 per cent uncertainty on the mass within the second ring. Calculating the projected masses with the ingredients of their decomposed model, we find such a shift could be generated by reducing the stellar fraction by ∼10 per cent for fixed dark-matter slope, or by flattening the halo profile from γ = 1.7 to 1.6, at fixed fractional contributions. Due to the large degeneracies inherent to the dark and stellar mass decomposition, changing the redshift of s2 to 2.035 thus has negligible impact on the 1D marginalized results of Sonnenfeld et al. (2012).
6 CONCLUSIONS
We have used X-Shooter and MUSE observations in combination to establish a secure spectroscopic redshift for the second source in the Jackpot lens J0946 + 1006. The revised redshift shifts the inferred value of the dark energy equation-of-state parameter to less negative values than derived in previous work. Combined with the Planck CMB prior, and marginalizing over Ωm, we find w = −1.04 ± 0.20. Whilst the combined result is in good agreement with ΛCDM there is a weak tension between the two constraints, with the lens analysis favouring smaller |w| than the CMB.
The Jackpot is now a fully spectroscopic triple-source-plane lens system, making it a high-precision optical bench for cosmology. A future comprehensive analysis of J0946 + 1006 will incorporate simultaneous modelling of all three sources including the compound lensing effects, as well as complementary dynamical modelling of the spatially-resolved stellar kinematics from MUSE.
ACKNOWLEDGEMENTS
RJS was supported by the Science and Technology Facilities Council through the Durham Astronomy Consolidated Grant 2020–2023 (ST/T000244/1). TEC was supported by the Royal Society through a University Research Fellowship. This research is based on observations collected at the European Organisation for Astronomical Research in the Southern Hemisphere under ESO programmes 089.A-0364(A) and 0102.A-0950. This research has made use of the Keck Observatory Archive (KOA), which is operated by the W. M. Keck Observatory and the NASA Exoplanet Science Institute (NExScI), under contract with the National Aeronautics and Space Administration.
DATA AVAILABILITY
The observational data used in this paper are publicly available in the ESO (archive.eso.org), HST (hla.stsci.edu), and Keck (www2.keck.hawaii.edu/koa/public/koa.php) archives.
Footnotes
Spiniello et al. (2015) report that a 1.5 arcsec slit was used, but this option was removed from the X-Shooter NIR arm in 2011.
Our search for lines in the X-Shooter spectrum was in fact made before correctly establishing the position angle. The image header records the angle with opposite sign to the slit angle on the sky. Not realising this, we believed the slit had been oriented at –10.3 deg which would have intersected both the southern arc and the north tip of the long western arc. Another X-Shooter observation (programme 090.B-0834 with PI Gavazzi) was taken in the IFU mode at position angle + 25 deg, and the 4 × 1.8 arcsec2 field of view again does not intersect the s2 arcs at all.
Such an observation would simultaneously map the [S iii] 9069, 9531 Å lines from s1, which are both clearly visible in the H-band with X-Shooter.
