


ABSTRACT
While it is known that the sharp-line star Vega (vesin i ∼ 20 km s−1) is actually a rapid rotator seen nearly pole-on with low |$i\, ({\lt}10^{\circ })$|, no consensus has yet been accomplished regarding its intrinsic rotational velocity (ve), for which rather different values have been reported so far. Methodologically, detailed analysis of spectral line profiles is useful for this purpose, since they reflect more or less the ve-dependent gravitational darkening effect. However, direct comparison of observed and theoretically simulated line profiles is not necessarily effective in practice, where the solution is sensitively affected by various conditions and the scope for combining many lines is lacking. In this study, determination of Vega’s ve was attempted based on an alternative approach making use of the first zero (q1) of the Fourier transform of each line profile, which depends on K (temperature sensitivity parameter differing from line to line) and ve. It turned out that ve and vesin i could be separately established by comparing the observed |$q_{1}^{\rm obs}$| and calculated |$q_{1}^{\rm cal}$| values for a number of lines of different K. Actually, independent analysis applied to two line sets (49 Fe i lines and 41 Fe ii lines) yielded results reasonably consistent with each other. The final parameters of Vega’s rotation were concluded as vesin i = 21.6(±0.3) km s−1, ve = 195(±15) km s−1, and i = 6.4(±0.5)○.
1 INTRODUCTION
The spectrum of Vega (=α Lyr = HR 7001 = HD 172167 = HIP 91262; spectral type A0 V) shows a sharp-line nature indicating a small projected rotational velocity (vesin i ∼ 20 km s−1, where ve is the equatorial rotation velocity and i is the angle of rotational axis relative to the line of sight), which is rather unusual among A-type main-sequence stars (many of them showing vesin i typically around ∼100–300 km s−1). It is nowadays known, however, that this star is actually a rapid rotator with large ve like other A stars and the apparent smallness of vesin i is simply ascribed to low i (i.e. this star happens to be seen nearly pole-on).
Its intrinsic rotational velocity can be observationally determined by detecting the gravity darkening effect, because it becomes more exaggerated as ve increases. The mainstream approach used for this purpose is to analyse the shape of spectral lines, because lines of a specific group (e.g. weak Fe i lines) show a characteristic feature (i.e. flat-bottomed profile), which is caused by the lowered temperature near to the gravity-darkened limb (see e.g. fig. 1 in Takeda, Kawanomoto & Ohishi 2008a). Alternatively, in order to establish ve, the extent of gravity darkening can be estimated from the brightness distribution on the stellar disc by direct high-resolution interferometric observations.
![Observed spectra of finally selected 49 Fe i lines (first through third panels) and 41 Fe ii lines (fourth through sixth panels), which are arranged in the increasing order of wavelength within each group of species as in Table 2. The actual spectral data (normalised flux plotted against the wavelength displacement relative to the line centre) are shown by lines, while the selected wavelength portions [λ1, λ2] used for calculating the Fourier transforms are depicted by symbols. Each spectrum (its continuum level is indicated by the horizontal dashed line) is shifted by 0.02 (2 per cent of the continuum level) relative to the adjacent one.](https://oup.silverchair-cdn.com/oup/backfile/Content_public/Journal/mnras/505/2/10.1093_mnras_stab1382/1/m_stab1382fig1.jpeg?Expires=1750100908&Signature=1F-t7hCqYIFzSxG-tz9FWUHwuZw-~GiTU3-vgIMOUQmnRK~7Oeo65lxWrAjZuNFIKQgoWj6SqaqBN~1cuEYiOHhIk5PwjATTPeUJI7r6lDAGboDzGiDruND0Z8gudT8O3RyStnBDEaJU9~aDoDOppkNfNwKyzAxQLrSOhyg6TVkxX2gVwLAPjrP7XJgxfN86uR8nvzPE0FEIp2~-zHrpDJINPO5isyVXYDiiOsZSA-QT2T5u4gHE6QtRI57wy8a66tdHELxTiEgTNn48wE6obCipSp0I4lr-YD6bVonpBsr3yRZbdEwOOaFQC9GO9MD0ifpvqiqaKWqy~bpD3B--MA__&Key-Pair-Id=APKAIE5G5CRDK6RD3PGA)
Observed spectra of finally selected 49 Fe i lines (first through third panels) and 41 Fe ii lines (fourth through sixth panels), which are arranged in the increasing order of wavelength within each group of species as in Table 2. The actual spectral data (normalised flux plotted against the wavelength displacement relative to the line centre) are shown by lines, while the selected wavelength portions [λ1, λ2] used for calculating the Fourier transforms are depicted by symbols. Each spectrum (its continuum level is indicated by the horizontal dashed line) is shifted by 0.02 (2 per cent of the continuum level) relative to the adjacent one.
Beginning from 1990s and especially in the period around 2010, quite a few determinations of Vega’s ve based on these two methods have been tried by various investigators as summarised in Table 1. However, the resulting literature values of ve considerably differ from each other as seen from this table. Although the large discrepancy amounting to |${\gtrsim}100$| km s−1 (from ∼160 to ∼270 km s−1) seen in early 2000s has been mitigated up to the present, they are still diversified between ∼170 and ∼230 km s−1 (which are the published results since 2008).
Previous determinations of Vega’s rotation and related parameters.
| Authors | vesin i | ve | i | Rp | Re | P | Remark |
|---|---|---|---|---|---|---|---|
| (km s−1) | (km s−1) | (deg) | (R⊙) | (R⊙) | (d) | ||
| Gulliver et al. (1994) | 21.8 | 245 | 5.1 | – | – | – | Line profile |
| Hill et al. (2004) | 21.9 | 160 | 7.9 | – | – | – | Line profile |
| Aufdenberg et al. (2006) | 21.9 | 270 | 4.7 | 2.26 | 2.78 | – | Interferometry |
| Peterson et al. (2006) | 21.5 | 274 | 4.5 | 2.31 | 2.87 | – | Interferometry |
| Takeda et al. (2008b) | 22a | 175 | 7.2 | 2.52 | 2.76 | – | Line profile |
| Yoon et al. (2010) | 20.5 | 236 | 5.0 | 2.36 | 2.82 | – | Line profile |
| Hill et al. (2010) | 20.8 | 211 | 5.7 | 2.40 | 2.75 | – | Line profile |
| Monnier et al. (2012) | 21.3 | 197 | 6.2 | 2.42 | 2.73 | – | Interferometry (their Model 3) |
| Petit et al. (2010) | – | 184b | – | – | – | 0.732 | Magnetic modulation |
| Alina et al. (2012) | – | 198b | – | – | – | 0.678 | Magnetic modulation |
| Butkovskaya (2014) | – | 216b | – | – | – | 0.623 | Magnetic modulation |
| Böhm et al. (2015) | – | 198b | – | – | – | 0.678 | Magnetic modulation |
Notes. In columns 2–7 are given the values of projected rotational velocity, equatorial rotational velocity, inclination angle of rotational axis, polar radius, equatorial radius, and rotation period, respectively.
Assumed value.
Derived from P by assuming Re = 2.8 R⊙.
Meanwhile, the discovery of magnetic field in Vega by spectropolarimetry (Lignières et al. 2009) provided a new means to measure ve, because such a Zeeman signature would show cyclic variation due to rotation; that is, the rotational period (P) may be directly evaluated by applying a period analysis to time-series data of spectropolarimetric observations, from which ve is derived as ve = 2πRe/P by using an appropriately assigned Re (equatorial radius). Following this policy, Vega’s rotation period was determined within several years after 2010, as shown in Table 1. Although this method is expected to establish P precisely, these published data are not necessarily in good agreement but somewhat discrepant by ∼±10 per cent (i.e. ∼±20 km s−1 around ve ∼ 200 km s−1). Therefore, even such an independent technique (which is essentially different from the other in the sense that any modelling of gravity-darkened star is not required) has not yet significantly improved the situation regarding the ambiguity in ve.
Accordingly, it is desirable to redetermine ve of Vega with higher reliability than before, in order to clarify which of the recent results (between ‘low-scale’ value of ∼170–180 km s−1 and ‘high-scale’ value of ∼220–230 km s−1) is more justifiable.
Here, it may be worthwhile to mention the weak point of line profile analysis, which was once employed by the author’s group (Takeda, Kawanomoto & Ohishi 2008b; hereinafter referred to as Paper I) to evaluate Vega’s ve. According to our experience, to derive ve by searching for the best fit (minimising χ2) between the observed and modelled line profiles for a selected line feature (e.g. well-behaved weak Fe i line showing a flat-bottomed profile) is not so hard. However, there is no way to estimate how much uncertainty is involved in such a specific solution. Actually, since χ2 residual is a rather broad function of ve and quite vulnerable to a slight imperfection (e.g. improper placement of continuum level, existence of weak line blending, irregular noise in observed data, etc.), because extremely subtle difference of profile shape is concerned (typically of the order of ∼10−3 in unit of the continuum; cf. figs 4 and 5 in Paper I), an erroneous ve solution is easily brought about (or even no solution is found). Therefore, it was decided in Paper I to analyse the profiles of a large number of lines (87 lines of neutral species and 109 lines of once-ionized species) with a hope of hitting as many correct solutions as possible. Nevertheless, from a critical point of view, the result obtained in Paper I was not very satisfactory due to the following reasons: (i) The final solution (ve = 175 km s−1) was simply selected from nine models (where ve was varied from 100 to 300 km s−1 with an increment of 25 km s−1) as the one corresponding to the highest frequency of χ2 minimum for the case of neutral lines, so an ambiguity of ∼20 km s−1 due to the coarseness of model grid is inevitable from the start. (ii) While lines of neutral species yielded a Gaussian-like frequency histogram centred around 175 km s−1 (cf. fig. 6a in Paper I), those of ionized species (many of them have ‘non-flat-bottom’ profiles) show a near-flat distribution (cf. fig. 6b in Paper I); this means that the latter set of ionized lines were almost useless because they made no contribution to the determination of ve.
Consequently, the conventional line-profile matching in the wavelength domain applied in Paper I was not necessarily suitable for such a very delicate problem. In order to make a further step towards improving the precision, a more efficient approach has to be invoked, in which many lines of different properties can be effectively combined to increase the reliability of ve solution while providing a reasonable procedure for error estimation.
Recently, in an attempt to estimate the intrinsic rotational velocity of Sirius A, Takeda (2020; hereinafter referred to as Paper II) made use of the first zero frequency (q1) in the Fourier transform of the line profile. It then revealed that this quantity can be used for measuring the gravity darkening effect because it sensitively responds to a slight variation of the line profile; actually, q1 was found to vary almost monotonically with ve (inducing a gravity darkening). While how q1 reflects a change of ve naturally differs from line to line depending on its property, it was found to be the sensitivity of line strength (W) to temperature (T), which is represented by the parameter K (≡log W/log T), that essentially controls the ve dependence of q1. Therefore, since information of ve may be extracted from the comparison of the observed |$q_{1}^{\rm obs}$| with a corresponding set of |$q_{1}^{\rm cal}\,(K,v_{\rm e})$| calculated for this line on the models of different ve, the best solution of ve (along with its probable error) can be established by combining many lines of different K. This technique turned out successful, and in Paper II it was concluded that Sirius A is an intrinsically slow rotator (|$16 \le v_{\rm e} \lesssim$| 30–40 km s−1).
Motivated by this achievement, the author decided to apply this method to analysing the spectral line profiles of Vega, in order to revisit the task of determining its ve as done in Paper I, hoping that a result of higher accuracy would be obtained, so that the diversified literature values may be verified. The purpose of this article is to report the outcome of this reinvestigation.
2 OBSERVATIONAL DATA
2.1 Selection of lines and their profiles
Regarding the basic observational material of Vega, the high-dispersion spectra of high signal-to-noise ratio (S/N ∼2000) and high spectral resolving power (R ∼ 100 000) were used as in Paper I, which were obtained at Okayama Astrophysical Observatory by using the HIDES spectrograph attached to the 188 cm reflector and published by Takeda, Kawanomoto & Ohishi (2007).
The selection of lines to be used for the analysis was done by following almost the same procedure as adopted in Paper II (cf. section 2.2 therein), where it was decided to employ only lines of neutral and ionized Fe in order to maintain consistency with Paper II. As a result, a total of 90 lines (49 Fe i and 41 Fe ii lines) were eventually sorted out,1 which are listed in Table 2. The observed profiles of these lines are displayed in Fig. 1, and their original data are available in ‘obsprofs.dat’ of the supplementary material.
Atomic data and observed quantities of adopted spectral lines.
| λ | χlow | log gf | Wobs | K | |$q_{1}^{\rm obs}$| | |$q_{2}^{\rm obs}$| |
|---|---|---|---|---|---|---|
| (Å) | (eV) | (dex) | (mÅ) | (km−1 s) | (km−1 s) | |
| (49 Fe i lines) | ||||||
| 3922.911 | 0.052 | −1.651 | 25.3 | −14.89 | 0.02465 | 0.05085 |
| 4014.534 | 3.573 | −0.200 | 7.6 | −14.48 | 0.02425 | 0.05050 |
| 4021.867 | 2.759 | −0.660 | 9.4 | −15.21 | 0.02276 | 0.05120 |
| 4067.978 | 3.211 | −0.430 | 7.8 | −14.63 | 0.02393 | 0.04988 |
| 4175.636 | 2.845 | −0.670 | 6.4 | −14.82 | 0.02540 | 0.05027 |
| 4176.566 | 3.368 | −0.620 | 5.2 | −15.59 | 0.02517 | 0.04823 |
| 4187.038 | 2.449 | −0.548 | 15.9 | −14.36 | 0.02398 | 0.04980 |
| 4195.329 | 3.332 | −0.412 | 8.3 | −14.90 | 0.02538 | 0.04882 |
| 4196.208 | 3.396 | −0.740 | 4.2 | −14.73 | 0.02371 | 0.04530 |
| 4199.095 | 3.047 | +0.250 | 26.5 | −12.26 | 0.02503 | 0.05200 |
| 4202.028 | 1.485 | −0.708 | 33.6 | −12.38 | 0.02477 | 0.05236 |
| 4210.343 | 2.482 | −0.870 | 7.8 | −15.85 | 0.02426 | 0.05217 |
| 4219.360 | 3.573 | +0.120 | 15.4 | −13.31 | 0.02362 | 0.04897 |
| 4235.936 | 2.425 | −0.341 | 21.6 | −13.69 | 0.02568 | 0.05155 |
| 4238.021 | 3.417 | −1.286 | 2.7 | −15.76 | 0.02373 | 0.04730 |
| 4238.809 | 3.396 | −0.280 | 9.8 | −14.59 | 0.02490 | 0.05084 |
| 4299.234 | 2.425 | −0.430 | 21.1 | −13.56 | 0.02584 | 0.05010 |
| 4447.718 | 2.223 | −1.342 | 5.9 | −16.05 | 0.02342 | 0.04301 |
| 4466.551 | 2.832 | −0.590 | 12.4 | −14.96 | 0.02520 | 0.05088 |
| 4484.219 | 3.602 | −0.720 | 3.4 | −15.35 | 0.02078 | 0.04992 |
| 4494.563 | 2.198 | −1.136 | 7.6 | −16.26 | 0.02423 | 0.04895 |
| 4528.613 | 2.176 | −0.822 | 16.3 | −14.93 | 0.02450 | 0.05115 |
| 4547.846 | 3.546 | −0.780 | 2.0 | −16.44 | 0.02646 | 0.05141 |
| 4602.940 | 1.485 | −1.950 | 2.9 | −17.95 | 0.02107 | 0.04621 |
| 4611.284 | 3.654 | −0.670 | 2.8 | −15.21 | 0.02335 | 0.04747 |
| 4707.272 | 3.241 | −1.080 | 2.7 | −15.76 | 0.02289 | 0.05004 |
| 4903.308 | 2.882 | −1.080 | 3.9 | −15.85 | 0.02487 | 0.05074 |
| 4918.993 | 2.865 | −0.370 | 14.0 | −14.24 | 0.02469 | 0.05088 |
| 4920.502 | 2.832 | +0.060 | 29.3 | −12.08 | 0.02636 | 0.05265 |
| 4966.087 | 3.332 | −0.890 | 3.7 | −16.69 | 0.02211 | 0.05162 |
| 5049.819 | 2.279 | −1.420 | 4.7 | −17.23 | 0.02071 | 0.04464 |
| 5133.681 | 4.178 | +0.140 | 10.0 | −13.76 | 0.02473 | 0.05017 |
| 5162.292 | 4.178 | +0.020 | 8.7 | −14.23 | 0.02422 | 0.04991 |
| 5281.790 | 3.038 | −1.020 | 4.0 | −15.46 | 0.02387 | 0.04728 |
| 5341.023 | 1.608 | −2.060 | 3.5 | −17.63 | 0.02246 | 0.06592 |
| 5353.373 | 4.103 | −0.840 | 1.5 | −15.53 | 0.02327 | 0.04369 |
| 5364.858 | 4.446 | +0.220 | 7.5 | −13.94 | 0.02370 | 0.05068 |
| 5367.479 | 4.415 | +0.350 | 9.3 | −13.76 | 0.02557 | 0.05168 |
| 5371.489 | 0.958 | −1.645 | 12.3 | −16.95 | 0.02419 | 0.04971 |
| 5389.479 | 4.415 | −0.410 | 1.9 | −15.21 | 0.02572 | 0.04028 |
| 5569.618 | 3.417 | −0.540 | 4.5 | −15.87 | 0.02460 | 0.05192 |
| 5572.841 | 3.396 | −0.310 | 7.6 | −15.01 | 0.02508 | 0.05084 |
| 5576.090 | 3.430 | −1.000 | 2.2 | −14.98 | 0.02342 | 0.04979 |
| 5615.644 | 3.332 | −0.140 | 14.3 | −14.33 | 0.02563 | 0.05133 |
| 5633.975 | 4.991 | −0.270 | 1.6 | −14.59 | 0.02282 | 0.04763 |
| 6136.615 | 2.453 | −1.400 | 3.8 | −17.28 | 0.02402 | 0.04708 |
| 6137.694 | 2.588 | −1.403 | 2.8 | −18.58 | 0.02271 | 0.04905 |
| 6191.558 | 2.433 | −1.600 | 2.8 | −18.58 | 0.02341 | 0.04736 |
| 6230.726 | 2.559 | −1.281 | 4.0 | −16.44 | 0.02328 | 0.05124 |
| (41 Fe ii lines) | ||||||
| 4273.326 | 2.704 | −3.258 | 17.2 | −5.30 | 0.02662 | 0.05143 |
| 4278.159 | 2.692 | −3.816 | 7.2 | −5.98 | 0.02611 | 0.05284 |
| 4296.572 | 2.704 | −3.010 | 32.6 | −4.28 | 0.02764 | 0.05285 |
| 4413.601 | 2.676 | −3.870 | 4.2 | −5.66 | 0.02780 | 0.04958 |
| 4451.551 | 6.138 | −1.844 | 8.1 | −1.19 | 0.03020 | 0.05623 |
| 4472.929 | 2.844 | −3.430 | 13.2 | −5.45 | 0.02412 | 0.05491 |
| 4489.183 | 2.828 | −2.970 | 31.7 | −4.54 | 0.02730 | 0.05278 |
| 4491.405 | 2.855 | −2.700 | 38.5 | −4.12 | 0.02813 | 0.05322 |
| 4541.524 | 2.855 | −3.050 | 27.7 | −4.68 | 0.02737 | 0.05199 |
| 4576.340 | 2.844 | −3.040 | 27.6 | −4.70 | 0.02744 | 0.05185 |
| 4582.835 | 2.844 | −3.100 | 19.4 | −5.20 | 0.02645 | 0.05223 |
| 4620.521 | 2.828 | −3.280 | 15.8 | −5.16 | 0.02702 | 0.05118 |
| 4635.316 | 5.956 | −1.650 | 15.6 | −1.54 | 0.03032 | 0.05428 |
| 4666.758 | 2.828 | −3.330 | 16.4 | −5.56 | 0.02623 | 0.05034 |
| 4713.193 | 2.778 | −4.932 | 5.9 | −6.53 | 0.03818 | 0.06809 |
| 4731.453 | 2.891 | −3.360 | 20.9 | −5.29 | 0.02692 | 0.05184 |
| 4913.292 | 10.288 | +0.012 | 2.0 | +4.82 | 0.03830 | 0.08123 |
| 4948.793 | 10.347 | −0.008 | 1.9 | +5.07 | 0.03419 | 0.06236 |
| 4951.584 | 10.307 | +0.175 | 3.3 | +2.92 | 0.03701 | 0.05541 |
| 4977.035 | 10.360 | +0.041 | 2.1 | +4.59 | 0.03409 | 0.05122 |
| 4993.358 | 2.807 | −3.650 | 8.4 | −6.27 | 0.02610 | 0.05199 |
| 5004.195 | 10.272 | +0.497 | 6.6 | +2.92 | 0.03372 | 0.05589 |
| 5089.214 | 10.329 | −0.035 | 2.5 | +3.85 | 0.02708 | 0.04168 |
| 5106.109 | 10.329 | −0.276 | 1.1 | 0.00 | 0.04118 | 0.08262 |
| 5127.866 | 5.570 | −2.535 | 3.7 | −2.60 | 0.02657 | 0.07004 |
| 5132.669 | 2.807 | −4.180 | 3.1 | −6.21 | 0.02566 | 0.05284 |
| 5149.465 | 10.447 | +0.396 | 5.3 | +3.63 | 0.02978 | 0.04636 |
| 5203.638 | 10.391 | −0.046 | 1.9 | +5.07 | 0.02968 | 0.05292 |
| 5219.926 | 10.522 | −0.366 | 1.2 | +3.85 | 0.02856 | 0.04502 |
| 5272.397 | 5.956 | −2.030 | 7.0 | −2.05 | 0.02980 | 0.04995 |
| 5291.666 | 10.480 | +0.575 | 5.1 | +2.80 | 0.03584 | 0.07705 |
| 5387.063 | 10.521 | +0.518 | 4.4 | +3.25 | 0.03395 | 0.05187 |
| 5529.932 | 6.729 | −1.875 | 3.5 | −1.36 | 0.02854 | 0.05276 |
| 5567.842 | 6.730 | −1.887 | 2.1 | 0.00 | 0.03195 | 0.05079 |
| 5645.392 | 10.561 | +0.085 | 1.9 | +5.07 | 0.03955 | 0.05893 |
| 5835.492 | 5.911 | −2.372 | 1.4 | 0.00 | 0.02289 | 0.04158 |
| 6084.111 | 3.199 | −3.808 | 4.0 | −7.22 | 0.02622 | 0.05076 |
| 6147.741 | 3.889 | −2.721 | 14.4 | −5.00 | 0.02691 | 0.05213 |
| 6149.258 | 3.889 | −2.724 | 14.0 | −5.14 | 0.02678 | 0.05177 |
| 6175.146 | 6.222 | −1.983 | 4.0 | −2.41 | 0.02596 | 0.04678 |
| 6248.898 | 5.511 | −2.696 | 3.2 | −3.01 | 0.02396 | 0.04336 |
Note. In columns 1–7 are given the line wavelength, lower excitation potential, logarithm of oscillator strength times lower level’s statistical weight, observed equivalent width, T-sensitivity parameter, observed first zero frequency, and observed second zero frequency, respectively. The atomic data are taken from the compilation of Kurucz & Bell (1995).
The equivalent widths (Wobs) of these 90 lines were measured by the Gaussian fitting method, which are in the range of 1 mÅ |$\lesssim W^{\rm obs} \lesssim 40$| mÅ. As the ‘standard’ plane-parallel model atmosphere for Vega, Kurucz’s (1993) ATLAS9 model with Teff = 9630 K, log g = 3.94, vt = 2 km s−1 (microturbulence), and [X/H] = −0.5 (metallicity) was adopted in this study as in Paper I, which well reproduces the spectral energy distribution. By using this model along with the atomic data taken from Kurucz & Bell (1995)’s compilation, the abundance (Astd; called as ‘standard abundance’) was derived from Wobs for each line.
2.2 Zero frequencies of Fourier transforms
Then, the Fourier transform d(σ) of the line depth profile Dλ (≡1 − Fλ/Fcont) was calculated for each line as done in Paper II (cf. section 2.3 therein), and the first and second zero frequencies (σ1 and σ2, in unit of wavelength-1) were measured from the cuspy features of |d(σ)|, which were further converted to wavelength-independent quantities (q1 and q2, in unit of velocity−1) for convenience by the relation q ≡ σ(λ/c) (c: velocity of light). The resulting q1 and q2 are plotted against the line parameters in Fig. 2, from which the following arguments can be made:
These zero frequencies show an appreciable line-dependent scatter; especially, those of a fraction of Fe ii lines are remarkably higher in comparison with the theoretical values expected from the classical rotational broadening function (cf. Fig. 2a)
This implies that the conventional Fourier analysis of spectral line profiles, which assumes that the observed profile is expressed by a convolution of the rotational broadening function and thus the zero frequency of the rotational broadening function (dependent on vesin i) should be simply inherited in the observed transform equally for any line, is no more applicable for precise vesin i determination in this case.
The cause for this scatter in q1 as well as q2 is that they tend to systematically increase with K as shown in Fig. 2(b). This is because the line profile characteristics are determined by this T-sensitivity parameter; that is, a line of small/negative K (e.g. weak Fe i line of low excitation) shows a boxy U-shape, while that of large/positive K (e.g. weak Fe ii line of high excitation) has a sharp V-shape. Such a difference in the line profile (even if very subtle) is reflected by the position of zero frequency, which is actually verified by theoretical calculations based on the gravity-darkened rotating star model (cf. Section 3.3).
These q1 and q2 also show some systematic trends with respect to χlow (Fig. 2c) and Wobs (Fig. 2d); however, they can be reasonably explained by the dependence of K on χlow and Wobs, as discussed in appendix A2 of Paper II. Accordingly, it is the difference in K that causes the line-by-line different characteristics in the profile (and the zero positions).
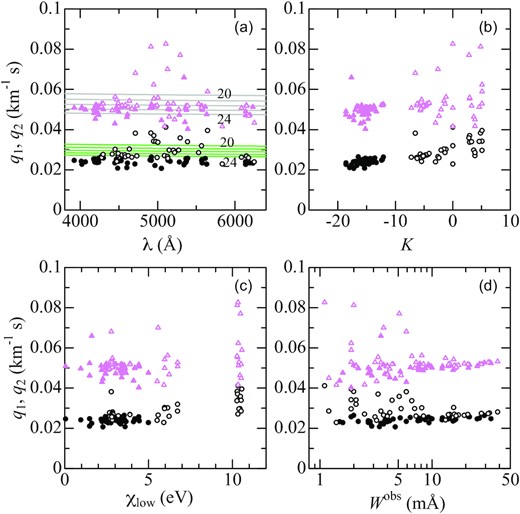
The first zero frequencies (q1: circles) and second zero frequencies (q2: triangles) of Fourier transforms, which were calculated from the observed profiles of 90 Fe lines, are plotted against (a) λ (wavelength), (b) K (T-sensitivity parameter), (c) χlow (lower excitation potential), and Wobs (observed equivalent width). The filled and open symbols correspond to Fe i and Fe ii lines, respectively. In panel (a), the classical q1(λ) and q2(λ) values derived from the conventional rotational broadening function corresponding to vesin i = 20, 21, 22, 23, and 24 km s−1 (which were derived from equations 3, 4, and 6 in Paper II) are depicted by solid lines.
The atomic line data and the values of Wobs, K, q1, and q2 for 90 lines are presented in Table 2. Besides, more complete data (including Astd and the main lobe height as well as the first sidelobe height) are summarised in ‘obsparms.dat’ of the supplementary material.
3 MODELLING OF LINE PROFILES
3.1 Adopted model parameters
Regarding the simulation of theoretical line profiles of a gravity-darkened rotating star, this study follows the same assumptions and procedures (including the adopted set of parameters for Vega) as described in Paper I, where the stellar mass (M), rotational velocity at the equator (ve), inclination angle of rotation axis (i), polar radius (Rp), and polar effective temperature (Teff,p) are the fundamental parameters to be specified.
The mass was fixed at M = 2.3 M⊙. 10 ve values were chosen as 22, 100, 125, 150, ⋅⋅⋅ 275, and 300 km s−1 (numbered as models 0, 1, 2, 3, ⋅⋅⋅, 8, and 9), and the corresponding i values were derived from the assumption of vesin i = 22 km s−1 (which is a reasonable value for Vega). Based on the requirement of spectral energy distribution, Rp and Teff,p can be expressed as second-order polynomials in terms of ve (cf. equations 1 and 2 in Paper I). The model parameters for each of the 10 models are summarised in Table 3, which is the same as table 1 in Paper I. Note that model 0 (ve = 22 km s−1 and i = 90○) is a special model different from others, in the sense that it is a spherically symmetric rigid model where the gravity effect (darkening and distortion) is intentionally suppressed. This model 0 is almost equivalent to the ‘standard model’ mentioned in Section 2.1.
Parameters of adopted models for rotating Vega.
| Model | ve | i | Rp | Re | Teff,p | Teff,e | log gp | log ge | Remark |
|---|---|---|---|---|---|---|---|---|---|
| number | (km s−1) | (deg) | (R⊙) | (R⊙) | (K) | (K) | (cm s−2) | (cm s−2) | |
| 0 | 22 | 90.0 | 2.700 | 2.700 | 9630 | 9630 | 3.937 | 3.937 | Gravity effect suppressed. |
| 1 | 100 | 12.7 | 2.640 | 2.722 | 9698 | 9399 | 3.956 | 3.956 | – |
| 2 | 125 | 10.1 | 2.600 | 2.726 | 9750 | 9281 | 3.969 | 3.884 | – |
| 3 | 150 | 8.4 | 2.560 | 2.740 | 9806 | 9126 | 3.983 | 3.858 | – |
| 4 | 175 | 7.2 | 2.520 | 2.763 | 9867 | 8931 | 3.997 | 3.823 | Nominated model in Paper I. |
| 5 | 200 | 6.3 | 2.470 | 2.784 | 9932 | 8695 | 4.014 | 3.783 | Best model concluded in this study. |
| 6 | 225 | 5.6 | 2.410 | 2.799 | 10000 | 8416 | 4.035 | 3.736 | – |
| 7 | 250 | 5.0 | 2.360 | 2.837 | 10074 | 8072 | 4.054 | 3.669 | – |
| 8 | 275 | 4.6 | 2.300 | 2.869 | 10151 | 7787 | 4.076 | 3.587 | – |
| 9 | 300 | 4.2 | 2.240 | 2.908 | 10233 | 7546 | 4.099 | 3.477 | – |
Note. Given are the model number, equatorial rotation velocity, inclination angle, radius, effective temperature, and logarithmic surface gravity at the pole as well as the equator. These models are the same as adopted in Paper I (cf. table 1 therein). Note that vesin i is assumed to be 22 km s−1 in all these models.
3.2 Simulation of line profiles
The emergent line flux profile was simulated with the program CALSPEC (cf. section 4.1 in Paper I) by integrating the intensity profile at each point on the visible disc, which was generated by using the local model atmosphere corresponding to Teff(Θ), g(Θ), vt = 2 km s−1, and [X/H] = −0.5 (where Θ is the co-latitude).
Here, a point to notice is how to assign the elemental abundance (A). If Astd (standard abundance derived from the classical plane-parallel model) is simply used, the equivalent width of the calculated line profile (Wcal) turns out generally stronger than Wobs because of the gravity darkening effect,2 and this discrepancy progressively increases towards higher ve (as can be recognized in figs 4 and 5 in Paper I). In Paper I, this problem was circumvented by renormalising the calculated profile (cf. equation 7 therein) so as to force Wcal = Wobs, although its validity was not necessarily clear.
Fortunately, this equality does not have to be strictly realised in the present case of Fourier analysis, because it is the ‘characteristics’ of the line shape that are essential. Accordingly, the following procedure was adopted in this study:
First, the provisional equivalent width |$W_{*}^{j}$| (j = 0, 1, 2, ⋅⋅⋅, 9) was calculated with CALSPEC for each model by using Astd.
Then, the corresponding abundance |$A_{*}^{j}$| was derived from |$W_{*}^{j}$| with the help of Kurucz (1993)’s WIDTH9 program by using the standard plane-parallel model (cf. Section 2.1).
The abundance difference defined as |$\Delta A^{j} \equiv A^{\rm std} - A_{*}^{j}$| (which is mostly negative) is used as abundance correction to be applied to Astd; that is, the abundance actually adopted in CALSPEC for calculating the profile corresponding to model j is Astd + ΔAj.
It should be remarked that this procedure is based on two assumptions that (i) the classical curve of growth (log W versus A relation) for the plane-parallel model is applicable even for the gravity-darkened case, and (ii) the absolute change of log W in response to perturbation by ±ΔA around Astd in this curve of growth is almost the same (i.e. locally linear). Despite these rough approximations, the discrepancy between Wcal and Wobs seen for the case of simply using Astd is considerably reduced by application of this correction (ΔA), as shown in Fig. 3.
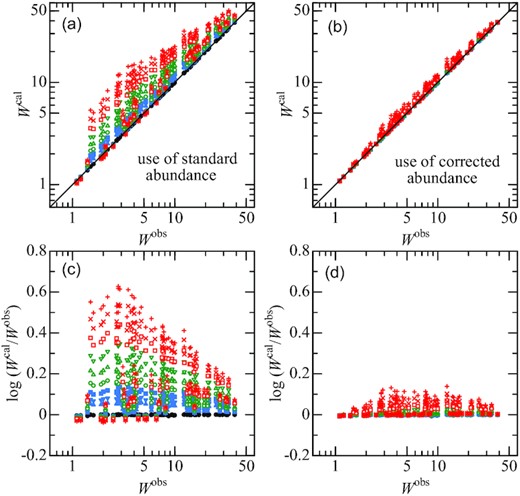
Graphical illustration describing how the abundance correction applied to the standard abundance (cf. Section 3.2) improves the discrepancy between the observed (Wobs) and calculated (Wcal) equivalent widths for each line, where Wcal (upper panels) and log (Wcal/Wobs) (lower panels) are plotted against Wobs. The left-hand panels (a, c) correspond to the case of using the standard (uncorrected) abundances, while the right-hand panels (b, d) correspond to the case of using the corrected abundances. The results for models 0, 1, 2, 3, 4, 5, 6, 7, 8, and 9 are denoted by filled circles, filled triangles, filled inverse triangles, filled squares, open circles, open triangles, open inverse triangles, open squares, St. Andrew’s crosses (×), and Greek crosses (+), respectively. (The symbols for model 0, models 1–3, models 4–6, and models 7–9 are coloured in black, blue, green, and red, respectively.)
3.3 Fourier transform and the trend of first zero
By using such corrected abundances, the theoretical line profiles were simulated for each of the 10 models and their Fourier transforms were computed, from which |$q_{1}^{j}$| and |$q_{2}^{j}$| (j = 0, 1, 2, ⋅⋅⋅, 9) were measured. These |$q_{1}^{j}$| and |$q_{2}^{j}$| values along with the adopted abundance corrections (ΔAj) for all 90 lines are given in ‘calparms.dat’ of the supplementary material.
As demonstrative examples, the simulated profiles of Fe i 5133.681 (K = −13.76) and Fe ii 4951.584 (K = +2.92) lines and their Fourier transform amplitudes, which were calculated for models 0, 1, 3, 5, 7, and 9, are illustrated in Fig. 4, where the observed data are also overplotted for comparison. It can be seen from Fig. 4 that the behaviours of zero frequency for these two lines of different K are just the opposite in the sense that q1 of Fe i 5133.681/Fe ii 4951.584 moves towards lower/higher direction as the gravity darkening effect is enhanced with an increase in ve.
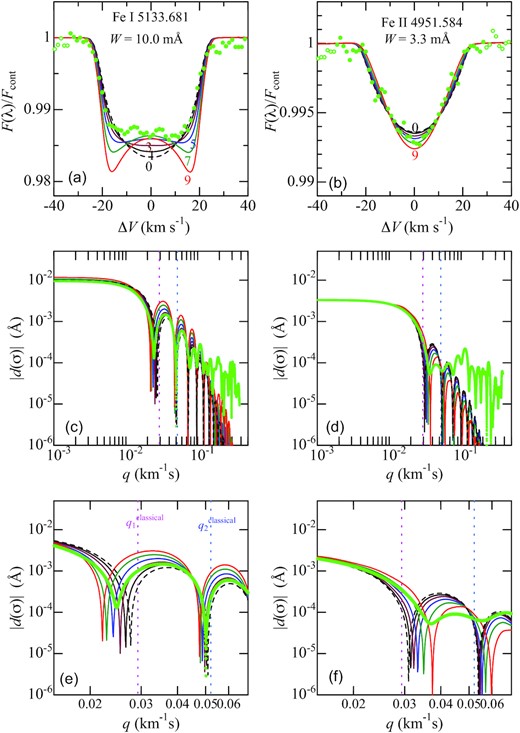
Theoretical line profiles (top panels) and their Fourier transform amplitudes (middle/bottom panels for wide/zoomed view) of Fe i 5133.681 (left-hand side) and Fe ii 4951.584 (right-hand side) calculated for models 0 (black dashed line), 1 (black solid line), 3 (purple solid line), 5 (blue solid line), 7 (green solid line), and 9 (red solid line); the observed data are also overplotted by light green symbols. In the middle/bottom panels, the positions of |$q_{1}^{\rm classical}$| and |$q_{2}^{\rm classical}$| corresponding to the classical rotational broadening function (cf. equations 3, 4, and 6 in Paper II) are indicated by vertical dotted lines for comparison.
From now on, our discussion focuses only on the first zero frequency (q1), which is less affected by measurement errors or noises in comparison to q2. In order to elucidate the trend of q1 as a function of K and ve, the q1 values are plotted against K in Figs 5(a)–(f) (each corresponding to models 0, 1, 3, 5, 7, and 9, respectively). Besides, the linear regression lines (determined from the q1 versus K plots for Fe i and Fe ii lines separately) are also shown in each panel, and these regression lines for all models are depicted together in Fig. 5(g). An inspection of Fig. 5 reveals the following characteristics:
q1 generally increases with an increase in K, which was already mentioned in Section 2.2 in reference to Fig. 2(b). The q1 values for Fe i lines are generally smaller than those of Fe ii lines because of the difference in K.
The slope of the q1 versus K plots is a systematic function of ve; i.e. it becomes progressively steeper with an increase in ve (Fig. 5g). This is a useful property for estimating ve from the observed q1–K relation.
The sensitivity of q1 to a change in ve also depends on K (cf. Fig. 5h). While |$\langle {\rm d}q_{1}/{\rm d}v_{\rm e}\rangle \lesssim 0$| holds for most lines of |$K \lesssim 0$| (all Fe i lines and many Fe ii lines), a group of high-excitation Fe ii lines (χlow ∼ 10 eV; such as Fe ii 4951.584 in Fig. 4) with positive K indicates 〈dq1/dve〉 > 0.
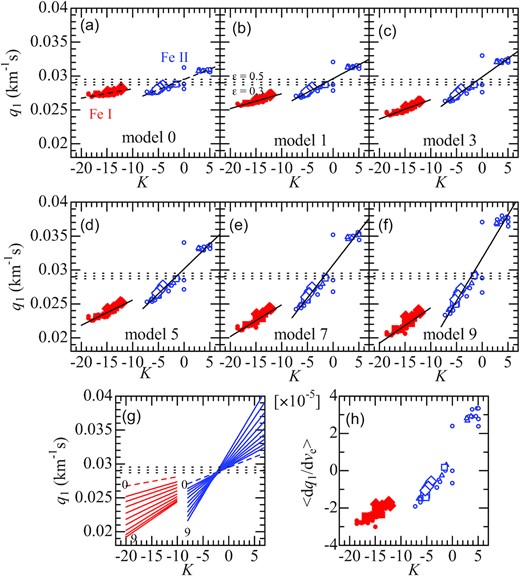
Panels (a)–(f) show the simulated relationships between q1 (first zero frequency) and K (T-sensitivity parameter) for the 49 Fe i (red filled symbols) and 41 Fe ii lines (blue open symbols) calculated for models 0, 1, 3, 5, 7, and 9, respectively. The size and shape of the symbols denote the difference in line strengths: circles |$\cdots \, W^{\rm obs} \lt $| 5 mÅ, triangles ⋅⋅⋅ 5 mÅ ≤Wobs < 10 mÅ, squares ⋅⋅⋅ 10 mÅ ≤Wobs < 20 mÅ, and diamonds ⋅⋅⋅ 20 mÅ ≤Wobs < 40 mÅ. The linear regression lines derived from these q1 versus K plots (separately for Fe i and Fe ii) are also overplotted by solid lines in each of the panels (a)–(f), and those for all 10 models are put together in panel (g). The three horizontal dotted lines represent the classical q1 values (corresponding to vesin i = 22 km s−1) for the limb-darkening coefficient (ϵ) of 0.3, 0.4, and 0.5 (cf. equation 3 in Paper II). In panel (h) are plotted the mean gradients 〈dq1/dve〉 (in unit of km−2 s2; averaged over ve between 100 and 300 km s−1) against K, which were computed from the coefficients of quadrature fit (|$q_{1} = A + B v_{\rm e} + C v_{\rm e}^{2}$|) as B + 2C × (100 + 300)/2 (i.e. dq1/dve at the mid-ve).
4 RESULT AND DISCUSSION
4.1 Rotational velocity of Vega
Now that the observational data of zero frequencies (|$q_{1}^{\rm obs}$|) as well as the corresponding theoretically calculated values (|$q_{1}^{{\rm cal},j}$| for j = 0, 1, ⋅⋅⋅, 9) to be compared are all set for 90 lines, we can address the main task of investigating Vega’s rotational velocity, while following the same procedure as adopted in Paper II (cf. section 4.3 therein).
The observed |$q_{1}^{\rm obs}$| values are plotted against K in Fig. 6. As seen from this figure, these |$q_{1}^{\rm obs}$| data show an increasing tendency with K and those for Fe i and Fe ii lines are distributed in separate two groups, which is quite similar to the theoretical predictions mentioned in Section 3.3 (cf. Figs 5a–f). Therefore, there is a good hope of successfully establishing ve by comparing |$q_{1}^{\rm obs}$| and |$q_{1}^{{\rm cal}}$| for many lines altogether.
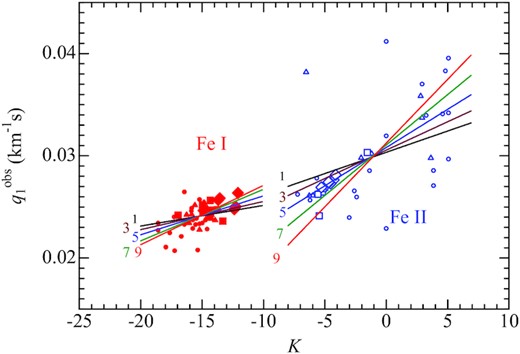
Observed q1 values of Fe i and Fe ii lines plotted against K, where the meanings of the symbols are the same as in Fig. 5. The averaged trends (gradients) of theoretical q1 versus K relations calculated for models 1, 3, 5, 7, and 9 (determined by linear-regression analysis; cf. Fig. 5) are also depicted by solid lines, which were multiplied by a scaling factor of 22/x* in order to adjust the difference between the actual vesin i(≡x) and the assumed value (22 km s−1) in the profile calculation (see Table 4 for the ve-dependent values of x*).
The behaviours of the resulting σ (3D surface and contour plots) are displayed in Fig. 7 (left- and right-hand panels are for Fe i and Fe ii, respectively). The trace line connecting (x*, ve) is also overplotted by the dashed line, where x* corresponds to the minimum of σ trough for each ve (in Table 4 are given the actual data of x* and the corresponding σ*). Besides, the run of σ with ve across the tracing is depicted in Fig. 8(a), and the tracings for both species are drawn together in Fig. 8(b).
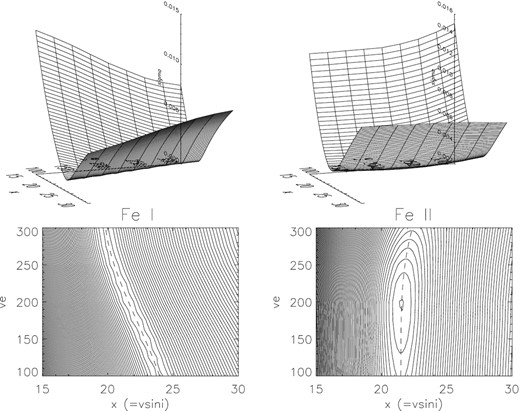
Graphical display of the behaviour of σ, which is the standard deviation between the simulated |$q_{1}^{\rm cal}(x,v_{\rm e})$| (where x ≡ vesin i) and the observed |$q_{1}^{\rm obs}$| for each of the Fe lines, where the results for Fe i and Fe ii lines are separately displayed in the left- and right-hand panels, respectively. Each set consists of the 3D representation of the σ(x, ve) surface (upper panel) and the contours of σ on the x–ve plane (lower panel). The trace of trough bottom (connection of x* values at the minimum σ for each given ve; cf. Table 4) is indicated by the dashed line in the contour plot.
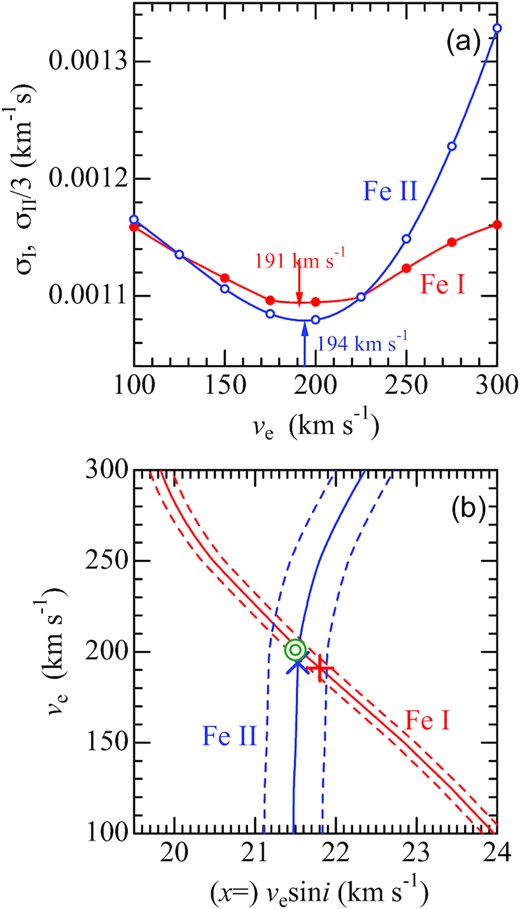
(a) σ versus ve relation along the trough bottom for Fe i (filled symbols) and Fe ii (open symbols); in each case, the position of minimum σ (evaluated by interpolation) is indicated by an arrow. Note that σII (σ for Fe ii) is reduced by a factor of 1/3 in this figure. (b) The traces of trough bottoms for Fe i and Fe ii (dashed lines in the contour panels of Fig. 7) are plotted together in the ve versus x plane by solid lines (the intersection is shown by the double circle), while the dashed lines indicate the error bars involved in x (±0.14 km s−1 for Fe i and ±0.36 km s−1 for Fe ii). The minimum positions of σI and σII are also indicated by Greek cross (+) and St. Andrew’s cross (×), respectively.
Behaviours of σ trough for Fe i and Fe ii lines.
| Model | ve | |$x^{*}_{\rm I}$| | |$x^{*}_{\rm II}$| | |$\sigma ^{*}_{\rm I}$| | |$\sigma ^{*}_{\rm II}$| |
|---|---|---|---|---|---|
| number | (km s−1) | (km s−1) | (km s−1) | (km−1 s) | (km−1 s) |
| 1 | 100 | 23.9601 | 21.4741 | 0.0011587 | 0.0034953 |
| 2 | 125 | 23.4263 | 21.4789 | 0.0011351 | 0.0034061 |
| 3 | 150 | 22.8475 | 21.5036 | 0.0011152 | 0.0033180 |
| 4 | 175 | 22.2098 | 21.5175 | 0.0010961 | 0.0032541 |
| 5 | 200 | 21.5720 | 21.5339 | 0.0010948 | 0.0032388 |
| 6 | 225 | 21.0187 | 21.6385 | 0.0010991 | 0.0032970 |
| 7 | 250 | 20.4830 | 21.7954 | 0.0011235 | 0.0034459 |
| 8 | 275 | 20.0921 | 22.0538 | 0.0011457 | 0.0036829 |
| 9 | 300 | 19.8300 | 22.3655 | 0.0011607 | 0.0039852 |
Note. These data show the characteristics of the trough in the σ(x, ve) surface (x ≡ vesin i) defined by equation (2) for each group of Fe i and Fe ii lines. x* is the x value at the minimum σ(x, ve) for each given ve, and σ* is the corresponding σ(x*, ve). The trace of x* as a function of ve is shown by the dashed line in the contour plot of Fig. 7.
An inspection of Fig. 8 yielded satisfactory results, because three kinds of (x, ve) solutions turned out consistent with each other: (191, 21.8) from the minimum of σI (Fig. 8a), (194, 21.5) from the minimum of σII (Fig. 8a), and (201, 21.5) from the intersection of two trace lines (Fig. 8b).
The uncertainties involved in x* were estimated as ∼0.14 km s−1 (Fe i) and ∼0.36 km s−1 (Fe ii),3 which are indicated by dashed lines in Fig. 8(b). From this figure, errors in ve and x were roughly evaluated (from the size of the parallelogram area embraced by four dashed lines around the intersection) as ∼±15 km s−1 and ∼±0.3 km s−1, respectively.
Consequently, by averaging these three solutions, Vega’s equatorial and projected rotational velocities were concluded as ve = 195(±15) km s−1 and vesin i = 21.6(±0.3) km s−1, which further result in i = 6.4○(±0.5○). Among the 10 models adopted in this study (cf. Table 3), model 5 (ve = 200 km s−1) is the most preferable model; this can be actually confirmed in Fig. 6, where the linear-regression lines defined in Fig. 5(b)–(f) are overplotted (after the ve-dependent difference between x* and 22 has been corrected).
4.2 Comparison with previous results
As mentioned in Section 1, although the considerably large differences of Vega’s ve amounting to |${\gtrsim}100$| km s−1 seen in the literature of early time were reduced in the more recent results (most of them were published within several years around 2010), they are still diversified ranging from ∼170 to ∼230 km s−1. Interestingly, the ve value (∼200 km s−1) derived in this study is almost in-between this dispersion. It may be worth briefly reviewing these literature ve values (published since Paper I; cf. Table 1) in comparison with the consequence of this investigation.
Line profile method:
Paper I’s result (175 km s−1) based on the conventional profile fitting has been revised upwards by ∼+20 km s−1 in this reinvestigation by applying the Fourier transform method to line profiles. While Yoon et al. (2010)’s 236 km s−1 is somewhat too large, Hill, Gulliver & Adelman (2010)’s 211 km s−1 is in tolerable agreement as compared with the present result.
Interferometry method:
Monnier et al. (2012)’s conclusion of ve = 197 km −1 (derived from vesin i and i given in their table 2 as Model 3) based on optical interferometry is in good agreement with this study. Actually, fig. 2 of Monnier et al. (2012) shows that their Model 3 matches well with model 5 (ve = 200 km s−1) of Paper I.
Magnetic modulation method:
Vega’s rotational period (P) was directly determined by way of detecting the magnetic modulation based on time-sequence data of spectropolarimetric observations: 0.732 d (Petit et al. 2010), 0.678 d (Alina et al. 2012), 0.623 d (Butkovskaya 2014), and 0.678 d (Böhm et al. 2015). Among these four, it is the P-value of 0.678 d derived by both Alina et al. and Böhm et al. that is most consistent with the ve result (195 km s−1) of this investigation, which corresponds to P = 2πRe/ve = 0.685 d (where Re = 2.784 R⊙ for model 5 is adopted).
4.3 Advantage of Fourier analysis
Finally, some comments may be in order regarding the superiority of exploiting the zero frequency (q1) measured from the Fourier transform of line profiles in comparison with the ordinary profile fitting approach in the wavelength domain.
The distinct merit of using q1 is that it can discern very subtle differences in the profile shape. Fig. 4 provides a good demonstrative example. While the profile of Fe i 5133.681 undergoes a comparatively easy-to-detect change with an increase in ve (Fig. 4a), that of Fe ii 4951.584 is apparently inert (Fig. 4b), which means that getting information on ve from the profile of the latter is more difficult (this is the reason why Fe ii lines could not be used for determining ve in Paper I). However, the situation is different in the Fourier space, where the shift of q1 (reflecting the change of line profile) is sufficiently detectable with almost the same order of magnitude for both cases (cf. Figs 4e and f). Accordingly, Fe i as well as Fe ii lines are equally usable for ve determination if q1 is invoked, as done in this study.
Besides, q1 is precisely measurable and easy to handle as a single parameter, which is a definite advantage from a practical point of view. Actually, q1 data of many lines can be so combined as to improve the precision of ve (while statistically estimating its error) as done in this paper. Such a treatment would be difficult in the conventional approach of fitting the observed and theoretical profiles.
4.4 Line profile classification using q1 and K
Another distinct merit of q1 is that it provides us with a prospect for quantitative classification of spectral line shapes founded on a physically clear basis. Since the discovery around ∼1990 that a number of spectral lines in Vega (e.g. weak lines of neutral species) show unusual profiles of square form, there has been a tendency to pay attention to this specific line group (e.g. compilation of flat-bottomed lines in Vega by Monier et al. 2017). However, the actual situation of Vega’s spectral lines in general is not so simple as to be dichotomized into two categories of normal and peculiar profiles; as a matter of fact, the individual profiles of most lines should more or less have anomalies of different degree. Unfortunately, the detection of such details has been hardly possible so far, because the judgement of profile peculiarity was done by simple eye inspection due to the lack of effective scheme for describing/measuring the delicate characteristics of line profiles.
The first zero frequency (q1) is just what is needed in this context, which is not only sensitive to a slight difference of line shape but also easily measurable in the Fourier space. Moreover, thanks to its close relationship with K, the behaviour of q1 (representing the line shape characteristics) can be reasonably explained in terms of the underlying physical mechanism. We now have a unified understanding as to why different spectral lines exhibit diversified profiles in Vega, as summarised below.
It is the parameter K (temperature sensitivity) that essentially determines the observed line shape. The contribution to the important shoulder part of the profile away from the line centre (|$|\Delta \lambda | \lesssim \lambda v_{\rm e}\sin i / c$|) is mainly made by the light coming from near to the gravity-darkened limb of lowered T. Accordingly, lines of K < 0, K ∼ 0, and K > 0 show boxy (U-shaped), normally round (like classical rotational broadening), and rather peaked (V-shaped) profiles, each of which results in appreciably different q1 values. For example, in Fig. 4, these three groups correspond to those of lower q1 (∼0.025 km−1s), medium q1 (∼0.03 km−1s), and higher q1 (∼0.035 km−1s), respectively.
The peculiarity degree of the line shape (i.e. departure from the classical rotationally broadened profile) is described by K, because |$(q_{1} - q_{1}^{\rm classical}) \propto K$| (|$q_{1}^{\rm classical} \simeq 0.03$| km−1s) and the gradient (>0) of this relation progressively increases with ve, as manifested in Fig. 5. As such, the profile of any line in Vega can be reasonably predicted if K and ve are specified.
As explained in appendix A of Paper II, the value of K for each spectral line depends on χlow (lower excitation potential) and W (equivalent width). It is important to note that the line strength affects K in the sense that |K| tends to decrease with an increase in W (i.e. as the line becomes more saturated), which means that chemical abundances are implicitly involved. In the present case of A-type stars, K values for Fe i lines are determined mainly by W, while those for Fe ii lines are determined primarily by χlow (cf. fig. A1 in Paper II), which are also indicated from Figs 2(c) and (d).
These behaviours of K in terms of the line parameters reasonably explain why different spectral lines of Vega reveal various characteristic shapes. For example: (1) Flat-bottom profiles (manifestation of K < 0) are seen in Fe i lines but not in Fe ii lines, because of the distinct difference in K between these two line groups; i.e. |$-20 \lesssim$| K(Fe i) |$\lesssim -10$| and |$-5 \lesssim K$|(Fe ii) |$\lesssim +5$|. (2) The reason why typical flat-bottomed shape is observed mainly in weak Fe i lines (e.g. 4707.272, 4903.308 with W of several mÅ) but not clearly in moderate-strength Fe i lines (e.g. 4202.028, 4920.502 with W of a few tens mÅ) is that the (negative) K values of the former group are generally lower than those of the latter owing to the dependence on W. (3) Regarding Fe ii lines, some lines have clearly peaked V-shape (e.g. Fe ii 5004.195 with χlow = 10.272 eV and K = +2.92) while others exhibit rather rounded profile (e.g. Fe ii 4993.358 with χlow = 2.807 eV and K = −6.27), which is naturally attributed to the apparent distinction of K (the sign is inversed) due to the large difference in χlow.
5 SUMMARY AND CONCLUSION
It is known that the sharp-line star Vega (vesin i ∼ 20 km s−1) is actually a rapid rotator seen nearly pole-on with low |$i\, ({\lt}10^{\circ })$|. However, its intrinsic rotational velocity is still in dispute, for which rather diversified values have been published.
In the previous studies (including Paper I by the author’s group), analysis of spectral line profiles has been often invoked for this purpose, which contain information on ve via the gravity darkening effect, However, it is not necessarily easy to reliably determine ve by direct comparison of observed and theoretically simulated line profiles. Besides, this approach is not methodologically effective because it lacks the scope for combining many lines in establishing the solution.
Recently, the author applied in Paper II the Fourier analysis to the profiles of many Fe i and Fe ii lines of Sirius A and estimated its ve by making use of the first zero (q1) of the Fourier transform, which turned out successful. Therefore, the same approach was decided to adopt in this study to revisit the task of establishing ve of Vega.
As to the observational data, the same high-dispersion spectra of Vega as adopted in Paper I were used. From the Fourier transforms computed from the profiles of selected 49 Fe i and 41 Fe ii lines, the corresponding zero frequencies were measured for the analysis. The K values (T-sensitivity parameter) of these Fe lines are in the range of |$-20 \lesssim K \lesssim -10$| (Fe i lines) and |$-5 \lesssim K \lesssim +5$| (Fe ii lines).
Regarding the gravity-darkened models of rotating Vega, the model grid (comprising 10 models) arranged in Paper I was adopted, which cover the ve range of 100–300 km s−1 while assuming vesin i = 22 km s−1 as fixed. The theoretical profiles of 90 lines were simulated for each model, from which Fourier zero frequencies were further evaluated.
An inspection of these |$q_{1}^{\rm cal}$| values for the simulated profiles revealed an increasing tendency with K and the slope of this trend becomes steeper towards larger ve, which suggests that ve is determinable by comparing |$q_{1}^{\rm cal}\,(K,v_{\rm e})$| with observed |$q_{1}^{\rm obs}$| for many lines of different K.
It turned out that ve and vesin i could be separately established by the requirement that the standard deviation of the residual between |$q_{1}^{\rm cal}$| and |$q_{1}^{\rm obs}$| be minimized (while taking into account the difference between the actual vesin i and 22 km s−1 assumed in the model profiles), and independent analysis applied to two sets of Fe i and Fe ii lines yielded solutions consistent with each other.
The final parameters of Vega’s rotation were concluded to be vesin i = 21.6(±0.3) km s−1, ve = 195(±15) km s−1, and i = 6.4(±0.5)○.
SUPPORTING INFORMATION
suppl_data
Please note: Oxford University Press is not responsible for the content or functionality of any supporting materials supplied by the authors. Any queries (other than missing material) should be directed to the corresponding author for the article.
ACKNOWLEDGEMENTS
This research has made use of the SIMBAD data base, operated by CDS, Strasbourg, France.
DATA AVAILABILITY
The data underlying this article are available in the supplementary materials.
Footnotes
Since the selection criterion adopted in this study differs from that of Paper I, the resulting line set is somewhat different. More precisely, out of 60/52 Fe i/Fe ii lines analysed in Paper I, 17/16 were discarded, while 6/5 were newly included.
Although Astd was simply used in Paper II for all models irrespective of ve, it did not cause any serious problem because ve-dependent gravity darkening effect was not so large as to cause a significant Wcal versus Wobs discrepancy in the ve range (≤150 km s−1) inspected therein.
This estimation is based on the relation δx/x ∼ δq1/q1, where |$\delta q_{1} \sim \sigma /\sqrt{N}$|. See section 4.3 in Paper II for more details.
