


ABSTRACT
Swift J1818.0–1607 discovered in early 2020 is not only the fifth magnetar known with periodic radio pulsations but also the fastest rotating one. Simultaneous 2.25/8.60 GHz observations of Swift J1818.0–1607 were carried out with Shanghai Tian Ma Radio Telescope (TMRT) from MJD 58936 to 59092. The spin-frequency ν and first-order derivative |$\dot{\nu }$| of this magnetar were obtained with piecewise fitting method because of its instable timing properties. We found that the amplitude of short-term |$\dot{\nu }$| fluctuations decreased with time, and the long-term declining trend of ν discovered previously continued in our observations. The best fit long-term |$\dot{\nu }$| were about |$-2.25\times 10^{-11} \, \mathrm{s}^{-2}$| using our observation data spanning 156 d. The derived characteristic age was about 522 yr, supporting the recent viewpoint that this magnetar may be older than initially thought shortly after its discovery. The flux density of this magnetar was increased at both 2.25 and 8.60 GHz during our observations, and its radio spectrum became flatter at the same time. We also detected bright-quiet type emission mode switching in Swift J1818.0–1607.
1 INTRODUCTION
Magnetars are a special class of young neutron stars with extremely strong magnetic fields (1013–1015 G). They sometimes show dramatic variabilities across the electromagnetic spectrum, especially at high-energy band, such as giant flares (Mereghetti 2008). The decay of enormous internal magnetic fields of magnetars is thought to power these emissions, as they are too bright to be powered by the loss of rotational energy or the accretion power (Duncan & Thompson 1992). By the end of 2020, there were 31 magnetars and candidates discovered (Olausen & Kaspi 2014; Coti Zelati et al. 2021).1 Compared with other neutron stars, magnetars generally rotate slower and spin-down faster because of their stronger magnetic braking effects (Tong et al. 2013; Gao, Peng & Wang 2019). Though magnetars show dramatic outbursts at high energy, only 6 magnetars had been detected with radio pulse radiation until the end of 2020 (Olausen & Kaspi 2014).1 Typically, magnetar shows variable integrated profiles on time-scales from hours to days and relatively flat spectra with typical spectral indices (α) greater than −0.8 at radio band (Camilo et al. 2007b; Torne et al. 2015, 2017), which is different from normal pulsars that usually show stable integrated profiles and steeper radio spectra with typical α around −1.6 (Jankowski et al. 2018).
Swift J1818.0–1607 was firstly captured as an X-ray burst by the Swift Burst Alert Telescope on 2020 March 12. It was confirmed to be a magnetar with a spin period (P) of 1.36 s by the follow-up observations of Neutron star Interior Composition Explorer (Enoto et al. 2020), making it the magnetar with the shortest P known so far. Furthermore, it was shown to be the 5th radio magnetar known, as its radio pulsations were detected by Effelsberg telescope (Karuppusamy et al. 2020). Shortly after the X-ray burst, its integrated profile could only be detected below 8.0 GHz, though high-frequency observations were arranged (Champion et al. 2020a; Lower et al. 2020b, c; Majid et al. 2020b; Rajwade et al. 2020; Ridolfi et al. 2020). About 27 d later, it was detected in several high frequencies observations, such as 8.4 GHz (Majid et al. 2020a), 22 GHz (Liu et al. 2020), 31.9 GHz (Pearlman et al. 2020), 86 and 154 GHz (Torne et al. 2020). Its spectrum got flatter with α > −0.97. In most cases, Swift J1818.0–1607 showed integrated profile with single peak. Secondary peak component on the right of main peak was sometimes detected at 3.8 GHz (Lower et al. 2020b), 1.37 and 2.55 GHz (Champion et al. 2020a). Furthermore, Lower et al. (2020a) detected integrated profile with triple peaks at 2.368 GHz using Parkes Ultra-Wideband receiver.
As more timing observation data obtained, it was discovered that its rotation frequency derivative |$\dot{\nu }$| showed drastic fluctuations, though there was a long-term declining trend of ν. Besides the glitch detected in Swift J1818.0–1607 (Champion et al. 2020a; Hu et al. 2020a), it also possibly showed an antiglitch (Hu et al. 2020a).
Long-term simultaneous multifrequency observations are vital for studying changes in radio emission of magnetars in both frequency and time. Simultaneous 2.25/8.60 GHz observations of Swift J1818.0–1607 were arranged at Shanghai Tian Ma Radio Telescope (TMRT) to do further studies on its radiation and rotational properties. Information about observations is provided in Section 2. The data-reduction methods and results are given in Section 3. Finally, further discussions are presented in Section 4.
2 OBSERVATIONS
Simultaneous 2.25/8.60 GHz observations were carried out ranging from MJD 58936 (2020 March 28) to MJD 59092 (2020 August 31) with the TMRT by taking advantage of the parallel working capabilities of the 2.25/8.60 GHz dual-frequency receiver and the digital backend system (DIBAS) which consisted of 3 pairs of analogue-to-digital converters and Roach-2 boards (Yan et al. 2018). The dual-frequency receiver is a cryogenically cooled, dual-polarization receiver with the frequency coverage of 2.20–2.30 and 8.20–9.00 GHz, respectively. The total bandwidth was divided into channels with a width of 1 MHz (at 2.25 GHz) and 2 MHz (at 8.60 GHz) with the DIBAS to remove the dispersion effects and radio-frequency interferences (RFIs; Yan et al. 2015). The incoherent de-dispersion and online-folding observation mode were used in our observations. Each rotation period was divided into 1024 pulse phase bins and folded with 30 s sub-integration length. The observation data were written out as the 8-bit PSRFITS format (Hotan, van Straten & Manchester 2004).
After removing RFIs with the pazi command of the Pulsar Archive analysis software (PSRCHIVE) (Hotan et al. 2004), the data were compressed by scrunching all frequency channels and polarizations together with the pam command.
There was no flux calibrator observations arranged before MJD 59039. By assuming the off-pulse root-mean-square (RMS) noise following radiometer equation, we estimated the peak flux density of Swift J1818.0–1607 based on typical system equivalent flux density (SEFD), and the SEFD of the TMRT is about 46 and 48 Jy at the corresponding frequencies (Yan et al. 2018). Then, the mean flux density was obtained by dividing the integrated flux density from the on-pulse bins by the total number of phase bins. The uncertainty in mean flux density was obtained from off-pulse RMS noise divided by square root of the number of phase bins. (Zhao et al. 2017). For the observations later than MJD 59039, we estimated its flux density with both SEFD method and calibrator 3C 295. According to our calculations, these two methods are in agreement with each other within the error bar.
3 RESULTS
3.1 Evolution of spin frequency and DM
Both the integrated profile and rotational properties of Swift J1818.0–1607 were found to change irregularly during our observations, which makes constructing a phase−coherent timing solution very difficult. Thus, we divided our observations into segments and carried out timing analysis to each of them separately, similar to the strategy presented in previous work such as Levin et al. (2012). The template profiles of 2.25/8.60 GHz were respectively, obtained based on the integrated profile of 2.25/8.60 GHz with typical SNRs >10.28 in the middle of each segment. Then, the time-of-arrivals (ToAs) of pulses were obtained by cross-correlating integrated profiles with the standard template of corresponding frequencies with pat command. Next, we combined the ToA sets from 2.25/8.60 GHz after removing the delay of the receiver system, and carried out timing analysis with TEMPO2 software package (Hobbs, Edwards & Manchester 2006) to measure the spin properties of the magnetar. The length of each segment lasted until there were obvious changes in the integrated profiles or the error of fitted |$\dot{\nu }$| exceeded 2.70 × 10⁻¹² |$\rm s^{-2}$| which was about 10 per cent of mean |$\dot{\nu }$| (Champion et al. 2020a). In Table 1, two adjacent segments are distinguished with different background colours. The top three panels of Fig. 1 show the fitted ν, |$\dot{\nu }$|, and DM changing with the time along with some previous published results (Borghese et al. 2020; Champion et al. 2020a, b; Enoto et al. 2020; Hu et al. 2020b; Joshi & Bagchi 2020; Lower et al. 2020b, c; Lower & Shannon 2020; Rajwade et al. 2020; Ridolfi et al. 2020). The data points from Champion et al. (2020a)’s work were captured from the published plots with the open-source software engauge digitizer.2
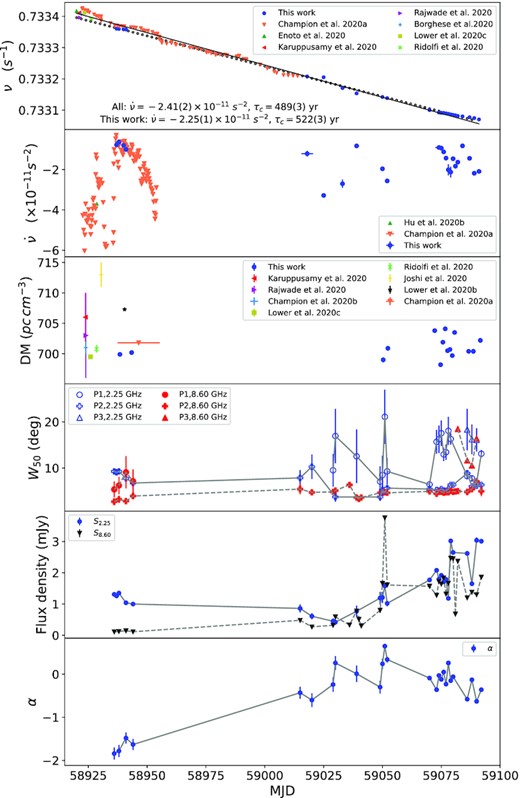
The plots about ν, |$\dot{\nu }$|, DM, W50, S2.25, S8.60, and α of Swift J1818.0–1607 changing with the time. The best fit long-term ν for our observation data and all observation data are shown with solid and dot line, respectively, in top panel.
Parameters of Swift J1818.0–1607 observations.
| MJDa | Length | |$S_{\rm 2.25}/S_{\rm 8.60}^b$| | αc | Shaped |
|---|---|---|---|---|
| – | (h) | (mJy) | – | – |
| 58936.80 | 5.7 | 1.31 ± 0.07/0.11 ± 0.02 | −1.84 ± 0.14 | S/T |
| 58937.79 | 6.0 | 1.26 ± 0.06/receiver fault | – | S/- |
| 58938.79 | 6.0 | 1.35 ± 0.07/0.12 ± 0.02 | −1.78 ± 0.14 | S/T |
| 58941.79 | 4.7 | 1.04 ± 0.06/0.14 ± 0.02 | −1.48 ± 0.13 | S/T |
| 58944.79 | 5.3 | 1.00 ± 0.06/0.11 ± 0.02 | −1.63 ± 0.13 | S/T |
| 59015.66 | 0.8 | 0.86 ± 0.13/0.48 ± 0.06 | −0.43 ± 0.14 | S/S |
| 59020.53 | 1.9 | 0.61 ± 0.10/0.27 ± 0.04 | −0.60 ± 0.16 | S/S |
| 59029.52 | 2.0 | 0.45 ± 0.09/0.32 ± 0.03 | −0.24 ± 0.17 | D/S |
| 59030.49 | 2.0 | 0.42 ± 0.09/0.59 ± 0.03 | +0.26 ± 0.16 | D/S |
| 59036.47 | 1.0 | Receiver fault/0.33 ± 0.05 | – | −/S |
| 59039.48 | 0.5 | 0.77 ± 0.18/0.78 ± 0.07 | +0.01 ± 0.19 | D/S |
| 59040.47 | 0.5 | Receiver fault/0.51 ± 0.09 | – | −/S |
| 59041.45 | 0.5 | Receiver fault/0.30 ± 0.07 | – | −/S |
| 59049.49 | 0.5 | 1.19 ± 0.21/0.80 ± 0.08 | −0.30 ± 0.15 | D/S |
| 59050.50 | 0.4 | 1.21 ± 0.18/1.66 ± 0.07 | +0.24 ± 0.12 | D/S |
| 59051.47 | 2.0 | 1.58 ± 0.09/3.76 ± 0.03 | +0.65 ± 0.05 | D/S |
| 59052.47 | 2.0 | 1.02 ± 0.09/1.61 ± 0.03 | +0.34 ± 0.07 | D/S |
| 59070.49 | 4.1 | 1.77 ± 0.07/1.57 ± 0.02 | −0.09 ± 0.03 | D/S |
| 59073.48 | 5.6 | 2.08 ± 0.06/1.28 ± 0.02 | −0.36 ± 0.02 | D/S |
| 59074.45 | 6.0 | 1.80 ± 0.07/1.72 ± 0.02 | −0.03 ± 0.03 | D/S |
| 59075.44 | 5.9 | 1.92 ± 0.06/1.64 ± 0.02 | −0.12 ± 0.02 | D/S |
| 59076.42 | 6.0 | 1.71 ± 0.06/1.84 ± 0.02 | +0.05 ± 0.03 | D/S |
| 59077.45 | 5.9 | 1.79 ± 0.06/1.32 ± 0.02 | −0.23 ± 0.03 | D/S |
| 59078.45 | 5.8 | 1.18 ± 0.06/1.67 ± 0.02 | +0.26 ± 0.04 | D/S |
| 59079.44 | 5.9 | 3.02 ± 0.06/2.47 ± 0.02 | −0.15 ± 0.01 | D/S |
| 59080.40 | 6.0 | 2.65 ± 0.05/2.45 ± 0.02 | −0.06 ± 0.02 | D/S |
| 59081.43 | 3.9 | Receiver fault/0.68 ± 0.02 | – | −/S |
| 59082.42 | 4.3 | Receiver fault/2.37 ± 0.02 | – | −/D |
| 59086.48 | 3.4 | 2.62 ± 0.07/1.20 ± 0.02 | −0.58 ± 0.02 | D/D |
| 59088.40 | 4.5 | 1.65 ± 0.06/1.38 ± 0.02 | −0.13 ± 0.03 | D/D |
| 59090.53 | 2.2 | 3.04 ± 0.09/1.30 ± 0.03 | −0.63 ± 0.03 | T/D |
| 59092.47 | 3.5 | 3.01 ± 0.07/1.86 ± 0.03 | −0.36 ± 0.02 | D/D |
Start time.
Mean flux density at 2.25/8.60 GHz.
Spectral index.
Integrated profile morphology: single (S), double (D), and triple (T) peaks.
It is clear that the long-term decline trend of ν previously reported by Champion et al. (2020a) and Hu et al. (2020a) went on in our observations, though |$\dot{\nu }$| still changes erratically on short time-scale. We did a linear fit to the ν measurements with the least-square method base on only ours and all observation results shown in the top panel of Fig. 1. The best-fitted |$\dot{\nu }$| was about |$-2.25(1)\times 10^{-11}$| and |$-2.41(2)\times 10^{-11} \, \mathrm{s}^{-2}$|, respectively. Champion et al. (2020a) also reported a similar fitted |$\dot{\nu }$| of |$-2.37\times 10^{-11} \, \mathrm{s}^{-2}$| using the data spanning nearly 100 d. Combined with all observations, the |$\dot{\nu }$| showed continuous oscillations instead of random variations after the discovery burst. It also was noticed that the amplitude of the oscillation seems to decrease in time. The DM values obtained with TMRT are consistent with previous values. The DM range is between 699 and 705 |$\mathrm{ pc}\mathrm{ cm}^{-3}$| except for three observations before MJD 59040 (Joshi & Bagchi 2020; Karuppusamy et al. 2020; Lower et al. 2020b).
3.2 Integrated profiles
Integrated profiles of pulsars provide important information of the structure of the radiation beam. With updated ephemeris, the integrated profiles for each epoch of 2.25/8.60 GHz observations were obtained and showed chronologically in Fig. 2. For easier comparison, they are normalized, aligned with respect to the peak of the profile and centred at the zero rotation phase. Three phase areas that are usually giving out radiation are labelled with P1, P2, and P3 from left to right. From the plots in Fig. 2, we can see that the integrated profiles of Swift J1818.0–1607 can keep stable in several days at both 2.25 and 8.60 GHz. The integrated profile morphology in each epoch of our observations is also listed in the last column of Table 1. In most cases, its integrated profile showed single peak structure at 8.60 GHz, whereas it usually showed dual-peak structure at 2.25 GHz. It is noticed that the integrated profile shapes at 2.25/8.60 GHz only showed synchronized changes during MJD 59086–59092 on the P3 component. We fitted three Gaussian components to each profile to obtain the width at 50 per cent of peak (W50) of each component. The curves showing how W50 of each component changed with the time are shown in the fourth panel of Fig. 1. The W50 of P2 at 8.60 GHz is generally narrower than that at 2.25 GHz except on MJDs from 59030 to 59051. Normally, the W50 of two other components is wider than the W50 of P2 both at 2.25 and 8.60 GHz.
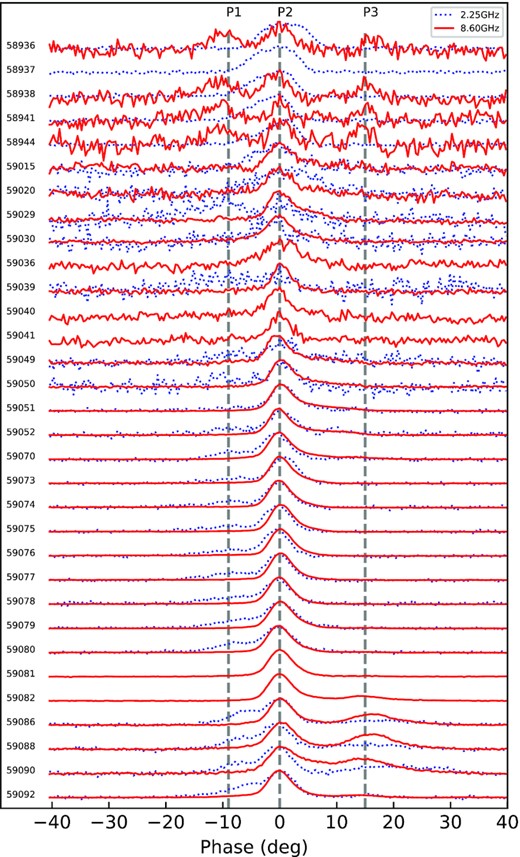
Normalized integrated profiles for Swift J1818.0–1607 obtained at 2.25 (blue dotted line) and 8.60 GHz (red solid line). The typical peaks of integrated profiles are connected with vertical grey dotted lines.
3.3 Flux densities and spectral index
The estimated flux density at 2.25/8.60 GHz (S2.25 and S8.60) is appended in the 3rd column of Table 1 and also shown in 5th panel of Fig. 1. Though S2.25 decreased before MJD 58944 shortly after discovery X-ray burst, there was a steady rising trend in both S2.25 and S8.60 after MJD 59036. For each epoch, we fitted a power-low model (Sν ∝ να) to the measured flux densities, and showed the spectral index α in the 4th column of Table 1 and also gave related plots in the bottom panel of Fig. 1. It can be seen that magnetar changed from steep spectrum with α < −1.48 (MJD 58936–58944) to flat spectrum with α > −0.63 (MJD 59015–59092). Our α results are consistent with previous values obtained below 32 GHz (Liu et al. 2020 Majid et al. 2020a, b; Pearlman et al. 2020). Compared the α = +0.5 obtained by us on MJD 59076, Torne et al. (2020) reported α = −1.4 with observations from 86 to 154 GHz on same day. So, we guess there should be at least a spectra turnover at high frequency.
3.4 Mode switching
Besides mild changes, Swift J1818.0–1607 showed obvious short time-scale flux density variations on MJDs 59039, 59050, and 59051. It seems to switch between quasi-stable bright (B) and quiet (Q) radiation state. Diagnostic plots for its B–Q radiation state are shown in Fig. 3 along with relating plots for its normal radiation state. By comparison, it is a little easier to judge whether it is a mode switching or not using data from MJD 59051 than the other two data because of its relatively higher average flux density. Subfigure (a) of Fig. 3 shows the flux density changes at 2.25 and 8.60 GHz on MJD 59051 with the ‘hot’ and ‘jet’ style phase-time plots, respectively. Its mean flux density changes with the time are shown in the subpanel above each waterfall plot with the black solid curve. To avoid being contaminated by adjacent data of different states, a typically B and Q state that lasted relatively longer were selected and labelled with red dash and green solid square, respectively. The black dashed line in the same panel stands for 10 per cent of the average flux of B state labelled with the red dash square. It can be seen that this magnetar switched between B and Q state synchronously at 2.25/8.60 GHz. The integrated profiles obtained the Q state data in green solid squares with same colour are shown in right subpanels. Meanwhile, the integrated profiles of its B state obtained same style curve data in the red dash squares are shown with the red line in the right subpanel of Fig. 3. We can see the difference in shapes of red and green integrated profiles, especially for 8.60-GHz observation. In Q state, its integrated profile manifested as an additional bump trailing the main peak at 8.60 GHz, but the bump vanished in B state. Furthermore, it can be clearly seen in subfigure (c) of Fig. 3 flux density distribution for 8.60-GHz observation on MJD 59051 shows a double-peak structure. Therefore, we think the magnetar exhibited mode switching on MJD 59051.
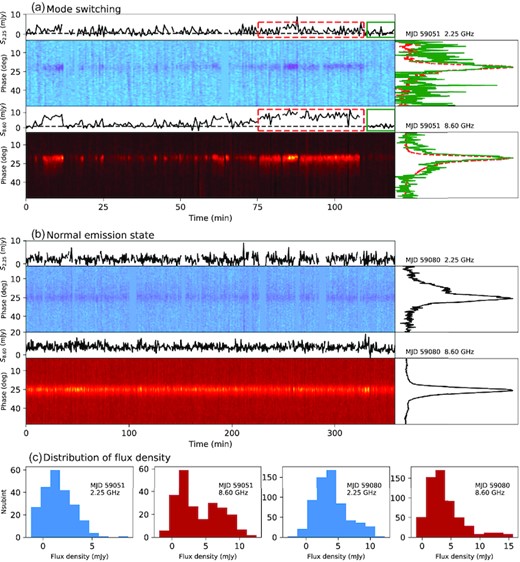
Plots for mode switching of Swift J1818.0–1607 on MJD 59051 and normal emission state on MJD 59080: phase-time waterfall plots (‘jet’ for 2.25 GHz; ‘hot’ for 8.60 GHz); mean flux density change with time (above subpanel of subfigure a and b); integrated profiles (right subpanel of subfigure a and b); histograms of mean flux density distribution (subfigure c). Plots for mode switching on MJD 59039 and 59050 are given in supporting material and available online.
4 DISCUSSIONS
Swift J1818.0–1607 showed irregular timing properties. As shown in the second panel of Fig. 1, it seems that the |$\dot{\nu }$| of Swift J1818.0–1607 oscillated but not a stochastic process. The amplitude of |$\dot{\nu }$| oscillations seemed to get smaller as time went. Similar timing phenomena were observed in the magnetar 1E 1048.1–5937 and 17 ordinary pulsars but with time-scales of years (Lyne et al. 2010; Archibald et al. 2020). These |$\dot{\nu }$| fluctuations may be caused by certain types of unstable torque that may be affected by stronger magnetic braking (Camilo et al. 2007a; Levin et al. 2012; Tong & Xu 2013).
Assuming an idealized magnetic dipole model in a vacuum (braking index n = 3) and much faster spin at birth, its characteristic age τc was initially reported as 265, 310, and 240 yr (Champion et al. 2020b; Esposito et al. 2020; Hu et al. 2020b), making it be the youngest magnetar known. The |$\dot{\nu }$| of Swift J1818.0–1607 fluctuated more than 12 times from MJD 58930 to 58940 (Champion et al. 2020a). Though the |$\dot{\nu }$| showed obvious fluctuations in short time-scale, there was obvious linear decrease trend of ν in long time-scale. Using much longer observation data spanning about 100 d, Hu et al. (2020a) and Champion et al. (2020a) fitted the average |$\dot{\nu }$| then got relatively older τc age of 470 and 500 yr, respectively. We found the long-term linear decrease of ν went on in our observations. Base on the best-fitted |$\dot{\nu }$| obtained with only ours and all the data in Fig. 1, the τc inferred with the above assumptions should be 522 and 489 yr, respectively. So, the τc of Swift J1818.0–1607 is not as young as 300 yr.
Normally, radio-loud magnetars show a flat spectrum typically with α > −0.8 (Eatough et al. 2013; Torne et al. 2017). In our observations of Swift J1818.0–1607, there was a long-term flux density increase trend at both 2.25 and 8.60 GHz. The α changed from less than −1.48 to greater than −0.63 as time went on. Judging from plots in Fig. 1, we think its steep spectrum that lasted tens of days was the main reason for no successful detection of integrated profile above 8.0 GHz (Gajjar et al. 2020; Majid et al. 2020a; Lower & Shannon 2020). The steep radio spectrum was temporarily detected on some magnetars in time-scale of several hours (Lazaridis et al. 2008; Pearlman, Majid & Prince 2019). A steep magnetar radio spectrum that lasted for tens of days has so far only been observed in J1745–2900, soon after its early outburst (Pennucci et al. 2015).
Magnetars usually change their integrated profile shapes dramatically on time-scales from hours to days (Pennucci et al. 2015). Besides integrated profile with single-peak and dual-peak structure usually detected at frequencies from 0.8 to 154 GHz, we also detected triple-peaked structure at 2.25 GHz near MJD 59087 as Parkes (Lower et al. 2020a). Though two new components showed at 8.60 GHz, they were not seen at 2.25 GHz from MJD 58936 to 58944 in our observations. Hankins, Jones & Eilek (2015) also detected phenomena in which new component dominated profile at high frequency in the Crab Pulsar.
Lower et al. (2020a) reported two types of mode switching of Swift J1818.0–1607 at 0.7–4.0 GHz. Swift J1818.0–1607 was quasi-periodically switching between B mode and Q mode on MJD 59009, and varying between two longitudinally distinct modes (P and M mode) on MJD 59047. Swift J1818.0–1607 switched between B mode and Q mode synchronously at 2.25/8.60 GHz in 3 d of our observation. Though the mode switching detected by us took place only 3 d later than ‘P–M’ mode switching on MJD 59047, its flux density fluctuation was more similar to ‘B–Q’ mode switching on MJD 59009. But, the right bump of integrated profile appeared in the Q mode of our observation at 8.60 GHz was not so strong as Lower et al. (2020a)’s result in which it was brighter than the left peak component.
SUPPORTING INFORMATION
Figure S3. Plots for mode switching of Swift J1818.0–1607 on MJD 59039 and 59050.
Please note: Oxford University Press is not responsible for the content or functionality of any supporting materials supplied by the authors. Any queries (other than missing material) should be directed to the corresponding author for the article.
ACKNOWLEDGEMENTS
This work was supported in part by the Natural Science Foundation of Shanghai (Grant No. 20ZR1467600), National Natural Science Foundation of China (Grant Nos. U2031119, U1631122, and11633007), Strategic Priority Research Program of the CAS (XDB23010200), National Key R&D Program of China (2018YFA0404602) and the Foundation of Guizhou Provincial Education Department (No.KY(2020)003).
DATA AVAILABILITY
The data underlying this article will be shared on reasonable request to the corresponding author.
