


ABSTRACT
We report here results of the analysis of correlated flux variations between the optical and GeV γ-ray bands in three bright BL Lac objects, namely AO 0235+164, OJ 287, and PKS 2155−304. This was based on the analysis of about 10 yr of data from the Fermi Gamma-ray Space Telescope covering the period between 2008 August 8 and 2018 August 8 along with optical data covering the same period. For all the sources, during the flares analysed in this work, the optical and γ-ray flux variations are found to be closely correlated. From broad-band spectral energy distribution modelling of different epochs in these sources using the one-zone leptonic emission model, we found that the optical–ultraviolet emission is dominated by synchrotron emission from the jet. The γ-ray emission in the low synchrotron peaked sources AO 0235+164 and OJ 287 is found to be well fitted with external Compton (EC) component, while the γ-ray emission in the high synchrotron peaked source PKS 2155−304 is well fitted with synchrotron self-Compton component. Further, we note that the γ-ray emission during the high-flux state of AO 0235+164 (epochs A and B) requires seed photons from both the dusty torus and broad-line region, while the γ-ray emission in OJ 287 and during epochs C and D of AO 0235+164 can be modelled by EC scattering of infrared photons from the torus.
1 INTRODUCTION
Blazars, a class of active galactic nuclei (AGNs) and one of the most luminous objects (1042–1048 erg s−1) in the extragalactic γ-ray sky, are believed to be powered by accretion of matter on to supermassive black holes with masses between ∼108 and 1010 M⊙ situated at the centres of galaxies (Lynden-Bell 1969; Shakura & Sunyaev 1973). They constitute about two-thirds of the point sources in the 8-yr Fermi catalogue (Abdollahi et al. 2020). These objects have relativistic jets pointed close (within a few degrees) to the observer. Non-thermal emission dominates the radiation from these sources (Antonucci 1993; Urry & Padovani 1995) and spans the entire electromagnetic spectrum from low-energy radio to high-energy γ-rays. One of the defining characteristics of blazars is that they show rapid flux variations over the complete accessible electromagnetic spectrum on a wide range of time-scales from minutes to years. In addition to flux variability, they are strongly polarized and also show polarization variations (Kinman, Lamla & Wirtanen 1966; Angel & Stockman 1980; Andruchow, Romero & Cellone 2005; Rakshit et al. 2017). They have a compact radio structure often with core jet morphology and flat radio spectra and also show superluminal motion (Wagner & Witzel 1995; Ulrich, Maraschi & Urry 1997; Falomo, Pian & Treves 2014; Madejski & Sikora 2016). Traditionally, blazars are divided into two classes, namely flat-spectrum radio quasars (FSRQs) and BL Lac objects (BL Lacs). This classification is based on the presence or absence of emission lines in their optical/infrared (IR) spectra with FSRQs having strong emission lines and BL Lacs either having no or weak emission lines with equivalent widths <5 Å (Urry & Padovani 1995). A physical distinction between FSRQs and BL Lacs has been proposed by Ghisellini et al. (2011) according to which the ratio of the luminosity of the broad-line region (BLR; LBLR) to the Eddington luminosity (LEdd) is >5 × 10⁻⁵ in the case of FSRQs.
The spectral energy distribution (SED) of blazars in the log νFν versus log ν representation has two dominant humps: the low-energy hump peaks in the ultraviolet (UV)/optical wavelengths and the high-energy hump peaks in the γ-ray (Fossati et al. 1998; Mao et al. 2016) wavelengths. The low-energy component in the broad-band SED of blazars is well understood and it is attributed to synchrotron emission due to relativistic electrons moving in the magnetic field of the jet. However, the nature of the high-energy emission from the jets of blazars is still debated. A likely process is inverse Compton (IC) scattering of low-energy photons (Abdo et al. 2010); these seed photons can be photons from the jet [synchrotron self-Compton (SSC); Konigl 1981; Marscher & Gear 1985; Ghisellini & Maraschi 1989] or photons external to the jet such as the BLR (Ghisellini & Madau 1996), torus (Błażejowski et al. 2000; Ghisellini & Tavecchio 2008), and the accretion disc (Boettcher, Mause & Schlickeiser 1997). The other possible mechanisms for the high-energy emission in blazars are hadronic processes (Böttcher et al. 2013), which include proton synchrotron (Aharonian 2000) or photon–pion processes (Mannheim 1993). Based on the position of the peak frequency (νp) of the synchrotron emission in their broad-band SED (Padovani & Giommi 1995; Abdo et al. 2010), blazars are subdivided into low synchrotron peaked (LSP) blazars (νp < 1014 Hz), intermediate synchrotron peaked (ISP) blazars (|$10^{14}\,\mathrm{Hz} \lt \nu _\mathrm{ p} \lt 10^{15}\, \mathrm{Hz}$|), and high synchrotron peaked (HSP) blazars (|$\nu _\mathrm{ p} \gt 10^{15}\, \mathrm{Hz}$|). One of the approaches to understand the physical processes that contribute to the observed emission over a wide range of wavelengths and constrain the leptonic versus hadronic emission process in blazars is by detailed broad-band SED modelling. Nevertheless, such studies are highly sensitive to the adopted models and the capability to acquire simultaneous observations covering a broad range of wavelengths. Also, often the observed SED of blazars can be modelled satisfactorily by leptonic (Paliya, Sahayanathan & Stalin 2015), hadronic (Böttcher et al. 2013), and lepto-hadronic models (Paliya et al. 2016).
An alternative to this SED modelling approach is via correlated studies of flux variations between low-energy (optical) and high-energy (γ-ray) bands. In the leptonic scenario of emission from blazar jets, close correlation between the flux variations in the low-energy optical and high-energy γ-ray bands is expected (Böttcher 2007). In the hadronic model of emission from blazar jets, as the optical emission is dominated by electron synchrotron from jets and the γ-ray emission from proton synchrotron, a correlation between optical and GeV γ-rays need not be expected (Mücke & Protheroe 2001). Therefore, by a systematic investigation of the correlation between the optical and GeV γ-ray flux variations, one can put constraints on the leptonic versus hadronic emission from blazar jets. Studies available in the literature have found (i) close correlation between optical and γ-ray flares (Bonning et al. 2009), (ii) optical flares without the corresponding γ-ray flares (Chatterjee et al. 2013; Cohen et al. 2014), and (iii) γ-ray flares without optical counterparts (Dutka et al. 2013; MacDonald et al. 2015). To look for the prevalence of anomalous variations between the optical and GeV γ-rays, we have carried out a systematic investigation of the γ-ray and optical flux variations in blazars. Results on the FSRQ category of blazars were reported by Rajput et al. (2019) and Rajput, Stalin & Sahayanathan (2020). We present here the results of the BL Lac category of blazars. Details on the selection of the objects are given in Section 2. In Section 3, we give the details of the data used in this work, and the analysis is discussed in Section 4 followed by the results in Section 5. We summarize our findings in Section 6.
2 SAMPLE
The selection of BL Lacs for the analysis of correlated variations between the optical and GeV bands was done in the same manner as it was carried out for FSRQs (Rajput et al. 2020) and we describe them in brief below. First, we selected all the sources classified as BL Lacs in the third catalogue of AGNs detected by the Large Area Telescope (LAT) onboard the Fermi Gamma Ray Space Telescope, hereinafter Fermi (3LAC; Ackermann et al. 2015). For the selected BL Lacs, we looked into their 1-d binned γ-ray light curves for the period of 10 yr and then we selected those sources that have atleast one flare in the γ-ray band with the γ-ray flux exceeding 10−6 photons cm−2 s−1. With this criterion, we arrived at a sample of 21 BL Lacs. As the motivation of this work is to look for any correlation between optical and GeV flux variations, for those 21 BL Lacs, we looked into the archives of the Small and Moderate Aperture Research Telescope System1 (SMARTS; Bonning et al. 2009) for the availability of optical and IR data overlapping the γ-ray data. Of the 21 sources, for 6 objects we found optical and IR data overlapping with the γ-ray light curves. Thus, our sample of BL Lacs with overlapping optical, IR, and γ-ray light curves consists of six sources, namely AO 0235+164, PKS 0301−243, PKS 0426−380, PKS 0537−441, OJ 287, and PKS 2155−304. Ordering in terms of the total epochs of optical and IR observations available on these objects in the SMARTS archives, in this work we are presenting the results of the top three sources, namely AO 0235+164, OJ 287, and PKS 2155−304. The details of the three sources are given in Table 1 and a brief description of them is given below. However, the reviewed references are only a small subset of the large body of literature available on the multiwavelength studies and modelling on these sources.
Details of the objects studied in this work. The average γ-ray fluxes during the period 2008–2018 August between 100 MeV and 300 GeV are in units of 10−7 ph cm−2 s−1 and Γ is the photon index in the γ-ray band.
| Name | 3FGL name | α2000 | δ2000 | z | Γ | γ-ray flux |
|---|---|---|---|---|---|---|
| AO 0235+164 | 3FGL J0238.6+1636 | 02:38:38.9 | +16:36:59 | 0.940 | 2.06 | 1.41 |
| OJ 287 | 3FGL J0854.8+2006 | 08:54:48.9 | +20:06:31 | 0.306 | 2.12 | 0.99 |
| PKS 2155−304 | 3FGL J2158.8−3013 | 21:58:52.0 | −30:13:32 | 0.116 | 1.75 | 1.12 |
2.1 AO 0235+164
AO 0235+164 was first classified as a BL Lac object based on its variability and featureless optical spectrum (Spinrad & Smith 1975). Cohen et al. (1987) measured the redshift of the object at z = 0.94. It has shown violent variations across the electromagnetic spectrum that includes optical, X-rays, and γ-rays (Raiteri et al. 2001, 2009; Abdo et al. 2010). The high optical flux variability shown by the source during 2006 December is also accompanied by high optical polarization (30–50 per cent; Hagen-Thorn et al. 2008). Raiteri et al. (2001) found the quasi-periodic behaviour in radio outburst with a periodicity of ∼5.7 yr. It is classified as an LSP blazar (Ackermann et al. 2015) and its γ-ray spectrum is well fitted by a log-parabola function (Acero et al. 2015). From detailed multiwavelength observations of the source spanning about 6 months and including observations from the radio to the γ-ray bands, Ackermann et al. (2012) found the γ-ray activity to be well correlated with the optical/IR flares. They also found the broad-band SED to be well explained by leptonic models with the seed photons for the IC scattering from the torus.
2.2 OJ 287
OJ 287, first identified as a blazar in 1967 by Dickel et al. (1967), is an LSP blazar (Ackermann et al. 2015) at a redshift (z) of 0.306. In the long-term optical light curve, a periodicity of ∼12 yr was observed, which in the binary supermassive black hole model is attributed to the secondary supermassive black hole striking the accretion disc around the primary supermassive black hole (Sillanpaa et al. 1988). In addition to flux variations in the optical band (Paliya et al. 2017b; Rakshit et al. 2017), it has also shown polarization variations (Rakshit et al. 2017). Flux variations are also seen in the GeV γ-ray energy band (Agudo et al. 2011). The broad-band spectral analysis of the source at various activity levels points to the high-energy hump explained by IC scattering of both emission-line photons (Kushwaha et al. 2018) and the torus (Kushwaha, Sahayanathan & Singh 2013).
2.3 PKS 2155−304
PKS 2155−304 was first discovered in the Parkes survey (Shimmins & Bolton 1974) and identified as a BL Lac object by Hewitt & Burbidge (1980). It is an HSP blazar at a redshift (z) of 0.116 (Bowyer et al. 1984), and its γ-ray spectrum is consistent with a log-parabola function (Acero et al. 2015). Correlated optical and γ-ray flare was seen in 2014, while in 2016, there was a large optical flare with no corresponding flare both in the GeV band and at very high energies (Wierzcholska et al. 2019). Simultaneous observations of the source in 2008 showed evidence of correlated flux variations between the optical and very high energy (VHE) γ-ray bands; however, the increased flux in the optical band has no correspondence with the X-ray and the GeV flux consistent with being constant (Aharonian et al. 2009). Quasi-periodic variations in the optical emission with a time-scale of 317 ± 12 d (Zhang et al. 2014) and in the GeV emission with a time-scale of 1.74 ± 0.013 yr are known in PKS 2155−304 (Zhang et al. 2017).
3 REDUCTION OF MULTIWAVELENGTH DATA
The main motivation in this work is to look for correlated variations between the optical and GeV γ-ray bands. This demands the availability of data in both optical and γ-ray bands. Furthermore, for broad-band SED modelling of few selected epochs, data from other bands such as the IR, UV, and X-ray are also needed. Therefore, we used all publicly available data in the IR, optical, UV, X-rays, and γ-rays that span the period between 2008 August 8 and 2018 August 8. Optical polarimetric data if available during the above period were also used.
3.1 γ-ray data
The γ-ray data covering the period 2008 August 8–2018 August 8 were from the LAT instrument onboard the Fermi Gamma Ray Space Telescope. We generated 1-d binned γ-ray light curve using Fermipy (Wood et al. 2017). We used Pass 8 data for the analysis where the photon-like events are classified as ‘evclass=128, evtype=3’ with an energy range of 0.1 ≤ E ≤ 300 GeV. A circular region of interest of 15○ was chosen with zenith angle cut 90○ in order to remove Earth limb contamination. We used the isotropic model ‘iso|$\_$|P8R2|$\_$|SOURCE|$\_$|V6|$\_$|v06’ and the Galactic diffuse emission model ‘gll|$\_$|iem|$\_$|v06’ for the analysis. The recommended criteria ‘(DATA|$\_$|QUAL>0)&&(LAT|$\_$|CONFIG==1)’ were used for the good time interval selection. In the 1-d binned light curve, the source is considered to be detected if the test statistics (TS) > 9. This corresponds to a 3σ detection (Mattox et al. 1996). Epochs with TS < 9 are shown as upper limits in the 1-d binned γ-ray light curves. However, as points with TS < 9 are also detections, but with significance <3σ, they were used in the calculation of the average brightness of the sources in their faint states.
3.2 X-ray data
For X-rays, we used data from the Swift-XRT telescope that covers the energy range of 0.3–10 keV (Gehrels et al. 2004; Burrows et al. 2005) for the period from 2008 August to 2018 August. This was taken from the archives of HEASARC.2 We analysed the data with the default parameter settings as suggested by the instrument pipeline. For the generation of the light curves, we used data from both the window timing (WT) and photon counting (PC) mode; however, for spectral analysis we used PC mode data for the sources AO 0235+164 and OJ 287 for both the quiescent and flaring states, while for the source PKS 2155−304, we used WT mode data for the quiescent state and PC mode data for the flaring state. We processed the data with the xrtpipeline task using the latest CALDB files available with version heasoft-6.24. We used the standard grade selection 0–12. We extracted the source spectra from a circular region of radii 60 arcsec, whereas the background spectra were selected from the region of radii 80 arcsec away from the source for PC mode. For WT mode, for the source we used a circular region of 60 arcsec radii and for the background we used the region between circular radii of 80 and 120 arcsec centred around the source. We combined the exposure map using the tool XIMAGE and to create the ancillary response files we used xrtmkarf. We used an absorbed simple power-law model with the Galactic neutral hydrogen column density of NH = 6.59 × 10²⁰, 2.38 × 10²⁰, and 1.29 × 1020 cm−2 (Kalberla et al. 2005) for the sources AO 0235+164, OJ 287, and PKS 2155−304, respectively, to perform the fitting within xspec (Arnaud 1996). Within xspec, we adopted χ2 statistics and the calculated uncertainties are at the 90 per cent confidence level.
3.3 UV–optical and IR data
For data in the UV and optical bands, we used observations from Swift-UVOT. The data from Swift-UVOT were analysed using the online tool.3 In addition to the optical data from Swift-UVOT, we also used optical data in the Vband from both SMARTS and the Steward Observatory, while IR observations in the J and Kbands were taken from SMARTS (Bonning et al. 2012). Corrections due to galactic absorption were applied to the UV, optical, and IR points for SED analysis. These magnitudes were not corrected for contribution from host galaxy. The galactic absorption-corrected magnitudes were converted to fluxes using the zero-points in Bessell (1979) and Breeveld et al. (2011). Optical polarization data were taken from the Steward Observatory (Smith et al. 2009).4
4 ANALYSIS
4.1 Multiwavelength light curves
The motivation behind this work is to examine the presence and/or absence of correlated flux variations between optical and γ-ray bands. This requires first the identification of epochs where the optical and γ-ray flux variations are correlated or uncorrelated. An automated procedure to identify this was hindered due to gaps and less number of data points in the optical light curves. Therefore, flares were first identified visually. Once those flares were identified expanded light curves were generated for a duration of 20 d centred on the optical or γ-ray flare. This is to make sure the availability of data at multiple wavelengths that are needed for broad-band SED modelling. This condition of data availability at multiple wavelengths leads to the identification of few epochs for each object. For those epochs, we carried out a quantitative assessment for the presence and/or absence of correlation between optical and γ-ray waveband through statistical analysis. For this, we calculated over the 20-d period (i) the mean of the optical and γ-ray fluxes (that includes detections with TS < 9) during the quiescent periods, (ii) peak of the optical and γ-ray flares, and (iii) the ratio of the peak of the optical/γ-ray flares to their mean flux levels at the quiescent epochs. These are given in Table 2. Using the ratio, we concluded on the presence or absence of optical–γ-ray correlation. This was also cross-checked by carrying out correlation function analysis between the optical and γ-ray light curves using the discrete correlation function (DCF) method of Edelson & Krolik (1988). Though the correlation functions are noisy due to the sparseness of the data at each epoch, the DCF analysis indicates that the optical and γ-ray light curves of all the identified epochs are correlated with lags consistent with zero. The details of the epochs selected for each object based on the above are further described below.
Summary of the epochs considered for detailed light-curve analysis, SED modelling, and spectral analysis. The γ-ray fluxes are between 100 MeV and 300 GeV and in units of 10−6 ph cm−2 s−1 and the optical fluxes are in units of 10−11 erg cm−2 s−1. The entry OG in the final column indicates that the optical and γ-ray flares are correlated, while Q refers to the quiescent level. The mean γ-ray fluxes during the quiescent state of AO 0235+164, OJ 287, and PKS 2155−304 are 0.11 ± 0.11, 0.04 ± 0.06, and (0.08 ± 0.06) × 10−6 ph cm−2 s−1, respectively. Similarly, in the optical band, the mean brightness values during the quiescent states of AO 0235+164, OJ 287, and PKS 2155−304 are 0.07 ± 0.02, 1.62 ± 0.46, and (5.82 ± 0.61) × 10−11 erg cm−2 s−1, respectively.
| MJD | Calendar date | Peak flux | Peak/mean flux | ||||||
|---|---|---|---|---|---|---|---|---|---|
| Name/ID | Start | End | Start | End | γ | Optical | γ | Optical | Remark |
| AO 0235+164 | |||||||||
| A | 54720 | 54740 | 11-09-2008 | 01-10-2008 | 0.86 ± 0.14 | 2.26 ± 0.01 | 7.82 ± 1.39 | 32.29 ± 0.72 | OG |
| B | 54743 | 54763 | 04-10-2008 | 24-10-2008 | 1.41 ± 0.20 | 1.57 ± 0.01 | 12.82 ± 2.93 | 22.43 ± 0.50 | OG |
| C | 55100 | 55200 | 26-09-2009 | 04-01-2010 | – | – | – | – | Q |
| D | 57040 | 57060 | 18-01-2015 | 07-02-2015 | 0.22 ± 0.10 | 0.67 ± 0.01 | 2.00 ± 0.30 | 9.57 ± 0.21 | OG |
| OJ 287 | |||||||||
| A | 54870 | 54970 | 08-02-2009 | 19-05-2009 | – | – | – | – | Q |
| B | 55127 | 55147 | 23-10-2009 | 12-11-2009 | 0.50 ± 0.18 | 5.88 ± 0.02 | 12.50 ± 2.37 | 3.63 ± 1.67 | OG |
| C | 56735 | 56755 | 19-03-2014 | 08-04-2014 | 0.59 ± 0.18 | 2.69 ± 0.01 | 14.75 ± 2.80 | 1.66 ± 0.76 | OG |
| D | 57350 | 57370 | 24-11-2015 | 14-12-2015 | 0.47 ± 0.14 | 8.20 ± 0.02 | 11.75 ± 1.79 | 5.06 ± 2.33 | OG |
| PKS 2155−304 | |||||||||
| A | 55740 | 55840 | 28-06-2011 | 06-10-2011 | – | – | – | – | Q |
| B | 56790 | 56810 | 13-05-2014 | 02-06-2014 | 1.04 ± 0.20 | 10.70 ± 0.02 | 13.00 ± 2.72 | 1.84 ± 1.12 | OG |
4.1.1 AO 0235+164
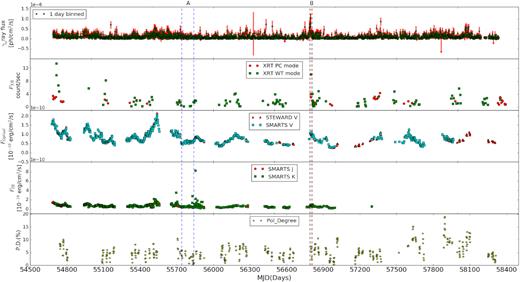
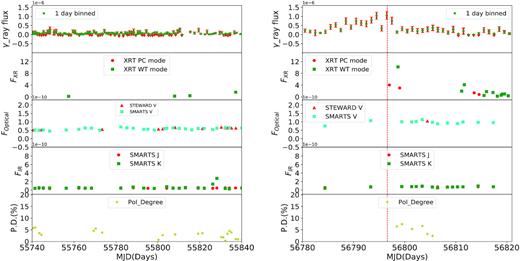
Multiwavelength light curves from Fermi, Swift-XRT, SMARTS, and Steward Observatory are shown in Fig. 1. Two major flares in the optical/IR bands are evident in the light curves. X-ray and γ-rays too have measurements simultaneous to the flares in the optical/IR. Close inspection of the light curves indicates that these large optical flares are composed of many short-term flux variations. We identified four epochs in this source, namely A, B, C, and D, for studying the correlations between optical and GeV flux variations. Table 2 provides a summary of these epochs and the multiwavelength light curves covering a 40-d period for each epoch (except for the quiescent epoch that is 100 d) are given in Fig. 2. However, for SED analysis during flaring epochs, data covering a period of 20 d centred around the flare were used. The details of those four epochs are given below.
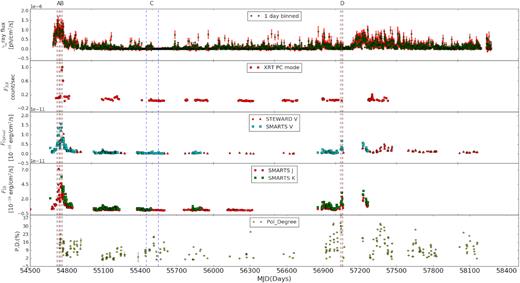
Multiwavelength light curves of the source AO 0235+164. From the top, panels refer to the 1-d binned γ-ray light curve, the X-ray light curve, the optical light curve, the IR light curves, and the degree of optical polarization. The vertical red lines refer to the optical flare peaks and γ-ray flare, and the two vertical black lines indicate a period of 10 d each on either side of the peak of the flare. The two vertical blue lines are for the period of 100 d and correspond to the quiescent period. The upper limit points, which are defined for TS < 9, are shown with vertical arrow in the 1-d binned γ-ray light curve.
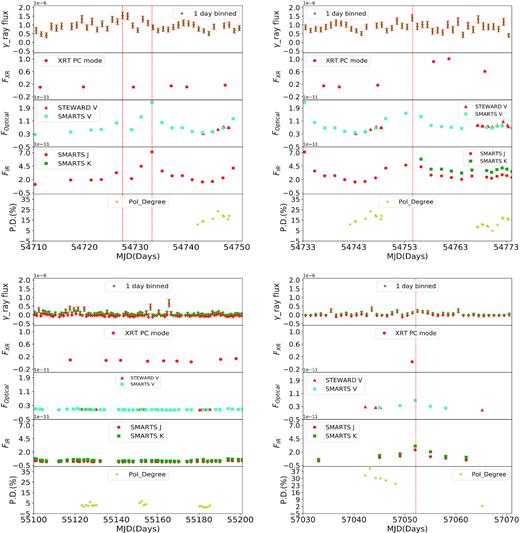
Multiwavelength light curves for the selected epochs of the source AO 0235+164. Epoch A is shown in the top left panel and epoch B is shown in the top right panel. The bottom left and right panels show the light curves for epochs C and D, respectively. The dashed lines show the peak of the optical and GeV flare.
Epoch A: During this epoch, the γ-ray and optical flares have increased by a factor of ∼32 and ∼8, respectively, relative to their quiescent epochs; however, the amplitude of IR variation is larger than the variation in the optical. During this epoch, there are two optical flares, a major one around MJD 54733 and a minor one around MJD 54726. For the peak of the γ-ray flux during this epoch, we considered the one that coincides with the major optical flare. The nature of X-ray flux variations during the peak of the optical flare could not be ascertained due to the lack of X-ray flux measurements. No optical polarization measurements were available during the 20-d period of this epoch. DCF analysis between optical and γ-ray light curves during this epoch shows that both are correlated with a lag of 4.84|$^{+1.8}_{-6.24}$| d. However, due to the sparseness of the data in the optical band, uncertainty is high. We conclude that in this epoch the optical and GeV flares are correlated.
Epoch B: During this epoch, the available peak optical flux is about a factor of ∼22 larger than the mean level during the quiescent epoch. An enhancement in the γ-ray flux by a factor of ∼13 relative to the quiescent epoch is there during the same epoch of the optical flare (see Table 2). From DCF analysis, we found the optical and γ-rays are correlated with zero lag (lag = |$-0.25^{+3.92}_{-6.56}$| d). In IR too, there are indications of increased brightness during this epoch; however, the nature of the X-ray state of the source could not be ascertained during this epoch due to the lack of flux measurements. Optical polarization measurements were not available during the peak of the optical flare, but the measurements during the 20-d period centred around the optical flare show that the source is strongly polarized at the 20 per cent level, relative to the quiescent state where the degree of polarization (PD) is around 2 per cent. Thus, in this epoch, there is an optical flare with a GeV counterpart.
Epoch C: During this period, the source was at its quiescent phase in all the wavelengths analysed in this work. The source was also less polarized during this epoch with a PD of around 2 per cent.
Epoch D: The source has shown an optical flare during this epoch. Simultaneous to the optical flare, the IR fluxes too have increased with the peak of the IR measurements coinciding with the peak of the optical flare. Around the peak of the optical flare, the source is detected in the γ-ray band with high significance (TS > 9). Considering points also with TS < 9 during this epoch, the presence of a γ-ray flare is evident. This is also confirmed from the statistical analysis presented in Table 2. From DCF analysis, we found a lag of 0.48|$^{+6.61}_{-5.48}$| d that is consistent with zero. There is lack of X-ray flux measurements during the peak of the optical flare and therefore, the exact X-ray flux state of the source during the optical flare is not known. Though there are no simultaneous polarization measurements during the peak of the optical flare, the few measurements available during the 20-d period of this epoch show that the PD during this epoch is about 30 per cent, a factor of about 15 larger relative to the polarization at the quiescent state. Thus, in this epoch too, there is an optical flare with a GeV counterpart.
4.1.2 OJ 287
We show in Fig. 3 the multiwavelength light curves of the source, which include data from Fermi, Swift-XRT, SMARTS, and the Steward Observatory. The source is active all the time in the optical. We identified four epochs in this source, namely A, B, C, and D. The brief details of these four epochs are given in Table 2. An expanded view of those four epochs, which covers a time span of 40 d for the flaring epochs and 100 d for the quiescent epoch, is shown in Fig. 4.
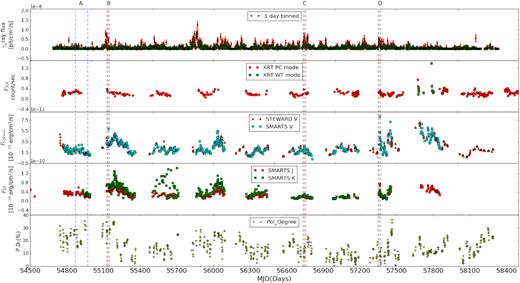
Multiwavelength light curves of the source OJ 287. The other details are similar to that given in the caption of Fig. 1.
Multiwavelength light curves for the selected epochs of the source OJ 287. The top left and right panels are for epochs A and B, while the bottom left and right panels are for epochs C and D, respectively.
Epoch A: During this epoch, the source was at a quiescent state at all the wavelengths, though some small-scale variations are seen in the optical light curve. It was below the detection limit (TS < 9) in the γ-ray band for most of the time during this epoch. During this quiescent period of 100 d, dramatic changes were noticed in the degree of optical polarization. During the beginning of the epoch, PD decreased from about 30 per cent to around 15 per cent in about 20 d, remained steady at around 20 per cent in the middle of the epoch, and again increased to about 30 per cent during the end of this epoch. No changes in optical flux were noticed during the times of polarization variations.
Epoch B: There is a weak γ-ray flare in this epoch that has a corresponding enhancement in flux in the optical band. The X-ray brightness state of the source during the epoch of the weak optical and γ-ray flare is unknown due to the absence of X-ray measurements. Polarization measurements during the beginning of this epoch indicate that the source has high optical polarization of about 20 to 30 per cent. The ratios of the peak optical and γ-ray fluxes to their corresponding mean flux levels during their quiescent period are 12.50 ± 2.37 and 5.88 ± 0.02, respectively (see Table 2). Cross-correlation analysis between the optical and γ-ray light curves gave a value of 0.11|$^{+1.36}_{-1.21}$| d that is consistent with zero. Thus, during this epoch optical and γ-ray flares are correlated.
Epoch C: During this epoch from visual inspection there is a weak optical flare, which again has a correlated γ-ray flare that is moderate. Statistical analysis too confirms this (Table 2). From DCF analysis during this epoch, we found that the optical and γ-rays are correlated with zero lag (lag = 2.27|$^{+3.45}_{-3.57}$| d). The optical polarization also showed a marginal increase during the peak of the optical and γ-ray flare. Thus, in this epoch there is a correlated optical and γ-ray flare.
Epoch D: During this epoch, the source showed a large optical flare. In the IR band too, a flare is noticed albeit with low amplitude. However, the source was detected in the γ-ray band with high significance (TS > 9) only during the peak of the flare while during most of the time in this epoch, the source was detected with less significance (TS < 9). Considering all the detections along with the statistical analysis (Table 2) indicates the presence of a γ-ray flare along with an optical flare. Cross-correlation analysis of the optical and γ-ray light curves during this epoch shows that the optical and γ-ray light curves are correlated with a lag of 2.18|$^{+4.79}_{-2.36}$| d. The X-ray brightness during this epoch was consistent with a constant flux level. Polarization observations available during the end of the epoch indicate the source to have lower polarization compared to the values of PD at epoch B. Thus, during this epoch too we have an optical flare with a γ-ray counterpart.
4.1.3 PKS 2155−304
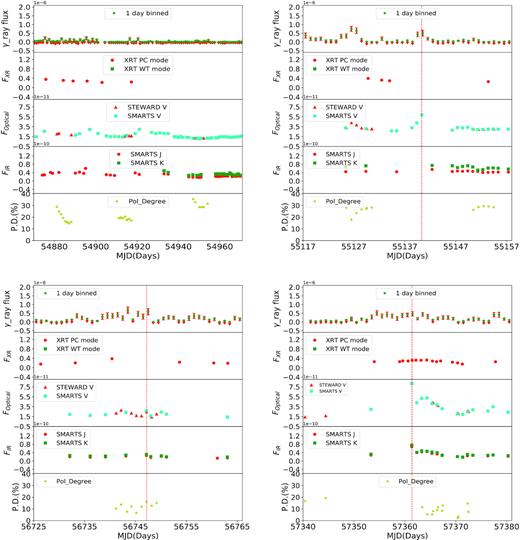
During the 10-yr period analysed here for flux variations, the source was found to be variable all the times in the optical band. This is evident in Fig. 5 where we show the multiwavelength light curves of the source. In this source, we identified two epochs, namely A and B. The summary of these two epochs is given in Table 2 and an expanded view of these two epochs is shown in Fig. 6. For the quiescent period, this expanded plot is shown for a 100-d period, while for epoch B, it is shown for a duration of 40 d. The details of these two epochs are given below.
Multiwavelength light curves of the source PKS 2155−304. Other details to the figure are similar to that given in the caption of Fig. 1.
Multiwavelength light curves for the selected epochs of the source PKS 2155−304. The left- and right-hand panels are for the epochs A and B, respectively.
Epoch A: We considered this epoch as the quiescent state of the source. During this period, the 1-d binned γ-ray light curve was nearly stable. In the optical and IR bands too, the flux of the source remained stable. Available X-ray flux measurements during this period too point to the source being weak in X-rays. No changes were noticed in the optical polarization with the PD remaining nearly constant at a value of about 3 per cent. This epoch thus represents the true quiescent period of the source.
Epoch B: The source displayed a strong γ-ray flare during this epoch. Coincident with the γ-ray flare, we noticed a low-amplitude optical and IR flare. X-ray too showed increased flux during the optical and γ-ray flare; however, the peak of the X-ray does not coincide with the peak of the γ-ray flare. Although the overall optical brightness state of the source is larger compared to the other periods, there is lack of optical data at the peak of the γ-ray flare. However, visual inspection of Fig. 5, as well as statistical analysis (Table 2), indicates a γ-ray flare correlated with an optical flare. Cross-correlation analysis indicates that the optical and γ-ray light curves during this epoch are correlated with a lag of 6.08|$^{+1.74}_{-7.89}$|. Optical polarization was also higher during this epoch relative to the quiescent epoch A. Thus, during this epoch we observed correlated flux variations in IR, optical, and γ-rays.
4.2 Spectral variations
The flux variations in the optical and IR bands shown by blazars are accompanied by spectral/colour variations. To investigate the spectral variability characteristics of the BL Lacs studied in work, we generated colour (V −J)–magnitude (V) diagrams of all the selected epochs for the three BL Lacs and checked for the correlation of (V− J)-band colour against the V-band brightness. To characterize spectral variations, we carried out linear least-squares fit to the colours and magnitudes taking into account the errors in both of them. We considered a source to show colour variation if the Spearman rank correlation coefficient is >0.5 or <−0.5 and the probability of no correlation is less than 0.05, so that the claimed correlation is significant at the 95 per cent level. In the source A0 0235+164, we found ‘bluer when brighter (BWB)’ trend for the epochs A and B. In OJ 287, we found BWB trend at epochs B and D, while for PKS 2155−304 we found BWB trend for the lone epoch B. Thus, in all the sources for the epochs where a statistically significant colour–magnitude relation could be established, we found a BWB trend. The colour–magnitude relation for all the sources that satisfies the statistical criteria outlined above along with the linear least-squares fit to the data is shown in Fig. 7.
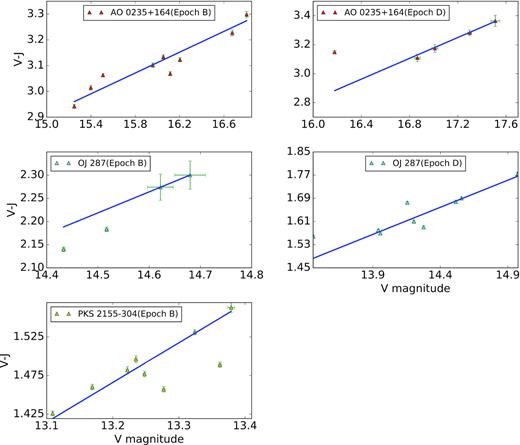
Colour–magnitude diagram. The top left and right panels are for AO 0235+164 epochs B and D, respectively. The middle panels are for the epoch B (left-hand panel) and epoch D (right-hand panel) of OJ 287 and the bottom panel is for the epoch B of PKS 2155−304.
Studies on optical–IR colour variations in blazars generally point to FSRQs showing a redder colour with increasing brightness (RWB; Sarkar et al. 2019) and BL Lacs showing a bluer colour with increasing brightness (BWB; Gaur et al. 2019). Recent studies on the colour variations in blazars show that in FSRQs both BWB and RWB trends are seen (Rajput et al. 2019; Rajput et al. 2020; Safna et al. 2020). In the objects studied here, whenever statistically significant colour variations were observed, we found a BWB trend (see Fig. 7). Such a BWB trend could happen because of changes in the Doppler factor (Villata et al. 2004; Papadakis, Villata & Raiteri 2007). In can also happen due to increase in the amplitude of variations at shorter wavelengths (Stalin et al. 2009) that in the one zone leptonic scenario can happen due to the injection of fresh electrons that have an energy distribution that is harder than older softer elections (Mastichiadis & Kirk 1995). Though our analysis points to BL Lacs showing a BWB trend, it is unlikely they do not show an RWB trend. For example, based on an analysis of about 10 yr of optical–IR data on AO 0235+164, an LSP BL Lac, Safna et al. (2020) noticed BWB trend up to certain optical V-band brightness, beyond which the source showed an RWB behaviour.
4.3 γ-ray spectrum
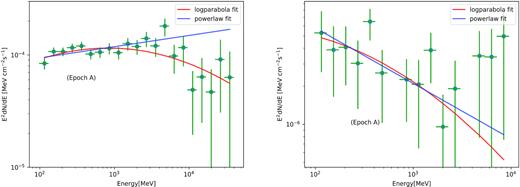
Observed and model fits to the γ-ray spectra. Left: Epoch A of AO 0235+164 well fitted by the LP model and right: epoch A of OJ 287 well described by the PL model.
Details of the PL and LP model fits for the selected epochs of the sources AO 0235+164, OJ 287, and PKS 2155−304. Here, the γ-ray flux value is in units of 10−7ph cm−2 s−1. The values of Γ, α, and β mentioned here are obtained by fits to the data that match with the values returned by fermipy.
| PL | LP | |||||||||
|---|---|---|---|---|---|---|---|---|---|---|
| Epochs | Γ | Flux | TS | −log L | α | β | Flux | TS | −log L | TScurve |
| AO 0235+164 | ||||||||||
| A | −1.90 ± 0.02 | 3.90 ± 0.13 | 3874.64 | 31 241.99 | 1.94 ± 0.03 | 0.05 ± 0.02 | 9.64 ± 0.12 | 4413.69 | 30 888.09 | 707.8 |
| B | −1.95 ± 0.01 | 3.60 ± 0.05 | 2617.2 | 27 655.91 | 1.98 ± 0.03 | 0.08 ± 0.03 | 8.64 ± 0.12 | 2982.15 | 27 330.24 | 651.36 |
| C | −2.40 ± 0.16 | 0.19 ± 0.11 | 71.97 | 69 867.23 | 2.40 ± 0.18 | 0.06 ± 0.06 | 0.92 ± 0.12 | 133.52 | 69 843.77 | 46.94 |
| D | −1.91 ± 0.16 | 1.03 ± 0.12 | 87.59 | 21 402.72 | 1.91 ± 0.18 | 0.07 ± 0.00 | 1.42 ± 0.05 | 95.85 | 21 422.97 | −40.50 |
| OJ 287 | ||||||||||
| A | −2.44 ± 0.13 | 0.43 ± 0.05 | 104.512 | 57 896.37 | 2.48 ± 0.16 | 0.07 ± 0.17 | 0.40 ± 0.02 | 98.39 | 57 897.17 | −0.16 |
| B | −2.51 ± 0.16 | 0.87 ± 0.19 | 109.77 | 15 636.63 | 2.95 ± 0.41 | 0.30 ± 0.27 | 1.47 ± 0.09 | 143.06 | 15 634.43 | 4.40 |
| C | −1.88 ± 0.11 | 1.77 ± 0.37 | 205.64 | 8613.66 | 1.87 ± 0.15 | 0.07 ± 0.02 | 2.46 ± 0.20 | 242.103 | 8601.86 | 23.60 |
| D | −2.72 ± 0.14 | 1.97 ± 0.24 | 184.95 | 9139.01 | 2.88 ± 0.40 | 0.09 ± 0.23 | 3.01 ± 2.32 | 254.03 | 9129.45 | 19.12 |
| PKS 2155-304 | ||||||||||
| A | −1.78 ± 0.04 | 0.41 ± 0.04 | 831.04 | 51 370.55 | 1.84 ± 0.05 | 0.09 ± 0.04 | 0.85 ± 0.06 | 934.67 | 51 344.24 | 52.62 |
| B | −1.62 ± 0.04 | 4.09 ± 0.40 | 1541.92 | 14 844.11 | 1.83 ± 0.06 | 0.02 ± 0.03 | 4.97 ± 0.54 | 1621.77 | 14 822.00 | 44.22 |
4.4 SED modelling
For all the sources, when flares were identified visually and then confirmed statistically, we found close correlation between optical and γ-ray flux variations.
To further characterize the physical properties of the sources during the epochs of optical and γ-ray flux variations, we generated the broad-band SED of the sources at the different epochs and modelled them using the one-zone leptonic emission model. For comparison, we also generated the broad-band SED for a quiescent state in each of the sources. To generate the SEDs, all photometric measurements during each epoch as summarized in Table 2 were averaged filter wise in the optical and IR bands to get one photometric point for each epoch. For X-rays and γ-rays, average X-ray and γ-ray spectra were generated using all data during the period of each epoch. Blazars are known to show flux variations over a range of time-scales (Wagner & Witzel 1995). Also, during the time ranges considered here for SED analysis, the brightness states of the sources were not stable in most of the wavelengths. Therefore, the source parameters obtained by fitting the time-averaged SED could be treated as average/typical values applicable for the duration that is considered. In the one-zone leptonic emission model, the low-energy hump of the broad-band SED of BL Lacs is due to synchrotron emission from relativistic electrons in the jet, while the high-energy hump is mostly attributed to IC emission processes. For example, in the source PKS 2155−304, Wierzcholska et al. (2019) explain the high energy part of the SED using SSC process. The flare of the source in 2013 June was well fitted by leptonic model, while the flare of 2013 April was fitted with lepto-hadronic model (Abdalla et al. 2020). Also, the interest in the modelling of blazar SED has increased due to the finding of an association of the IceCube neutrino with blazars such as TXS 0506+056 (IceCube Collaboration 2018) and BZB J0955+3551 (Paliya et al. 2020). In spite of the different model fits attempted on BL Lac sources such as PKS 2155−304 at different periods, we performed a statistical fitting of the broad-band SEDs using synchrotron, SSC, and external Compton mechanisms. The details of the model as implemented within xspec can be found in Sahayanathan, Sinha & Misra (2018). This xspec implementation of the model also gives the errors in the best-fitting parameters through the χ2 minimization technique. To account for the model as well as observational (for example, uncertainties in host galaxy contribution and the optical brightness of the sources) uncertainties, we added 15 per cent systematics to the data for all the epochs. The model has 12 free parameters, namely particle spectral index before the break (p), the particle spectral index after the break (q), electron energy density (Ue), minimum Lorentz factor of the electrons (γmin), the maximum Lorentz factor of the electrons (γmax), the break Lorentz factor of the electron distribution (γb), magnetic field (B), size of the emission region (R), bulk Lorentz factor of the jet (Γ), viewing angle of the jet (θ), the temperature of the external photon field (T), and the fraction of the external photons that take part in the EC process (f). The number of parameters defining the model SED is larger than the spectral information extracted from observed SED and this forced us to freeze some parameters to typical values and perform the fitting procedure. For the target photon field for EC scattering, we considered the photons from BLR and torus. The emission from these regions is assumed to be a blackbody type with the temperature of BLR photons as 42 000 K (corresponding to the dominant Ly α line with a frequency of 2.47 × 10¹⁵), while for the photons from the torus we considered a temperature of 800 K. In addition, we enforced equipartition condition between the electron energy density and magnetic field (Ue ≈ B2/8/π) that ensures minimum source energy (Burbidge 1959). This imposed further constraint on the free parameters. Finally, the fitting was performed on five parameters, namely p, q, B, Γ, and γb, while the remaining seven parameters were frozen to values obtained by ‘fit by eye’ of the quiescent states for all the sources (Table 4). The validity of the fitted parameters will heavily depend on the choice of these frozen parameters. The observed SED along with the model fits is given in Figs 9–11. The best-fitting model parameters are given in Table 5. A quick look into the best-fitting power-law indices of the particle spectrum disfavours the radiative cooling origin of the broken power-law electron distribution. Under this interpretation, one may expect the difference in the power-law index to be ∼1 (p and p+ 1). The corresponding difference in the synchrotron spectral index will be ∼0.5 (Rybicki & Lightman 1986). However, the spectral index difference of blazars exceeds this value (fig. 27. of Abdo et al. 2010). The large difference in particle indices is also seen in case of CGRaBS catalogue (fig. 9 of Paliya et al. 2017a). An alternate explanation for the broken power-law distribution with large index difference could be the presence of multiple acceleration scenarios (Sahayanathan 2008). In addition, the excessively large index difference can also be an artefact introduced by a steeply decaying spectrum. For the sources AO 0235+164 and OJ 287, during all the epochs, the high-energy component is well fitted by the combination of SSC and EC emission processes. The seed photons for the EC scattering can be from the dusty torus and/or the Lyman α line emission from the BLR. On the other hand, for the source PKS 2155−304, the high-energy component is well fitted by the SSC model alone.
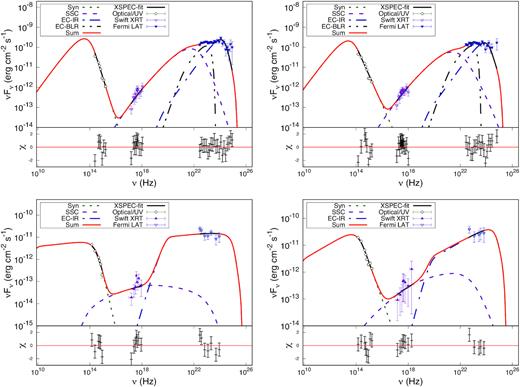
One-zone leptonic model fits to the broad-band SED for epochs A (left top), B (right top), C (bottom left), and D (bottom right) for the source AO 0235+164. The second panel in the figures shows the residuals, which is estimated from the observed data fitting in xspec.
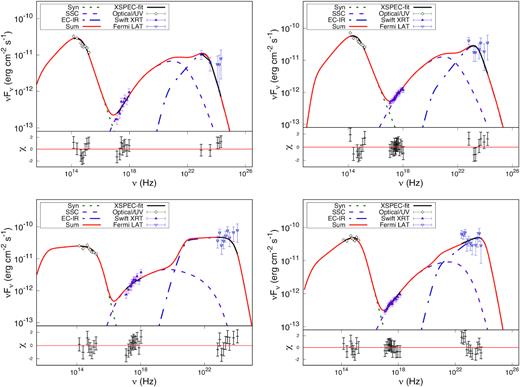
One-zone leptonic model fits to the broad-band SED for epochs A (left top), B (right top), C (bottom left), and D (bottom right) for the source OJ 287. The details to the figures are the same as those given in Fig. 9.
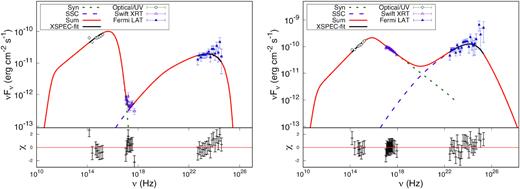
One-zone leptonic model fits to the broad-band SED for epochs A (left figure) and B (right figure) for the source PKS 2155−304. The different components in the figure have the same meaning as that of Fig. 9.
Values of the parameters that were frozen during the model fits to reproduce the observed SED. The size of the emission region is in units of 1016 cm, the temperature of the external photon field T is in Kelvin, and the value of γmax is in units of 106.
| Object | R | γmin | γmax | θ | TIR/TBLR | fIR/fBLR |
|---|---|---|---|---|---|---|
| (K) | ||||||
| AO 0235+164 | 1.32 × 10¹⁹ | 50 | 10 | 2 | 800/42 000 | 5.76 × 10⁻⁶/1.26 × 10−10 |
| OJ 287 | 1.11 × 10¹⁶ | 100 | 10 | 2.0 | 800/– | 0.05/– |
| PKS 2155−304 | 2.24 × 10¹⁶ | 50 | 100 | 2.0 | –/– | –/– |
Results of the broad-band SED analysis for the sources at different epochs. The subscript and superscript on the parameters are their lower and upper bounds calculated at the 90 per cent confidence level. A – implies that the upper or lower bound value on the parameter is not constrained.
| Name | Epoch | Bulk Lorentz | Low energy | High energy | Break energy | Magnetic | |
|---|---|---|---|---|---|---|---|
| factor | particle index | particle index | γb | field (Gauss) | χ2/dof | ||
| AO 0235+164 | A | |$82.02_{79.40}^{84.66}$| | |$1.20_{--}^{1.31}$| | |$7.17_{6.67}^{7.69}$| | |$11671_{10373}^{12793}$| | |$0.0108_{0.01}^{0.011}$| | 28.71/34 |
| B | |$86.26_{83.82}^{88.70}$| | |$1.23^{2.75}_{--}$| | |$5.93^{6.23}_{5.29}$| | |$9055^{10184}_{8132}$| | |$0.0112_{0.0106}^{0.0119}$| | 44.26/35 | |
| C | |$53.93^{63.85}_{--}$| | |$2.88^{3.07}_{--}$| | |$8.00_{6.32}^{8.00}$| | |$20082_{16801}^{22052}$| | |$0.0082^{--}_{0.0070}$| | 20.84/15 | |
| D | |$67.63^{--}_{--}$| | |$2.43^{2.74}_{1.12}$| | |$5.70_{5.29}^{6.23}$| | |$16410^{--}_{11426}$| | |$0.0089^{--}_{0.0075}$| | 12.74/16 | |
| OJ 287 | A | |$14.37_{11.50}^{--}$| | |$2.06_{1.83}^{2.25}$| | |$5.40_{4.89}^{6.37}$| | |$2480_{2140}^{--}$| | |$0.87_{0.81}^{--}$| | 17.38/16 |
| B | |$39.62_{15.66}^{--}$| | |$1.90_{1.67}^{2.10}$| | |$5.18_{4.86}^{5.86}$| | |$2168_{1905}^{2504}$| | |$0.89_{0.84}^{--}$| | 20.04/25 | |
| C | |$17.44_{14.45}^{21.76}$| | |$2.89_{2.76}^{3.02}$| | |$7.25_{4.97}^{--}$| | |$3963_{2875}^{4852}$| | |$1.01_{0.96}^{1.08}$| | 19.90/24 | |
| D | |$28.64_{18.86}^{46.14}$| | |$2.29_{2.13}^{2.35}$| | |$6.39_{5.71}^{--}$| | |$4429_{4141}^{6373}$| | |$0.79_{0.77}^{0.86}$| | 20.67/28 | |
| PKS 2155-304 | A | |$10.57_{9.66}^{11.98}$| | |$2.33_{2.31}^{2.38}$| | |$12_{8.91}^{--}$| | |$21658_{17618}^{22767}$| | |$0.45_{0.42}^{0.49}$| | 32.86/29 |
| B | |$9.15_{7.77}^{--}$| | |$2.07_{--}^{2.30}$| | |$3.69_{3.50}^{3.92}$| | |$15615_{11408}^{20993}$| | |$0.49_{0.39}^{--}$| | 26.43/43 |
5 DISCUSSION
The nature of seed photons that participate in the IC process to explain the high-energy emission in BL Lacs is highly debated. Cross-correlation analysis between variations in the optical band and the GeV γ-ray band on a large sample of blazars tends to support the scenario of EC to be the dominant process in FSRQs and SSC being the dominant process in BL Lacs (Cohen et al. 2014). On analysis of the relation between optical and γ-ray flux variations on a large sample of blazars, Hovatta et al. (2014) found SSC to be the dominant high-energy emission mechanism in ISP and HSP sources, while EC is more dominant in LSP sources. Though these studies broadly support the one-zone leptonic emission from blazar jets, the recent observations of uncorrelated optical and GeV flares challenge one-zone models of blazar emission. The existence of such uncorrelated flux variations between the optical and GeV bands is known today owing to the capabilities of Fermi and supporting ground-based observations at longer wavelengths in the optical bands. Earlier reports on such uncorrelated optical and GeV flares available in the literature are mostly for the FSRQ type of blazars such as PKS 0208−512 (Chatterjee et al. 2013), PKS 2142−75 (Dutka et al. 2013), PKS 0454−234, S4 1849+67, BZQ J0850−1213, OP 313 (Cohen et al. 2014), PKS 1510−089 (MacDonald et al. 2015), 3C 454.3 (Rajput et al. 2019), 3C 273, 3C 279, and CTA 102 (Rajput et al. 2020). The only BL Lac object for which uncorrelated optical and GeV flux variations are known is PKS 2155−304 (Wierzcholska et al. 2019). We have examined here the prevalence of uncorrelated optical and GeV flux variations in the BL Lacs. Based on the criteria outlined in Section 2, we arrived at a sample of three objects, namely A0 0235+164, OJ 287, and PKS 2155−304. In all the three objects in the epochs where flares are studied in this work, the optical and γ-ray flux variations are correlated. However, some observations point to scenarios of uncorrelated optical and GeV flux variations to be a common feature in blazars. Recently, from a DCF analysis of a sample of 178 blazars, Liodakis et al. (2019) found that about 50 per cent of optical flares have no γ-ray counterparts and about 20 per cent of γ-ray flares have no optical counterparts. This has increased our knowledge on the prevalence of correlated optical and γ-ray flux variations in blazars manifold compared to the earlier reports available on few individual sources (Chatterjee et al. 2013; Dutka et al. 2013; Cohen et al. 2014; MacDonald et al. 2015; Rajput et al. 2019, 2020).
In AO 0235+164, during epochs A, B, and D we found that variations in the optical and GeV γ-rays are closely correlated. This is an LSP source (Ackermann et al. 2015) and the high-energy emission in the broad-band SEDs during all the epochs of this source is well fitted by the EC process. For epochs C and D, the γ-ray emission can be well fitted by considering EC scattering of IR photons from the dusty torous; however, in case of epochs A and B, additional EC component scattering off the Lyman α photons from the BLR is required to obtain a reasonable reduced χ2 (see Fig. 9). The high-energy emission via the EC process is also studied by Hovatta et al. (2014). The multiwavelength analysis of the source AO 0235+164 conducted by Baring, Böttcher & Summerlin (2017) also suggests the presence of the EC process, which is responsible for the high-energy emission. The radiation output from IC emission, which constitutes the high-energy component, is a function of the energy density of the electrons Ue, Lorentz factor Γ, and the density of the external photon field that participates in IC scattering. At the same time, the radiation output from the synchrotron process that constitutes the low-energy component in the SED depends on Ue, Γ, and magnetic field B. Broad-band SED model fits during different flux states of AO 0235+164 showed an increasing trend in Γ and B, while decreasing trend was noticed in γb from quiescent to high-flux states (see Table 5). However, the large errors or unconstrained upper/lower bounds on the parameters did not lead us to unambiguously conclude that their variations could lead to correlated emission between the optical and γ-rays.
OJ 287 is an LSP BL Lac and here too the high-energy part of the SED at different epochs is described by the EC process with the seed photons from the dusty torus. In this source, we found that during all the flaring epochs considered here the optical flare is correlated with the γ-ray flare (see Figs 3 and 4). The best-fitting broad-band SED model parameters obtained in the different flux states of OJ 287 are shown in Table 5. These parameters show increasing/decreasing trend from low- to high-flux states; however, due to large error or unconstrained upper/lower bounds on the parameters, we cannot confirm the exact cause of variability in the optical and γ-ray emission.
For the source PKS 2155−304, we identified two epochs: epoch A, a quiescent period, and epoch B, an active period with an increased optical state coinciding with a γ-ray flare (see Fig. 5). This is an HSP BL Lac and the high-energy emission in the broad-band SED during both the quiescent and flaring states is fitted by the SSC process in our one-zone leptonic modelling approach. This source has also been extensively studied by various authors for multiwavelength variability and broad-band SED modelling; however, different processes have been invoked at different periods of the source to explain the observations. For multiwavelength observations carried out on the source during 2008 August 25 to 2008 September 6, Aharonian et al. (2009) found a correlation between the optical brightness changes with the changes in the VHE γ-rays, but the optical variations did not correlate with the GeV γ-rays. The authors argue that the population of electrons that were responsible for optical emission may be different from those responsible for GeV and VHE γ-rays. From an analysis of the optical and GeV γ-rays during the period 2007–2009, H.E.S.S. Collaboration (2014) found varied correlations between the optical and GeV γ-rays. They found instances of (i) correlation between optical and GeV γ-rays, (ii) anticorrelation between optical and GeV γ-rays, and (iii) no correlation between optical and GeV γ-rays. In this work too, during epoch B, we have an enhanced γ-ray with a peak value of about 13 times the mean brightness at the quiescent level. Similarly, in the optical too there is an enhancement of about a factor of 2 relative to the quiescent optical brightness, but available observations lack optical measurements during the peak of the γ-ray flare. X-ray flux enhancement too is not coincident with the GeV flare. The parameters obtained from model fits to epochs A and B of PKS 2155−304 are given in Table 5. Due to large as well as unconstrained errors on the parameter, the physical parameters that could lead to flux enhancement in the source during epoch B could not be ascertained.
6 SUMMARY
In an effort to identify correlated as well as uncorrelated flux variations between optical and GeV γ-ray bands in BL Lacs, we carried out a systematic analysis of flux variations in three BL Lacs, namely AO 0235+164, OJ 287, and PKS 2155−304. We summarize the results of the work below:
All the three BL Lacs showed correlated variations between optical and γ-rays during the flares analysed in this work.
The high-energy hump of the broad-band SED of AO 0235+164 and OJ 287 at all epochs is described by IC scattering of IR photons from the torus and/or the line emission from the BLR. For PKS 2155−304, the SEDs at all epochs are fitted by synchrotron and SSC processes.
The instances of correlated flux variations in optical and GeV bands as well quiescent epochs in all the three sources are explained by the one-zone leptonic scenario.
At all the epochs in the three sources where significant colour variations were observed, we found a BWB behaviour.
ACKNOWLEDGEMENTS
We thank the referee for his/her suggestions, which helped the authors to improve the manuscript significantly. Data from the spectropolarimetric monitoring project at the Steward Observatory were used for this work. This paper used the optical/near-IR light curves of SMARTS that are available at www.astro.yale.edu/smarts/glast/home.php. This programme is supported by Fermi Guest Investigator grants NNX08AW56G, NNX09AU10G, NNX12AO93G, and NNX15AU81G. This research work has extensively used the , Bangalore.
DATA AVAILABILITY
The multiwavelength data used in this work are publicly available from the Fermi-LAT,5Swift-XRT and Swift-UVOT,6 SMARTS,7 and Steward Observatory.8
