


ABSTRACT
We combine observations from Atacama Large Millimeter/submillimeter Array (ALMA), Australia Telescope Compact Array, Multi Unit Spectroscopic Explorer (MUSE), and Herschel to study gas-to-dust ratios in 15 Fornax cluster galaxies detected in the FIR/sub-mm by Herschel and observed by ALMA as part of the ALMA Fornax Cluster Survey. The sample spans a stellar mass range of 8.3 ≤ log(M⋆/M⊙) ≤ 11.16, and a variety of morphological types. We use gas-phase metallicities derived from MUSE observations (from the Fornax3D survey) to study these ratios as a function of metallicity, and to study dust-to-metal ratios, in a sub-sample of nine galaxies. We find that gas-to-dust ratios in Fornax galaxies are systematically lower than those in field galaxies at fixed stellar mass/metallicity. This implies that a relatively large fraction of the metals in these Fornax systems is locked up in dust, which is possibly due to altered chemical evolution as a result of the dense environment. The low ratios are not only driven by H i deficiencies, but H2-to-dust ratios are also significantly decreased. This is different in the Virgo cluster, where low gas-to-dust ratios inside the virial radius are driven by low H i-to-dust ratios, while H2-to-dust ratios are increased. Resolved observations of NGC 1436 show a radial increase in H2-to-dust ratio, and show that low ratios are present throughout the disc. We propose various explanations for the low H2-to-dust ratios in the Fornax cluster, including the more efficient stripping of H2 compared to dust, more efficient enrichment of dust in the star formation process, and altered interstellar medium physics in the cluster environment.
1 INTRODUCTION
The environment in which a galaxy resides can significantly influence the way it evolves. In particular, the more dense the environment, the more early-type galaxies (ETGs) it harbours relative to late-type galaxies (Oemler 1974; Dressler 1980). This suggests that dense environments are capable of aiding the quenching of star formation in galaxies. Various environmental mechanisms have been proposed to be (co-)responsible for this, including ram pressure stripping (Gunn & Gott 1972), starvation (Larson, Tinsley & Caldwell 1980), and galaxy–galaxy interactions (Moore et al. 1996). While many of these processes primarily affect the more extended and easily stripped H i gas, evidence has started to accumulate that they can also directly affect the molecular gas, despite its more tightly bound and centrally located nature (Vollmer et al. 2008; Fumagalli et al. 2009; Boselli, Cortese & Boquien 2014; Zabel et al. 2019, hereafter Z19). Since molecular gas is the direct fuel for star formation, this can, in turn, affect the star formation efficiency in galaxies in these dense environments (e.g. Gullieuszik et al. 2020; Zabel et al. 2020, hereafter Z20).
Besides gas, dust plays a vital role in star formation and galaxy evolution. If dust is environmentally stripped along with gas, this could have a significant impact on the evolution of galaxies in clusters, the most (galaxy) dense environments in the Universe. Dust acts as a catalyst for the formation of H2 (e.g. van Dishoeck et al. 1993; Scoville 2013; Wakelam et al. 2017, and references therein), and helps shield it from the interstellar radiation field (e.g. van Dishoeck et al. 1993; Ciolek & Mouschovias 1995). Therefore, dust and molecular gas are typically linked, and might be expected to be stripped simultaneously. However, if the process of star formation is (indirectly) affected by dense environments, this may result in more subtle effects on the chemical evolution of a galaxy, and the relative gas and dust contents.
The gas-to-dust ratio provides a useful probe for studying the effects of environmental stripping on galaxies’ gas and dust contents in more detail. Especially if it is compared with metallicity, it can teach us a lot about the chemical evolution of galaxies. The gas-to-dust ratio (G/D) as a function of metallicity has been studied extensively in field galaxies (e.g. Issa, MacLaren & Wolfendale 1990; Lisenfeld & Ferrara 1998; Draine et al. 2007; Sandstrom et al. 2013; Rémy-Ruyer et al. 2014; De Vis et al. 2017; De Looze et al. 2020). Rémy-Ruyer et al. (2014) compiled and homogenized a range of recent samples. They found that (total) G/D correlates strongly with metallicity, following a broken [around 12 + log(O/H) = 7.96] power law, with large scatter (∼0.37 dex for metallicity bins of ∼0.1 dex). Their results are consistent with chemical evolution models from Asano et al. (2013) and Zhukovska et al. (2016). Resolved studies have shown that the gas-to-dust ratio also varies within individual galaxies, e.g. the local galaxy M33. Gas-to-dust ratios in M33 differ from that in the Milky Way, and also vary radially (Tabatabaei & Berkhuijsen 2010; Gratier et al. 2017; Williams, Gear & Smith 2019).
Studies of the Virgo cluster have shown that dust can be stripped by environmental effects as well as gas, even from the very inner parts of galaxies (Cortese et al. 2010; Corbelli et al. 2012; Pappalardo et al. 2012). Corbelli et al. (2012) find dust deficiencies of up to 75 per cent in H i-deficient Virgo galaxies. Pappalardo et al. (2012) find a strong spatial correlation between molecular gas and cold dust in non-H i-deficient galaxies, which is weakened in H i-deficient galaxies. This suggests that both molecular gas and dust are affected by environment, though not necessarily in the same way. They find no significant radial gradient in total (i.e. H i + H2) G/D within cluster galaxies. Cortese et al. (2016) found that (total) gas-to-dust ratios in cluster galaxies are decreased compared to those in isolated galaxies at fixed mass and metallicity. They found that this decrease is driven by the H i-to-dust ratio, while the H2-to-dust ratio, on the other hand, is increased. They attribute this difference to differential stripping of the ISM as a result of the different spatial distribution of H i (most extended), H2 (centrally concentrated), and dust (in between the two gas phases).
Thus far, studies of gas-to-dust ratios in cluster galaxies have mostly focused on spiral galaxies in the Virgo cluster. To obtain a broader understanding of the role of dust stripping in the baryon cycle of cluster galaxies, in a wider variety of environments, we need to expand our studies to different clusters and galaxy types. The Fornax cluster is the more mature (though still active, e.g. Iodice et al. 2019b; Z19; Raj et al. 2020; Loni et al. 2021), but smaller sibling of the Virgo cluster in the Southern sky. Although it has only ∼1/10 times the mass of Virgo (∼7 × 10¹³ M⊙ within twice the virial radius, 2 × 0.7 = 1.4 Mpc, the virial radius of the Virgo cluster is ∼1.65 Mpc; Drinkwater, Gregg & Colless 2001; Mamon et al. 2004; Jordán et al. 2007), and ∼1/6 times the number of galaxies (Binggeli, Sandage & Tammann 1985; Ferguson 1989), its galaxy number density is 2–3 times higher. It is also more homogeneous and dynamically evolved, which is probably more typical of the type of environment many galaxies in the local universe reside in. Located at a distance similar to that to Virgo (the distance to the Fornax cluster is 19.95 Mpc, while that to the Virgo cluster is 16.5 Mpc; Tonry et al. 2001; Mei et al. 2007), the Fornax cluster provides an excellent second laboratory for studying environmental processes in detail.
The ALMA Fornax Cluster Survey (AlFoCS) is a complete survey of galaxies in the Fornax cluster that were detected in the far-infrared with Herschel or in H i, with the goal to study the effects of environment on molecular gas in combination with other phases of the interstellar medium (ISM). It comprises 30 galaxies (of which 15 were detected in CO) of various morphological types, both early types and late types, as well as (irregular) dwarf galaxies, spanning a mass-range of 10∼8.5−11 M⊙. For reference, the optical Fornax Cluster Catalogue (FCC; Ferguson 1989) contains 340 galaxies, and with the recent optical Fornax Deep Survey (FDS; Peletier et al. 2020), this number probably increases to several thousands of galaxies, with many new photometric cluster candidates (564 dwarf galaxies alone) that have been identified in Venhola et al. (2018). In Z19, we presented resolved molecular gas maps and H2 masses and deficiencies. In Z20, where we use both Atacama Large Millimeter/submillimeter Array (ALMA) and Multi Unit Spectroscopic Explorer (MUSE) observations (see below), we studied the resolved star formation relation in the Fornax cluster. In this work, we study molecular gas-to-dust ratios in relation to their metallicities.
Recently, a 15° × 15° blind survey, covering the Fornax cluster out to its virial radius, was performed with the Australia Telescope Compact Array (ATCA; Loni et al. 2021). This survey resulted in the detection of 16 Fornax galaxies in H i. 15 of these have CO observations or useful upper limits (i.e. upper limits that provide informative constraints on the H2-to-dust ratio) from AlFoCS, allowing us to study their total gas-to-dust ratios.
Fornax3D (F3D; Sarzi et al. 2018; Iodice et al. 2019b) targeted all galaxies from the Fornax Cluster Catalogue (Ferguson 1989) brighter than mB = 15 within or close to the virial radius (Rvir = 0.7 Mpc; Drinkwater et al. 2001) with MUSE, mounted to the Yepun Unit Telescope 4 at the Very Large Telescope (VLT). Nine of these galaxies were detected (or have a useful upper limit) with AlFoCS and ATCA.
This paper is organized as follows. In Section 2, we describe our sample and observations. In Section 3, we describe the methods used, in particular how any masses and metallicities were estimated. In Section 4, we describe the DustPedia literature sample, to which we compare our results, and any underlying assumptions used to derive the quantities we utilize. In Section 5, we describe the main results. In Section 6, we look into the resolved H2-to-dust ratio in NGC 1436, to highlight any radial or other spatial variation, if present. The main results are discussed in Section 7. Finally, we summarize our findings in Section 8.
Throughout this work, we assume a common distance of 19.95 Mpc (Tonry et al. 2001) to galaxies in the Fornax cluster.
2 SAMPLE SELECTION, OBSERVATIONS, AND DATA REDUCTION
2.1 The sample
Our Fornax sample consists of all AlFoCS galaxies that have far-infrared/sub-millimetre measurements from which dust masses can be estimated reliably (i.e. are detected in ≥3 Herschel bands, implying at least one detection with the Spectral and Photometric Imaging REceiver (SPIRE; Griffin et al. 2010, see Section 2.3). It consists of 15 galaxies, spanning a mass range of 8.3 ≤ log(M⋆/M⊙) ≤ 11.16. Both late-type and ETGs are included in the sample, as well as (irregular) dwarfs. Some of the H2 measurements are upper limits, though these are only included if they provide a useful constraint on the H2-to-dust ratio. Of these galaxies, nine (of which one having a CO upper limit) have MUSE observations from F3D, and can therefore be used to study H2-to-dust ratios as a function of metallicity. This sub-sample spans a stellar mass range of 8.3 ≤ log(M⋆/M⊙) ≤ 11.0. Key parameters of the sample are listed in Table 1. Fornax Cluster Catalogue (FCC; Ferguson 1989) numbers are listed in column one. Corresponding common galaxy names are listed in column 2. Column 3 lists stellar masses, from z = 0 Multiwavelength Galaxy Synthesis (z0MGS; Leroy et al. 2019), or from Fuller et al. (2014) if not available there, indicated with a ‡. Morphological types are given in column 4, from Sarzi et al. (2018) where available, otherwise from older references provided in the table caption. Column 5 lists the projected cluster-centric distance in kpc. Column 6 describes whether the molecular gas reservoir is regular (R) or disturbed (D), as classified in Z19. Column 7 lists XCO, estimated as described in Section 3.1. Molecular gas, atomic gas, and dust masses are listed in columns 8, 9, and 10, respectively. Finally, column 11 lists whether the galaxy is included in F3D (Y) or not (N).
Key properties of the galaxies in the sample.
| FCC | Common name | M⋆ | Type | D | Gas dist. | XCO | M|$_{\text{H}_2}$| | M|$_{\rm{H}{{\small I}}}$| | Mdust | In F3D |
|---|---|---|---|---|---|---|---|---|---|---|
| – | – | (log M⊙) | – | (kpc) | – | 1020 cm−2 (K km s−1)−1 | (log M⊙) | (log M⊙) | (log M⊙) | (Y/N) |
| (1) | (2) | (3) | (4) | (5) | (6) | (7) | (8) | (9) | (10) | (11) |
| 67 | NGC 1351A | 9.56 ± 0.1 | SB(rs)bca | 694 | R | 2.2 ± 0.7 | 7.03 ± 0.07 | 8.67 ± 0.11 | 6.637|$^{+0.051}_{-0.052}$| | N |
| 90 | MGC-06-08-024 | 8.98‡ | E4 pec | 595 | D | 6.6 ± 0.7 | 7.33 ± 0.07 | 7.76 ± 0.16 | 5.234|$^{+0.117}_{-0.114}$| | Y |
| 121 | NGC 1365 | 10.75 ± 0.1 | SB(s)bb | 420 | R | 1.6 ± 0.7 | 9.49 ± 0.04 | 10.18 ± 0.09 | 8.093|$^{+0.029}_{-0.029}$| | N |
| 167 | NGC 1380 | 8.75 ± 0.11 | S0/a | 220 | R | 0.9 ± 0.7 | 7.43 ± 0.06 | ≤7.7 | 5.873|$^{+0.039}_{-0.039}$| | Y |
| 179 | NGC 1386 | 10.92 ± 0.09 | Sa | 226 | R | 1.3 ± 0.7 | 8.25 ± 0.04 | ≤7.7 | 6.569|$^{+0.031}_{-0.032}$| | Y |
| 184 | NGC 1387 | 9.51 ± 0.18 | SB0 | 111 | R | 1.1 ± 0.7 | 8.14 ± 0.04 | ≤7.5 | 6.359|$^{+0.032}_{-0.031}$| | Y |
| 235 | NGC 1427A | 9.1 ± 0.17 | IB(s)mb | 132 | – | 2.6 ± 0.7 | ≤7.42 | 9.32 ± 0.09 | 6.446|$^{+0.113}_{-0.120}$| | N |
| 263 | PGC013571 | 8.75 ± 0.1 | SBcdIII | 292 | D | 11.1 ± 0.7 | 7.88 ± 0.05 | 8.01 ± 0.13 | 5.938|$^{+0.062}_{-0.062}$| | Y |
| 282 | FCC282 | 8.86 ± 0.1 | S0c | 615 | D | 2.8 ± 0.7 | 7.15 ± 0.05 | ≤7.3 | 5.362|$^{+0.085}_{-0.084}$| | N |
| 285 | NGC 1437A | 8.71 ± 0.1 | SAB(s)dmb | 428 | – | 3.7 ± 0.7 | ≤7.83 | 8.75 ± 0.10 | 6.508|$^{+0.212}_{-0.199}$| | Y |
| 290 | NGC 1436 | 10.12 ± 0.1 | ScII | 389 | R | 1.2 ± 0.7 | 8.28 ± 0.05 | 8.21 ± 0.19 | 6.817|$^{+0.037}_{-0.036}$| | Y |
| 306 | FCC306 | 8.68‡ | Sc | 600 | – | 3.9 ± 0.7 | ≤8.10 | 8.03 ± 0.13 | 4.478|$^{+0.322}_{-0.319}$| | N |
| 308 | NGC 1437B | 9.25 ± 0.11 | Sd | 611 | D | 5.8 ± 0.7 | 8.17 ± 0.04 | 8.39 ± 0.11 | 6.597|$^{+0.064}_{-0.068}$| | Y |
| 312 | ESO358-G063 | 10.08 ± 0.11 | Scd | 584 | R | 4.7 ± 0.7 | 8.99 ± 0.05 | 9.23 ± 0.10 | 7.057|$^{+0.029}_{-0.030}$| | Y |
| 335 | ESO359-G002 | 9.17 ± 0.1 | SB0b | 872 | D | 2.4 ± 0.7 | 6.92 ± 0.05 | ≤7.0 | 4.787|$^{+0.101}_{-0.100}$| | N |
Note. 1: Fornax Cluster Catalogue (Ferguson 1989) number of the galaxy; 2: Common name of the galaxy; 3: stellar mass from z0MGS (Leroy et al. 2019), or from Fuller et al. (2014) if not available there, indicated with a ‡; 4: morphological type from Sarzi et al. (2018) if available, otherwise references are listed below; 5: projected distance from brightest cluster galaxy NGC 1399; 6: whether the molecular gas in the galaxy is regular (R) or disturbed (D) as classified in Z19; 7: XCO, estimated as described in Section 3.1; 8: H2 mass from Z19; 9: H i mass from Loni et al. (2021); 10: dust mass calculated from the FIR fluxes published in Fuller et al. (2016); 11: whether the galaxy was observed with MUSE as part of F3D (Y) or not (N).
Lauberts & Valentijn (1989).
de Vaucouleurs et al. (1991).
Loveday (1996).
2.2 CO data
ALMA data for our Fornax cluster targets were analysed in Z19, which describes the data and methods used in detail. We summarize some important details here. ALMA Band 3 observations were carried out between 2016 January 7 and 12 under project ID 2015.1.00497.S (PI: T. Davis), using the main (12m) array in the C36-1 configuration. The data were calibrated manually, clean-ed interactively, using a natural weighting scheme, and continuum subtracted using the Common Astronomy Software Applications package (casa, version 5.1.1; McMullin et al. 2007). The FWHM of the restoring beam is typically between ∼2 and 3 arcsec (equivalent to ∼200–300 pc at the distance of the Fornax cluster). Channel widths are 10 km s−1. Typical rms noise levels are ∼3 mJy per beam. The cleaned data cubes were used to produce moment maps of the 12CO(1–0) line emission using the masked moment method from Dame (2011). These maps were corrected for the primary beam response. Spectra, from which the H2 masses were estimated, were calculated by summing over both spatial directions of the spectral cube, using a square spatial field around the emission. At the distance of the Fornax cluster, the largest scales recoverable with the 12m array are significantly larger than the expected sizes of the largest CO structures the galaxies observed. Therefore, we expect to have recovered the total CO(1–0) flux of each galaxy, and we expect the masses derived in Z19 to be accurate. For one object, NGC 1365, ALMA data were added from the archive (project ID: 2015.1.01135.S, PI: Fumi Egusa, see Z19 for more details). For a more detailed, resolved study of H2-to-dust ratios in NGC 1436, described in Section 6, we use additional, deeper ALMA data from the archive to complement the observations from Z19 (project ID: 2017.1.00129.S, PI: Kana Morokuma, see Section 6 for more details).
2.3 Far-infrared data
The far-infrared (FIR) maps used to estimate dust masses are from the Photoconductor Array Camera and Spectrometer (PACS; Poglitsch et al. 2010; 100 and 160 µm) and the SPIRE (Griffin et al. 2010; 250, 350, and 500 µm), both mounted on the HerschelSpace Observatory (Pilbratt et al. 2010). The SPIRE maps used here are identical to the ones used by DustPedia (Davies et al. 2017, see Section 4), and the PACS maps were reprocessed using the same techniques as DustPedia. The FWHM of the beams of the Herschel maps are ∼6.8, ∼10.7, ∼17.6, ∼23.9, ∼35.2 arcsec at 100, 160, 250, 350, and 500 µm, respectively, corresponding to ∼660, ∼1000, ∼1700, ∼2300, and ∼3400 pc at the distance of the Fornax cluster (see the SPIRE handbook1 and the PACS Observer’s Manual2).
Note that FIR measurements and derived dust masses for the Fornax cluster are already available in Fuller et al. (2014), on which the AlFoCS sample is based. However, since this work was published, several improvements have been made both to the Herschel data reduction and the SED fitting methods. In order to obtain dust masses that are as accurate as possible, we have opted to re-estimate dust masses from improved FIR maps, using updated SED fitting techniques (see Section 3.3). Dust masses calculated here are slightly lower than those published in Fuller et al. (2014), with a median difference of 0.28 dex and a 1σ spread in differences of 0.28 dex.
2.4 H i data
H i data3 are from ATCA, which was used to conduct a blind survey of the Fornax cluster, covering an area of 15 deg2 out to Rvir. The observations and data reduction are presented and described in detail in Loni et al. (2021), and are summarized here. Observations were carried out from 2013 December to 2014 January in the 750B configuration (project code: C2894, PI: P. Serra). The data were reduced manually using the miriad software (Sault, Teuben & Wright 1995). The dirty cube was obtained using the invert task (using natural weighting), after which the tasks mosmem and restor were used to clean and restore the H i emission. The synthesized beam has an FWHM of 95 arcsec × 67 arcsec (corresponding to ∼9 × 6.5 kpc at the distance of the Fornax cluster). Channel widths are 6.6 km s−1. Typical noise levels are 2.8 mJy beam−1 and go down to 2.0 mJy beam−1 in the most sensitive region. H i sources were identified using the sofia source-finding package (Serra et al. 2015). Whether detections are considered reliable is based on the algorithm from Serra, Jurek & Flöer (2012), and by visual inspection where necessary. This has resulted in the detection of H i in 16 Fornax cluster galaxies, of which 15 have CO detections (or useful upper limits) and are thus included in this work. The spatial resolution of the ATCA data is 67 arcsec × 95 arcsec (∼6 × 9 kpc at the distance of the Fornax cluster, see Loni et al. 2021). This means that the H i discs are marginally resolved in this data set.
2.5 Optical spectra
Optical spectra, used to measure the line ratios from which metallicities are estimated, are from F3D (Sarzi et al. 2018; Iodice et al. 2019b). A detailed description of the survey and data reduction can be found in Sarzi et al. (2018), and some important details are summarized here.
Integral-field spectroscopic observations were carried out with MUSE (Bacon et al. 2010, mounted to VLT Unit Telescope 4, ‘Yepun’) in Wide Field Mode, between July 2016 and December 2017. A field of 1 × 1 arcmin2 was covered, with 0.2 × 0.2 arcsec2 spatial sampling. For some of the more extended galaxies, this is smaller than their optical discs. In these cases, two or three pointings were used to map the whole galaxy. An exception is FCC290, which was only observed partially (including the centre and the outskirts to one side, see Sarzi et al. 2018). The MUSE pointings of all F3D galaxies can be found in Sarzi et al. (2018). The observations cover a wavelength range of 4650–9300 Å, with a spectral resolution of 2.5 Å at the full width at half-maximum (FWHM) at 7000 Å and spectral sampling of 1.25 Å pixel−1.
Data reduction was performed using the MUSE pipeline (version 1.6.2; Weilbacher et al. 2012; Weilbacher, Streicher & Palsa 2016) under the ESOREFLEX environment (Freudling et al. 2013). In summary, the data reduction involved bias and overscan subtraction, flat fielding, wavelength calibration, determination of the line spread function, illumination correction with twilight flats (to account for large-scale variation of the illumination of the detectors), and similar with lamp flats (to correct for edge effects between the integral-field units).
3 METHODS
3.1 H2 masses
3.2 H i masses
H i masses are from Loni et al. (2021), who use the prescription from Meyer et al. (2017) to convert integrated fluxes to H i masses. A common distance of 20 Mpc was assumed for all galaxies, a negligible difference with the 19.95 Mpc assumed in this work. In cases where there is no detectable H i, upper limits are calculated. These are estimated as 3× the local rms noise in the ATCA data cube, in one beam, and assuming the linewidths of the corresponding CO(1–0) lines from Z19. The resulting H i masses are summarized in Table 1.
3.3 Dust masses
Dust masses are estimated directly from the Herschel maps described in Section 2.3. To obtain FIR flux measurements for each galaxy, we perform aperture photometry, using the python package photutils (Bradley et al. 2019). Reasonable aperture extents were determined by eye, such that they encompass the dust emission from the entire galaxy (typical semimajor axis sizes vary from 15 arcsec for small galaxies to 400 arcsec for NGC 1365, which is slightly smaller than the extent of the H i disc in that galaxy, and closer to the extent of its stellar disc). To ensure all flux is included even in the lowest-resolution image, we define apertures in the longest wavelength image in which the galaxy is detected. In case there is no detection in each band, upper limits from the non-detected bands are used to constrain the SED at those wavelengths, which is reflected in the uncertainties. Background noise was estimated locally, by defining annuli around the apertures chosen. The flux in these annuli is then subtracted from the measured source flux. Uncertainties were estimated by randomly placing 100 apertures of the same dimensions as the one used for the source randomly in the Herschel map, and calculating the standard deviation in these. This is done for each source in each of the five wavelengths. The maps used are parallel-mode scan maps that cover very large areas (roughly 4|${_{.}^{\circ}}$|6 × 4|${_{.}^{\circ}}$|6, corresponding to ∼1.6 × 1.6 Mpc at the distance of the Fornax cluster). This means that it is relatively easy to find 100 apertures that do not overlap with each other, and there is only a small probability of these random apertures overlapping with other sources. However, to exclude any such overlap from the noise estimate, the resulting flux distributions are clipped beyond 3σ from the median.
For small sources, the SPIRE beam is often larger than the aperture used to measure the flux: the FWHM is up to ∼35 arcsec, depending on the wavelength (see the SPIRE handbook,1 while the radii of our apertures are as small as 15 arcsec for the smallest sources. To account for any missing flux as a result of this, which might result in an underestimation of dust masses (and therefore an overestimation of gas-to-dust ratios), we apply aperture corrections. As the sources are not very extended at Herschel resolutions, we apply the recommended corrections for point sources, provided as part of the SPIRE calibration (Ott 2010; Bendo et al. 2013). These values depend on the aperture radius, which we estimate by taking the arithmetic average of the semimajor and semiminor axes of the elliptical apertures.
For the (log) dust mass, we use a Gamma prior with a standard deviation of 1 dex. To ensure that the code can handle a wide range of dust masses (from a small region of a galaxy to an ULIRG), the mode is programmed to be the flux at the data point closest to the peak of the blackbody. For dust temperature, we also use a Gamma distribution, with a mode of 20K and a standard deviation of 6K. We choose the Gamma distribution as it does not allow for unphysical negative dust temperatures. It is also wider than a Gaussian distribution, which more accurately reflects the wide range of dust mass and temperatures.
The assumed calibration uncertainties are 5 per cent for PACS (Balog et al. 2014), and 1.7 per cent for SPIRE (Bendo et al. 2013), as well as an additional correlated uncertainty of 5 per cent between PACS bands and 4 per cent between SPIRE bands. The correlated and uncorrelated uncertainties were conservatively added linearly for the SPIRE data as recommended by the handbook,1 resulting in a total uncertainty of 5.5 per cent. For an overview of the general limitations of SED fitting techniques (in particular, dust emission in the FIR appearing to be a blend of emission from dust at different temperatures), we refer the reader to Bendo et al. (2015).
3.4 Metallicities
Of course, the choice of metallicity calibrator can significantly impact the resulting metallicity estimates. As can be seen in e.g. Sánchez et al. (2019), who compare various metallicity calibrations as a function of stellar mass, and SFR, the DOP16 calibration shows a relatively steep gradient with stellar mass. It agrees reasonably well with the calibration from PP04 at the low-mass end, with an offset of ∼0.1 dex, while at the higher mass end it over predicts metallicities by up to ∼0.4 dex compared to PP04. A similar study can be found in appendix C of Kreckel et al. (2019). As a result, the use of a different metallicity calibrator would likely result in the higher metallicities becoming somewhat lower, and the opposite for the lowest metallicities. As we will see in Section 5, a different choice of metallicity calibrator (i.e. shifting the data along the x-axes of the figures showing gas-to-dust ratios as a function of metallicity, making the distribution more compact) would not affect our results. More importantly, the DOP16 calibrator was applied to both the Fornax sample and the comparison sample, which means that the offset in gas-to-dust ratio as a function of metallicity between the two would not be different had we chosen another calibrator.
3.5 Stellar masses
Stellar masses are from the z0MGS (Leroy et al. 2019) where available. These are based on data from the Wide-field Infrared Explorer (WISE; Wright et al. 2010) and the Galaxy Evolution Explorer (GALEX; Martin et al. 2005). Leroy et al. (2019) make use of data from the GALEX-SDSS-WISE Legacy Catalog (GSWLC; Salim et al. 2016; Salim, Boquien & Lee 2018), which combines WISE, GALEX, and Sloan Digital Sky Survey (SDSS) observations. In the GSWLC, SED modelling with the Code Investigating GALaxy Emission (CIGALE; Burgarella, Buat & Iglesias-Páramo 2005; Noll et al. 2009; Boquien et al. 2019) was used to yield stellar mass estimates. In Leroy et al. (2019), these data are used to derive calibrations to estimate stellar masses from their sample of WISE and GALEX data. The IMF from Kroupa & Weidner (2003) was assumed.
If stellar masses are not available from z0MGS (this only applies to two dwarf galaxies, FCC090 and FCC306), they are taken from Fuller et al. (2014). Although the stellar masses in Fuller et al. (2014) are estimated differently from those in z0MGS, even a significant error in the stellar masses of these two dwarf galaxies would not affect our results. Stellar masses, along with their sources, are listed in Table 1. The two stellar masses that were taken from Fuller et al. (2014) are indicated with a ‡.
4 THE DUSTPEDIA COMPARISON SAMPLE
In order to compare the dust and gas in our cluster galaxies to those in the field, we use data from the DustPedia project. DustPedia4 (Davies et al. 2017) covers all 875 extended galaxies within 3000 km s−1 observed by the Herschel Space Observatory. Here, we use a sub-sample of DustPedia, consisting of the 209 galaxies for which M|$_{\text{H}_2}$| measurements are available. This sample includes the Herschel Virgo Cluster Survey (HeViCS; Davies et al. 2010) sample from Corbelli et al. (2012). After eliminating Fornax galaxies, we split up this sample in Virgo galaxies and field galaxies. Galaxies are defined to be in the Virgo cluster if they are within twice the virial radius of the Virgo cluster, assumed to be 1.7 Mpc (Fukushige & Makino 2001). This corresponds to ∼5|${_{.}^{\circ}}$|7 at the distance to the Virgo cluster, here assumed to be 16.5 Mpc (Mei et al. 2007). Distances to individual DustPedia galaxies, adopted from the DustPedia database, are redshift-independent distance estimates from HyperLEDA where available, and redshift-independent estimates from the NASA/IPAC Extragalactic Database (NED) if not (more details on redshift-independent distance estimates by HyperLEDA and NED can be found in Makarov et al. 2014 and Steer et al. 2017, respectively). If both are unavailable, bulk flow-corrected redshift-derived values provided by NED are used, assuming a Hubble constant of H0 = 73.24 km s−1 Mpc−1 (Riess et al. 2016). Finally, we create an additional sub-sample of Virgo galaxies located inside the cluster virial radius.
H2 masses for DustPedia galaxies were compiled and homogenized from a wide variety of sources by Casasola et al. (2020). We use their M|$_{\text{H}_2}$| estimates that were derived using a fixed XCO, which we recalibrate to match the metallicity-dependent prescription used in this work.
We adopt dust masses estimated using a modified blackbody model, scaled to match the emissivity of |$\kappa = 0.192 \,{\text{m}^2}\,{\text{kg}}^{-1}$| at 350 μm, used to estimate dust masses of the Fornax sample, and a β-value of 1.790 (Nersesian et al. 2019).
To maximize consistency with our Fornax sample, rather than adopting published metallicities, we apply the DOP16 calibration to the (extinction corrected) line ratios from De Vis et al. (2019). We average metallicities from all detected star forming regions for each galaxy, consistent with the spatially averaged metallicities used to estimate global metallicities in the Fornax sample. Details on the line flux measurements of the DustPedia sample can be found in De Vis et al. (2019) and on the DustPedia website.
Stellar masses of the DustPedia sample were taken from z0MGS, as described in Section 3.5. This means that the stellar masses of the DustPedia sample are fully consistent with the vast majority of the Fornax sample, with the exception of only the two objects discussed in Section 3.5.
Thus, as explained above, the dust, H2, H i, and stellar masses we use here are calculated identically for both our Fornax and the DustPedia comparison sample, and so can be directly compared.
4.1 Other literature samples
There are several other literature samples that have molecular gas, atomic gas, and dust masses available, as well as stellar masses and/or metallicities. These include the samples compiled by Rémy-Ruyer et al. (2014), such as the Dwarf Galaxy Survey (DGS; Madden et al. 2013), and Key Insights on Nearby Galaxies: a Far-Infrared Survey with Herschel (KINGFISH; Kennicutt et al. 2011), the sub-sample of LITTLE THINGS from Cigan et al. (in preparation), and several others. Unfortunately, it has proven impossible to recalibrate these samples to rely on the same assumptions as the Fornax and DustPedia samples studied here. Therefore, they were not included in this work. Homogenizing these datasets to follow the same assumptions used here (as far as is possible) suggests our conclusions above also hold in comparison to these samples.
5 ANALYSIS
5.1 Gas-to-dust ratios
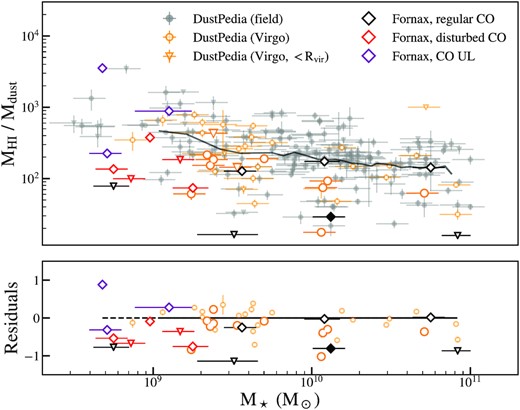
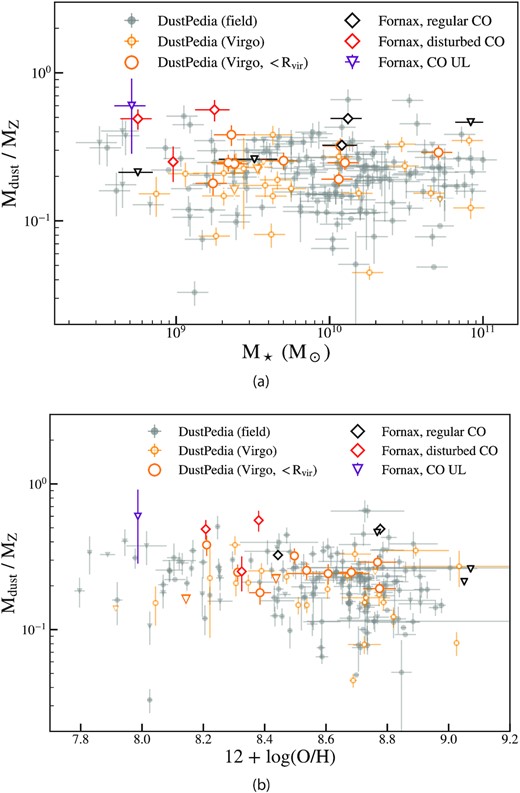
In order to examine the effect of the Fornax cluster environment on the gas and dust in galaxies, we construct gas-to-dust ratios for our sample galaxies (listed in Table 2). We also tabulate the offset between the gas-to-dust ratio of each Fornax galaxy and the median gas-to-dust ratio of field galaxies at the same stellar mass, and metallicity for the nine galaxies for which MUSE data from F3D is available, (calculated using the DustPedia field galaxy sample). For comparison, we also include the DustPedia Virgo galaxies in our analysis. Total gas-to-dust ratios are shown in Figs 1 and 2, as a function of stellar mass and metallicity, respectively. Similarly, Figs 3 and 4 show the H2-to-dust ratio, and Figs 5 and 6 the H i-to-dust ratio. Fornax galaxies are plotted as diamond-shaped markers. Galaxies with regular molecular gas reservoirs are shown in black, and those with disturbed molecular gas reservoirs in red (as classified in Z19). CO upper limits (for which the molecular gas morphology is unknown) are shown in purple. Virgo galaxies are shown in orange, with galaxies inside the virial radius highlighted with larger markers. The DustPedia field sample is shown with grey markers. Upper limits are shown as downward-facing triangles for all samples. The solid, grey line represents the rolling median of the DustPedia field sample, which is calculated using bins with a fixed number of 10 galaxies, overlapping by half a bin size. The bottom panels in these figures show the residuals of Fornax and Virgo galaxies compared to this median, which is shown as a black solid line, or a black dashed line where extrapolated.
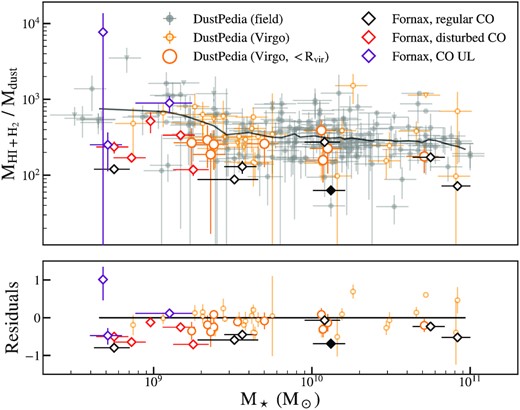
Upper panel: Total gas-to-dust (H i + H2) ratios in the Fornax cluster compared to those in the DustPedia (Davies et al. 2017) field (grey) and Virgo (orange) samples. Virgo galaxies inside Rvir are highlighted with larger markers. Fornax galaxies are indicated with diamond-shaped markers, in black for galaxies with regular CO emission and in red for galaxies with disturbed CO emission as classified in Z19 (upper limits are shown in purple). NGC 1436 (see Section 6) is indicated with a filled diamond-shaped marker. Upper limits are indicated with downward-facing triangles for all samples. The solid grey line indicates the rolling median of the DustPedia field sample. Lower panel: Residuals of gas-to-dust ratios in Fornax and Virgo cluster galaxies compared to the rolling median of DustPedia field galaxies, shown as a solid line, or a dashed line where extrapolated. Note that, for the purpose of visibility, the bottom panel is set to show values between −1.5 and 1.5, which causes the strongly discrepant galaxy FCC067 (NGC 1351A) to fall off the plot in some of the following figures. According to KS tests, Fornax galaxies and Virgo galaxies inside Rvir have systematically lower gas-to-dust ratios than field galaxies at fixed stellar mass (see Table 3).
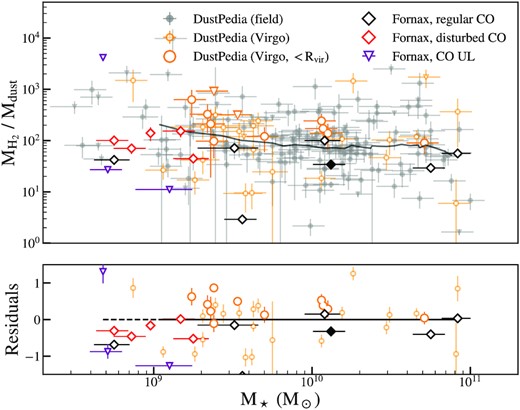
Similar to Fig. 1, but showing molecular gas-to-dust ratios plotted as a function of stellar mass. Fornax cluster galaxies have systematically lower molecular gas-to-dust ratios than field galaxies, whereas Virgo galaxies inside Rvir show increased H2-to-dust ratios.
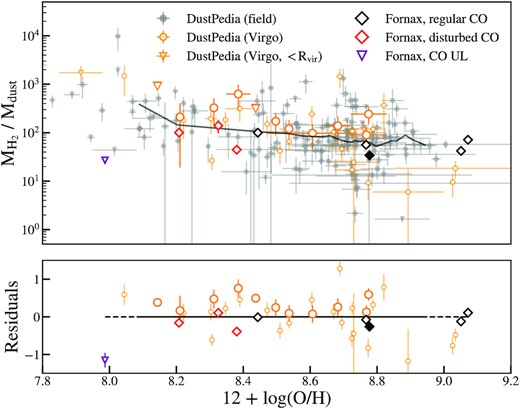
Similar to Fig. 2, but showing molecular gas-to-dust ratios as a function of metallicity. Molecular gas-to-dust ratios of Fornax galaxies are systematically lower than those of field galaxies at fixed metallicity, while those inside the virial radius of the Virgo cluster are increased.
Similar to Fig. 1, but showing H i-to-dust ratios as a function of stellar mass. Fornax galaxies and Virgo galaxies inside the virial radius have systematically lower H i-to-dust ratios than galaxies in the field at fixed stellar mass. A possible decrease is also seen in Virgo galaxies between 1 and 2 Rvir.
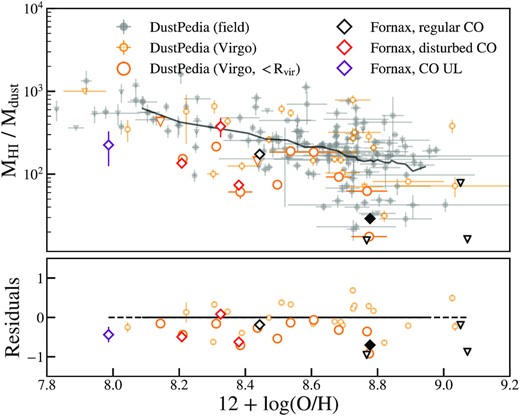
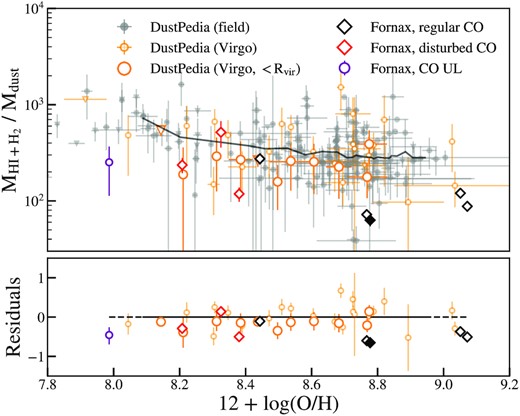
Similar to Fig. 2, but showing H i-to-dust ratios as a function of metallicity. These are systematically lower in Fornax cluster galaxies and Virgo galaxies inside Rvir compared to field galaxies at fixed metallicity.
Estimated gas-to-dust ratios and residuals of galaxies in the sample.
| Object | Total gas/dust | Res. (M⋆) | Res. (Z) | M|$_{\text{H}_2}$|/dust | Res. (M⋆) | Res. (Z) | M|$_{\text{H}\rm {\small I}}$|/dust | Res. (M⋆) | Res. (Z) |
|---|---|---|---|---|---|---|---|---|---|
| – | – | (dex) | (dex) | – | (dex) | (dex) | – | (dex) | (dex) |
| (1) | (2) | (3) | (4) | (5) | (6) | (7) | (8) | (9) | (10) |
| FCC067 | 110|$^{+ 20 } _{- 20 }$| | −0.75 | – | 2|$^{+ 0 } _{- 0 }$| | −1.97 | – | 100|$^{+ 10 } _{- 10 }$| | −0.67 | – |
| FCC090 | 460|$^{+ 150 } _{- 140 }$| | −0.13 | 0.02 | 130|$^{+ 20 } _{- 20 }$| | −0.26 | −0.06 | 340|$^{+ 90 } _{- 90 }$| | −0.18 | −0.07 |
| FCC121 | 150|$^{+ 20 } _{- 20 }$| | −0.62 | – | 25|$^{+ 1 } _{- 1 }$| | −0.96 | – | 120|$^{+ 10 } _{- 10 }$| | −0.62 | – |
| FCC167 | 60|$^{+ 10 } _{- 50 }$| | −1 | −0.65 | 36|$^{+ 3 } _{- 3 }$| | −0.8 | −0.05 | ≤25 | −1.3 | −0.55 |
| FCC179 | 50|$^{+ 10 } _{- 50 }$| | −1.06 | −0.74 | 48|$^{+ 2 } _{- 2 }$| | −0.68 | −0.14 | ≤5 | ≤−1.95 | ≤−1.41 |
| FCC184 | 70|$^{+ 10 } _{- 70 }$| | −0.96 | −0.62 | 60|$^{+ 3 } _{- 3 }$| | −0.58 | 0.17 | ≤6 | ≤−1.88 | ≤−1.14 |
| FCC235 | 760|$^{+ 200 } _{- 210 }$| | 0.09 | – | ≤9|$^{+ 1 } _{- 1 }$| | ≤−1.39 | – | 750|$^{+ 200 } _{- 210 }$| | 0.17 | – |
| FCC263 | 210|$^{+ 40 } _{- 40 }$| | −0.48 | −0.41 | 90|$^{+ 10 } _{- 10 }$| | −0.42 | −0.37 | 120|$^{+ 20 } _{- 20 }$| | −0.63 | −0.61 |
| FCC282 | 140|$^{+ 30 } _{- 100 }$| | −0.64 | – | 60|$^{+ 10 } _{- 10 }$| | −0.57 | – | ≤79 | −0.81 | – |
| FCC285 | 200|$^{+ 100 } _{- 90 }$| | −0.5 | −0.57 | ≤21|$^{+ 4 } _{- 4 }$| | ≤−1.04 | ≤−1.52 | 170|$^{+ 90 } _{- 80 }$| | −0.46 | −0.53 |
| FCC290 | 50|$^{+ 10 } _{- 10 }$| | −1.06 | −0.72 | 29|$^{+ 2 } _{- 2 }$| | −0.9 | −0.32 | 24|$^{+ 2 } _{- 2 }$| | −1.31 | −0.76 |
| FCC306 | 8000|$^{+ 6000 } _{- 6000}$| | 1.1 | – | ≤4200|$^{+ 1300} _{- 1300}$| | ≤1.26 | – | 4000|$^{+ 3000} _{- 3000}$| | 0.85 | – |
| FCC308 | 100|$^{+ 20 } _{- 20 }$| | −0.79 | −0.58 | 37|$^{+ 3 } _{- 3 }$| | −0.79 | −0.51 | 62|$^{+ 9 } _{- 9 }$| | −0.91 | −0.7 |
| FCC312 | 240|$^{+ 30 } _{- 30 }$| | −0.42 | −0.21 | 90|$^{+ 10 } _{- 10 }$| | −0.43 | −0.15 | 150|$^{+ 10 } _{- 10 }$| | −0.53 | −0.32 |
| FCC335 | 450|$^{+ 120 } _{- 270 }$| | −0.14 | – | 140|$^{+ 20 } _{- 20 }$| | −0.23 | – | ≤311 | ≤−0.21 | – |
Note. 1: Object name according to the Fornax Cluster Catalogue; 2: total gas-to-dust ratio (|$\left[{M}_{\text{H}\rm {\small I}}+{M}_{\text{H}_2}\right]/{D}$|); 3: total gas-to-dust residual compared to the DustPedia median as a function of stellar mass (see Fig. 1); 4: total gas-to-dust residual compared to the DustPedia median as a function of metallicity (see Fig. 2); 5: H2-to-dust ratio; 6: H2-to-dust residual compared to the DustPedia median as a function of stellar mass (see Fig. 3); 7: H2-to-dust residual compared to the DustPedia median as a function of metallicity (see Fig. 4); 8: H i-to-dust ratio; 9: H i-to-dust residual compared to the DustPedia median as a function of stellar mass (see Fig. 5); 10: H i-to-dust residual compared to the DustPedia median as a function of metallicity (see Fig. 6).
In Figs 1 and 2, we can see that total gas-to-dust ratios in the Fornax cluster are low compared to the field, both at fixed stellar mass and metallicity. This also applies to galaxies in the Virgo cluster, especially inside its virial radius. Figs 3 and 4 show that molecular gas-to-dust ratios are also decreased in the Fornax cluster compared to the field. However, galaxies in the Virgo cluster show the opposite result: they are (marginally, but systematically) increased compared to the field. Finally, Figs 5 and 6 show that H i-to-dust ratios are decreased in both the Fornax and Virgo clusters, although the difference between the Virgo cluster and the field is smaller if galaxies located inside 2Rvir are included. In the Fornax cluster, there is no significant difference in gas-to-dust ratio between galaxies with regular and disturbed CO reservoirs in any of the figures.
We quantify the results described above by applying Kolmogorov–Smirnov (KS) tests and Anderson–Darling (AD) tests to the residuals of the Fornax and Virgo data compared to DustPedia in all six figures. Because these tests do not take into account uncertainties, we use a Monte Carlo approach to make sure these are implemented in the final result. We perturb each value by a random number drawn from a normal distribution with μ the measured value and σ the associated uncertainty. This is done 106 times, after which the μ and σ of the resulting distribution of the KS and AD statistics are adopted as the test results. These are summarized in Table 3. The KS statistic is between 0 and 1, and the closer to 1 it is, the less likely it is that both samples are drawn from the same distribution. The AD test returns a statistic (referred to as the A2 statistic) as well as corresponding critical values at a discrete number of confidence intervals. The null-hypothesis that both samples are drawn from the same distribution can be rejected with a certain probability if the difference between the A2 statistic and the critical level is positive at the corresponding confidence level. In Table 3, we report the difference between the A2 statistic and the critical value at 0.1 per cent.
| Fornax | Virgo (inside Rvir) | Virgo (inside 2Rvir) | ||||||
|---|---|---|---|---|---|---|---|---|
| Figure | x-axis | y-axis | D statistic | A2 – crit. | D statistic | A2 – crit. | D statistic | A2 – crit. |
| (1) | (2) | (3) | (4) | (5) | (6) | (7) | (8) | (9) |
| 1 | M⋆ | M|$_{\rm{H\rm {\small I}} + \rm{H}_2}$| | 0.98 ± 0.005 | 28 ± 1 | 0.98 ± 0.05 | 22 ± 2 | 0.98 ± 0.06 | 59 ± 6 |
| 3 | M⋆ | M|$_{\rm{H}_2}$| | 0.89 ± 0.01 | 17 ± 2 | 0.89 ± 0.07 | 8 ± 3 | 0.87 ± 0.12 | 31 ± 9 |
| 5 | M⋆ | M|$_\rm{H\rm {\small I}}$| | 0.79 ± 0.28 | 12 ± 12 | 0.99 ± 0.14 | 20 ± 6 | 0.99 ± 0.15 | 49 ± 12 |
| 2 | 12 + log(O/H) | M|$_{\rm{H\rm {\small I}} + \rm{H}_2}$| | 0.99 ± 0.03 | 17 ± 1 | 0.99 ± 0.04 | 20 ± 2 | 0.99 ± 0.04 | 46 ± 4 |
| 4 | 12 + log(O/H) | M|$_{\rm{H}_2}$| | 0.99 ± 0.006 | 17 ± 1 | 0.99 ± 0.04 | 20 ± 2 | 0.98 ± 0.06 | 46 ± 4 |
| 6 | 12 + log(O/H) | M|$_\rm{H\rm {\small I}}$| | 0.99 ± 0.04 | 17 ± 2 | 0.99 ± 0.09 | 20 ± 4 | 0.99 ± 0.08 | 46 ± 6 |
Note. 1: Reference to the figure showing the data the KS test is applied to; 2: x-axis of that figure; 3: y-axis of that figure; 4, 6, 8: D-statistic resulting from the KS test applied to the Fornax, Virgo inside Rvir, and Virgo inside 2Rvir data, respectively, including uncertainties from a Monte Carlo analysis; 5, 7, 9: difference between the A2 statistic and critical value at the 0.1 per cent confidence level resulting from an Anderson–Darling test applied to the Fornax, Virgo inside Rvir, and Virgo inside 2Rvir data, respectively.
| Fornax | Virgo (inside Rvir) | Virgo (inside 2Rvir) | ||||||
|---|---|---|---|---|---|---|---|---|
| Figure | x-axis | y-axis | D statistic | A2 – crit. | D statistic | A2 – crit. | D statistic | A2 – crit. |
| (1) | (2) | (3) | (4) | (5) | (6) | (7) | (8) | (9) |
| 1 | M⋆ | M|$_{\rm{H\rm {\small I}} + \rm{H}_2}$| | 0.98 ± 0.005 | 28 ± 1 | 0.98 ± 0.05 | 22 ± 2 | 0.98 ± 0.06 | 59 ± 6 |
| 3 | M⋆ | M|$_{\rm{H}_2}$| | 0.89 ± 0.01 | 17 ± 2 | 0.89 ± 0.07 | 8 ± 3 | 0.87 ± 0.12 | 31 ± 9 |
| 5 | M⋆ | M|$_\rm{H\rm {\small I}}$| | 0.79 ± 0.28 | 12 ± 12 | 0.99 ± 0.14 | 20 ± 6 | 0.99 ± 0.15 | 49 ± 12 |
| 2 | 12 + log(O/H) | M|$_{\rm{H\rm {\small I}} + \rm{H}_2}$| | 0.99 ± 0.03 | 17 ± 1 | 0.99 ± 0.04 | 20 ± 2 | 0.99 ± 0.04 | 46 ± 4 |
| 4 | 12 + log(O/H) | M|$_{\rm{H}_2}$| | 0.99 ± 0.006 | 17 ± 1 | 0.99 ± 0.04 | 20 ± 2 | 0.98 ± 0.06 | 46 ± 4 |
| 6 | 12 + log(O/H) | M|$_\rm{H\rm {\small I}}$| | 0.99 ± 0.04 | 17 ± 2 | 0.99 ± 0.09 | 20 ± 4 | 0.99 ± 0.08 | 46 ± 6 |
Note. 1: Reference to the figure showing the data the KS test is applied to; 2: x-axis of that figure; 3: y-axis of that figure; 4, 6, 8: D-statistic resulting from the KS test applied to the Fornax, Virgo inside Rvir, and Virgo inside 2Rvir data, respectively, including uncertainties from a Monte Carlo analysis; 5, 7, 9: difference between the A2 statistic and critical value at the 0.1 per cent confidence level resulting from an Anderson–Darling test applied to the Fornax, Virgo inside Rvir, and Virgo inside 2Rvir data, respectively.
Both tests return similar results in all cases. In almost all cases, the null-hypothesis that the Fornax and Virgo samples are drawn from the same distribution as the DustPedia field sample can be rejected. The exception is the Fornax H i mass as a function of stellar mass, for which the spread in both statistics is too large to draw strong conclusions.
5.2 Variation with cluster-centric distance
In Fig. 7, we show gas-to-dust ratios as a function of projected cluster-centric distance for both clusters, which are represented by the same colours as in previous figures. These distances are normalized by each cluster’s virial radius, indicated by a black dashed line. There is no clear relation between gas-to-dust ratio and cluster-centric radius for either of the clusters, although there is a possible increase in gas-to-dust ratio with cluster-centric radius in the Virgo cluster (a Kendall’s Tau test returns a tau statistic of 0.23 and a p-value of 0.04). In the Virgo cluster, there is evidence that H i deficiencies decrease with cluster-centric radius (e.g. Haynes & Giovanelli 1986; Gavazzi et al. 2005), which could explain this possible trend. If H i deficiencies were the main driver of the decreased gas-to-dust ratios in the Fornax cluster, we might expect to also see such a trend in this cluster. However, no such trend is seen in Fig. 7, although we only have a small sample of Fornax cluster objects.
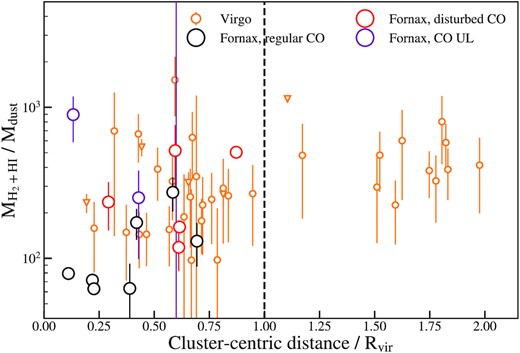
Total gas-to-dust ratios as a function of relative (projected) distance to the cluster centre are shown with colours and markers similar to those in Fig. 3. The virial radius is indicated with a black dashed line. No significant gradient in gas-to-dust fractions is observed in any of the clusters, although there is possibly a slight increase in gas-to-dust radio with cluster-centric radius in the Virgo cluster (a Kendall’s Tau test returns a tau statistic of 0.23 and a p-value of 0.04).
5.3 Gas and dust fractions
To better understand whether the decreased H2-to-dust ratios in the Fornax cluster are mostly the result of increased dust fractions, or decreased H2 fractions, we show these as a function of stellar mass in Fig. 8. (Fig. 8a shows dust fractions and Fig. 8b H2 fractions.) Markers and symbols are the same as in previous figures. The dust content in most Fornax galaxies is normal to low compared to the DustPedia field sample, with the exception of a few dwarf galaxies, and NGC 1365 at the high-mass end. The scatter in the H2 fractions in Fig. 8(b) is similar to that in Fig. 8(a), however there is a more pronounced systematic offset towards lower H2 fractions in the Fornax cluster compared to the field. This suggests the difference seen in the Fornax cluster is driven by the lower H2 content of these galaxies. In Virgo, dust fractions are normal to slightly decreased inside the virial radius, whereas H2 fractions are increased, especially in low-stellar mass galaxies. Outside Rvir no difference with the DustPedia field sample is seen.
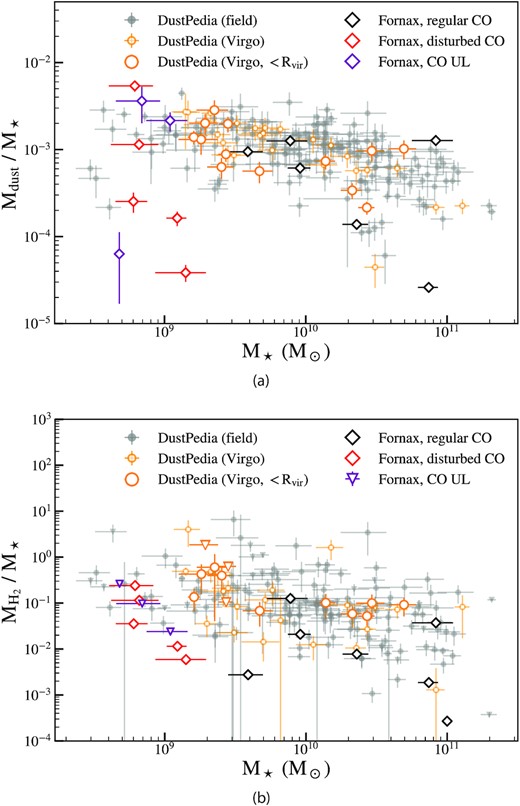
Dust- and molecular gas-to-stellar mass fractions (panel a and panel b, respectively) in the Fornax cluster compared to the field and the Virgo cluster. Samples and symbols are the same as in previous figures. While both are low, molecular gas-to-stellar mass fractions in the Fornax cluster are especially low compared to the field and the Virgo cluster. The dust content in the Virgo cluster is normal to slightly decreased, whereas molecular gas-to-stellar mass fractions are normal to slightly increased, in particular at low stellar mass.
5.4 Dust-to-metal ratios
Dust-to-metal ratios as a function of stellar mass (panel a) and metallicity (panel b). Samples and symbols are the same as in previous figures. Dust-to-metal ratios in Fornax cluster galaxies are significantly higher than those in field galaxies of similar mass and metallicity, which means that a relatively large fraction of the metals in these galaxies are locked up in dust grains. Virgo galaxies inside Rvir also show a slight, but less significant, increase in dust-to-metal ratio at fixed stellar mass. This difference is less clear at fixed metallicity.
6 RESOLVED GAS-TO-DUST RATIOS IN NGC 1436
Any (radial) trend in the gas-to-dust ratio could give us a hint as to what process might be responsible for the low gas-to-dust (total, H2, and H i) ratios observed (e.g. the outside-in removal of dust). To investigate whether there might be any radial H2-to-dust gradients present in these Fornax galaxies with low gas-to-dust ratios, and whether the H2-to-dust ratio differs between star forming and more passive regions, we study the spatially resolved H2-to-dust ratio in NGC 1436. While it would be preferred to study resolved total gas-to-dust ratios, this is not feasible, as the ATCA beam is >20 times larger than the ALMA beam (and a similar size to the entire molecular disc of this object). This will be done in a future paper (Loni et al. 2021), after completion of the MeerKAT Fornax Survey (Serra et al. 2016).
NGC 1436 is an almost face-on, flocculent spiral (Fig. 10, see also Z19 and Z20), making it an ideal candidate to study resolved properties of cluster galaxies in more detail, and currently the only galaxy in our sample for which this is possible. NGC 1436 is highly H i-deficient, and has a high H2-to-H i ratio (Loni et al. 2021). It has been suggested that this galaxy is undergoing a morphological transition into a lenticular, based on the absence of a clear spiral structure in its outer regions (Raj et al. 2019). From Figs 1 through 5, where NGC 1436 is highlighted with a filled diamond symbol, we can see that it has a decreased gas-to-dust ratio, and that this is partly driven by a decreased H2-to-dust ratio, in addition to a decreased H i-to-dust ratio.
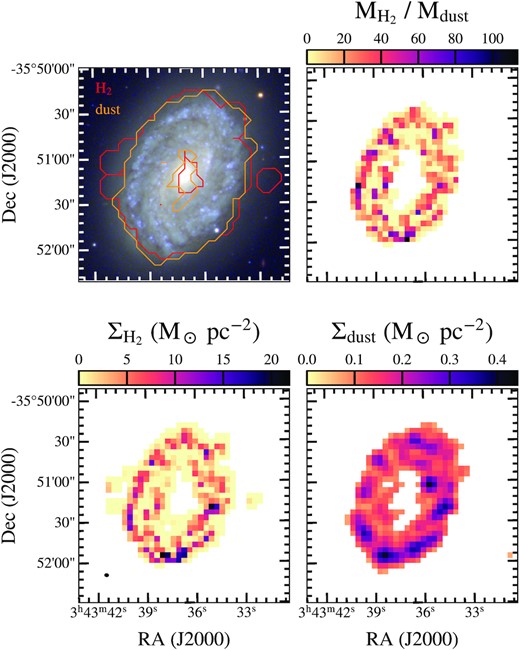
Resolved H2 and dust properties in the flocculent spiral NGC 1436. Upper left panel: optical ugb-image with the extent of the H2 (red) and dust (orange) emission overplotted. Upper right panel: resolved H2-to-dust ratios. Lower-left panel: H2 surface density at the resolution of the PACS 100 µm emission. Bottom-right panel: dust surface density at the PACS 100 µm resolution from ppmap. The beam of the CO observations is shown in the bottom-left corner of the bottom-left panel. There is no clear spatial trend in the H2-to-dust ratios in this galaxy.
To ensure we have as complete as possible information on the CO emission, we combine our AlFoCS data with deep observations from the ALMA archive (project ID: 2017.1.00129.S, PI: Kana Morokuma). As part of this programme NGC 1436 was observed on 2017 November 30 using the Morita array (see Morokuma-Matsui et al. 2019 for a description of the data for NGC 1316 from this survey). Its primary beam size is ∼90 arcsec at ∼115 GHz, and the total area covered is ∼182 arcsec2. The spectral window covering the 12CO(1–0) was centred on 114.756 GHz, with a bandwidth of 1.875 GHz, covering 3840 channels. The spectral resolution is 5.06 km s−1.
We reduced this data using the casa pipeline (version 5.4.0-68; McMullin et al. 2007) before combining it with our own data using the task concat. We then imaged the resulting data set by cleaning it interactively, using the task tclean (Högbom 1974). A Briggs weighting scheme was used (Briggs 1995) with a robust parameter of 0.5. The pixel size in the final datacube is 0.5 arcsec, and the velocity resolution is 10 km s−1. The synthesized beam size is ∼2.68 arcsec × 2.06 arcsec. The sensitivity reached is ∼2.046 mJy per beam.
Resolved dust surface densities are estimated using ppmap. ppmap (Marsh, Whitworth & Lomax 2015) is a Bayesian point-process fitting algorithm that produces image cubes of differential column density as a function of dust temperature and position. Unlike traditional SED fitting techniques that require all images to be convolved to match the angular resolution of the lowest resolution image, ppmap uses all images in their native resolution (PSFs of each image are also taken as inputs). In our case, this means that we can estimate and plot dust column densities in NGC 1436 at the PACS 100 μm resolution (FWHM ≈ 10 arcsec), the highest resolution of the range of Herschel images used to estimate its dust properties.
The resulting images are shown in Figs 10 and 11. In the upper-left panel of Fig. 10 the extent of the CO (red) and dust (orange) emission is shown (both are clipped to the 3σ level), overplotted on an optical ugb-image from the FDS. In the upper-right panel, H2-to-dust ratios within the galaxy are shown. The bottom-left and bottom-right panels show the H2 and dust surface densities, respectively. Fig. 11 shows the radial profile of the H2-to-dust ratio, corresponding to the top-right panel in Fig. 10. Each marker corresponds to the average H2-to-dust ratio in an elliptical annulus (the sum of the ratio in each pixel divided by the total area of the annulus) at each radius, where the radius corresponds to the semimajor axis of the annulus.
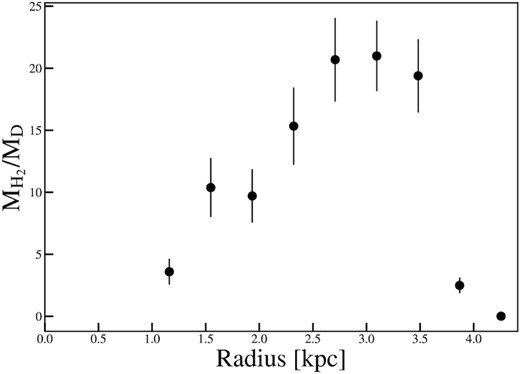
Radial profile of the H2-to-dust ratio in NGC 1436. It increases with radius, and drops off sharply at R ≈ 3.5 kpc. The observed gradient implies that outside-in stripping of the gas/dust disc could result in lower integrated H2-to-dust ratios. It could also imply that dust is more easily removed from the outer parts of the disc than molecular gas.
There are small-scale variations in the H2-to-dust ratio. Peaks in the H2-to-dust ratio appear to mainly correlate with peaks in the H2 surface density. There is an increase in H2-to-dust ratio with radius, after which it drops off sharply at R ≈ 3.5 kpc. This means that the outside-in stripping of the gas/dust disc could result in lower integrated H2-to-dust ratios. It could also mean that dust is more easily removed from the outer parts of the disc than molecular gas, causing the gradient observed.
The average H2-to-dust ratio does not exceed ∼20 at any radius. This suggests that molecular gas, and likely also dust, can be affected by environment even in the inner parts of galaxies. A comparison with the star formation dominated H α map from MUSE (from F3D, see Section 2.5) shows no clear correlation between star forming regions and variations in the H2-to-dust ratio.
7 DISCUSSION
7.1 Low gas-to-dust ratios in the Fornax cluster
In Section 5.1, we have shown that gas-to-dust ratios in Fornax galaxies are suppressed compared to a field comparison sample at fixed stellar mass and metallicity. Decreased total gas-to-dust ratios might be expected in clusters as a result of stripping and truncation of H i discs, which typically have scale lengths much larger than H2. Indeed, this is observed both in Fornax cluster galaxies and Virgo galaxies (Figs 1 and 2). The low gas-to-dust ratios in the Fornax cluster are partly driven by decreased H i-to-dust ratios compared to field galaxies at fixed mass (Figs 5 and 6). However, these low H i-to-dust ratios are not the full story. H2-to-dust ratios are also significantly decreased in the Fornax cluster (Figs 3 and 4). In Fig. 8, we can see that, while dust fractions are decreased in the Fornax cluster compared to field galaxies at fixed stellar mass (panel a), molecular gas fractions are even more strongly decreased (panel b). Broadly, there are three ways in which we could end up with the H2-to-dust ratios observed:
H2 is destroyed/removed more efficiently than dust,
both dust and H2 are destroyed, but the dust reservoir is replenished more efficiently than the H2 reservoir,
the physics of the ISM in these cluster galaxies is unusual such that ‘standard’ observational probes fail to return accurate H2-to-dust ratios.
7.1.1 Option (i): H2 is destroyed/removed more efficiently than dust
Molecular gas could be destroyed/removed more efficiently than dust by the cluster environment if our sample galaxies had strong radial H2-to-dust gradients, and their gas discs were truncated from the outside in (i.e. by ram pressure stripping). If this is the case, we are seeing the ‘relic’ of a gas/dust reservoir that was larger before the galaxies fell into the cluster. This could alter the total H2-to-dust mass ratio we would measure. For example, Bekki (2014) shows that ram pressure stripping can lead to more centrally concentrated star formation. Studies of nearby galaxies and galaxies in the Virgo cluster are inconclusive as to whether such radial molecular gas-to-dust ratios are observed. Several studies suggest that observed molecular gas-to-dust gradients are driven by a metallicity gradient (i.e. a radial change in XCO, Bendo et al. 2010; Magrini et al. 2011; Pappalardo et al. 2012). Therefore, it is unclear whether an actual (non-XCO-driven) gradient in gas-to-dust ratio is also present.
Cortese et al. (2010) find that the dust discs of H i-deficient galaxies are truncated as well as the H i discs. Corbelli et al. (2012) find that gas-to-dust ratios decrease as H i-deficiency increases, but only up to a certain deficiency threshold, after which they remain constant. H i-deficiency is defined as the difference between the observed H i mass and that expected in an isolated galaxy. This is because in highly disturbed galaxies both gas and dust are stripped from the inner parts of the galaxies. However, they also find stronger dust than H2 deficiencies in these galaxies. This suggests that, although H i-deficient galaxies have lower gas-to-dust ratios, and both H2 and dust can be stripped from their inner parts, H2-to-dust ratios in these galaxies remain constant, or even increase slightly. This is also observed by Cortese et al. (2016) and in Virgo galaxies in this work, and is discussed further in Section 7.2. Since truncation of the gas/dust disc is concluded to result in an increase in H2-to-dust ratios in these two studies, which is also seen here in the Virgo cluster, it is unlikely to be the explanation for the H2-to-dust ratios observed in Fornax. Observations of the molecular gas and dust in FCC167 (NGC 1380, included in this sample) show a nested ISM, in which the dust extends further out than the molecular gas (Viaene et al. 2019). This could indeed mean that the molecular gas in this galaxy was stripped more severely than the dust. However, the molecular gas disc in this galaxy is extremely truncated (e.g. Viaene et al. 2019; Z19), and it is unclear how representative this is for the rest of the sample. The observed radial increase in H2-to-dust ratio in NGC 1436 (see Fig. 11) suggests that the stripping of the outer parts of the disc could indeed result in lower integrated H2-to-dust ratios.
Fig. 12 shows a histogram of the ratio of RCO and effective radius Re (as estimated from the FDS; Venhola et al. 2018; Iodice et al. 2019a; Raj et al. 2019; Peletier et al. 2020) in the Fornax cluster (crimson) compared to this ratio in a field sample of gas-rich ETGs from ATLAS3D (Davis et al. 2013) and nearby spiral galaxies from the Berkeley–Illinois–Maryland Association Survey of Nearby Galaxies (BIMA SONG; Regan et al. 2001) in lilac. Although the numbers are small, there is no evidence that Fornax cluster galaxies have smaller RCO/Re than the field sample (a KS test is not able to reject the null-hypothesis that the Fornax and ATLAS3D/BIMA SONG samples are drawn from the same distribution, D = 0.29, p = 0.5–0.67σ).
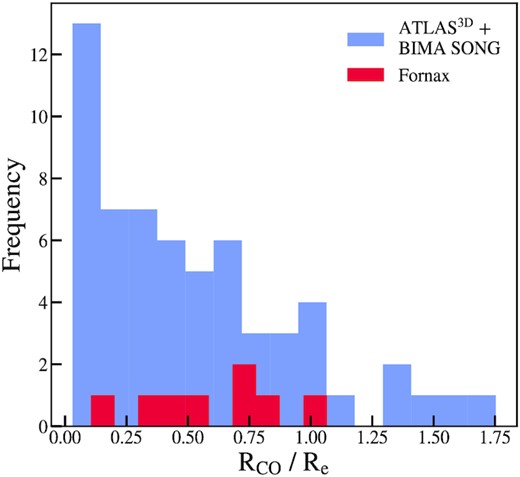
Histogram of RCO/Re in the Fornax cluster (crimson) compared to a field sample consisting of gas-rich ETGs from ATLAS3D (Davis et al. 2013) and spiral galaxies from BIMA SONG (Regan et al. 2001), shown in lilac. Fornax cluster galaxies do not have more significantly truncated CO than the field galaxies (a KS test is not able to reject the null-hypothesis that the Fornax and ATLAS3D/BIMA SONG samples are drawn from the same distribution, D = 0.29, p = 0.5–0.67σ).
In order to more generally test whether truncation could play a significant role in creating low H2-to-dust ratios, we create a toy model consisting of an exponential gas/dust disc, with a molecular gas-to-dust ratio that increases linearly outward. We then explore the parameter space describing the shape of the exponential disc and the molecular gas-to-dust gradient resulting in the observed H2 deficiencies (see table 3 in Z19) and molecular gas-to-dust ratios, using a Markov chain Monte Carlo approach. We fix H2 deficiencies and molecular gas-to-dust ratios at the more conservative observed values of 1 and 200, respectively, before truncation, and −1 and 100, respectively, after truncation (see Tables 2 and 3 in Z19). Truncation is simulated by removing apercentage of the disc from the outside in. This percentage is a free parameter. Although, inevitably, there is a high degree of degeneracy in the parameters describing the exponential disc, it is clear that we would need very steep H2-to-dust gradients and severe truncation (>80 per cent of the gas/dust disc) for this to explain the range of H2-to-dust mass ratios and H2-deficiencies observed. Therefore, based on this toy model, truncation in combination with a H2-to-dust gradient is unlikely to be the sole explanation of the decreased H2-to-dust ratios observed. In reality, the spatial extent of the dust may exceed that of the molecular gas, as, for example, observed the nearby spiral galaxy NGC 2403 (Bendo et al. 2010). This implies that it would be removed by ram pressure stripping before the molecular gas, as suggested by Cortese et al. (2016). This implies that it would be even more difficult to remove significant amounts of molecular gas compared to dust in this way.
7.1.2 Option (ii): the dust reservoir is replenished more efficiently than the H2 reservoir
If dust is created at a higher rate than H2 in the star formation cycle, this could result in decreased gas-to-dust ratios. Both gas and dust are observed in supernova remnants (see Matsuura 2017 for a review). Recent, in-depth studies of supernova remnants have shown that large amounts of dust can be produced in supernovae (Dunne et al. 2003; De Looze et al. 2017, 2019; Cigan et al. 2019; Priestley, Barlow & De Looze 2019). Gas, on the other hand, is produced in relatively small quantities, resulting in gas-to-dust ratios in supernova remnants that are much smaller (5–10 times) than typical ISM values (Owen & Barlow 2015; Matsuura et al. 2017; Arias et al. 2018; Priestley et al. 2019). Therefore, ongoing star formation in combination with starvation could be (co-)responsible for the decrease in H2-to-dust ratios observed, possibly sped up by the active removal of gas and dust. Several galaxies in the Fornax cluster have slightly increased star formation efficiencies. Furthermore, starbursts can already have occurred in the pre-processing phase, as galaxies start to interact with the intracluster medium, or in infalling groups (Pinna et al. 2019a, b), although this has mainly been observed in ETGs. While this does not mean their SFRs or sSFRs are also increased (in fact, the vast majority of them lie below the star formation main sequence, see Z20, so we do not expect them to produce more dust than ‘average’ galaxies), it is the H2-to-dust ratio we are interested in. This can be increased as a result of this preferential dust production.
An inspection of gas-to-dust ratios in the Fornax cluster as a function of depletion time shows that they decrease with increasing depletion time: galaxies currently undergoing starbursts, often showing disturbed molecular gas reservoirs, still have relatively high gas-to-dust ratios. This could mean two things: either this is not a good explanation, or it takes a while for the dust to accumulate, and the effect is only noticeable after the starburst phase is over. The latter explanation is supported by the fact that old stellar populations are also a significant source of interstellar dust (while their gas feedback is insufficient to keep star formation going; Matsuura et al. 2009; Boyer et al. 2012; Höfner & Olofsson 2018). Thus, as gas and dust are stripped and depleted, but star formation has not yet been quenched (the galaxy is experiencing ‘starvation’; Larson et al. 1980) the dust produced by older stars and supernovae accumulates within the galaxy. Even without ongoing star formation, the dust mass can still continue to increase through interstellar grain growth (assuming some residual cool gas is present in the galaxy to shield the dust from sputtering in the hot intracluster medium; Hirashita 2012; Mattsson et al. 2014; Zhukovska 2014; Galliano et al., submitted). This suggests that the gas-to-dust ratio could even continue to decrease after the star formation has been quenched.
Many galaxies in the Fornax cluster are deficient in H i, or even completely devoid of it (at the survey sensitivity limit of ∼2 × 10⁷ M⊙; Loni et al. 2021). If the main formation of H2 is through the condensation of H i, this could mean that the production of H2 is slower than in non-H i deficient galaxies. However, there also is a significant fraction of H i-deficient galaxies in the Virgo cluster (Yoon et al. 2017), so if this was the main explanation, we might expect to see similarly low molecular gas-to-dust ratios in the Virgo cluster. Moreover, most of these galaxies have high rather than low H2-to-H i ratios, which does not support this theory (Loni et al. 2021).
7.1.3 Option (iii): altered ISM physics result in inaccurate gas-to-dust ratios
It is possible that the radiation field in the cluster destroys CO (but not H2), leading us to underestimate H2-to-dust ratios. In the Galaxy, the radiation field only affects the outermost layers of molecular clouds (e.g. Maloney & Black 1988). However, if the radiation field is more intense, it can affect the entire cloud. In fact, besides metallicity, the strength of the FUV radiation field is the most important factor determining XCO, e.g. Bisbas, Papadopoulos & Viti 2015 and references therein). It is possible that X-rays from the hot intracluster medium (e.g. Jones et al. 1997) have a similar effect. However, it would be difficult to destroy CO while leaving dust grains intact. Moreover, in that case we might expect to see a similar or stronger decrease in H2-to-dust ratios in the more massive Virgo cluster, which is not observed.
An alternative factor that could be affecting our measurements is the dust composition. Large silicate grains are not as easily destroyed by the radiation field, which means that H2 might be destroyed while leaving a large fraction of the dust unaffected. Indeed, in their detailed analysis of the dust content of FCC167, Viaene et al. (2019) find that almost no small grains are present in the dust reservoir of this galaxy. Only larger, self-shielding grains survive the effects of the cluster environment. Another possibility is that larger grains are broken up by the radiation field, resulting in a relatively high fraction of small dust grains. If we then assume a standard dust composition with a lower fraction of small grains to estimate the dust mass, we could be overestimating the dust mass. It seems, however, more likely that such a radiation field would continue to destroy bonds until no significant amount of dust is left. Moreover, this contradicts the observations of FCC167 described above.
Furthermore, the carbon-to-silicate ratio of the dust grains can play a role. Due to environmental conditions and typical grain sizes, silicate grains can have longer lifetimes (∼1 Gyr) than carbon grains (of the order 100 Myr; e.g. Slavin, Dwek & Jones 2015). If the composition of dust grains in the Fornax cluster is relatively silicate-rich, more oxygen may be expected to be locked up in these grains.
Low gas-to-dust ratios have also been observed in field galaxies, for example in the ETG NGC 5485. This object has a total G/D of <14.5, as estimated from FIR, CO, and H i observations (Baes et al. 2014, the upper limit is the result of non-detection of Hi and H2 in sensitive observations obtained as part of ATLAS3D). Suggested explanations for this observation include the majority of the gas being warm or hot rather than cold, the presence of a relatively large fraction of CO-dark gas, or a recent merger with a metal-poor dwarf galaxy. There could be a larger fraction of warm/hot gas present in Fornax galaxies if the gas at larger scale heights is affected by the surrounding hot intracluster medium. However, the molecular gas is dense and centrally located, so it would be difficult to explain the decreased H2-to-dust ratios in this way. Furthermore, there is no obvious reason why Fornax galaxies would contain more CO-dark gas than field galaxies (at fixed stellar mass), as their metallicities are average or even high compared to the DustPedia field sample (see Section 5.1). Moreover, the latter explanation is unlikely to apply to the entire Fornax sample. Therefore, it seems more likely that the observed low gas-to-dust ratios are a result of environmental effects.
7.2 Comparison with the Virgo cluster
In this work, the main difference between the Fornax and Virgo clusters is that the low total gas-to-dust ratios in Fornax are partly driven by decreased H2-to-dust ratios, while these are increased inside the virial radius of the Virgo cluster. If Virgo galaxies within twice its virial radius are included, this result disappears (see Figs 1–6 and Table 3). Thus, in Virgo, decreased total-gas-to-dust ratios are purely driven by the low H i-to-dust ratios. This is in agreement with Cortese et al. (2016), who find that the decrease in total gas-to-dust ratios in H i-poor galaxies is purely driven by the decrease in H i-to-dust ratios, while H2-to-dust ratios are increased compared to field galaxies at fixed mass and metallicity. They attribute these anomalous ratios to the different spatial distribution of the two gas phases and the dust, resulting in the differential stripping of the ISM. As described above, observations of the ISM in FCC167 indeed show a nested ISM, in which the molecular gas disc is more compact than the dust ring present in this galaxy (Viaene et al. 2019). However, since this galaxy is significantly deficient in molecular gas, it is unclear whether this nested ISM was already present before the galaxy entered the cluster, or if this is the result of the more efficient stripping of molecular gas compared to dust by the cluster environment.
The two main differences between the Fornax and Virgo cluster are that Virgo is more dynamically active, while Fornax is more dynamically evolved, and the Virgo cluster is much more massive than the Fornax cluster (see Section 1). The former difference could be an explanation for option ii: dust is accumulated in the star formation process while H2 is slowly depleted. It could be that there is an initial boost in H2 content, after which it stops being replenished, and this effect becomes more visible over time. However, since the galaxies studied here all still have a detectable ISM, which is not expected after several pericentric passages, it is unlikely that the Fornax galaxies have spent significantly more time in the cluster than the Virgo galaxies, or they would have no gas left.
It may be possible that ram pressure stripping results in the increased H2-to-dust ratios observed in the Virgo cluster and in the galaxies studied by Cortese et al. (2016) if dust is stripped before molecular gas. This is supported by an ongoing study of the Virgo cluster (Zabel et al., in preparation), where we observe normal to high H2 masses in the Virgo galaxies most affected by (past and ongoing) ram pressure stripping. It is possible that ram pressure compresses atomic gas, aiding its condensation into H2, and thus contributing to the increase in H2-to-dust ratios. This has indeed been observed in jellyfish galaxies (Moretti et al. 2020). Since the Fornax cluster is less massive than Virgo, ram pressure stripping might play less of a role there, or not be strong/violent enough to quickly remove Hi or compress it into H2. It is possible that starvation is more important in Fornax, slowly depriving its galaxies of H2, while the dust continues to accumulate. However, this is mostly speculation, and the wildly different results between both clusters are difficult to explain. Expansion of this sort of analysis to other clusters is clearly needed to determine the true cause of this effect.
7.3 Gas-to-dust versus metallicity
It is often assumed that the dust-to-metal ratio is constant with time, due to the dust formation time-scale being similar to the dust destruction time-scale. A constant dust-to-metal ratio implies that the gas-to-dust ratio depends on metallicity as G/D ∝ Z−1, referred to as the ‘reference trend’ by Rémy-Ruyer et al. (2014). This trend has been shown to hold for galaxies with metallicities close to solar, but to break down at the low-metallicity regime where dwarf galaxies are found, which have higher observed gas-to-dust ratios than predicted by this trend (Rémy-Ruyer et al. 2014 and references therein). However, a recent review by Péroux & Howk (2020) has shown that the relation between metallicity and dust-to-metal ratio indeed holds in the low-metallicity/high redshift regime, albeit with more scatter due to the more complex chemistry here. From Figs 2 and 9, we can see that gas-to-dust ratios in the galaxies in our sample are consistently lower than those in the DustPedia sample, suggesting that they do not follow such a reference trend. This implies that their chemical evolution is different from regular field galaxies, which likely has to do with the environment they reside in. Alternatively, the physics of the ISM, such as the radiation field or dust composition, in these galaxies could be different such that they contain unusually high fractions of ‘CO-free’ molecular gas, as discussed above.
Figs 2–9 imply that the fraction of metals locked up in dust (versus gas) is high in the Fornax cluster. If this is the result of stripping of high-metallicity gas (and dust), these are enriching the intracluster medium. Some Fornax galaxies are quite metal rich, while they still have significant amounts of gas left. This is in broad agreement with what is found by Hughes et al. (2013), who find that gas-poor galaxies are relatively metal rich. This could be due to the more metal-poor outer regions of the galaxy being stripped first. However, they do not find any significant difference between metallicities in the Virgo cluster and in the field. These metal- and gas-rich galaxies could indicate that we are observing a special time in the lifespan of the galaxies (i.e. we expect many of them to be on their first infall, which is also suggested by Loni et al. 2021), or witnessing a special time for the cluster itself.
8 SUMMARY
We have studied gas-to-dust ratios in a sample of 15 Fornax galaxies from the ALMA Fornax Cluster Survey (AlFoCS) as a function of stellar mass. In addition, in a sub-sample of nine galaxies that were also observed with VLT/MUSE, as part of the Fornax3D project, the gas-to-dust ratio was also studied as a function of metallicity. We have separated H2 and H i to separately study H2-to-dust and H i-to-dust ratios. Each gas-to-dust ratio (from Hi, H2, and H i + H2) was compared to a field sample and galaxies in the Virgo cluster (separated into galaxies inside Rvir and inside 2Rvir), both from DustPedia. Dust, H2, H i, and stellar masses were calculated using the same assumptions and methods as DustPedia where possible, to maximize homogeneity between both samples. We also studied dust-to-metal ratios as a function of stellar mass and metallicity, and H2-to-dust ratios as a function of distance from the cluster centre. We made use of ppmap to study resolved H2-to-dust ratios in NGC 1436, an almost face-on, flocculent spiral galaxy, at the PACS 100 μm resolution. Our main conclusions are as follows:
Gas-to-dust ratios in the Fornax cluster are systematically decreased compared to the field. Kolmogorov–Smirnov (KS) and Anderson–Darling (AD) tests are able to reject the hypothesis that the Fornax sample and DustPedia field sample are drawn from the same distribution at ≫5σ. According to the same tests, this difference is not only driven by H i deficiencies, but H2-to-dust ratios are also decreased. We propose a number of explanations for this:
H2 is destroyed/removed from the galaxies more efficiently than dust. This is possible if there is a radial H2-to-dust gradient in combination with a truncated H2/dust disc. However, Fornax galaxies do not show any evidence of having significantly truncated H2 discs. Moreover, past studies of H i-deficient galaxies and galaxies in the Virgo cluster suggest that dust is stripped before molecular gas. Finally, from inspection of a toy model, one would need quite steep radial gradients, in combination with severe truncation of the gas disc in these objects. Thus, it seems unlikely that this is the sole explanation for the low ratios observed. However, the radial increase in H2-to-dust ratio observed in NGC 1436 suggests that this effect can contribute.
Both H2 and dust are destroyed, but the dust reservoir is replenished more efficiently than the H2 reservoir. This is possible if relatively large amounts of dust are created by the deaths of massive stars, and/or H2 is not replenished as efficiently as a result of starvation, stripping of H i, and/or the inefficient condensation of H i into H2. Recent observations of gas-to-dust ratios in supernova remnants, as well as the known production of dust by old stellar populations, and interstellar grain growth, suggest that this could be a possible explanation. The slightly increased star formation efficiencies observed in Z19 possibly speed up this process. However, the H2-to-H i ratios in Fornax galaxies are high compared to those in field galaxies at fixed stellar mass, suggesting that the conversion of H i into H2 does take place efficiently (Loni et al. 2021).
The physics of the ISM is altered in such a way that ‘standard’ assumptions we make in order to estimate H2 and dust masses are no longer valid. For example, the strong radiation field in the cluster could disintegrate CO, while leaving H2 intact, leading us to underestimate H2 masses. Alternatively, the dust composition could be altered by the radiation field, possibly resulting in a higher fraction of small grains, which leads us to overestimate the dust mass. We consider these explanations less likely, however we cannot rule them out.
Gas-to-dust ratios as a function of metallicity are also decreased, while dust-to-metal ratios are increased. This suggests that a relatively large fraction of metals is locked up in dust in these Fornax galaxies.
Total gas-to-dust ratios in the Virgo cluster are decreased significantly, especially inside its virial radius. However, unlike in Fornax, this decrease is purely driven by a decrease in Hi-to-dust ratios, while H2-to-dust ratios are increased. The difference in dynamical state and mass between both clusters are suggested as possible explanations for this, however the differences between the two clusters remain puzzling.
Gas-to-dust ratios do not show any obvious variation with (projected) cluster-centric distance, although this is difficult to measure because of projection effects and small-number statistics. In the Virgo cluster, there is possibly a weak correlation between cluster-centric distance and gas-to-dust ratio (a Kendall’s Tau test returns a tau statistic of 0.23 with a p-value of 0.04). This likely reflects the difference between galaxies inside and outside Rvir, but is diluted by projection effects.
Resolved H2-to-dust ratios in NGC 1436 show an increase with ratio, ending in a sharp drop at R ≈ 3.5 kpc. There are very few pixels that exceed a ratio of ∼40, suggesting that, aside from small-scale variations, low H2-to-dust ratios are low throughout the entire gas/dust disc. There is no clear correlation with H α emission.
In summary, total gas-to-dust, H i-to-dust and H2-to-dust ratios in the Fornax cluster are significantly decreased compared to those in field galaxies at fixed stellar mass and metallicity. Their significantly increased dust-to-metal ratios suggest that a relatively large fraction of metals in these galaxies is locked up in dust. There is a variety of environmental mechanisms that could explain this, and it is possible that two or all three of the suggested explanations play a role. We see an opposite effect inside the virial radius of the Virgo cluster, where decreased total gas-to-dust ratios are purely driven by decreased H i-to-dust ratios, while H2-to-dust ratios are increased. These results disappear when galaxies inside 2Rvir are included. There are several differences between both clusters that could possibly explain this, however, it remains a puzzling result.
Further study is clearly required to determine what is driving the low gas-to-dust mass ratios in cluster galaxies. To eliminate any XCO related effects on the gas-to-dust ratio, one could attempt to estimate XCO from the IR emission, simultaneously with dust masses. Such an approach is, for example, taken by Leroy et al. (2011) and Sandstrom et al. (2013). Their models, however, rely on resolved measurements, which are not available for our sample. If suitable data could be obtained it would interesting to investigate this further in a future work.
Furthermore, it is crucial to expand this analysis to study other galaxy clusters and groups. An ongoing, similar study of H2-to-dust ratios in the Coma cluster (Zabel et al., in preparation) will possibly help disentangle which environmental effects and cluster properties have a significant effect on these ratios.
ACKNOWLEDGEMENTS
We would like to thank the anonymous referee for taking the time to revise and provide constructive feedback on our manuscript.
The authors would also like to thank the (other) dust experts at the PHYSX department at Cardiff University for helpful suggestions, and pointing us to some useful literature.
NZ acknowledges support from the European Research Council (ERC) in the form of Consolidator Grant CosmicDust (ERC-2014-CoG-647939).
TAD acknowledges support from the Science and Technology Facilities Council through grant ST/S00033X/1.
RFP and EI acknowledge financial support from the European Union’s Horizon 2020 research and innovation program under the Marie Skłodowska-Curie grant agreement No. 721463 to the SUNDIAL ITN network.
This project has received funding from the European Research Council (ERC) under the European Union’s Horizon 2020 research and innovation programme (grant agreement no. 679627; project name FORNAX).
This work made use of the H2 mass data of DustPedia late-type galaxies (Davies et al. 2017; Casasola et al. 2020).
DustPedia is a collaborative focused research project supported by the European Union under the Seventh Framework Programme (2007–2013) call (proposal no. 606847). The participating institutions are Cardiff University, UK; National Observatory of Athens, Greece; Ghent University, Belgium; Université Paris Sud, France; National Institute for Astrophysics, Italy; and CEA, France.
This paper makes use of the following ALMA data: ADS/JAO.ALMA#2015.1.00497.S and ADS/JAO.ALMA#2017.1.00129.S. ALMA is a partnership of ESO (representing its member states), NSF (USA), and NINS (Japan), together with NRC (Canada), MOST and ASIAA (Taiwan), and KASI (Republic of Korea), in cooperation with the Republic of Chile. The Joint ALMA Observatory is operated by ESO, AUI/NRAO, and NAOJ.
The Australia Telescope is funded by the Commonwealth of Australia for operation as a National Facility managed by CSIRO. We acknowledge the Gomeroi people as the traditional owners of the Observatory site.
This research made use of photutils, an Astropy package for detection and photometry of astronomical sources (Bradley et al. 2019).
This research made use of Astropy,5 a community-developed core python package for Astronomy (Astropy Collaboration 2013, 2018).
This research made use of aplpy, an open-source plotting package for python (Robitaille & Bressert 2012).
DATA AVAILABILITY
The data underlying this paper are available in the ALMA archive: ADS/JAO.ALMA#2015.1.00497.S and ADS/JAO.ALMA#2017.1.00129.S, the ESO archive: 296.B-5054, and the Australia Telescope Online Archive: C2894. The updated Herschel maps from the Herschel Fornax Cluster Survey are available at http://www.mwlsmith.co.uk/surveys.html.
Footnotes
Available at https://atoa.atnf.csiro.au/query.jsp.
REFERENCES
. I think they are located in the Salmon Tower Building New York City
