


ABSTRACT
Time domain astronomy was revolutionized with the discovery of the first kilonova, AT2017gfo, in August 2017, which was associated with the gravitational wave signal GW170817. Since this event, numerous wide-field surveys have been optimizing search strategies to maximize their efficiency of detecting these fast and faint transients. With the Panoramic Survey Telescope and Rapid Response System (Pan-STARRS), we have been conducting a volume-limited survey for intrinsically faint and fast-fading events to a distance of D ≃ 200 Mpc. Two promising candidates have been identified from this archival search, with sparse data – PS15cey and PS17cke. Here, we present more detailed analysis and discussion of their nature. We observe that PS15cey was a luminous, fast-declining transient at 320 Mpc. Models of BH–NS mergers with a very stiff equation of state could possibly reproduce the luminosity and decline but the physical parameters are extreme. A more likely scenario is that this was an AT2018kzr-like merger event. PS17cke was a faint and fast-declining event at 15 Mpc. We explore several explosion scenarios of this transient including models of it as a NS–NS and BH–NS merger, the outburst of a massive luminous star, and compare it against other known fast-fading transients. Although there is uncertainty in the explosion scenario due to difficulty in measuring the explosion epoch, we find PS17cke to be a plausible kilonova candidate from the model comparisons.
1 INTRODUCTION
Transient phenomena, such as supernovae (SNe), the explosive deaths of massive stars, are renowned for displaying huge diversity in their observed peak luminosity and temporal evolution. Numerous wide-field survey telescopes are currently in operation, scanning the ever-changing night sky for new and interesting objects that vary in time. Projects such as the Asteroid Terrestrial-impact Last Alert System (ATLAS, Tonry et al. 2018) and the Zwicky Transient Facility (ZTF, Bellm et al. 2019) are currently at the forefront of rapid cadence observations and routinely survey the night sky visible to them every two nights. Conversely, the All-Sky Automated survey for Supernovae (ASAS-SN, Shappee et al. 2014) uses wider field, small aperture, telescopes to survey to shallower depths, but with multiple units situated across the globe, it can cover the whole sky each night. Deeper surveys that offer higher resolution and multicolour coverage of smaller sky footprints, such as the Dark Energy Survey (DES, Flaugher 2005), are also competing to discover these types of transients. Among these programs, the Panoramic Survey Telescope and Rapid Response System (Pan-STARRS) combines the depth of a 2-m telescope with the high survey cadence that a wide-field facility provides and multiwavelength filter coverage (Chambers et al. 2016). We will discuss the technical specifics of the Pan-STARRS survey in the next section.
Since the start of the Pan-STARRS1 Science Consortium surveys in 2009, the facility has produced numerous discoveries and benchmark papers in the time domain era. The Pantheon sample of Type Ia SNe is now the leading sample for cosmological constraints (Scolnic et al. 2018a) and the Foundation Supernova Survey, a low redshift sample, has been recently published (Foley et al. 2018). On the more exotic transient side, the Pan-STARRS project has made an impact in the discovery of tidal disruption events (Gezari et al. 2012; Chornock et al. 2014; Holoien et al. 2019; Nicholl et al. 2019) superluminous supernovae (SLSNe, Chomiuk et al. 2011; McCrum et al. 2015; Lunnan et al. 2018), a population of ‘fast-evolving’ transients (Drout et al. 2014), and outbursts of stars before core-collapse (Fraser et al. 2013).
The recently discovered ‘fast’ transients (objects with light curves lasting days to weeks), such as AT2018cow (Prentice et al. 2018; Perley et al. 2019), AT2018kzr (McBrien et al. 2019; Gillanders, Sim & Smartt 2020), and SN2019bkc (Chen et al. 2019; Prentice et al. 2020), as well as the sample of DES objects discussed by Pursiainen et al. (2018), present a new parameter space for survey telescopes to probe. Objects such as these often prove to be intrinsically faint as well, which makes detection more difficult (Srivastav et al. 2020). Among the most extreme fast and faint transients that are theoretically predicted, and have subsequently been observed to exist, are kilonovae – the electromagnetic signal emanating from the site of a merger between two neutron stars (NS–NS), or a black hole and neutron star (BH–NS) (Li & Paczyński 1998; Rosswog 2005; Metzger et al. 2010). This emission, peaking in the optical and near-infrared (NIR) on a time-scale of a few days to a week, is caused by the decay of rapid neutron capture (r-process, Eichler et al. 1989; Freiburghaus, Rosswog & Thielemann 1999) elements synthesized during the merger.
The first confirmed kilonova with an unambiguous gravitational wave (GW) signature from a binary neutron star system was discovered in 2017 August (Abbott et al. 2017b) and ushered in a new era of multimessenger astrophysics (Abbott et al. 2017c). In addition to the GW signal, GW170817, an associated short duration gamma-ray burst (sGRB, Abbott et al. 2017d; Goldstein et al. 2017) was discovered along with the predicted optical counterpart. This optical counterpart was given the designation AT2017gfo (Andreoni et al. 2017; Arcavi et al. 2017; Chornock et al. 2017; Coulter et al. 2017; Cowperthwaite et al. 2017; Drout et al. 2017; Evans et al. 2017; Kasliwal et al. 2017; Lipunov et al. 2017; Nicholl et al. 2017; Pian et al. 2017; Smartt et al. 2017; Soares-Santos et al. 2017; Tanvir et al. 2017; Troja et al. 2017; Utsumi et al. 2017; Valenti et al. 2017). In the weeks and months that followed its discovery, observations were undertaken in radio (Hallinan et al. 2017), as well as X-ray (Evans et al. 2017; Margutti et al. 2017), all identifying a GRB-like afterglow. Since the discovery of this first kilonova, survey telescopes have been attempting to identify more of these events, concurrently and independently of GW triggers. These efforts have proved challenging as kilonovae can decline by as many as two magnitudes per day in the bluer bands. The link between binary neutron star mergers and sGRB events had long been suspected, which had prompted detailed follow-up campaigns of sGRBs to search for kilonovae in the fading afterglows (Perley et al. 2009; Berger, Fong & Chornock 2013a; Tanvir et al. 2013; Jin et al. 2015; Yang et al.2015;Jin et al.2016).
Now, in the era of GW observations with LIGO and Virgo (Abbott et al. 2016a, b, 2017a), we are able to conduct follow-up of the localized sky areas released in the wake of publicly announced GW signals. With Pan-STARRS, we conducted follow-up of the binary black hole mergers detected during the first and second LIGO observing runs (O1 and O2, Smartt et al. 2016a, b). In the first 12–36 h of follow-up of AT2017gfo, our Pan-STARRS observations, combined with image subtraction, provided the quantitative early evidence for rapid photometric fading, mainly due to the pre-existing templates (Chambers et al. 2016). The key to this was having the Pan-STARRS1 Science Consortium 3π reference images, which provide a template for image subtraction at declinations above δ = −30°. For the joint LIGO–Virgo observing run, O3, the Hanford and Livingston units have become sensitive to detecting GWs from binary neutron star mergers out to angle averaged distances of 100−120 Mpc, where Virgo is sensitive to approximately 50 Mpc. The horizon distance for the two LIGO detectors is closer to 160 Mpc (distance modulus μ = 36), and we would anticipate a kilonova peaking at an absolute magnitude of −14 > M > −16 to be detected at apparent magnitudes in the range 20 > m > 22. This is comfortably above the typical Pan-STARRS detection limits in its filter system (discussed in the next section) with exposure times of 30−960 s.
The discovery of AT2017gfo, associated with GW170817, indicates that kilonovae with peak absolute magnitudes of M ≃ −15.5 exist in the local Universe and, irrespective of GW detections, should be discoverable by ZTF, ATLAS, and Pan-STARRS. Its discovery also changed how various groups conducted follow-up of faint and fast transients as objects of this magnitude and decline rate until now were poorly characterized and few had been observed. It also posed the question of which instruments would best detect these rapidly evolving and lower luminosity events (Scolnic et al. 2018b). Such luminosities are similar to faint SNe (such as faint Type II-P and the extreme end of the SN Iax population, Pastorello et al. 2004; Spiro et al. 2014; Srivastav et al. 2020) and hence the two factors that are preventing independent discovery at optical to NIR wavelengths are the intrinsic rates and the cadence strategies of the surveys. The known sGRB population has a median redshift of |$z$| ≃ 0.48 (Berger 2014) with the lowest redshift sGRB apart from that associated with GW170817 being |$z$| ≃ 0.111 (Berger 2014). Hence, finding kilonovae in the fast-fading afterglows of sGRBs is challenging, given that their distance implies that they would typically be fainter than 20th magnitude.
Previous searches for fast transients were conducted in the Pan-STARRS1 Science Consortium Medium Deep Survey fields by Drout et al. (2014) and Berger et al. (2013b). Drout et al. (2014) discovered rapidly evolving objects in the range −16.5 > M > −20.0, which declined by at least 1.5 magnitudes in less than 25 d. These are several magnitudes brighter than AT2017gfo and declined much more slowly. In its current main survey mode, the Pan-STARRS twin telescope system carries out a survey for near earth objects (NEOs), funded by NASA. In a companion paper to this (Smartt et al., in preparation), we introduce the Pan-STARRS Search for Kilonovae (PSSK) program being undertaken to identify kilonovae and other fast and faint transients with the Pan-STARRS NEO data. These images typically reach ∼21.5–22 for each 45-s exposure and cover around 1000 deg2 per night. We now announce all candidates publicly (Smartt et al. 2019) and have performed an archival search through all previously taken Pan-STARRS data prior to August 2019, which we discuss in this paper.
Smartt et al. (in preparation) present the analysis of 1975 transients within 200 Mpc and find two rapidly declining transients that were worthy of consideration as kilonovae candidates. In this paper, we analyse these two objects – PS15cey and PS17cke – in detail. In Section 2, we outline the technical observing specifications of Pan-STARRS1, the primary telescope operating under the Pan-STARRS survey, and outline briefly the work being done as part of PSSK. In Sections 3 and 4, we discuss the prospective kilonova candidates identified through the archival search of PSSK. In Section 5, we discuss the implications and plausible progenitor scenarios for these events before concluding in Section 6. Throughout this paper, we adopt cosmology of H0 = 70 |$\mathrm{km\, s}^{-1}\, \mathrm{Mpc}^{-1}$|, with Ωm = 0.3 and |$\Omega _\Lambda = 0.7$|.
2 PAN-STARRS AND THE SEARCH FOR KILONOVAE
The Pan-STARRS1 system (Chambers et al. 2016) comprises a 1.8-m telescope located at the summit of Haleakala on Maui, Hawaii, with a 1.4 gigapixel camera, called GPC1, mounted at the Cassegrain f/4.4 focus. GPC1 is composed of 60 orthogonal transfer array devices, each of which has a detector area of 4846 × 4868 pixels. These pixels measure 10 μm in size giving a focal plane of 418.88 mm in diameter, or equally 3.3°. This corresponds to field of view of 7.06 deg2. The Pan-STARRS1 filter system (grizyP1) is similar to that of SDSS (Abazajian et al. 2009), but it also includes a composite gP1rP1iP1 filter called ‘wide’ or |$w$|P1 and is described in detail by Tonry et al. (2012) and Chambers et al. (2016). In nightly survey operations, PS1 typically observes in quads of 45-s |$w$|P1 exposures, reaching |$w$|P1≲22 magnitudes.
Images taken from Pan-STARRS1 are processed immediately with the Image Processing Pipeline (IPP, Magnier et al. 2020a). Through the Pan-STARRS1 3π Steradian Survey data (Chambers et al. 2016), we have a ready-made template of the whole sky north of δ = −30°, and proprietary iP1 data in a band between −40° < δ < −30°, giving a reference sky in the iP1 band down to this lower declination limit. Frames are astrometrically and photometrically calibrated with the standard IPP steps (Magnier et al. 2020a,b,c). The Pan-STARRS1 3π reference sky images are subtracted from these frames (Waters et al. 2020) and photometry is carried out on the resulting difference images (Magnier et al. 2020b). The detections are then processed through the Pan-STARRS Transient Science Server (PTSS) hosted on a dedicated computing cluster at Queen’s University Belfast. The processing involves assimilating the detections into objects and light curves, removing false positives, identifying asteroids, variable stars and AGN, and cross-matching with known galaxy catalogues to determine the most likely host and assign a photometric or spectroscopic redshift, if known. The PTSS is also described in our companion paper (Smartt et al., in preparation).
Smartt et al. (in preparation) also introduce the PSSK. From a transient data base of over |$20\, 000$| detection, 1975 were found to be plausibly associated with galaxies within 200 Mpc. We were able to rule out 1758 as being either confirmed or likely SNe from a combination of spectral classifications, absolute magnitudes, and light curve evolution. There were 215 (11 per cent) that had only one data point and could not be classified further. This left two, which have unusual, fast-declining light curves – PS15cey, a rapidly declining object with detections on two epochs and in two bands, and PS17cke, an intrinsically faint object detected only on one epoch but with a recent post-discovery non-detection that constrained the decline rate to be similar to AT2017gfo.
We also use ATLAS to search for transients within a fixed local volume (Smith et al. 2020) to shallower depths than Pan-STARRS but with significantly higher cadence. ATLAS is a twin 0.5-m telescope system with units based on Haleakala and Mauna Loa, Hawaii (Tonry et al. 2018). The Wright–Schmidt telescopes each have a 10 k × 10 k detector, providing a 28 deg2 field of view. ATLAS robotically surveys the sky in cyan (c) and orange (o) filters that are broadly similar to composite Pan-STARRS/Sloan Digital Sky Survey (SDSS) gr and ri filters, respectively. The system covers the whole sky visible from Hawaii every two nights with a pattern of 4 × 30 s dithered exposures per night, spaced approximately equally within a 1-h period. The survey images are processed as described by Tonry et al. (2018) and are photometrically and astrometrically calibrated immediately. Each image has a deep reference sky image subtracted and transient sources detected as described in Smith et al. (2020). We make use of ATLAS data to supplement these two Pan-STARRS discoveries.
3 DATA ANALYSIS FOR PS15CEY
3.1 Discovery and initial photometry
PS15cey (Fig. 1) was discovered on MJD 57297.350 (2015 October 2, 08:23:42 UTC) with a magnitude of rP1=19.17 ± 0.03 at location RA = 22:37:00.81 and Dec = −16:13:47.5. PS15cey was observed a total of eight times by PS1 – four times in rP1 on the night of MJD 57297 and four times in iP1 on the subsequent night, MJD 57298, which average to iP1=19.64 ± 0.03. The last previous non-detection before discovery occurred on MJD 57246.505 (2015 August 12, 12:07:12 UTC) at |$w$|P1 > 22.2. The closest non-detection in time following the event is a shallow image from MJD 57353.200 (2015 November 27, 04:48:00 UTC) at |$z$|P1 > 18.9, with the next PS1 observation of the field being over 200 d later. No other detections of this transient were seen in PS1 data over the period MJD 56459 to MJD 58808. The foreground extinction in this direction is low, with Ar = 0.1 and Ai = 0.08 mag (Schlafly & Finkbeiner 2011), implying an intrinsic colour difference of rP1–iP1= −0.50 ± 0.05 mag. This could be due to a rapid decline in luminosity of the transient, a colour difference, or a combination of both. We show our photometry of PS15cey in Fig. 2.
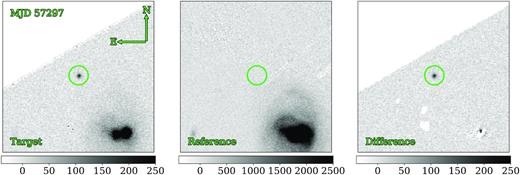
The Pan-STARRS1 discovery image triplet of PS15cey taken on the night of MJD 57297 in rP1. Left: The target frame acquired on MJD 57297.350 (2015 October 2, 08:23:42 UTC) in rP1. Centre: The reference wallpaper image used for subtraction. Right: The resulting subtraction showing the clear detection of PS15cey.
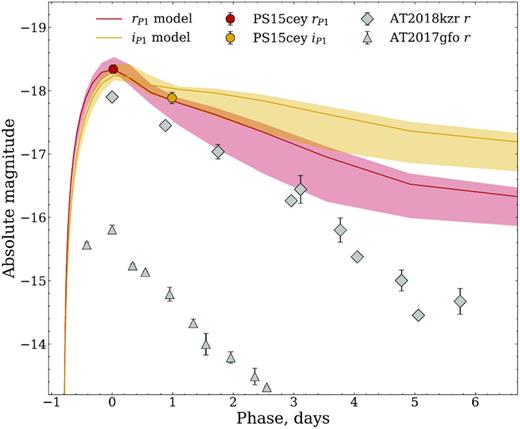
The Pan-STARRS1 light curve of PS15cey with detections averaged in rP1 (red) and iP1 (yellow) across each night of observing. We overlay on this the absolute light curves of AT2018kzr (diamonds, McBrien et al. 2019; Gillanders et al. 2020) and AT2017gfo (triangles, Andreoni et al. 2017; Arcavi et al. 2017; Chornock et al. 2017; Cowperthwaite et al. 2017; Drout et al. 2017; Evans et al. 2017; Kasliwal et al. 2017; Pian et al. 2017; Smartt et al. 2017; Soares-Santos et al. 2017; Tanvir et al. 2017; Troja et al. 2017; Utsumi et al. 2017; Valenti et al. 2017), in addition to BH–NS kilonova models, fit each data point. We discuss the model formulation and interpretation in Section 5.1. Phases are given with respect to the discovery of PS15cey.
3.2 Spectra
Cross-matching with galaxy catalogues suggests a potential host in the galaxy WISEA J223659.87-161406.7, though the host is identifiable in several catalogues. Within LEDA, this galaxy is recognized as PGC900758 and, according to the GLADE catalogue, has a redshift of |$z$| = 0.038. This is likely a photometric redshift, however, as a spectroscopic source cannot be corroborated, and hence is not reliable enough to draw conclusions from. Owing to this uncertainty on the redshift, a spectrum of the host galaxy was taken with EFOSC2 at the New Technology Telescope (NTT), using Grism #13 (wavelength coverage 3685−9315 Å), on MJD 58816.066 (2019 November 29, 01:35:41 UTC) as part of the advanced Public ESO Spectroscopic Survey for Transient Objects (ePESSTO +). The data were reduced with the PESSTO pipeline (Smartt et al. 2015) and the extended galaxy spectrum was extracted. The spectrum has identifiable emission and absorption features, including the Na i lines and Ca ii H&K lines, as well as some Hα emission. From these lines, we can measure a redshift to the host of |$z$| = 0.0717 ± 0.0006. This corresponds to a luminosity distance of 320 Mpc for our chosen cosmology. We estimate that PS15cey is offset by 32|${^{\prime\prime}_{.}}$|4 from its host, or equivalently a physical separation of approximately 50.3 kpc. At this redshift, the host spectrum resembles those of typical S0- or Sa-type galaxies (Kinney et al. 1996), as can be seen in Fig. 3. Given this redshift, as well, the absolute magnitude at peak of the existing photometry would be −18.40 in rP1 and −17.89 in iP1.
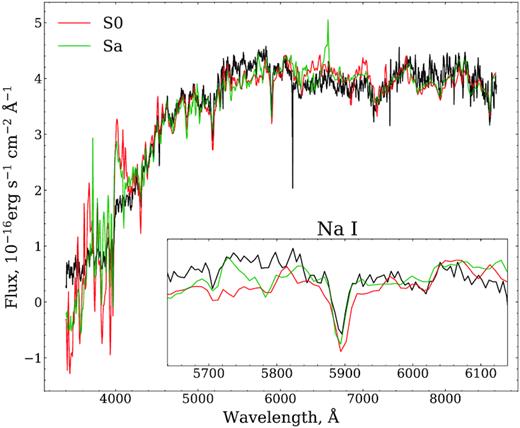
The spectrum of the host of PS15cey taken MJD 58816.066 (2019 November 29, 01:35:41 UTC) with NTT:EFOSC2. For comparison, we show scaled spectra of typical S0 and Sa galaxies in the same wavelength range (Kinney et al. 1996). From this spectrum, we have inferred a redshift to the host of |$z$| = 0.0717 ± 0.0006, with the inset plot showing the Na i line, which was used in the measurement of this redshift.
3.3 Decline
If we assume that the transient did not fade significantly between the two epochs, then rP1–iP1= −0.50 ± 0.05 implies a very blue colour for the spectral energy distribution (SED). It would require a blackbody with an effective temperature of 26, 500 ± 3500 K to provide this blue colour. This is extremely hot, and such temperatures are usually seen only at shock breakout, with higher temperatures reached during the post-shock cooling phase (Yaron et al. 2017). However, if these data were the signature of shock breakout, then a rising supernova should have been visible in the days and weeks that followed. There is no detection on MJD 57353.200 (2015 November 27, 04:48:00 UTC), or + 51 d (from the rest frame) after discovery in Pan-STARRS, with a limit of |$z$|P1>18.9. In ATLAS, the closest observation is on MJD 57378, and forced photometry1 on the ATLAS survey data shows no transient to typical magnitudes of o > 18.3.
Photometry and flux measurements of PS17cke. The flux is in μJy and is a forced photometry measurement at each epoch in the difference frames. Where a magnitude limit is quoted, it is the 5σ limit based on σ being the uncertainty in the forced photometry flux. The flux errors are the standard deviation of multiple frames where they exist (ATLAS and PS1), and the exposure times are total sum of frames on that night.
| MJD | Epoch (days) | Facility | Filter | Exposure time (s) | AB magnitude | Flux (μJy) |
|---|---|---|---|---|---|---|
| 57828.569 | −30.739 | ATLAS | o | 9 × 30 | >17.19 | −88 ± 96 |
| 57830.566 | −28.742 | ATLAS | o | 4 × 30 | >17.86 | −76 ± 52 |
| 57832.551 | −26.757 | ATLAS | o | 14 × 30 | >17.29 | −79 ± 88 |
| 57833.551 | −25.757 | ATLAS | o | 4 × 30 | >14.36 | −628 ± 1306 |
| 57834.549 | −24.759 | ATLAS | o | 4 × 30 | >17.47 | −67 ± 74 |
| 57836.553 | −22.755 | ATLAS | c | 5 × 30 | >19.91 | 9 ± 8 |
| 57837.529 | −21.779 | ATLAS | o | 8 × 30 | >15.63 | −448 ± 405 |
| 57838.534 | −20.774 | ATLAS | o | 2 × 30 | >18.70 | −72 ± 24 |
| 57840.511 | −18.797 | ATLAS | c | 2 × 30 | >19.54 | −36 ± 11 |
| 57841.416 | −17.892 | PS1 | |$w$|P1 | 180 | >21.40 | 6 ± 2 |
| 57842.524 | −16.784 | ATLAS | o | 4 × 30 | >17.36 | −344 ± 82 |
| 57844.516 | −14.792 | ATLAS | c | 4 × 30 | >18.49 | −5 ± 29 |
| 57845.506 | −13.802 | ATLAS | o | 2 × 30 | >17.53 | −214 ± 70 |
| 57846.503 | −12.805 | ATLAS | o | 4 × 30 | >17.09 | −501 ± 105 |
| 57846.506 | −12.802 | PS1 | |$w$|P1 | 360 | 21.09 ± 0.16 | 13 ± 2 |
| 57849.480 | −9.828 | ATLAS | o | 4 × 30 | >17.95 | −120 ± 48 |
| 57857.481 | −1.827 | ATLAS | o | 3 × 30 | >15.79 | −182 ± 348 |
| 57858.473 | −0.835 | ATLAS | o | 4 × 30 | >17.73 | −104 ± 58 |
| 57859.308 | +0.000 | PS1 | |$w$|P1 | 180 | 19.69 ± 0.02 | 47 ± 1 |
| 57861.537 | +2.229 | ATLAS | o | 4 × 30 | >18.11 | −1898 ± 41 |
| 57862.288 | +2.980 | UH2.2m | V | 20 | − | − |
| 57862.542 | +3.234 | ATLAS | o | 4 × 30 | >17.97 | −215 ± 47 |
| 57862.857 | +3.549 | SALT | |$w$|P1 | 5 | − | − |
| 57863.369 | +4.061 | PS1 | |$w$|P1 | 90 | >20.96 | 4 ± 3 |
| 57864.765 | +5.457 | SALT | |$w$|P1 | 5 | − | − |
| 57865.258 | +5.950 | NTT | V | 200 | 21.86 ± 0.18 | 5 ± 2 |
| 57865.521 | +6.213 | ATLAS | o | 4 × 30 | >18.00 | −53 ± 46 |
| 57866.520 | +7.212 | ATLAS | o | 4 × 30 | >14.29 | 282 ± 1395 |
| 57868.505 | +9.197 | ATLAS | c | 2 × 30 | >18.57 | −25 ± 27 |
| 57869.511 | +10.203 | ATLAS | o | 4 × 30 | >17.25 | −170 ± 91 |
| 57870.331 | +11.023 | PS1 | |$w$|P1 | 180 | >20.96 | −1 ± 3 |
| 57876.400 | +17.092 | ATLAS | o | 1 × 30 | >14.62 | −312 ± 1026 |
| 57881.374 | +22.066 | ATLAS | o | 4 × 30 | >18.11 | −33 ± 41 |
| 57882.393 | +23.085 | ATLAS | o | 6 × 30 | >17.19 | −91 ± 96 |
| 57883.477 | +24.169 | ATLAS | o | 4 × 30 | >16.42 | −3 ± 196 |
| 57884.398 | +25.090 | ATLAS | o | 9 × 30 | >17.38 | −52 ± 81 |
| 57886.375 | +27.067 | ATLAS | o | 4 × 30 | >17.36 | −116 ± 82 |
| 57892.419 | +33.111 | ATLAS | o | 5 × 30 | >19.17 | −32 ± 16 |
Hence, it is likely that the two photometric measurements are a signature of a real and rapid decline. The most recent non-detections occurred on MJD 57246.505 (2015 August 12, 12:07:12 UTC) at >22.2 in |$w$|P1 prior to discovery. A decline rate of −0.5 mag day−1 is comparable to both the NS–NS merger AT2017gfo and the possible WD–NS merger AT2018kzr (McBrien et al. 2019; Gillanders et al. 2020). However, the secure redshift of the host galaxy PGC900758 places its peak absolute magnitude at least two magnitudes brighter than AT2017gfo, which is more similar to the peak brightness of AT2018kzr. We note that at the time of discovery by PS1, the intermediate Palomar Transient Factory (Law et al. 2009; Rau et al. 2009; Kulkarni 2013) was observing also but has no observations of the field of PS15cey within the months surrounding its discovery.2
4 DATA ANALYSIS FOR PS17CKE
4.1 Discovery and initial photometry
PS17cke (Fig. 4) was discovered at |$w$|P1=19.69 ± 0.04 on MJD 57859.308 (2017 April 16, 07:24:06 UTC) at location RA = 12:34:18.90 and Dec = + 06:28:27.0. The object was detected only on one night in all four exposures taken in |$w$|P1. It was registered on the Transient Name Server3 and given the IAU designation AT2017des (Smith et al. 2017). We note that PS17cke was discovered approximately 4 months before AT2017gfo, so it would have been overlooked as a kilonova candidate at the time. PS17cke lies in the nearby star-forming host galaxy NGC 4532. It is in a high surface brightness region of the irregular host, making image subtraction difficult. NGC 4532 has a heliocentric velocity recorded in the NASA/IPAC Extragalactic Database (NED) of 2061 |$\rm {km}\, s^{-1}$| or |$z$| = 0.00671 ± 0.00001 (e.g. Binggeli, Sandage & Tammann 1985), which would correspond to a distance of 27 Mpc for our adopted cosmology. However, it lies in the direction of the Virgo galaxy cluster and either is in the cluster or its recessional velocity is significantly perturbed by Virgo’s mass. The correction for Virgo, Great Attractor, and Shapley used in NED (by Mould et al. 2000) implies a kinematic distance of 14 Mpc while direct estimates (Tully–Fisher and H I correlation methods) report distances between 10 and 20 Mpc (see Tully & Shaya 1984; Yasuda, Fukugita & Okamura 1997, for two of the extremes). NGC 4532 is towards the subcluster B around M49 in the southern regions of Virgo to which Mei et al. (2007) estimate a distance of 16 Mpc. We hence adopt 15 ± 5 Mpc, an equivalent distance modulus of μ = 30.9 ± 0.8 as the distance to NGC 4532, and will propagate the distance uncertainty through the discussions of the nature of the transient.
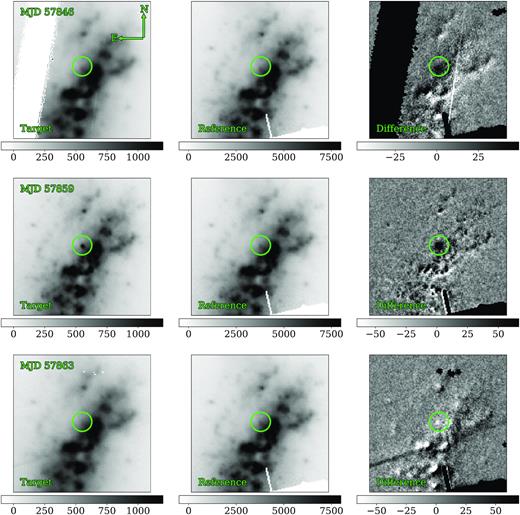
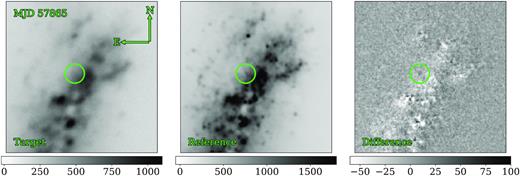
The Pan-STARRS1 discovery image triplets of PS17cke at the three epochs of our photometry. From left to right, the panels show the target frame for a particular epoch, then the reference frame used for subtraction (which is the same for all epochs), then finally the resultant subtraction frame. Top: The most recent pre-discovery detection and subtraction frames of PS17cke made on MJD 57846.506 (2017 April 3, 12:08:41 UTC) via a forced photometry measurement in |$w$|P1. Middle: The discovery epoch detection and subtraction frames made on MJD 57859.308 (2017 April 16, 07:24:06 UTC) in |$w$|P1. Bottom: The most recent post-discovery non-detection and subtraction frames, included to emphasize the rapid decline of PS17cke, made on MJD 57863.369 (2017 April 20, 08:51:35 UTC) in |$w$|P1.
In the weeks surrounding the discovery of PS17cke, the field was observed a total of 36 times across seven epochs by PS1. Typical 5σ limiting magnitudes of the individual 45-s images in this period were between 21 <|$w$|P1<22, but the high surface brightness of NGC 4532 reduces the sensitivity of the difference images at the location of the transient. None of these difference images, nor any historical image from Pan-STARRS1, produced an independent 5σ positive detection at the location of PS17cke. The lack of detection just 4.06 d later was the reason this object was uncovered from the sample of 1975 objects within 200 Mpc in Smartt et al. (in preparation). To further constrain detections and detection limits, we forced photometry at the position of all of the Pan-STARRS1 45-s difference images at the location of PS17cke from MJD 57805.481 (2017 February 21, 11:32:38 UTC) to MJD 58879.594 (2020 January 31, 14:15:21 UTC). A point spread function (PSF) was calculated for each target image and a flux measurement using this PSF was forced at the astrometric position of PS17cke. All of the images were in the |$w$|P1 filter and the data typically consist of a sequence 4 × 45 s exposures per night, but on some nights, a sequence of 8 × 45 s was available. All images were taken in normal survey mode and were not targeted observations of PS17cke itself. The forced photometry is reported in micro-Jansky units in Table 1 on a nightly basis. The nightly forced flux is the average of the flux measurements from the individual images, with the error being the standard deviation. These were converted to magnitudes if the significance of detection was greater than 5σ.
In addition, we also co-added the individual 45- s frames to visually inspect them for any sign of significant positive flux. The transient is not significantly detected in the images −17.9 d before discovery and + 4.1 d after to the limits quoted in Table 1. However, positive flux appears in the frames from MJD 57846.485 (2017 April 3, 11:38:24 UTC, 12.8 d before discovery). On this night, a 8 × 45 s sequence of frames was taken. Each image had a positive flux residual of less than 5σ significance but the average and standard deviation of the eight flux measurements imply a combined ∼6.5σ detection corresponding to magnitude |$w$|P1 = 21.09 ± 0.16. Inspecting the forced photometry light curve and image data across all epochs indicates that the high surface background leaves positive and negative residuals in the difference images at similar levels to the ‘source’ detected in this −12.8-d epoch. Hence, it is not completely secure if this is a real detection of transient flux. To check the reality of this forced positive flux, we co-added the eight frames and applied aperture photometry but allowed the centroid to vary. This produces a measurement of positive flux of similar significance to that in the combined difference image measurements at a position, which is 0|${^{\prime\prime}_{.}}$|23 offset from the centroid of the high signal-to-noise detection on the discovery epoch, indicating that this was not ambiguously transient flux. We carried out two further tests to determine if this flux was real. A higher quality reference stack was constructed with all PS1 |$w$|P1 images outside the time frame of possible detection, giving a deep 660-s frame made from 4 × 30 s and 12 × 45 s images. We applied the standard PS1 IPP difference imaging pipeline to this, combined with forced photometry. The results are plotted in Fig. 5. Again, we measured similar positive residuals in the difference images at the position of PS17cke on the −12.8-d epoch. However, in all cases, there is a consistent residual and positive flux measured at this position with an average of around 6μJy. We attribute this to imperfect image subtraction due to a combination of high surface brightness, probable colour gradients within the PSF, and the wide |$w$|P1 filter employed. Inspection of the image frames after subtraction indicated that this residual flux was likely to be residual diffuse flux rather than point like. We also used exactly the same data (i.e. the deep PS1 reference stacks) to run the photpipe difference imaging pipeline (Rest et al. 2005). This has been employed for accurate photometric measurements in PS1 data by Rest et al. (2014) and Scolnic et al. (2018a), with excellent results. We find similar results to those from the IPP difference imaging. There are some positive residuals but they are significantly variable within a night and across the 45-s frames. A higher positive flux is again found on the −12.8-d epoch, but we do not find it to be a convincing PSF-like source. Given that we are detecting an average background residual of 6μJy above zero, the excess flux in the combined −12.8-d epoch is around 3σ above this. For completeness, we have attempted the subtraction with hotpants (Becker 2015). The resulting difference images it produces contain some flux at this early epoch of a similar significance to the photpipe subtractions. In the discussion of the nature of the object, we consider the two possibilities of this being a real detection and using it as an upper limit.
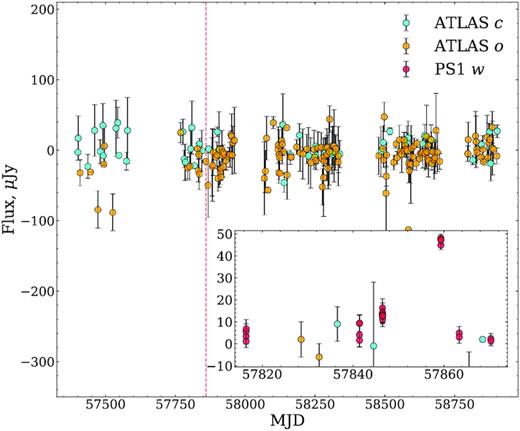
The ATLAS flux light curve for the entirety of its duration of operation forced at the location of PS17cke. The red dashed line denotes the Pan-STARRS discovery epoch of PS17cke. We show as well in the inset plot our PS1 forced photometry of PS17cke spanning the date range of MJD 57800 to MJD 57870 overlaid on the ATLAS data.
4.2 Spectra
Four attempts at taking a spectrum of PS17cke were made, but in all cases, there is no visible source in the spectroscopic 2D images that could be identified and extracted. The first attempt was with the SuperNova Integral Field Spectrograph (SNIFS, Lantz et al. 2004) on the University of Hawaii’s 2.2- m telescope on MJD 57862.288 (2017 April 19, 06:54:41 UTC). The object was not identifiable in a 20-s acquisition image, so the observation was aborted and no spectrum was taken. Soon after, an observation was made by the Southern African Large Telescope (SALT) with the Robert Stobie Spectrograph (RSS) on MJD 57862.857 (2017 April 19, 20:34:07 UTC). Although identification of the object was not clear in a 5-s acquisition image, the spectroscopic observation proceeded. The SALT:RSS spectrum totalled an integration time of 2000 s. There are clearly two bright objects or regions in the spectrometer slit (with position angle 113.0° east from north), which we identify as the bright star USNO-B1 0964-0213613 and a bright knot in the galaxy NGC 4532 some 45|${^{\prime\prime}_{.}}$|6 away. These were separated by exactly 90.4 pixels on both the acquisition image and the 2D spectrum and hence we are confident of the slit position. This means that the 1|${^{\prime\prime}_{.}}$|5 slit employed in the observations missed the position of PS17cke. A subsequent attempt was made with SALT:RSS to observe PS17cke on MJD 57864.765 (2017 April 21, 20:45:24 UTC) with the total integration time of 2300 s. Similarly, the same two objects could be identified on the 2D spectroscopic frame and the acquisition image and the transient were unlikely to have been included in the slit.
A further spectrum was attempted on MJD 57865.258 (2017 April 22, 06:11:56 UTC) with EFOSC2 at the NTT within the ePESSTO program (Smartt et al. 2015). Three acquisition images were obtained to identify the target, two with an exposure time of 40 s and one with 120 s, but the target is not immediately obvious, nor resolvable in any of these. The acquisition images were taken in the V band and have a measured zero-point of 25.33, based on calibrations to reference stars in the Pan-STARRS catalogue, colour corrected to the Johnson–Cousins filter system. An attempt to observe the spectrum was made, with a 1000-s exposure with Grism #13 (wavelength coverage 3685−9315 Å). We do not believe that this spectrum had properly acquired the target due to the faintness of the object among the density of resolvable point sources in the host galaxy. The spectrum extracted shows a blue continuum with narrow emission lines, most likely from the host, including H α, [O III] and [S II]. We have measured a secure host redshift of 0.00682 ± 0.00053 from the centroids of these lines by fitting Gaussian profiles to each.
4.3 Later and forced photometry
In order to determine if PS17cke has flux present in the NTT:EFOSC2 200-s acquisition image, we took a deep reference frame to use for image subtraction. We observed a set of 12 × 100 s images with the NTT:EFOSC2 on MJD 58872.319 (2020 January 24, 07:39:42 UTC) and produced an aligned, co-added image as shown in Fig. 6. This was subtracted from the MJD 57865 acquisition exposures to identify any net flux from the object obscured by the host. There is evidence of some positive flux in the difference frame at the location of PS17cke (Fig. 6). The flux corresponds to a V-band magnitude of 22.86 ± 0.18, measured via PSF fit. As with the Pan-STARRS1 subtractions, the high surface brightness of the host leaves subtraction residuals across the host and the detection of this positive flux corresponds to a marginal detection. Either this is real positive flux, or given the errors, it corresponds to a 5σ upper limit. Either way, it confirms that the object faded rapidly and we consider both options in Section 5.2.
An NTT:EFOSC2 image triplet of PS17cke. Left: The target frame composed of a co-add of the acquisition images taken for the MJD 57865.258 (2017 April 22, 06:11:56 UTC) spectrum in Johnson-V. Centre: The reference frame used for image subtraction, acquired on MJD 58872.319 (2020 January 24, 07:39:42 UTC). Right: The resulting subtraction. Detection of PS17cke is difficult by manual inspection, but a photometric magnitude can be measured from this frame.
We have also forced photometry in all difference images made by the ATLAS survey (Tonry et al. 2018) to check for any outbursting signature at this sky position. As described by Smith et al. (2020), ATLAS typically observes with a sequence of 4 × 30 s exposures every two nights, with gaps due to weather, with difference images of detections of positive sources being carried out automatically. We forced photometric PSF measurements at the position of PS17cke and found no significant flux in the history of ATLAS imaging. The fluxes relevant to the period around the PS17cke discovery epoch are reported in Table 1, along with corresponding 5σ upper limits for magnitudes. We note as well that there appears to be no significant detections made by other groups such as ASAS-SN (Shappee et al. 2014) or ZTF (Bellm et al. 2019) at the location of PS17cke.
5 DISCUSSION
5.1 Interpretation of PS15cey
The secure redshift measurement of the host of PS15cey puts it significantly beyond the 200-Mpc distance limit that we originally imposed for the search for kilonovae (Smartt et al., in preparation). With the most recent non-detections occurring approximately 50 d before and after discovery, we note that it is possible for a Type II SN of some description to have occurred in this time, which would otherwise be a major contaminant in the PSSK. Our temperature estimate for this object disfavours a Type II SN progenitor, however, though we note that it would be more consistent with a tidal disruption scenario (Jiang, Guillochon & Loeb 2016). Tidal disruption can be ruled out, however, due to the offset from the host visible in Fig. 1. As such, we regard PS15cey as a fast declining transient about which we will explore various kilonova models and also compare it to the fast transient AT2018kzr (McBrien et al. 2019; Gillanders et al. 2020) in this section. The peak magnitude of rP1 = −18.40 puts PS15cey two magnitudes brighter than AT2017gfo at peak (see the early photometry of Arcavi et al. 2017; Coulter et al. 2017; Cowperthwaite et al. 2017; Evans et al. 2017; Smartt et al. 2017; Valenti et al. 2017). To determine if this luminosity is plausible, we investigate models of black hole and neutron star mergers (BH–NS; Barbieri et al. 2020b) and luminous kilonova (NS–NS) models in the vein of those presented by Barbieri et al. (2020a), which employ a ‘stiff’ equation of state.
In the case of a NS–NS merger, high luminosity is achieved when the amount of dynamical ejecta is maximized and/or an accretion disc is produced. A larger accretion disc size and total ejecta mass will also enhance the luminosity of any kilonova-type transient. In the models of Barbieri et al. (2020a), the combination of neutron star masses that will achieve maximal luminosity occurs for a primary mass of 2.42 M⊙ and secondary of 1.00 M⊙. These are at the limits of what is permitted with one of the ‘stiffest’ equations of state (DD2, as explained by Hempel & Schaffner-Bielich 2010; Typel et al. 2010). DD2 is consistent with both GW170817 (LIGO Scientific Collaboration & Virgo Collaboration 2019a) and GW190425 (LIGO Scientific Collaboration & Virgo Collaboration 2020) and an AT2017gfo-type kilonova in the framework of Barbieri et al. (2020a). This system provides a highly deformable secondary, which is disrupted by strong tidal forces from the primary. However, even these ‘bright’ models do not produce a luminous enough event to describe PS15cey, typically peaking at luminosities that are 1.5−2 magnitudes fainter than the peak of PS15cey.
In the case of a BH–NS merger, a higher ejecta mass can be obtained by increasing the black hole spin as this moves the innermost stable circular orbit of the binary closer to the black hole (Barbieri et al. 2019). For a maximally spinning black hole (χBH = 0.99), using the same equation of state as in the NS–NS models, the maximum dynamical ejecta, approximately 0.24 M⊙, is achieved for a black hole mass of mBH = 11.68 M⊙ and neutron star mass of mNS = 1.00 M⊙. This configuration favours strong tidal disruption of the neutron star, giving rise to a large dynamical ejecta mass, as this material remains gravitationally unbound. A different combination of component masses can maximize the mass of the accretion disc. This is achieved with a system with mBH = 2.43 M⊙ and mNS = 1.59 M⊙, as it has a smaller innermost stable circular orbit and achieves an accretion disc mass of approximately 0.54 M⊙. Similarly, total ejecta mass (as opposed to total dynamical ejecta) is maximized for a combination of masses of mBH = 2.43 M⊙ and mNS = 1.49 M⊙ at approximately 0.55 M⊙. Throughout these models, it is assumed that no mass gap exists between the black holes and neutron stars. These BH–NS models are capable of producing light curves that peak around −18 magnitudes in both r and i.
The model system that has mBH = 11.68 M⊙, mNS = 1.00 M⊙, a maximally spinning BH, and an NS with the DD2 equation of state can produce sufficiently luminous emission to match both the rP1 and iP1 data points. We show these fits in Fig. 2. These fits hold for explosion epochs in the range of 0.8–1.2 d prior to discovery, with the specific profiles shown being for 0.8 d. A large initial nuclear heating rate of ε0 = 2 × 10¹⁹ erg s−1 g−1 is also assumed. Typical initial heating rates of r-process material varies in the region of approximately 1018−1019 erg s−1 g−1 (Metzger et al. 2010) and follows a fitting function when its variation over time is considered, as outlined by Korobkin et al. (2012). This model bears many similarities to previous BH–NS models developed (as in Barbieri et al. 2020a) but also has some important differences. The main similarities are in the dynamical ejecta opacity (κdyn ≃ 20 |$\mathrm{cm}^{2}\, \mathrm{g}^{-1}$|) and opening angle θdyn ≳ 17°. The differences, however, span wind ejecta opacity κw, wind and secular ejecta velocities, |$v$|w and |$v$|s, and the fraction of the accretion disc flowing into both wind ejecta ζw and secular ejecta ζs. We have adopted values of 0.5 |$\mathrm{cm}^{2}\, \mathrm{g}^{-1}$| for κw, which would be more typical of an NS–NS merger and 0.2 c for both |$v$|w and |$v$|s, which is twice what is normally used. We have also employed 0.1 for ζw with ζs being unconstrained in the models. A typical value for ζw for a BH–NS merger is 0.01, so it would be somewhat surprising to see so much of the disc being directed into the wind ejecta. Therefore, a luminous BH–NS merger model is a possible description for the fast decline of PS15cey, but we acknowledge that the model parameters are at the extreme ends of what are physically plausible.
At the time of discovery of PS15cey, LIGO would have been undergoing its first observing run, O1 (Abbott et al. 2016c). During this time, the detectors were sensitive to binary neutron star mergers with constituent masses 1.35 ± 0.13 M⊙ to a volume-weighted average distance of ∼70 Mpc. For black holes of at least 5 M⊙, however, this distance stood at ∼110 Mpc. We discussed previously that at our chosen cosmology, PS15cey is at a luminosity distance of 320 Mpc, far beyond the LIGO O1 binary neutron star detection horizon, and so would not have been detected if it were a BH–NS merger event.
From Fig. 2, we can see that PS15cey bears a strong resemblance to the fast transient AT2018kzr (McBrien et al. 2019; Gillanders et al. 2020). AT2018kzr was notable for its rapid decline across optical bands at a rate similar to the kilonova AT2017gfo. The interpretation of the photometry and spectroscopy of this object was that it was a potential merger between a white dwarf and neutron star (WD–NS). AT2018kzr peaked in absolute magnitude at −17.98 in the r band, comparable to PS15cey peaking at −18.34. If PS15cey were to be similar to a WD–NS merger event such as AT2018kzr, we would expect it to display similar spectra and colours. AT2018kzr has colour rP1–iP1= −0.18 ± 0.02 from the average of the synthetic photometry of the earliest two spectra and the earliest two epochs of multicolour photometry presented by McBrien et al. (2019). Hence, the estimated rP1 magnitude at this second epoch of PS15cey would be rP1 = 19.46, which implies a decline of 0.29 mag day−1. A similar conversion of the iP1 magnitude to an rP1 point using the colour of AT2017gfo at 1–2 d (r − i = 0.07 after extinction correction Smartt et al. 2017) implies an equivalent rP1 band magnitude of 19.57 (for the second epoch), and an rP1 decline rate of 0.40 mag day−1. These values of 0.3−0.4 mag day−1 imply a slightly slower decline rate to either an AT2017gfo-like kilonova or an AT2018kzr event, the latter of which declined at 0.48 ± 0.03 mag day−1 in r. However, the decline rate is more similar to these fast transients than a typical supernova. It leaves open the possibility that PS15cey is an extreme type of kilonova, such as those resulting from BH–NS mergers as illustrated with the model comparison. Further searches for luminous, fast-declining objects will be important in future surveys.
5.2 Interpretation of PS17cke
The nature of PS17cke is dependent on the reality of the forced flux measurement on the night MJD 57846.506 (12.8 d before discovery) being real or not. As discussed in Section 4, in each of the 8 × 45 s images on that night, there is excess flux but each are ≲5σ. Combining the flux measurements formally leads to a ∼6σ detection above the zero level, but since there seems to be a baseline residual flux of around 6 μJy, this excess is only 3σ above that. The forced photometry is shown in the inset panel of Fig. 5 where the level of the significance can be judged.
5.3 PS17cke as a kilonova
We first assume that this flux on MJD 57846 is not significant and is due to imperfect subtractions at this position, due to the large surface brightness fluctuations. From Fig. 7, we can see that in the period of time allowed between that most recent Pan-STARRS1 non-detections before discovery (MJD 57846) and after discovery (MJD 57863) that it would be possible for an AT2017gfo-like event to occur and subsequently fade from the view of Pan-STARRS1. In Fig. 7, we have shifted the r-band light curve of AT2017gfo back in time by 9 d from maximum and note that the decline of PS17cke from discovery to the next subsequent non-detection is of comparable rapidity. Given this, it opens the possibility that if PS17cke were a genuine kilonova, it may have been detected after maximum light and on decline. The decline of PS17cke from detection to below the detection limit occurs at a rate of approximately 0.523 mag day-1, which is indeed similar to the decline rate of AT2017gfo. If it were similar to AT2017gfo, that would imply a merger date around MJD 57850.3 ± 0.5, 9 d prior to our PS1 discovery. At this epoch, LIGO was observing with both the Livingston (L1) and Hanford (H1) units.4 The combined uptime of both detectors achieved approximately 65 per cent completeness of the day to a depth of near 70 Mpc (The LIGO Scientific Collaboration & the Virgo Collaboration 2019b). Unfortunately, without 100 per cent uptime of at least one detector, it is possible that any kilonova behind PS17cke could have occurred without GW detection. The data point from the NTT imaging on MJD 57865.258 (+ 5.950 d) suffers from the same uncertainty after image subtraction. We do detect excess flux at the position of PS17cke but at about 3σ significance. However, whether this is a detection of faint flux or an upper limit is not critical to the kilonova interpretation, since the level of the flux, or inferred limit, supports the conclusion of a rapid fade within 4−6 d. Although we have only one secure data point, it is clear that this rapid fade is compatible with an AT2017gfo-type kilonova.
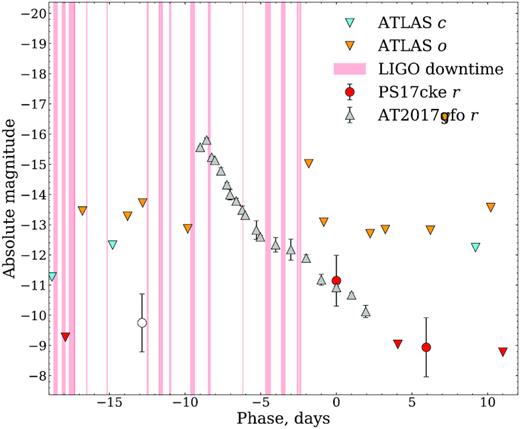
The |$w$|P1 absolute light curve of PS17cke converted to Sloan-r (Tonry et al. 2012) with the discovery exposures and surrounding non-detections averaged per observing epoch. We note the origin of each data point – the +0.000 day point is the discovery detection with Pan-STARRS1, the −12.802 day point (shown as an open circle due to its uncertain nature) is the result of net flux being found in our Pan-STARRS forced photometry, and the +5.950 day point is from net flux in the NTT:EFOSC2 acquisition frames for the attempted classification spectrum. Overlaid is the r-band light curve of AT2017gfo shifted in time to demonstrate the plausibility that a fast-fading event such as a kilonova could have occurred in the period of time between the most recent observations before and after discovery, as well as upper limits from ATLAS as these are closer in time than for PS1. The red bands denote the regions of time where neither LIGO detector was active in the days preceding discovery of PS17cke.
However, if the forced photometry flux on −12.8 d is real and secure, and the errors are reflective of a real detection, then the light curve is not compatible with AT2017gfo, as is clear from Fig. 7. There is no way to shift the light curve to match any part of AT2017gfo. We may more quantitatively explore this by considering comparisons to the diverse array of kilonova light curve models that have been developed by several groups in recent years. These account for different binary combinations, ejecta parameters, and heating rates, so offer several plausible profiles to compare to. We have chosen a number of these to see which provide a favourable comparison to the light curve of PS17cke, beyond the simple comparison to AT2017gfo in Fig. 7 and to determine if a kilonova interpretation is physically plausible if the first detection is real.
Our first attempt to model the light curve of PS17cke was achieved using the POlarization Spectral Synthesis In Supernovae code, POSSIS, presented by Bulla (2019). POSSIS is a 3D Monte Carlo radiation transfer code capable of synthesizing flux and polarization spectra of SNe and kilonovae, as well as light curves for both, by treating opacity and several ejecta parameters as time-dependent properties. The specific grid of models we are comparing to was presented recently by Dietrich et al. (2020), which give dynamical ejecta mass Mej, dyn, post-merger wind ejecta mass Mej, wind, half-opening angle of the lanthanide-rich region ϕ, and viewing angle θobs (given as cos θobs) as free parameters. We show some of our formal ‘best’ fits to the r band PS17cke data in Fig. 8.
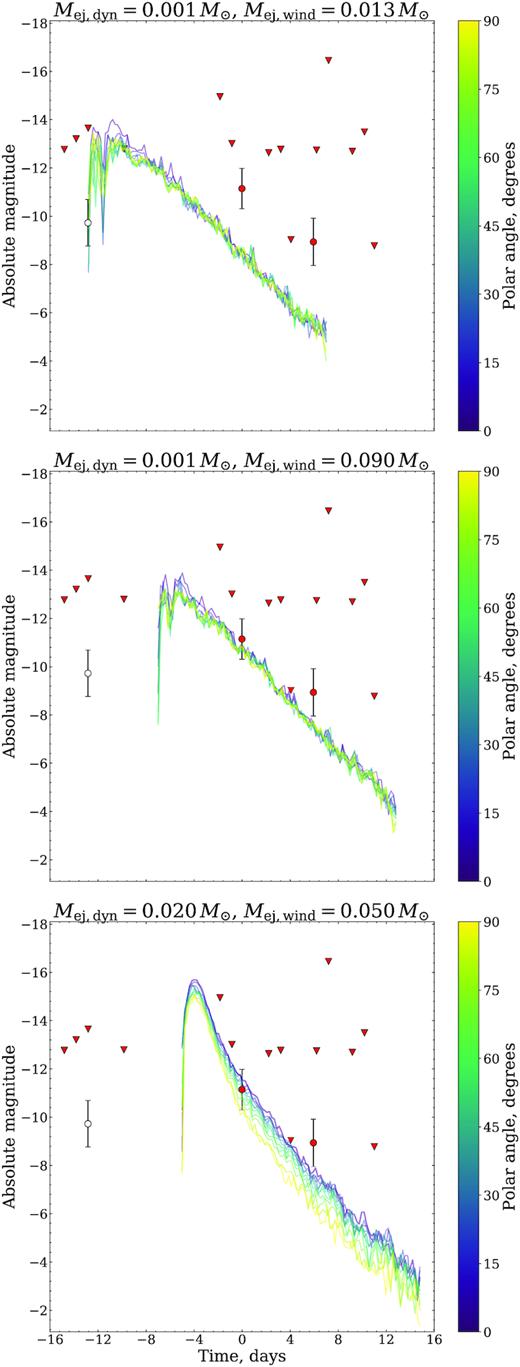
A comparison of the light curve of PS17cke with several models from the grid presented by Dietrich et al. (2020). Top: An attempt to fit all three data points, assuming the earliest detection equates to the merger time. The best-fitting viewing angle of this plot is 15°. Middle: An attempt to fit the final two data points in time using a merger time equal of 7 d prior to discovery. The best-fitting viewing angle of this plot is 60°. Bottom: An attempt to fit the final two data points in time using a merger time equal of 5 d prior to discovery. The best-fitting viewing angle of this plot is 60°.
The top panel of Fig. 8 is an attempt to fit all three data points on the light curve assuming that the merger time corresponds to the date of the earliest detection. It appears impossible to obtain a fit to all three data points, if the forced photometry flux at −12.8 d is real. The fits shown give ejecta masses that tend to the most extreme values allowed on the grid with Mej, dyn = 0.001 M⊙, the minimal allowed mass, and Mej, wind = 0.13 M⊙, the maximum allowed mass. The middle and bottom panels of Fig. 8 both discount this first data point and fit only the second and third. They do so for different assumed merger times of 7 d prior to discovery in the middle panel and 5 d prior to discovery in the bottom panel. The best-fitting parameters of these fits are Mej, dyn = 0.001 M⊙, Mej, wind = 0.09 M⊙, ϕ = 60°, and cos θobs = 0.7 (θobs = 45.57°) in the middle panel, and Mej, dyn = 0.02 M⊙, Mej, wind = 0.05 M⊙, ϕ = 15°, and cos θobs = 0.3 (θobs = 72.54°). Both fits do adequately describe the data, but constraining the parameters any further than this requires a more precise knowledge of the merger epoch. We show as well in these panels the combined ATLAS and PS1 upper limits from epochs surrounding the discovery of PS17cke, corrected from their native filters to r by assuming a similar SED to AT2017gfo, but do not observe any discrepancies between the model fits and the upper limits.
In the case of the first model, which assumes the merger time was the same as our earliest photometric data point on MJD 57846.506 (2017 April 3, 12:08:38 UTC), we note that both L1 and H1 were observing to depths of 70 − 80 Mpc, though given the quality of the fit in the top panel of Fig. 8, we do not believe that this is representative of a true merger epoch. The second model, however, uses a merger time of 7 d prior to discovery (MJD 57852). On this epoch, the combined detector uptime reached 100 per cent to similar distances as before. Likewise, the third model used a merger time of 5 d prior to discovery (MJD 57854) where coverage from both LIGO units was more sparse. We estimate that the combined detector completeness was approximately 63 per cent on this epoch.
The recently published models of Kawaguchi, Shibata & Tanaka (2020) provide another suitable point of comparison. These models, based on those of Tanaka & Hotokezaka (2013), also come from a radiative transfer code with photon transfer simulated by Monte Carlo calculations for various profiles of ejecta density, velocity, and elemental abundances. Of particular note among the Kawaguchi et al. (2020) models are those of the fiducial case of a binary neutron star merger that undergoes a prompt collapse to a black hole and a scenario in which the binary neutron star merger begets a long-lived supermassive neutron star (SMNS) remnant. The chosen models, per table 1 of Kawaguchi et al. (2020), are BH_PM0.001, BH_PM0.01, SMNS_DYN0.003, SMNS_DYN0.01. BH_PM0.001, and BH_PM0.01, and describe the prompt collapse of the merged neutron stars for lanthanide-rich post-merger ejecta masses of 0.001 M⊙ and 0.01 M⊙, respectively, though both have a dynamical ejecta mass of 0.001 M⊙. On the other hand, SMNS_DYN0.003 and SMNS_DYN0.01 describe the formation of a long-lived SMNS following the merger, which accelerates the post-merger ejecta to higher velocities than in the previous models. For these, a common post-merger ejecta mass of 0.05 M⊙ is adopted while dynamical ejecta masses of 0.003 M⊙ and 0.01 M⊙, respectively, are employed.
Kawaguchi et al. (2020) present simulated light curves of these merger scenarios for grizJHK and we show the comparison of the decline of PS17cke to the r-band models in Fig. 9 for a distribution of viewing angles on the ejecta over 0° < θ < 90°. As with the POSSIS models, we include the ATLAS and PS1 upper limit data, converted to r, when interpreting the model comparisons. There are no models that can fit the data if we assume that the first point at −12.8 d is real and a reliable measurement. If it is treated as a non-detection and upper limit, then at least three of the models can reasonably reproduce the data, though with some variation in the predicted merger time between them. In the case of the prompt collapse models, they are typified by low ejecta masses, which is supported by numerical simulations performed by Hotokezaka et al. (2013). The ejecta becomes suppressed by the prompt collapse, which in turn contributes to a lower luminosity light curve. We see this in the left-hand panels of Fig. 9, with all light curves being fainter than at least −15.5 magnitudes for both model sets. Of these models, if we were to assume that the merger time is equivalent to or in the region of the discovery epoch of PS17cke, we would observe that BH_PM0.01 provides a better fit than BH_PM0.001, with both being broadly consistent with the limits imposed by ATLAS and PS1. At the same time, both the SMNS_DYN0.003 and SMNS_DYN0.01 models provide good fits to the data if the merger time is taken to be 2 d before discovery (MJD 57857). We must note here that due to uncertainty in the opacity values used to produce these models, it is possible that their brightness at epochs ≲1 d is overestimated. Hence, we do not attribute a large significance to the coincidence of BH_PM0.01 with PS17cke or the discrepancy of the ATLAS and PS1 upper limits with SMNS_DYN0.003 and SMNS_DYN0.01 that can been seen in the right-hand panels of Fig. 9.
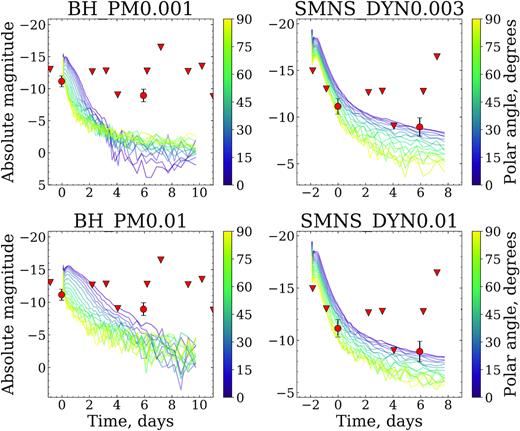
A comparison of the PS17cke light curve with several models presented by Kawaguchi et al. (2020). The chosen models include ejecta profiles that describe scenarios of prompt collapse to a black hole and the formation of a long-lived supermassive neutron star (SMNS), with various combinations of post-merger and dynamical ejecta masses. Top left: A prompt collapse model with post-merger ejecta mass 0.001 M⊙. Bottom left: A prompt collapse model with post-merger ejecta mass 0.01 M⊙. Top right: An SMNS model with dynamical ejecta mass 0.003 M⊙. Bottom right: An SMNS model with dynamical ejecta mass 0.01.
On the epoch of discovery, the combined detector uptime was approximately 98 per cent to a typical distance of 60 Mpc. Two days prior to this, the merger epoch inferred by the SMNS model comparisons, we estimate the combined detector uptime to be approximately 99 per cent to a similar distance.
5.4 PS17cke as a luminous blue variable outburst
If the first data point at −12.8 d is real, then the analysis in Section 5.3 indicates that it is difficult to interpret the transient as a kilonova. Another possible explanation for the origin of such an intrinsically faint event is in an outburst from an unstable massive star such as a luminous blue variable (LBV, Humphreys & Davidson 1994). LBVs are often discovered in nearby (d < 25 Mpc) galaxies at absolute magnitudes −11 > M > −13, which is consistent with this object. A comparison of the light curve of PS17cke to previously discovered objects with notable outbursts offers some insight to this object being an LBV. SN2009ip was first discovered on 2009 August 26 (Maza et al. 2009) and has been observed for several years since its discovery. It notably showed rebrightening several years later (Drake et al. 2012) and is now known to be the result of an outbursting LBV in NGC 7259. Observations presented by Pastorello et al. (2013) in the years since its discovery provide an extensive UBVRI light curve for comparison. For PS17cke to fade below the most recent non-detection following discovery, it must decline by 0.523 mag day−1. By simply measuring the rise and decline between successive points in the R-band light curve of SN2009ip, we can identify at least five regions where the decline exceeds this limit for PS17cke. Similarly, we can compare PS17cke to the LBV in NGC 3432, formally known as SN2000ch (Pastorello et al. 2010). There are at least two regions of the V-band light curve presented by Pastorello et al. (2010), which exceed the decline rate limit. While this is not conclusive proof that PS17cke is an LBV outburst, it indicates that it is a plausible explanation.
Although numerous LBVs have been discovered that have exhibited repeat outbursts, perhaps most famously η Carinae (Humphreys, Davidson & Smith 1999) but also the events discussed by Maund et al. (2006) and Smith et al. (2011) as well as Pastorello et al. (2010) and Pastorello et al. (2013), it is unclear if this is a ubiquitous trait of this class of objects. Of course, supposing PS17cke is an LBV, the detection of a repeat outburst would immediately disqualify it from consideration as a kilonova candidate. As discussed in previous sections, we have forced photometry throughout the history of Pan-STARRS observations between MJD 57805 and MJD 58879 and find no significant flux excess above 21st magnitude. For more complete temporal coverage and a search for activity at the position of PS17cke, we have analysed all ATLAS data at this position (Tonry et al. 2018; Smith et al. 2020). We have generated forced photometry at the location of PS17cke from the ATLAS images and manually inspected all exposures for the duration of its survey. We note that there are significant detections (>5σ) at several epochs including MJD 57893, MJD 57904, and MJD 58545. An inspection of the exposures shows that the majority of these are failed subtractions resulting in excess flux from the host contaminating the forced photometry measurement or other detector artefacts and we rule them out as real detections. We have measured our archival forced photometry at the location of PS17cke in ATLAS in units of flux density (microJansky) and plotted this in Fig. 5. That we do not detect PS17cke is perhaps unsurprising as the discovery magnitude in PS1 was |$w$|P1 = 19.69 ± 0.04. For ATLAS, this is below the detection limit, so we would require an even brighter outburst to occur for ATLAS to detect it.
What is necessary to conclusively identify whether PS17cke is an LBV is deeper imaging data, which shows a luminous point source at its location. We have inspected the deeper imaging data from NTT:EFOSC2 (totalling 1200 s in the V band) from MJD 58872.319 (2020 January 24, 07:39:42 UTC). The image quality of the combined frame was 0|${^{\prime\prime}_{.}}$|69 but this was not deep enough or high enough in resolution to determine if a stellar point source (or compact stellar cluster) exists at the position of PS17cke. There is no clear detection of a resolved source, but there is some extended emission at the position. To conclusively distinguish between an LBV-type outburst and a kilonova candidate will require Hubble Space Telescope imaging, both in the optical and NIR. This would determine if there were a point source to absolute magnitudes of M ∼ −5 and hence if it is a stellar outburst. If there was no detection of a point source, then a faint transient such as a kilonova is a candidate.
5.5 PS17cke as a faint transient
We have discussed two promising explanations of the nature of PS17cke – those of a kilonova borne of either an NS–NS merger or an BH–NS merger and the outburst of an LBV star. In recent years, several intrinsically faint and fast-fading transients have been discovered, themselves explainable through unique explosion and merger scenarios. We outline a few in this section and briefly discuss the plausibility of a comparison between them and PS17cke.
5.5.1 Fast-evolving luminous transients
Fast-evolving luminous transients (FELTs) are a category of many classes of transient phenomena characterized by a rise to maximum of <10 d and subsequent fade from view in <30 d. Numerous FELTs have been detected over the years, with prominent examples being those of KSN2015K (Rest et al. 2018), iPTF14gqr (De et al. 2018), and iPTF16asu (Whitesides et al. 2017), as well as several of the objects discussed by Drout et al. (2014). While these objects do decline rapidly (0.21 mag day−1 in g in the case of iPTF14gqr, De et al. 2018), they are often too bright at maximum light to be compared to a kilonova progenitor, or are just too long lived. In this paper, we presented model comparisons of NS–NS merger scenarios that spanned a peak absolute magnitude range of −10 > Mr > −15 and BH–NS merger scenarios that can reach Mr ≃ −18. For context, the brightest of the above objects is iPTF16asu, peaking at −20.4 in g (Whitesides et al. 2017). An object as bright as these occurring in the host of PS17cke would have been detected at an apparent magnitude of 21 > mr > 16, well above the detection limit of PS1 and, for many objects, above that of ATLAS as well. With regard to our ATLAS limits, we note that the most constraining limits are between −9.828 d at o > 17.95 and −0.835 d at o > 17.73 (there is an additional limit between these at −1.827 d, but this is shallower at o > 15.79). Any FELT that could describe PS17cke would need to essentially fit into this ∼9-d period without being discrepant with our PS1 discovery point, but none of the outlined objects above are capable of this.
5.5.2 Fast, blue optical transients
Fast, blue optical transients (FBOTs) evolve on similar time-scales to FELTs but also exhibit a strong blue colour (g − r < −0.2) and blackbody temperatures of |$10\, 000$|–|$30\, 000$| K (for a review of this category of objects, we refer the reader to that of Inserra 2019). Objects that can be considered FELTs, such as those discussed in the previous section, are often considered to be FBOTs as well. Some standout examples of FBOTs, particularly because of their blue colour, include SN2018gep (Ho et al. 2019), AT2018cow (Prentice et al. 2018; Perley et al. 2019), and SN2019bkc (Chen et al. 2019; Prentice et al. 2020). We encounter similar problems as with FELTs when comparing FBOTs to PS17cke in that they are often too bright or their evolution is not as rapid as would be necessary to describe PS17cke. FBOTs have the additional diagnostic of colour and temperature information, but unfortunately, this is lacking for PS17cke. Still, we believe that if PS17cke were an FBOT that it should have been observed by ATLAS at at least one epoch. As with FELTs, any FBOT that could describe PS17cke would need to be shorter lived than ∼9 d, else it would have been observed by ATLAS. The objects discussed here represent some of the fastest evolving events currently known, but it appears that the only AT2017gfo is capable of this feat.
5.5.3 Type Iax supernovae
Type Iax supernovae (SNe Iax) are a subclass of normal Type Ia SNe characterized by typically lower luminosities and lower ejecta velocities. Their classification name is derived from the prototypical SN Iax event, SN2002cx (Li et al. 2003; Foley et al. 2013). For a review of this type of object, we refer the reader to that of Jha (2017). Several objects belonging to this subtype have been discovered over the years that could provide a worthy comparison to PS17cke, including SN2008ha (Foley et al. 2009; Valenti et al. 2009), SN2010ae (Stritzinger et al. 2014), and SN2019gsc (Srivastav et al. 2020). Respectively, these objects peaked at −14.2 in V, −15.3 in V, and −14.0 in r. We note that these are somewhat brighter than PS17cke but is plausible, given that it likely would have been discovered later in its evolution. These SN Iax events display varying declines rates as well. SN2008ha was quoted as declining fastest in bluer bands with Δm15(B) = 2.03 ± 0.20 mag while for SN2010ae, this stands at Δm15(B) = 2.43 ± 0.11 mag (Stritzinger et al. 2014). SN2019gsc is quoted as declining at a rate Δm15(r) = 0.91 ± 0.10 mag, which gives an approximate nightly decline rate of ∼0.06 mag day−1. Although similar in magnitude, these events prove to be too longer lived than PS17cke, which disfavours them for comparison. It is difficult to compare further without multiwavelength coverage or spectroscopic follow-up.
5.5.4 WD-NS mergers
We previously compared PS15cey to the suspected WD–NS merger AT2018kzr (McBrien et al. 2019; Gillanders et al. 2020), so for completeness shall do the same for PS17cke. AT2018kzr was a significantly more luminous event than for what we observe in PS17cke, peaking at −17.98 in r, which places it in the category of a FELT. Unlike other FELTs, however, AT2018kzr exhibited a strikingly rapid decline, approaching the rate at which AT2017gfo-like kilonovae decline, at 0.48 ± 0.03 mag day-1 in r. We find this decline rate a much more favourable comparison than the previous objects considered. The difference in peak magnitude can be explained if PS17cke is later in its evolution than our light curve suggests. This is plausible, given the near 12 d gap in observations prior to discovery. For reference, AT2018kzr had a rise time of within 3 d of its discovery, which, if a similar mechanism is responsible for PS17cke, we note is not discrepant with the data, even though it is not significantly constraining. Similarly, as AT2018kzr approaches the rapid decline of AT2017gfo, it would be plausible that a WD–NS merger could have occurred in the time between the previously outlined constraining ATLAS limits and the PS1 detection of PS17cke.
5.5.5 Luminous red novae
One possible interpretation of PS17cke is in the form of a massive stellar explosion such as a LBV; however, LBVs are not the only stellar explosions we may compare to. Luminous red novae (LRNe) are another type of stellar explosion that result from the merging of two stars rather than as a consequence of instability and outburst from a single star. The earliest example of an LRN is M85 OT2006-1 (Kulkarni et al. 2007), which was discovered in the outskirts of M85 in the Virgo cluster, though its classification as an LRN is debated (Pastorello et al. 2019b). Since its discovery, numerous other LRN candidates have been identified, displaying similar characteristics, with magnitudes peaking in the gap between those of novae and supernovae. Examples of these include AT2017jfs (Pastorello et al. 2019a) and AT2018hso (Cai et al. 2019). A study of LRN performed by Pastorello et al. (2019b), which included six other LRN candidates beyond those mentioned here, found that these objects typically occupy magnitude space between −13 and −15 magnitudes and in many cases exhibit a secondary peak and plateau in their light curves. While it is reasonable to assume that PS17cke did occupy this magnitude range, we do not observe a plateau for it or indeed any additional rebrightening of the light curve. As such, we do not feel that PS17cke is likely to be an LRN.
5.5.6 Failed supernovae
Lastly, we consider the possibility that PS17cke may be ‘failed supernova’ – the result of a massive star collapsing to a BH without undergoing an SN explosion (Heger et al. 2003). A survey for failed supernova candidates presented by Gerke, Kochanek & Stanek (2015) with the Large Binocular Telescope (LBT) yielded one event of note, which Adams et al. (2017) refer to as N6946-BH1. N6946-BH1 was a red supergiant (RSG) star in the galaxy NGC 6946 that experienced an optical outburst before subsequently fading from view (Adams et al. 2017). The loss in brightness from outburst to fade spanned at least five magnitudes, though it was not well sampled in UBVR or gri imaging from LBT or the Isaac Newton Telescope. The temporal sampling of the NGC 6946-BH1 candidate does not provide a decline rate on the few day time-scale that we observe for PS17cke. However, there is a physical reason to disfavour this scenario. The death of an RSG in the mass range of |$18 \lesssim \, \mbox{M$_{\odot }$}\lesssim 25$| has been predicted, through hydrodynamical simulations, to produce a short, optical transient (log L/L⊙ ≃ 107 for approximately 3−10 d) that gives rise to fainter (log L/L⊙ ≃ 106) but longer lived (∼1 yr) emission from the disruption of its hydrogen envelope following collapse of the helium core (Lovegrove & Woosley 2013). The secondary emission is noted to be much redder, reminiscent of LRNe. The Lovegrove & Woosley (2013) time-scale of approximately 1 yr is due to the dynamical time-scale for a massive RSG. The time for free fall collapse of a spherical body is |$t_{\mathrm{dyn}} \sim \left(\frac{2 R^3}{\mathrm{ GM}} \right)^{\frac{1}{2}}$| giving a time-scale of 0.5 yr for a 20 M⊙ RSG with R ≃ 1000 R⊙. Therefore, the rapid decline is not physically consistent with either the dynamical time-scale of the star or the hydrodynamical calculation of Lovegrove & Woosley (2013).
6 CONCLUSIONS
We have presented PS15cey and PS17cke (AT2017des) – two prospective kilonova candidates discovered as part of the PSSK. PS15cey stood out for possessing a rapid decline approaching that of the kilonova AT2017gfo across two optical bands in Pan-STARRS. Owing to uncertainty in available catalogue redshifts, we obtained spectroscopic observations of the host of PS15cey and measured a secure redshift, |$z$| = 0.0717 ± 0.0006, which placed it outside the bounds of PSSK at a luminosity distance of 320 Mpc. The redshift measurement also revealed that its peak absolute magnitude was at least two magnitudes brighter than AT2017gfo, which lead us to disfavour an NS–NS merger progenitor scenario for this object. The most promising attempts to model the available photometry were achieved with luminous kilonova models borne of BH–NS merger scenarios (Barbieri et al. 2020a). The models presented in this paper can successfully reproduce the peak magnitude of PS15cey and suggest a merger epoch within 0.8–1.2 d prior to our discovery. Unfortunately, with the next observation of the field not occurring until 55 d after discovery, it is difficult to constrain the light curve fits further. The specific models shown favour a maximally spinning black hole and fits can be produced to maximize dynamical ejecta and total ejecta mass for differing combinations of primary and secondary masses. Comparisons to AT2018kzr also seem promising, both being of a similar peak magnitude and showing a similar decline. Without proper spectroscopic follow-up, however, it remains difficult to discern between these two possibilities and either is plausible.
We conclude that our second candidate, PS17cke, is a plausible kilonova candidate. With one secure detection and deep limits indicating a rapid fade, the decline rate is similar to AT2017gfo and a range of kilonova model light curves. We carried out forced photometry at the position of PS17cke in the history of both the Pan-STARRS and ATLAS surveys and find one marginal detection at −12.8 d before discovery. We employed several checks to verify this including the construction of a customized deep reference stack in PS1 and creation of difference images using two different subtraction and analysis pipelines (Rest et al. 2005; Magnier et al. 2020a). The flux at this epoch can be attributed to residuals from the subtraction process, and it cannot be confirmed as a genuine point source detection. Interpretation of the physical nature of PS17cke is dependent on whether this earliest point is real. Assuming it is not, then our detections and limits allow a favourable comparison of the light curves of several NS–NS and BH–NS merger models, including those presented by Dietrich et al. (2020) and Kawaguchi et al. (2020). These models match the measured decline rate and are consistent with the upper limits available. Depending on the model, we suspect that the merger would have occurred between 2 and 7 d prior to discovery. For the majority of this time, we note that LIGO was observing with at least one detector online, as is illustrated in Fig. 7, making it highly likely that were a GW signal produced in concurrence with the optical signal of PS17cke, it would have been observed. However, there are periods during which neither LIGO detector was locked and working and it is possible that a merger occurred during one of these windows and was missed. If, however, this earliest data point is interpreted as a real detection, then a kilonova model is inadequate in describing the data and we consider an LBV outburst explanation more likely. Previously observed LBV outbursts, such as SN2000ch (Pastorello et al. 2010) and SN2009ip (Maza et al. 2009; Pastorello et al. 2013), do experience multiple periods of decline in their light curves comparable to PS17cke, but we observe this outburst only once for PS17cke in the history of PS1 and ATLAS survey data. This is peculiar as we would expect that multiple periods of outbursting were this a genuine LBV. We consider other faint and fast-declining transients but find these even less likely to fit the observational constraints. We propose that the two scenarios of a kilonova and an LBV outburst could be distinguished by deep Hubble Space Telescope imaging of the site. The LBV scenario predicts that a luminous star must be visible at the position at M ≲ −5, while the kilonova explanation would survive if there were no single massive star at the location. This would imply that a kilonova explanation is plausible but not definitive. One final point we note is that the uncertainty in the explosion epoch of PS17cke, and PS15cey as well, renders the search for a high-energy counterpart of the level of GRB170817A, rescaled to their respective distances moot, and that no high-energy counterpart temporally or spatially coincident with either event has been recorded.
The kilonovae candidates presented in this paper represent examples of the kind of objects we are searching for in the Local Universe independent of GW triggers within the PSSK (Smartt et al. 2019) and the ATLAS volume limited survey within 100 Mpc (Smith et al. 2020). This may be a fruitful search for degenerate mergers in the gap between the LIGO–Virgo Consortium observing runs of O3 and O4 and may also discover kilonovae beyond the horizon distances of the GW detectors or in periods when they are not locked and observing.
ACKNOWLEDGEMENTS
The authors would like to thank Russ Laher, Frank Masci, and Adam Miller for checking the intermediate Palomar Transient Factory data base for detections of PS15cey and Kyohei Kawaguchi for providing model data used in the comparisons for PS17cke.
SJS, KWS, and DRY acknowledge funding from the Science and Technology Facilities Council (STFC) grant ref: ST/P000312/1 and ST/S006109/1. CB acknowledges support from the Instituto Nazionale di Fisica Nucleare (INFN), under the Virgo-Prometeo initiative. MG is supported by the Polish NCN MAESTRO grant 2014/14/A/ST9/00121. MF is supported by a Royal Society – Science Foundation Ireland University Research Fellowship. MN is supported by a Royal Astronomical Society Research Fellowship. KM acknowledges support from the European Research Council (ERC) Starting grant no. 758638. TWC acknowledges the EU Funding under Marie Skłodowska-Curie grant agreement no. 842471. TW is funded by ERC grant 320360 and by European Commission grant 730980. TMB was funded by the CONICYT PFCHA/DOCTORADOBECAS CHILE/2017-72180113. FOE acknowledges support from the FONDECYT grant no. 1201223.
The discoveries from this program are a byproduct of the Pan-STARRS NEO survey observations. Operation of the Pan-STARRS1 and Pan-STARRS2 telescopes is primarily supported by the National Aeronautics and Space Administration (NASA) under grant no. NNX12AR65G and grant no. NNX14AM74G issued through the SSO Near Earth Object Observations Program.
The Pan-STARRS1 Surveys (PS1) and the PS1 public science archive have been made possible through contributions by the Institute for Astronomy, the University of Hawaii, the Pan-STARRS Project Office, the Max-Planck Society and its participating institutes, the Max Planck Institute for Astronomy, Heidelberg, and the Max Planck Institute for Extraterrestrial Physics, Garching, The Johns Hopkins University, Durham University, the University of Edinburgh, the Queen’s University Belfast, the Harvard-Smithsonian Center for Astrophysics, the Las Cumbres Observatory Global Telescope Network Incorporated, the National Central University of Taiwan, the Space Telescope Science Institute, the National Aeronautics and Space Administration under grant no. NNX08AR22G issued through the Planetary Science Division of the NASA Science Mission Directorate, the National Science Foundation grant no. AST-1238877, the University of Maryland, Eotvos Lorand University (ELTE), the Los Alamos National Laboratory, and the Gordon and Betty Moore Foundation.
ePESSTO observations were obtained under the European Southern Observatory (ESO) program ID 1103.D-0328 and 199.D-0143 (PI: Smartt). ePESSTO + observations were obtained under ESO program ID 1103.D-0328 (PI: Inserra). SALT:RSS observations were obtained under program ID 2016-1-MLT-007 (PI: Jha).
This work has made use of the Asteroid Terrestrial-impact Last Alert System (ATLAS) project. ATLAS is primarily funded to search for near-earth asteroids through NASA grants NN12AR55G, 80NSSC18K0284, and 80NSSC18K1575; byproducts of the NEO search include images and catalogues from the survey area. The ATLAS science products have been made possible through the contributions of the University of Hawaii Institute for Astronomy, the Queen’s University Belfast, and the Space Telescope Science Institute.
DATA AVAILABILITY
The data underlying this article are available in the article and in its online supplementary material.
Footnotes
Forced photometry is a technique used to measure the flux at the position of transient in a difference image where it does not have a clear, 5σ significance detection. The technique uses the spatial position of the transient in a high significance detection image and the point spread function (PSF) of the image from brighter stars. A PSF model is built exactly at the known position of the transient and is fit to the flux in the difference image. This allows flux to be reliably recovered below the 5σ limit, while ensuring that the flux is measured at the known position of the transient with a suitable PSF.
Private communications with Russ Laher, Frank Masci, and Adam Miller.
