


This is an erratum to the paper ‘The GOGREEN survey: the environmental dependence of the star-forming galaxy main sequence at 1.0 < z < 1.5’ that was published in MNRAS, 493, 5987–6000 (2020). The [O ii] fluxes and derived star-formation rates we derive from our spectra require an absolute flux calibration, which is obtained by comparing with the i-band photometry. In the data presented in the original publication, this calibration was applied incorrectly, as its inverse. The error has little effect on the mean properties of the sample, because the scaling factor is below unity for about half the sample, and above unity for the other half. However, it had the effect of greatly increasing the scatter in these derived quantities. This has a modest impact on our quantitative conclusions and interpretation.
The reduced scatter is apparent in Fig. 1, where we show the corrected fluxes as a function of redshift. The fluxes now span a smaller dynamic range, with a better defined upper limit. Importantly, we now see that the detection limit, as defined by the ΔBIC criterion, better corresponds to a fixed line flux limit which, however, is the same limit identified in the original version of the paper.
![Galaxy redshift and $F([{\rm O}\, {{\small II}}])$, where points are colour-coded by the ΔBIC criteria. Galaxies where the model including both a continuum and an [O ii] emission line are strongly favoured over a model with just a continuum are represented as purple circles. Galaxies where neither model is strongly favoured are represented as green squares, and galaxies where the continuum-only model is strongly favoured are represented as dark orange diamonds. The $80{{\ \rm per\ cent}}$ flux completeness limit, $F([{\rm O}\, {{\small II}}])=2.3\times 10^{-17}\,{\rm erg}\,{\rm cm}^{-2}\,{\rm s}^{-1}$, is shown as a dashed grey line. Galaxies above this flux limit are selected as star forming. This figure is an updated version of fig. 2 in the original published manuscript.](https://oup.silverchair-cdn.com/oup/backfile/Content_public/Journal/mnras/500/1/10.1093_mnras_staa2890/1/m_staa2890fig1.jpeg?Expires=1749907827&Signature=MwsjWCBJNysgZbVzU2p8owty7JgijpUgDy29vE6as9XQgv2nSAu34ni8WKpDqjPqn-5YqH~Zj8m~ASmg6F8nFrYLJtUI-zgE0wxnb1t0rRAN8-lU4Roay63-PENbrTua1pQenFbkubBmVaPYPz~SvGPDlw5JzGSjWP9KGNJhAn1bIcrFleXLspuJ1Rp~b0UMa72eCEzlCL03kadAaPurAcYcpFK0rTwgQ7cPkkO6rrBvi6c7tWg~kQwsZMWBjtrgo2vOHTbOKvJT0GrIH1wH0I9MMbomp6tqmD7r0rTHmGAcbRnXLC7kqn6i~RW9CN1XFMP9swLOj32knKQ6QhTKmA__&Key-Pair-Id=APKAIE5G5CRDK6RD3PGA)
Galaxy redshift and |$F([{\rm O}\, {{\small II}}])$|, where points are colour-coded by the ΔBIC criteria. Galaxies where the model including both a continuum and an [O ii] emission line are strongly favoured over a model with just a continuum are represented as purple circles. Galaxies where neither model is strongly favoured are represented as green squares, and galaxies where the continuum-only model is strongly favoured are represented as dark orange diamonds. The |$80{{\ \rm per\ cent}}$| flux completeness limit, |$F([{\rm O}\, {{\small II}}])=2.3\times 10^{-17}\,{\rm erg}\,{\rm cm}^{-2}\,{\rm s}^{-1}$|, is shown as a dashed grey line. Galaxies above this flux limit are selected as star forming. This figure is an updated version of fig. 2 in the original published manuscript.
There are now 111 cluster and 214 field galaxies above this completeness limit. The updated figures based on this sample are shown here. We still find a modest trend for lower SFRs in the cluster population, at fixed stellar mass, relative to the field. The mean difference is log (ΔSFRMS) = −0.064 M⊙ yr−1. However, the significance is reduced to ∼2.2σ. The weak trend in redshift noted in the original paper is no longer present.
As the sense and magnitude of the observed trend remains unchanged, our qualitative interpretation and conclusions are not impacted. The quantitative constraints derived from our toy models have changed. Specifically, we considered a simple model in which we assume that cluster galaxies form earlier than field galaxies by an amount Δt, but otherwise follow the same declining SFR with time. In order to match the small difference in SFR that we observe, we require Δt < 0.3 Gyr for high-mass galaxies (log (M*/M⊙) ∼ 11.2) and Δt < 0.6 Gyr for low-mass galaxies (log (M*/M⊙) ∼ 9.0). These age differences are now consistent with what we find for the differences in the mass-weighted age of the quiescent populations (Webb et al. 2020).
The second model explored in the paper was based on a delayed-then-rapid quenching model applied upon infall on to a cluster. Those constraints were weak in the original version of the paper and are even weaker with the revised data. The data therefore do not provide useful insight into any infall-driven quenching mechanisms that might be taking place in the context of this simple model. Since the original paper was published, we have made additional measurements on the stellar mass function (van der Burg et al. 2020) and mass-weighted ages (Webb et al. 2020); future work will revisit this and other models in light of all available observational constraints.
![UVJ-diagram of [O ii] emitters with classifications from Muzzin et al. (2013) for 1 < z < 4 (adapted from Williams et al. 2009), where quiescent galaxies are above the dashed line in the upper left region, and star-forming galaxies are below the dashed line. This figure is an updated version of fig. 3 in the original published manuscript.](https://oup.silverchair-cdn.com/oup/backfile/Content_public/Journal/mnras/500/1/10.1093_mnras_staa2890/1/m_staa2890fig2.jpeg?Expires=1749907827&Signature=zWRatn~cQo3ftV853CuH4sdbpX4W25gsujUov0ST~Qr1xHRmTIryZacXekfpzHZSGgkbajK87kedWZi1uuFSQSn5Q1lIKXRgxBwsLHuYLUxdqsv6z-buM9QHA~9Uxye2Pyu3zvV24Oe5X0ujvCi8llzVLv4tsPyCni-gT5td0-M5ShNuLmpTdkXrtGufwsfqtKHE4KxWFrFNyMxkGOI6vTZ-v5RwBinc8ynxZL6hy6AOwjiehktiNIrRCeS5UCfAzLOwWHbJv55aig~oNhh2kaftCaMmmJ1zCYP6tQauw5Q8sYDrraS1p8kuOcjKB-xETyCRy3G~zGCIfZ0KO-R3MQ__&Key-Pair-Id=APKAIE5G5CRDK6RD3PGA)
UVJ-diagram of [O ii] emitters with classifications from Muzzin et al. (2013) for 1 < z < 4 (adapted from Williams et al. 2009), where quiescent galaxies are above the dashed line in the upper left region, and star-forming galaxies are below the dashed line. This figure is an updated version of fig. 3 in the original published manuscript.
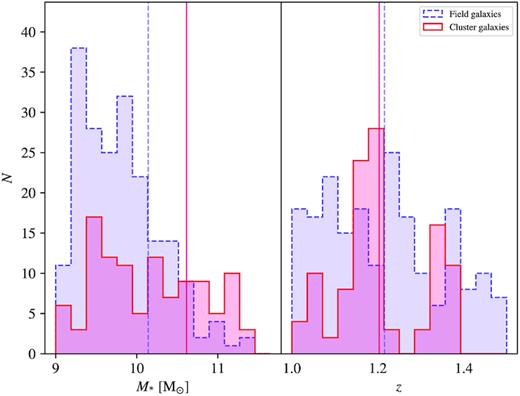
The stellar mass (left) and redshift (right) distributions for the field (dashed purple) and cluster (solid crimson) samples. The vertical lines represent the mean stellar mass and mean redshift of the cluster and field galaxy populations. This figure is an updated version of fig. 4 in the original published manuscript.
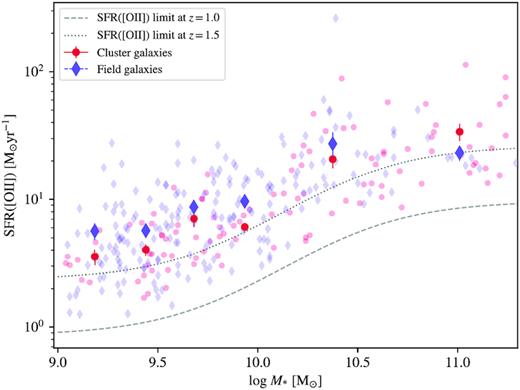
The main sequence of star formation of cluster galaxies versus field galaxies in the GOGREEN fields. The solid purple and crimson markers signify the mean field SFRs and the cluster galaxy SFRs in each stellar mass bin, respectively. The field SFRs have been corrected using the cosmic SFR versus z relation from Schreiber et al. (2015) in order to match the mean redshift of cluster galaxies within each stellar mass bin. The error bars represent the bootstrap standard error from bootstrap resampling the data within each bin. The dashed and dotted grey lines represent the SFRs that correspond to the |$80{{\ \rm per\ cent}}$| flux completeness limit at z = 1.0 and z = 1.5, respectively. This figure is an updated version of fig. 5 in the original published manuscript.

Cluster and field ΔSFRMS distributions. The solid crimson vertical line represents the mean cluster galaxy ΔSFRMS and the dashed purple vertical line represents the mean field galaxy ΔSFRMS. This figure is an updated version of fig. 6 in the original published manuscript.
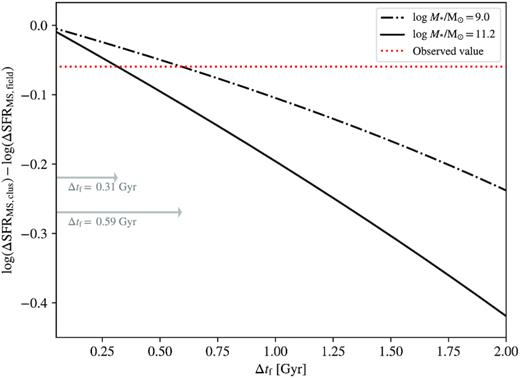
The average difference in formation time between cluster and field galaxies versus the difference in log (ΔSFRMS) between the two samples. These values are derived from the Schreiber et al. (2015) cosmic SFR versus redshift relation assuming two fiducial stellar masses located at the minimum (dashed dotted) and maximum (solid) ends of the stellar mass distribution of our sample. The red dotted line shows the observed log (ΔSFRMS) difference between cluster and field. This figure is an updated version of fig. 7 in the original published manuscript.
