


ABSTRACT
We studied the outburst evolution and timing properties of the recently discovered X-ray transient MAXI J1348−630 as observed with NICER. We produced the fundamental diagrams commonly used to trace the spectral evolution, and power density spectra to study the fast X-ray variability. The main outburst evolution of MAXI J1348−630 is similar to that commonly observed in black hole transients. The source evolved from the hard state (HS), through hard- and soft-intermediate states, into the soft state in the outburst rise, and back to the HS in reverse during the outburst decay. At the end of the outburst, MAXI J1348−630 underwent two reflares with peak fluxes approximately one and two orders of magnitude fainter than the main outburst, respectively. During the reflares, the source remained in the HS only, without undergoing any state transitions, which is similar to the so-called ‘failed outbursts’. Different types of quasi-periodic oscillations (QPOs) are observed at different phases of the outburst. Based on our spectral-timing results, we conclude that MAXI J1348−630 is a black hole candidate.
1 INTRODUCTION
Black hole transients (BHTs) usually show distinct spectral and temporal states during an outburst (see Remillard & McClintock 2006 and Belloni, Motta & Muñoz-Darias 2011 for reviews). Following the classification of Homan & Belloni (2005), four main states can be identified based on their spectral-timing properties: the hard state (HS), the hard-intermediate state (HIMS), the soft-intermediate state (SIMS), and the soft state (SS). The outburst evolution along these states can be well studied through several fundamental tools, e.g. the hardness–intensity diagram (HID; Homan et al. 2001), the hardness–rms diagram (HRD; Belloni et al. 2005), and the rms–intensity diagram (RID; Muñoz-Darias, Motta & Belloni 2011). During most outbursts, BHTs evolve from the HS, through the HIMS and SIMS, into the SS in the outburst rise. In the outburst decay, the outbursts generally evolve back to the HS in reverse order (see, e.g. Homan & Belloni 2005; van der Klis 2006; Belloni et al. 2011; Motta et al. 2011). Note that the transition between the different states does not necessarily follow the given order, as there can be excursions to either harder or softer states (Belloni et al. 2011). In addition, some outbursts of some sources never undergo a transition to the SS. These outbursts are commonly known as ‘failed outbursts’ (e.g. Sturner & Shrader 2005; Capitanio et al. 2009; Del Santo et al. 2016).
Timing properties also change dramatically between states (e.g. Motta 2016, and references therein). In the HS and HIMS, the power density spectra (PDS) are dominated by strong band-limited noise and sometimes a type-C quasi-periodic oscillation (QPO). Type-C QPOs are characterized by a narrow peak with variable frequency ranging from several mHz to ∼30 Hz. A second harmonic and a subharmonic are usually observed. The SIMS is characterized by showing the so-called type-B QPOs: a QPO (generally with frequencies of 4–6 Hz), accompanied by weak (few per cent fractional rms in the full RXTE/PCA band) broad-band noise (e.g. Casella et al. 2004; Motta et al. 2011; Motta 2016; Stevens & Uttley 2016; Gao et al. 2017; Stevens et al. 2018). The typical PDS of the SS does not reveal any strong variability (fractional rms of |$\lesssim 2{{\ \rm per\ cent}}$| in the full RXTE/PCA band). Less commonly but sometimes seen in the SS are the so-called type-A QPOs. These QPOs appear in a similar frequency range (6–8 Hz) as the type B, but are broader (e.g. Casella et al. 2004; Rodriguez et al. 2004; Motta et al. 2011; Sriram, Rao & Choi 2013; Motta 2016). And weak type-C QPOs are sometimes observed in the SS, where they reach their highest frequency (e.g. Sobczak et al. 2000; Homan et al. 2001; Homan & Belloni 2005).
MAXI J1348−630 is a new X-ray transient discovered by MAXI/GSC on 2019 January 26 (Yatabe et al. 2019). Swift/XRT measured the source location at |${\rm RA=13^{\rm h} 48^{\rm m} 12{_{.}^{\rm s}}7}$| and Dec. = −63°16′26|${_{.}^{\prime\prime}}$|8, with an error radius of 1.7 arcsec (90 per cent confidence; Kennea & Negoro 2019). An optical counterpart was identified by Denisenko et al. (2019) and confirmed by Kennea & Negoro (2019). A radio counterpart was reported by Russell et al. (2019b). MAXI J1348−630’s multiwavelength properties strongly suggest that the source is a black hole candidate (BHC) in a binary system (Carotenuto et al. 2019; Denisenko et al. 2019; Jana et al. 2019; Kennea & Negoro 2019; Russell et al. 2019b; Sanna et al. 2019; Yatabe et al. 2019; Belloni et al. 2020). In this work, we report results from the Neutron Star Interior Composition Explorer (NICER; Gendreau et al. 2016) observations of MAXI J1348−630, which support the BHC interpretation.
2 OBSERVATIONS AND DATA ANALYSIS
The NICER X-ray Timing Instrument (XTI) comprises an array of 56 co-aligned concentrator X-ray optics (Gendreau et al. 2016). Each optic is paired with a single-pixel silicon drift detector working in the 0.2–12 keV band. Presently, 52 detectors are working. We excluded data from detectors #14 and #34, as they occasionally show episodes of increased electronic noise. The remaining 50 detectors provide a peak effective area of |$\sim 1800~\rm {cm}^2$| at 1.5 keV.
Several hours after MAXI/GSC detected MAXI J1348−630, NICER started a near-daily monitoring campaign. We used all NICER data obtained between 2019 January 26 and 2019 October 8 (ObsIDs 1200530101–1200530128 and 2200530101–2200530231), including the following special cases: During ObsIDs 1200530101–1200530109 (MJD 58509–58524.8), before precise coordinates were available, MAXI J1348−630 was mistakenly observed with a pointing offset of 2.2 arcmin (RA = 13nh47nm55ns and Dec. = −63°15′34″); during ObsIDs 1200530106–2200530109 (MJD 58521–58560), some of the detectors were switched off to prevent telemetry saturation and accommodate the high source flux. We omitted detectors #10–17 in ObsIDs 2200530169–2200530181 (MJD 58672–58687) owing to incorrect timestamps caused by a temporary instrument anomaly.
All data were processed using heasoft version 6.26 and nicerdas version 6.0. We used the latest calibration files obtained from the standard caldb release for NICER, downloaded from NASA’s High Energy Astrophysics Science Archive Research Center (HEASARC). The gain calibration file was ‘nixtiflightpi20170601v003_optmv7he.fits’, and the spectral response consisted of the detector redistribution matrix file ‘nicer_v1.02.rmf’ and the optics auxiliary response file ‘nicer-arf-consim135o-arrayNN.arf’, where NN is the number of active detectors.1 We applied the standard filtering criteria to obtain the cleaned event files, i.e. time intervals requiring pointing stability <54 arcsec, bright Earth limb angle >30°, dark Earth limb angle >15°, and outside the South Atlantic Anomaly. Furthermore, we excluded times when overshoot count rate was larger than 1.0 counts per second per detector (counts s−1 det−1) to remove strong background flare-ups. The background was calculated with the ‘nibackgen3C50' tool provided by the NICER team. Individual NICER observations have durations from ∼1 to ∼80 ks, and are composed of one to multiple data segments of no more than 2–3 ks gap-free data. Within the time-scale of an observation, the background can show significant changes. Therefore, we divided each observation into several continuous data segments, typically separated by several ks gaps due to the orbit of the ISS. The total net exposure is ∼274 ks.
We produced a light curve with 1-s binning in the 0.5–12 keV energy band for each data segment using xselect. In order to calculate the hardness ratio, we extracted light curves in the 2–3.5 and 6–12 keV bands. We then applied background correction for each light curve, and divided the net count rate by the number of active detectors. The NICER hardness is defined as the ratio between the 6–12 and 2–3.5 keV count rate. We then calculated the average count rate and hardness ratio for each data segment. For comparison, we also obtained 1-day bin MAXI light curves from the full 2–20 keV band as well as the 2–4 and 4–10 keV bands, through the MAXI on-demand Web interface.2 The MAXI hardness is defined as the ratio between the 4–10 keV and 2–4 keV rate.
For the timing analysis, we produced an average PDS in the 0.5–12 keV energy band for each data segment. We used 16-s long intervals and 1/8192-s time resolution, so that the Nyquist frequency is 4096 Hz. The PDS were Leahy normalized (Leahy, Elsner & Weisskopf 1983) and converted into squared fractional rms (Belloni & Hasinger 1990). The contribution due to the photon counting noise was subtracted. Following Belloni, Psaltis & van der Klis (2002), we fitted a selected sample of PDS with a model consisting of a sum of Lorentzian functions (see Section 3.3 for details). We found spurious timing signatures (mainly below 0.5 Hz) in the PDS of the early observations made with a pointing-coordinate offset; these signatures are due to pointing jitter3 and the features are particularly significant in ObsIDs 1200530107–1200530109, when the source was bright. To minimize the effect of these signatures, we chose the 0.5–64 Hz range for the total fractional rms estimation. We also calculated the absolute rms by multiplying fractional rms by net count rate (Muñoz-Darias et al. 2011).
We extracted a background-subtracted energy spectrum for each data segment observed with a precise coordinate (i.e. we excluded all data between MJD 58509 and 58524.8). The spectra were corrected for the oversampling and rebinned to have at least 30 counts per bin. Instrumental residuals are seen at low-energy band (see Ludlam et al. 2018, for detail). We therefore added a systematic error of 3 and 0.5 per cent below and above 1.5 keV, respectively. The resulting spectra were analysed using xspec version 12.10.1 in the 0.6–10 keV band.
3 RESULTS
3.1 Light curve and hardness
In the upper panel of Fig. 1, we show the NICER (0.5–12 keV) and MAXI (2–20 keV) light curves of the outburst. Each data point represents the average for a single data segment. At the beginning of the outburst, the source exhibited a fast (∼15 d) rise with a peak NICER count rate (0.5–12 keV) of ∼950 counts s−1 det−1 on day 16 (MJD 58525.2). It is important to mention that the source flux was underestimated due to the pointing offset4 in observations before day 15 (MJD 58524.8). The peak count rate in the MAXI 2–20 keV band was |$\sim 9.6~\rm {photons~s^{-1}~cm^{-2}}$| (∼2.7 Crab). Following the peak, the source flux decayed exponentially until day 88 (MJD 58597), when the source flux started to decrease at a higher rate. The source was undetected on day 106 (MJD 58615) with MAXI. Starting on day 125 (MJD 58634), the source started a new outburst (or reflare). The second peak is much fainter than the first one, with a peak flux of ∼0.3 Crab (|$\sim 1.2~\rm {photons~s^{-1}~cm^{-2}}$| in the MAXI 2–20 keV band). The reflare profile is very similar to that of the main outburst, showing a fast rise and an initial slow decay followed by a faster decay. MAXI J1348−630 was undetected again around day 191 (MJD 58700). Starting around day 232 (MJD 58741), the source started another reflare with a peak flux of ∼0.03 Crab (|$\sim 0.1~\rm {photons~s^{-1}~cm^{-2}}$| in the MAXI 2–20 keV band). NICER observations did not sample the rise of this reflare, with a data gap of 6 d between non-detection and the peak.

Upper panel: light curves of MAXI J1348−630 in the NICER 0.5–12 keV (filled circles) and MAXI 2–20 keV (black open circles) energy bands. Lower panel: evolution of the NICER hardness (6–12 keV/2–3.5 keV) and MAXI hardness (4–10 keV/2–4 keV) during the outburst. In our analysis, we divided each NICER observation into several continuous data segments, typically separated by several ks gaps due to the orbit of the ISS. Here each point represents a single data segment. For clarity, in the lower panel, we removed points where the hardness was unconstrained (i.e. large errors) due to the low count rate observed. The time origin is MJD 58509, the date when MAXI discovered the source. The purple solid line represents the time (MJD 58517) when the source starts the hard-to-soft transition. The green dashed line represents the time (MJD 58522) when the source enters the SIMS. The pink dash–dotted line represents the time (MJD 58597) when the source starts the soft-to-hard transition. The cyan dotted line represents the time (MJD 58608) when the source goes back to the HS at the end of the outburst. Black points mark PDS with strong band-limited noise and sometimes a type-C QPO. Type-B and A QPOs are marked with blue and orange, respectively. Grey points mark PDS with little power. Green points mark PDS with relatively strong band-limited noise and sometimes an ∼18-Hz QPO observed in the SS. See Fig. 4 and corresponding text below for details. The black horizontal line marks NICER data segments observed at a modest pointing offset before the source position was refined.
In the lower panel of Fig. 1, we show the NICER (6–12 keV/2–3.5 keV) and MAXI (4–10 keV/2–4 keV) hardness ratios. The trends shown by NICER and MAXI are very similar. During the first ∼8 d, the hardness remained more or less constant. After day 8 (MJD 58517), the MAXI hardness started to decrease rapidly, probably indicating a (hard-to-soft) state transition. The fast decay lasted ∼5 d. After day 13 (MJD 58522), the hardness decreased slowly until day 88 (MJD 58597), when the hardness started increasing to reach a level similar to that of the beginning of the outburst. During the reflares, the hardness stayed relatively constant, at a similar level to that of the HSs exhibited in the beginning and at the end of the main outburst.
3.2 Averaged spectral and X-ray variability evolution
In the top panel of Fig. 2, we show the evolution of the source in the HID; in the bottom panel, we show how the 0.5–64 Hz averaged fractional rms amplitude evolves with hardness (HRD). Fig. 2 shows that MAXI J1348−630 traced a ‘q’ pattern in the HID, evolving in an anticlockwise direction. This is very similar to what is generally seen from BHCs (e.g. Belloni et al. 2005; Homan & Belloni 2005; Kalamkar et al. 2011; Motta et al. 2011; Zhang et al. 2015). Based on the location in the HID, the outburst started from the right vertical branch, corresponding to the canonical HS. Between days 5 and 11 (MJD 58514–58520), there were no NICER observations. On day 12 (MJD 58521), the source was already in the upper horizontal branch, where the HIMS and SIMS are usually expected. After that, the source gradually evolved to the left in the HID (i.e. to softer spectra), as the source intensity also started to decrease. At the end of the main outburst, around day 88 (MJD 58597), the source started to undergo a transition to harder colours, suggestive of a typical BH soft-to-hard transition as the source returned to the HS around day 99 (MJD 58608). Unfortunately, most of the soft-to-hard transition was not sampled with NICER observations.
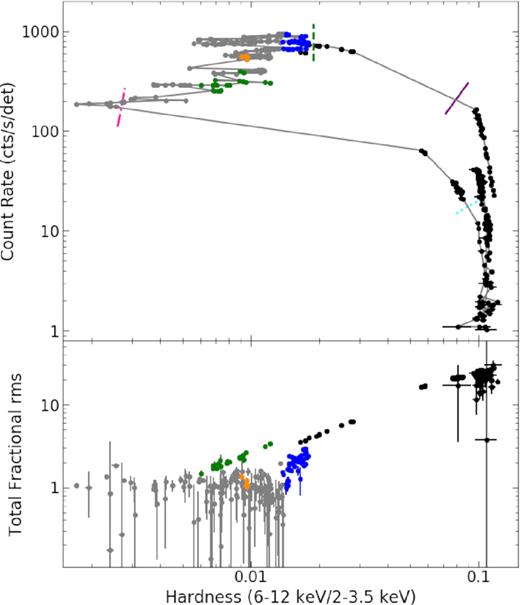
NICER HID (upper panel) and HRD (lower panel) of the outburst. The total fractional rms is calculated in the 0.5–64 Hz frequency range. Symbols are the same as those in Fig. 1.
The bottom panel of Fig. 2 shows that the 0.5–64 Hz averaged fractional rms decreases as the hardness ratio decreases. This relation is tighter at hardness >0.02. At hardness lower than ∼0.02, we observe a drop of the rms amplitude. This drop corresponds to day 13 (MJD 58522.6), and for BHC is usually related to the transition between HIMS and SIMS (see, e.g. Belloni et al. 2011, and references therein).
During the reflares, the source evolved along the right vertical branch in the HID (Fig. 2), suggesting that it stayed in the HS only. The fractional rms amplitude was between 20 and 30 per cent, similar to that at the beginning of the main outburst. This behaviour is reminiscent of the so-called ‘failed outbursts’, where the outburst of the BHC does not show any transition to the SS (e.g. Sturner & Shrader 2005; Capitanio et al. 2009; Del Santo et al. 2016).
In Fig. 3, we show how MAXI J1348−630 evolves in the absolute RID. The system here also traced an anticlockwise hysteresis pattern, similar to what has been seen in other BHCs. At the beginning of the outburst, we found a tight correlation between the absolute rms and flux. Such a linear relation has been observed in many other BHTs, and is commonly known as the ‘hard line’ (HL, Muñoz-Darias et al. 2011). After the gap between days 5 and 11 (MJD 58514–58520), the absolute rms deviated from the HL on day 12 (MJD 58521), already crossing the 10 per cent fractional rms line, and then moving horizontally to the left of the diagram. Then, MAXI J1348−630 evolved to lower intensity, following approximately the |$1{{\ \rm per\ cent}}$| fractional rms line. Around day 99 (MJD 58608), simultaneously with the transition observed in the HID, we observe that the fractional rms amplitude increased to levels seen at the beginning of the outburst. This is consistent with the source returning to the HS, and evolving along the so-called ‘adjacent hard line’ (AHL; Muñoz-Darias et al. 2011). During the reflares, the source moved upwards along the HL as the flux rose, and back along the same track during the decay.
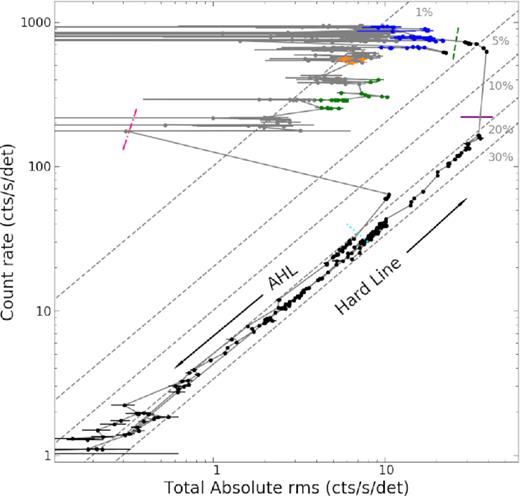
NICER absolute RID of the outburst. Symbols are the same as those in Fig. 1. The grey dotted lines represent the 1, 5, 10, 20, and 30 per cent fractional rms levels.
3.3 Broad-band noise and QPOs
The X-ray variability of MAXI J1348−630 evolved during the outburst. In Fig. 4, we show six representative PDS at different phases of the outburst. We have plotted each type of PDS with the colours used in Figs 1–3, where the panels (a), (b), (c), (d), and (e) correspond to black, blue, orange, grey, and green, respectively; panel (f) shows a PDS taken during the reflare, which is similar to that of panel (a). The main properties of the PDS are listed in Table 1.
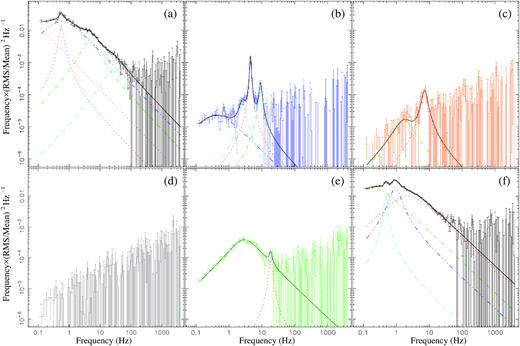
Representative power spectra at different phases of the outburst. The power spectra are calculated in the 0.5–12 keV band and fitted with a model composed of multiple Lorentzian functions. The main properties of the power spectra are listed in Table 1. The axis scales are consistent to compare the rms level of different types of PDS.
Properties of the power spectra shown in Fig. 4.
| Panel | Date | ν0 | Q | QPO rms | 0.5–64 Hz rms |
|---|---|---|---|---|---|
| (MJD) | (Hz) | (|$\nu _{0}/\rm FWHM$|) | (%) | (%) | |
| (a) | 58512.1–58512.9 | 0.56 ± 0.02 | 2.88 ± 1.24 | 8.13 ± 1.59 | 22.47 ± 0.18 |
| (b) | 58527.0–58528.2 | 4.49 ± 0.01 | 9.88 ± 1.04 | 1.58 ± 0.03 | 1.94 ± 0.05 |
| 9.07 ± 0.11 | 5.04 ± 0.96 | 0.82 ± 0.05 | – | ||
| 2.59 ± 0.16 | 2.22 ± 0.74 | 0.57 ± 0.08 | – | ||
| (c) | 58547.4 | 7.26 ± 0.24 | 2.66 ± 0.93 | 0.85 ± 0.10 | 1.05 ± 0.11 |
| (d) | 58594.5–58594.8 | – | – | – | 0.85 |
| (e) | 58571.4–58572.7 | 18.47 ± 0.80 | 5.23 ± 2.67 | 0.54 ± 0.09 | 2.93 ± 0.03 |
| (f) | 58655.1–58656.0 | 0.93 ± 0.02 | 1.35 ± 0.21 | 13.69 ± 1.18 | 24.54 ± 0.10 |
| 0.48 ± 0.01 | 4.06 ± 2.29 | 5.97 ± 0.98 | – |
Notes. The second column lists the time used to produce the PDS. Columns 3–5 list the centroid frequency, Q factor and fractional rms of the QPO ,and its harmonics shown in the PDS. The last column lists the 0.5–64 Hz fractional rms.
During the rise of the main outburst, the PDS are dominated by a strong (∼20–30 per cent rms) band-limited noise component and sometimes a low-frequency QPO (Fig. 4a). The characteristic frequency of the QPO increases from ∼0.2 Hz on MJD 58510 to ∼5 Hz on MJD 58522. At hardness ∼0.02 (MJD 58522.6), we found a drop of the fractional rms amplitude. At the same time, the strong band-limited noise is replaced by a weak broad-band noise component. A sharp, narrow (Q > 6) QPO is detected in the PDS, together with its second harmonic. The QPO appears in a narrow hardness range with a stable frequency around 4 Hz. Fig. 4(b) shows a representative example. The QPO sometimes disappears and reappears within a time-scale of 1 d. This PDS is reminiscent of the type-B QPOs observed in BHC. In most cases after MJD 58540.3, the PDS reveals little variability (|$\sim 1{{\ \rm per\ cent}}$| rms; Fig. 4d). However, we found relatively strong band-limited noise between MJD 58570–58576, sometimes with a weak but significant (∼3σ) QPO around 18 Hz (Fig. 4e). In addition, in four cases around hardness ∼0.01, we detected a broader QPO (Fig. 4c) than that in Fig. 4(b) around ∼7 Hz, but still accompanied by weak broad-band noise. Around MJD 58562, we observed PDS similar to that in Fig. 4(b) with a less significant (<3σ) peaked Lorentzian around 2 Hz. This QPO becomes significant if data from several segments are averaged together (e.g. we detect a single trial 3.5σ|$2.3\pm 0.3{{\ \rm per\ cent}}$| fractional rms amplitude QPO with Q = 2.4 ± 0.8 at 1.78 ± 0.06 Hz when averaging data from ObsIDs 2200530110-1 and 2200530113 in the 3-12 keV range). When the source transitioned back to the right-hand side of the HID (consistent with the HS), the PDS is characterized again by the band-limited noise component; sometimes we found weak QPOs with characteristic frequency decreasing from ∼3 (MJD 58603) to ∼0.1 Hz (MJD 58612).
The PDS during the reflares are similar to that observed at the end of the main outburst, i.e. the PDS are characterized by a strong band-limited noise component and sometimes a low-frequency QPO with frequencies between ∼0.1 and ∼1 Hz. Fig 4(f) shows an example PDS taken at the peak of the first reflare (MJD 58655).
Based on comparisons with previous work on other sources (e.g. Casella et al. 2004; Rodriguez et al. 2004; Belloni et al. 2005; Homan et al. 2005; Motta et al. 2011), the power spectral evolution we observed is consistent with that of BHCs. Panels (a) and (f) in Fig. 4 exhibit the so-called type-C QPO PDS, while that in panel (b) resembles a type B. Under the BHC interpretation, panels (c) and (d) in Fig. 4 show type-A QPOs and an SS PDS, respectively. BHCs sometimes also exhibit the type of PDS we show in Fig. 4(e) (e.g. Homan et al. 2001, 2005; Motta et al. 2012).
3.4 Energy spectra
The energy spectra were fitted with a two-component model consisting of a multitemperature blackbody component (diskbb: Mitsuda et al. 1984) and a thermally Comptonized continuum (nthcomp: Zdziarski, Johnson & Magdziarz 1996; Życki, Done & Smith 1999). The seed photon temperature of the Comptonized component, kTbb, was linked to the inner disc temperature of the disc component, kTin. Since the high-energy cutoff of the Comptonized component is outside the NICER energy range, we fixed the electron temperature at 1000 keV. The absorption along the line of sight was modelled using tbnew, which is an improved version of the X-ray absorption model tbabs.5 The oxygen and iron absorption abundances were fixed at the solar value. The fits are more sensitive to the hydrogen column density, NH, when the spectra are soft. We then fixed NH at 0.64 × 1022 cm−2, the value obtained from the best fits of the spectra during the SS. A weak Fe-K emission feature was marginally observed in most of the spectra. A Gaussian line was added if the addition of this component improves the fits significantly by Δχ2 ≳ 30 (corresponding to an F-test6 probability of ≲ 10−6 for an average of ∼220 d.o.f.) for three fewer d.o.f. The centroid of the Fe-K line was allowed to vary between 6.3 and 6.7 keV; the width of the Fe-K line was constrained between 0.1 and 1 keV. In all cases, the contribution of the Fe-K line flux to the total flux is less than 1.3 per cent. Extra residuals were observed below 3 keV after day 94 (MJD 58603), which is possibly due to instrumental effects. We added another Gaussian component to account for these residuals if the addition of this component improved the fits by Δχ2 ≳ 30. The centroid of the line was fixed at 1 keV; the width of the line obtained remains more or less constant at 0.9 keV. The effect of the addition component on kTin and photon index, Γ, is typically less than 0.03 keV and 0.1, respectively. After day 187 (MJD 58596), the disc component was not required by the spectral fits, and the spectra can be fitted well with a single power law with Γ ∼ 1.6. The average reduced χ2 from the best fits was 1.1. We also calculated the unabsorbed flux of different components using cflux in the 0.6–10 keV band. In this work, we will focus on the evolution of the disc and Comptonized components during the outburst. A more detailed spectral analysis will be presented in a separate paper.
In order to test the robustness of our spectral parameters, we also tried another continuum model tbnew*(simpl*diskbb), in which a fraction of the seed photons from the accretion disc is up-scattered into a power-law component (simpl: Steiner et al. 2009). The evolution of kTin and Γ are consistent between the two models we used. Our results are also consistent with those recently presented by Tominaga et al. (2020), who fitted the 2–20 keV MAXI/GSC spectra of MAXI J1348−630 with the model tbabs*(simpl*diskbb). We note, however, that these authors could not constrain the photon index during the SS (and therefore fixed it at 2.5) and could not detect the disc component during the reflares in the MAXI energy band.
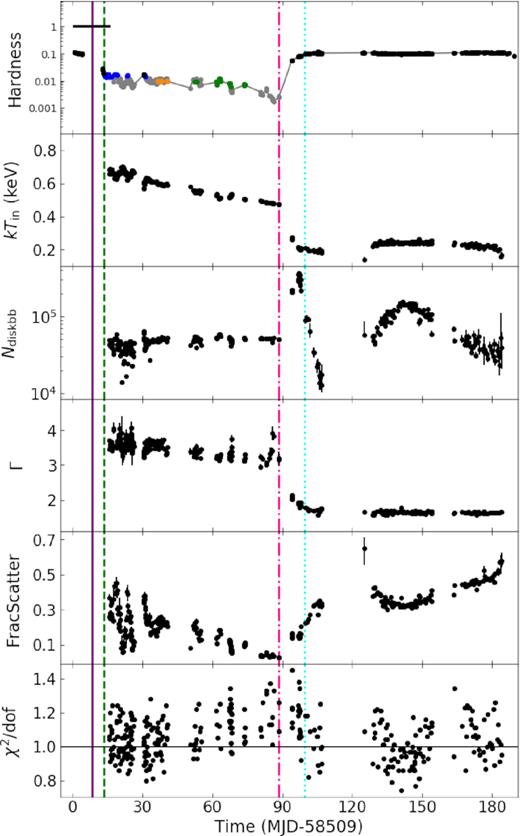
In Fig. 5, we show the evolution of the hardness ratio and the main spectral parameters from the model (hereafter model 1) tbnew*(diskbb + nthcomp). From the top to the bottom panels, we plot the hardness, inner disc temperature (kTin), diskbb normalization (Ndiskbb), photon index (Γ), total unabsorbed flux (Ftot), the contribution of the Comptonized component flux to the total flux (Fnthc/Ftot), and the reduced χ2. In Fig. 6 we plot the intensity versus Fnthc/Ftot. In Fig. 7, we show the energy spectra corresponding to the PDS in Figs 4(b)–(f). The energy spectrum during the time used to produce the PDS in panel (a) is not shown due to the imprecise pointing of the instrument. For completeness, we show the evolution of the spectral parameters from the model (hereafter model 2) tbnew*(simpl*diskbb) in Fig. A1 (Appendix). We found the following:
Between day 16 and 88 (MJD 58525–58597), the spectra gradually softened with a decrease in total flux. During this period, the photon index underwent a slight decrease from Γ ∼ 3.5 to ∼3 along with a decrease in inner disc temperature from kTin ∼ 0.7 to ∼0.5 keV. The disc component became more dominant, and the contribution of the Comptonized component flux to the total flux (Fnthc/Ftot) decreased from |$\sim 60{{\ \rm per\ cent}}$| to |$\lt 10{{\ \rm per\ cent}}$|.
After that the source started a soft-to-hard transition until day 99 (MJD 58608). During the soft-to-hard transition, the inner disc temperature decreased to ∼0.2 keV and the photon index decreased to ∼1.7, while the contribution of the Comptonized component flux to the total flux (Fnthc/Ftot) increased to |$\gt 70{{\ \rm per\ cent}}$|.
After the source returned back to the HS around day 99 (MJD 58608) and during the reflares, the spectra are dominated by the Comptonized component with |$F_{\rm nthc}/F_{\rm tot}\gtrsim 80{{\ \rm per\ cent}}$|. The photon index remains approximately constant at ∼1.6, and the inner disc temperature is around 0.2 keV.
The spectrum corresponding to the PDS shown in Fig. 4(a) is not studied due to the imprecise pointing of the instrument. Based on its position in Figs 2–3 and the timing characteristics, it should have a similar spectral shape as the spectrum corresponding to the PDS shown in Fig. 4(f). The PDS in Fig. 4(f) corresponds to typical HS spectra, which are dominated by the Comptonized component (|$F_{\rm nthc}/F_{\rm tot}\gtrsim 80{{\ \rm per\ cent}}$|) with a photon index of Γ ∼ 1.6–1.7; when PDS in Fig. 4(b) were observed, the spectra have a typical inner disc temperature and photon index of kTin ∼ 0.65 keV and Γ ∼ 3.4. The contribution of the Comptonized component flux to the total flux (Fnthc/Ftot) is |$\sim 50\!-\!60{{\ \rm per\ cent}}$|; the spectra corresponding to the PDS shown in Fig. 4(c) are similar to that shown in Fig. 4(b), but with a slightly lower inner disc temperature (kTin ∼ 0.60 keV) and a lower |$F_{\rm nthc}/F_{\rm tot}\sim 35{{\ \rm per\ cent}}$|; the PDS in Fig. 4(d) corresponds to SS spectra that are dominated by a strong disc component with Fnthc/Ftot typically |$\lt 20{{\ \rm per\ cent}}$|; and when PDS in Fig. 4(e) were detected, the spectra are characterized by an inner disc temperature of kTin ∼ 0.52 keV and a photon index of ∼3.2 with |$F_{\rm nthc}/F_{\rm tot}\sim 20\!-\!35{{\ \rm per\ cent}}$|.
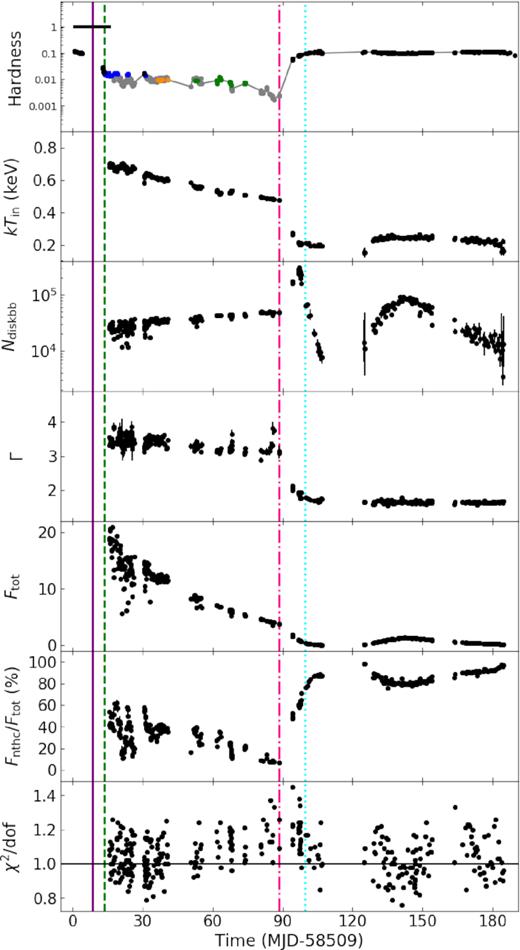
Evolution of the main spectral parameters. The continuum was fitted with the model tbnew*(diskbb + nthcomp) in the 0.6–10 keV band. In the top panel, we show the hardness ratio for comparison. From the second panel to the bottom: disc temperature at the inner radius (kTin) in keV, diskbb normalization (Ndiskbb), photon index (Γ), unabsorbed total flux (Ftot) in units of 10−8 er g cm−2 s−1, the contribution of the Comptonized component flux to the total flux (Fnthc/Ftot), and the reduced χ2. We do not plot the data after day 187 (MJD 58596), since the disc component was not required by the spectral fits and the spectra can be fitted well with a single power law with Γ ∼ 1.6.
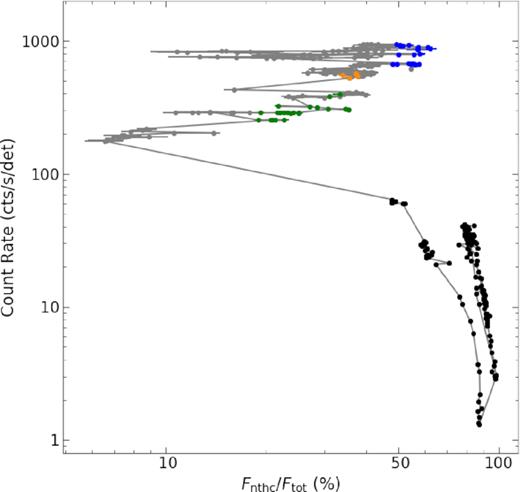
NICER 0.5–12 keV count rate as a function of Fnthc/Ftot. Symbols are the same as those in Fig. 1.
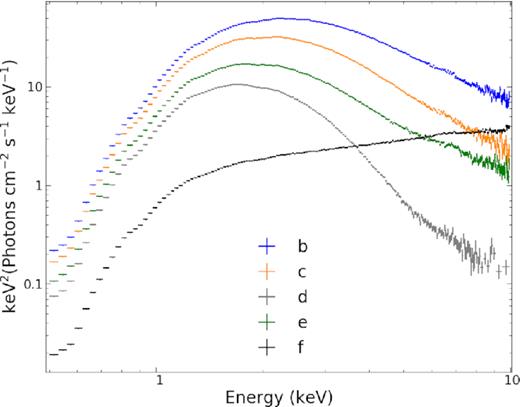
Representative energy spectra corresponding to different types of PDS shown in panels (b)–(f) in Fig. 4. The energy spectrum during the time used to produce the PDS in panel a is not shown due to the imprecise pointing of the instrument. The energy spectra corresponding to panels (b)–(f) in Fig. 4 are extracted from the same time used to produce the PDS.
The inner disc radius, Rin, can be inferred from the normalization of the diskbb component (Ndiskbb). From Figs 5 and A1, it can be seen that the evolution of Ndiskbb during the SS of the main outburst depends on the model used. When using ‘model 1' (Fig. 5), Ndiskbb slightly increases as the outburst evolves, suggesting that the disc was receding as the total flux decreases. However, when using ‘model 2' (Fig. A1), Ndiskbb remains more or less constant during the SS. This is consistent with our expectation for the standard evolution of black hole binaries in the SS (e.g. Done, Gierliński & Kubota 2007; Steiner et al. 2010; Muñoz-Darias et al. 2011), and also consistent with the results shown in Tominaga et al. (2020), where the constant Rin is thought to correspond to the innermost stable circular orbit (ISCO) of the black hole (e.g. Steiner et al. 2010). The apparent difference Ndiskbb between models 1 and 2 is expected, given their implementations. Both invoke Compton scattering and assume that the corona itself produces no intrinsic emission (i.e. bremsstrahlung and synchrotron are negligible), and so every photon in the Compton component should have originated in the disc. When using simpl, the disc normalization is such that so that every X-ray photon from disc and power-law components is forced to originate in the same underlying (‘seed’) disc. Ndiskbb accordingly tracks the seed disc radius (Steiner et al. 2009). However, in model 1, applying nthcomp (Zdziarski et al. 1996) independent of the disc component is equivalent in practice to assuming a separate emission component (one distinct from the disc) produces the coronal flux, and here the disc flux normalization only describes the part that has not been scattered. Therefore, Ndiskbb would appear to vary inversely with the optical depth of the corona.
Presently, the distance and inclination of MAXI J1348−630 are unknown. Tominaga et al. (2020) noted that MAXI J1348−630 is in the direction of the Galactic Scutum-Centaurus arm and (due to the low column density) may lie in front of it, at ∼3–4 kpc. Just as an example, if we assume the nearer distance of 3 kpc (also suggested by the large observed flux at the soft-to-hard transition) and an intermediate inclination of 60°, the average Rin7 in the SS using ‘model 2' leads to Rin = 110 ± 5 km, which is consistent with the radius of ISCO for a non-spinning black hole of 12 M⊙.
During the soft-to-hard transition and reflares, the evolution of Ndiskbb is almost independent of any of the two models we used. During the transition, we found that Ndiskbb undergoes a fast rise followed by a steep decay. Although this behaviour is contrary to simple expectations that the disc either simply recedes during the transition or remains at the ISCO with a change in coronal power, the sharply increasing then decreasing inferred radius was also observed in the soft-hard transition of black hole candidate XTE J1817−330 by (Gierliński, Done & Page 2008) and interpreted by those authors as being due to increasing coronal heating of the inner edge of a receding disc. As explained in Section 3.4, after day 94 (MJD 58603), we had to include an additional Gaussian component to account for the extra residuals below 3 keV. The addition of the Gaussian component has a significant effect on Ndiskbb, but has little effect on the evolution of kTin and Γ. Furthermore, we found during this period the Gaussian, Ndiskbb, and NH become highly degenerate, but not enough to explain the unusual evolution of the disc normalization.
During the first reflare, we found that Ndiskbb first increased and then decreased, following the changes in flux. These results are inconsistent with the picture that the disc is moving inwards as the flux increases. One possibility is that our results reflect physical changes (e.g. due to changing coronal irradiation of the disc) that we were not able to detect before given the lack of low-energy coverage now provided by NICER. Another possibility is that the changes we see in Ndiskbb are due to a combination of choice of model (the models we used here are relatively simple) and the lack of data above 10 keV (which do not allow us to constrain well all the model parameters, e.g. to properly account for reflection). This, together with evolution of Ndiskbb during the soft-to-hard transition, should be further explored using data covering a broader range of energies, i.e. using potential NICER + Astrosat or NICER + HXMT simultaneous observations.
4 DISCUSSION AND SUMMARY
In this work, we present the first detailed analysis of the spectral evolution and timing properties of the newly discovered X-ray transient MAXI J1348−630 using NICER observations. MAXI J1348−630 traces tracks in the HID, HRD, and RID, which are typical of what is seen in BHTs (see, e.g. Homan & Belloni 2005, and references therein). This interpretation is supported by the PDS evolution, and the fact that we detected type-A, type-B, and type-C QPOs (see Casella et al. 2004; Motta et al. 2011; Motta 2016). MAXI J1348−630 also underwent reflares at the end of the outburst. These reflares evolve similarly to the so-called ‘failed outbursts’, i.e. outbursts that are generally less luminous at their peak, and do not show any evidence of state transitions. Our results show that MAXI J1348−630 underwent an initial full outburst which showed all canonical states. Below in Section 4.1 we summarize the different states, their characteristics, and their relation to recent results on investigations about MAXI J1348−630 at other wavelengths. In Section 4.2, we compare our results with that observed in other BHTs.
4.1 Spectral states
HS – From MJD 58509 to MJD 58517, the source was in the HS, corresponding to the right vertical branch of the HID (Fig. 2). On MJD 58509, the Swift/XRT spectrum can be fitted by a power law with Γ = 1.32 ± 0.02 (Kennea & Negoro 2019). During the HS, MAXI J1348−630 evolved along the hard line in the RID (Fig. 3). The corresponding PDS are dominated by band-limited noise and a QPO with variable frequency ranging from ∼0.2 (MJD 58510) to ∼0.7 Hz (MJD 58513). We identify the power spectral shape and the type of QPOs as the so-called type-C QPOs. The radio and optical flux also rise during this period (Russell, Baglio & Lewis 2019a,b). Our identification of the HS is supported by radio observations taken on MJD 58509.9 and MJD 58511.0. These observations show a flat or slightly inverted radio spectrum, suggesting that the radio emission comes from a compact jet (Russell et al. 2019b).
HIMS – Starting from MJD 58517 (purple solid line in Figs 1–3), the MAXI hardness drops rapidly with a clear spectral softening (Nakahira et al. 2019). During MJD 58517−58519, the power-law index obtained from Swift/XRT spectra increases from 1.68 to 2.25 (Bassi et al. 2019), which is evidence for a hard-to-soft transition. Unfortunately, most of the transition was not sampled with NICER observations. The first NICER observation in the HIMS was taken on MJD 58521.8, where the source had already left the hard line in the RID. During the transition, the fractional rms drops from |$\sim 20$| to |$\sim 5{{\ \rm per\ cent}}$|, while the characteristic frequency of the type-C QPO increases to ∼5 Hz. The source only stays in the HIMS for ∼5 d.
SIMS – On MJD 58522.6 (green dashed line in Figs 1–3), a sudden decrease in fractional rms amplitude was observed. At the same time, a narrow QPO with a stable frequency around 4 Hz and its second harmonic appear in the PDS, accompanied by a weak broad-band noise component. These QPOs appear only in a narrow hardness range and a fractional rms of 1–5 per cent. Fast appearance and disappearance of the QPOs within a time-scale of 1 d is observed. These transitions will be reported in more detail in a separate work. Based on these results, we identify these QPOs as type-B QPOs. The presence of type-B QPOs provides evidence that the source enters the SIMS (a detailed analysis of the phase lags of the type-B QPOs has been recently reported by Belloni et al. 2020). The energy spectra during the SIMS have a significant contribution from both the disc and the Comptonized component (|$F_{\rm nthc}/F_{\rm tot}\sim 50\!-\!60{{\ \rm per\ cent}}$|). The HIMS to SIMS transition is believed to be associated with the ejection of transient jets (Fender, Belloni & Gallo 2004). Indeed, a bright radio flare was observed on MJD 58523 with MeerKAT (Carotenuto et al. 2019).
SS – After the SIMS is reached, the fractional rms sometimes decreases to below 1 per cent. Based on the rms value, the source seems to enter the SS. We find QPOs with a characteristic frequency of ∼7 Hz in four data segments during this period. These QPOs are very broad (Q < 3) and weak (|$\lt 1{{\ \rm per\ cent}}$| rms). Neither second harmonic nor subharmonic are observed. We identify these as type-A QPOs (e.g. Casella et al. 2004; Belloni et al. 2011; Motta 2016). Also, in some data segments during this period, we found the type of PDS shown in Fig. 4(e) with a relatively strong band-limited noise and sometimes a QPO at ∼18 Hz. During the SS, the spectra gradually softened as the source decay.
Soft-to-hard transition and the end of the outburst – Starting from MJD 58597 (pink dash–dotted line in Figs 1–3), the source experienced a final soft-to-hard transition with an increase in MAXI hardness. On MJD 58608 (cyan dotted line in Figs 1–3), the source went back to the HS and evolved along the AHL in the RID. The PDS are similar to that observed in the early HS. However, the spectral hardness is slightly softer in the final HS.
After the main outburst, MAXI J1348−630 re-brightened again and experienced at least two reflares. The light-curve profile of the first reflare is similar to that of the main outburst. However, the spectral evolution is quite different. During the reflares, the source stayed in the right vertical branch in the HID. The PDS are typical of the HS, which are dominated by strong band-limited noise. The energy spectra are dominated by the Comptonized component with a photon index of Γ ∼ 1.6. These results show that the source remained in the HS, never making a transition to the SS.
4.2 Comparison with previous results
The spectral evolution of MAXI J1348−630 during its main outburst is similar to what was previously observed in other BHTs (see, e.g. Belloni et al. 2005; Homan & Belloni 2005; Kalamkar et al. 2011; Zhang et al. 2015). The source went from the HS, through the HIMS and SIMS, into the SS in the outburst rise, and back to the HS in the outburst decay. The hard-to-soft transition was very fast. The source only stayed in the HIMS for ∼5 d, and then moved into the SIMS characterized by the appearance of the type-B QPOs. This is similar to the 2006 and 2010 outbursts of GX 339−4, where the source stayed in the HIMS for ∼7 d (Motta, Belloni & Homan 2009; Motta et al. 2011). However, in some outbursts of some sources, the HIMS lasts much longer (>10 d; e.g. Muñoz-Darias et al. 2011). We note that in some cases, the systems can go back to the HIMS from the SIMS (Belloni et al. 2011). During the SS, the disc temperature is in the range of 0.5–0.7 keV, which is slightly lower than that observed in other BHTs (Dunn et al. 2011). For a standard accretion disc, the disc temperature is inversely related to the black hole mass (T ∝ M−1/4; Shakura & Sunyaev 1973). The lower disc temperature of MAXI J1348−630 suggests that it may harbour a relatively higher mass black hole. The photon index obtained from the fits during the SS (Γ ∼ 3–3.5) is higher than the Γ ∼ 2.2–3, which has been seen in previous works (e.g. Remillard & McClintock 2006; Motta et al. 2009). The higher values of Γ are likely due to NICER’s narrow energy band, as the photon index is not well constrained when the energy spectra are dominated by the disc (soft) component.
Post-outburst reflares (also known as re-brightenings) have been observed in several BHTs, e.g. XTE J1650−500 (Tomsick, Kalemci & Kaaret 2004), MAXI J1659−152 (Homan et al. 2013), GRS 1739−278 (Yan & Yu 2017), MAXI J1535−571 (Parikh et al. 2019; Cúneo et al. 2020), and MAXI J1820+070 (Stiele & Kong 2020). The peak fluxes of the reflares are at least approximately one to two orders of magnitude fainter than that of the main outburst. For the cases of XTE J1650−500, MAXI J1659−152, and MAXI J1820+070, the source remained in the HS during the reflares, similar to what we found here in MAXI J1348−630. This type of spectral evolution is reminiscent of the so-called ‘failed outbursts’ observed in many BHTs (e.g. Sturner & Shrader 2005; Capitanio et al. 2009; Fürst et al. 2015; Del Santo et al. 2016; Stiele & Kong 2016). However, for the case of GRS 1739−278, the source reached the SS during the two reflares after its main outburst, and their tracks in the HID show hysteresis (Yan & Yu 2017). Before returning to quiescence, MAXI J1535−571 exhibited at least four reflares, and their peak fluxes decayed with time. During the first two brighter reflares, the source transited from the HS into the SS; however, during the third and fourth reflares, MAXI J1535−571 did not reach the SS (Parikh et al. 2019; Cúneo et al. 2020). This result shows that the hard-to-soft transition can take place at a wide range of luminosities. In GX 339−4, the hard-to-soft transition luminosities are also different between outbursts, but all transitions occur at luminosity higher than the peak luminosity reached during failed outbursts (Belloni et al. 2011). This suggests that for each source there might be a critical luminosity (linked with a critical accretion rate) for the hard-to-soft transition to occur.
We observed different types of low-frequency QPOs at different phases of the outburst. Type-C QPOs were seen in the HS and HIMS. Type-B and type-A QPOs were detected in the SIMS and SS, respectively. The frequency ranges and Q factors of the QPOs are consistent with that observed in other BHTs with RXTE (see, e.g. Motta 2016). However, the fractional rms of the QPOs in the NICER 0.5–12 keV band are lower than the typical values obtained from the RXTE/PCA 2–13 keV band for PDS with similar shapes. For example, the type-B QPOs we found have a fractional rms of |$\lt 1.5{{\ \rm per\ cent}}$| in the NICER 0.5–12 keV band, while the typical value for the RXTE/PCA 2–13 keV band is |$\sim 4\!-\!5{{\ \rm per\ cent}}$| (e.g. Casella et al. 2004). The 0.5–64 Hz integrated fractional rms we measured in the HS (20–30 per cent) is also significantly lower than that typically seen in the RXTE/PCA band (30–40 per cent; Muñoz-Darias et al. 2011). Although there is no consensus on the physical origin of the QPOs and broad-band noise, it is suggested that their amplitude is set by the physical component that modulates the photons at ≳ 2–3 keV (e.g. Ingram, Done & Fragile 2009; Ingram & Done 2012; Stevens & Uttley 2016). The lower variability we observed with NICER could be intrinsic to MAXI J1348−630, but most probably is due to dilution of the amplitude caused by the non-modulated photons we observe at <2 keV, thanks to the effective area of NICER. An 18-Hz QPO was observed at hardness ∼ 0.01 accompanied by a relatively strong peaked noise component (Fig. 4e). This type of PDS is similar to that found in XTE J1550−564 (Homan et al. 2001), H 1743−322 (Homan et al. 2005), and GRO J1655−40 (Remillard et al. 1999; Motta et al. 2012). Remillard et al. (1999) found that these QPOs are stronger at higher energy bands. In the frequency–rms diagram, these QPOs follow the same track as those type-C QPOs seen in the HS and HIMS (Motta et al. 2012).
ACKNOWLEDGEMENTS
We are grateful for the anonymous referee’s helpful comments and suggestions. LZ acknowledges support from the Royal Society Newton Funds. DA acknowledges support from the Royal Society. VAC acknowledges support from the Royal Society International Exchanges ‘The first step for High-Energy Astrophysics relations between Argentina and UK’ and from the Spanish Ministerio de Ciencia e Innovación under grant AYA2017-83216-P. KA acknowledges support from a UGC-UKIERI Phase 3 Thematic Partnership (UGC-UKIERI-2017-18-006; PI: P. Gandhi). FMV acknowledges support from STFC under grant ST/R000638/1. This work was supported by NASA through the NICER mission and the Astrophysics Explorers Program. This research has made use of MAXI data provided by RIKEN, JAXA, and the MAXI team, and data and software provided by the High Energy Astrophysics Science Archive Research Center (HEASARC) and NASA’s Astrophysics Data System Bibliographic Services.
DATA AVAILABILITY
The data underlying this paper are available in the HEASARC data base.
Footnotes
In some observations, some of the detectors were switched off. The corresponding auxiliary response files are the combination from all the active detectors.
It is very complicated to estimate how much the flux was affected by the pointing offset and therefore we ignored the effect as it does not affect the conclusions of this paper.
It is important to mention that F-test could underestimate or overestimate the significance of a narrow-line feature in some cases (Protassov et al. 2002); however, we do not investigate this further as variations in the true significance of the Fe-K line does not affect the evolution of the main spectral parameters shown in Fig. 5.
The value is corrected for the spectral hardening with a factor of κ = 1.7 and the inner boundary condition with a factor of ξ = 0.41 (Kubota et al. 1998).
REFERENCES
APPENDIX A: ADDITIONAL FIGURE
Evolution of the main spectral parameters from the spectral fits with the continuum model tbnew*(simpl*diskbb). In the top panel we show the hardness ratio for comparison. From the second panel to the bottom: disc temperature at the inner radius (kTin) in keV, diskbb normalization (Ndiskbb), photon index (Γ), scattered fraction (FracScatter), and the reduced χ2. Same as Fig. 5, we did not plot the data after day 187 (MJD 58596), since that the disc component was not needed in the spectral fits and the spectra can be fitted well with a single power-law with Γ ∼ 1.6.
