-
PDF
- Split View
-
Views
-
Cite
Cite
Piero Trevisan, Mario Pasquato, Alessandro Ballone, Michela Mapelli, Measuring the spectral index of turbulent gas with deep learning from projected density maps, Monthly Notices of the Royal Astronomical Society, Volume 498, Issue 4, November 2020, Pages 5798–5803, https://doi.org/10.1093/mnras/staa2663
Close - Share Icon Share
ABSTRACT
Turbulence plays a key role in star formation in molecular clouds, affecting star cluster primordial properties. As modelling present-day objects hinges on our understanding of their initial conditions, better constraints on turbulence can result in windfalls in Galactic archaeology, star cluster dynamics, and star formation. Observationally, constraining the spectral index of turbulent gas usually involves computing spectra from velocity maps. Here, we suggest that information on the spectral index might be directly inferred from column density maps (possibly obtained by dust emission/absorption) through deep learning. We generate mock density maps from a large set of adaptive mesh refinement turbulent gas simulations using the hydro-simulation code ramses. We train a convolutional neural network (CNN) on the resulting images to predict the turbulence index, optimize hyperparameters in validation and test on a holdout set. Our adopted CNN model achieves a mean squared error of 0.024 in its predictions on our holdout set, over underlying spectral indexes ranging from 3 to 4.5. We also perform robustness tests by applying our model to altered holdout set images, and to images obtained by running simulations at different resolutions. This preliminary result on simulated density maps encourages further developments on real data, where observational biases and other issues need to be taken into account.
1 INTRODUCTION
Machine learning is finding ever new applications in astronomy, ranging from exoplanets (e.g. Davies et al. 2015) and variable stars (e.g. Armstrong et al. 2015) to cosmic ray propagation (e.g. Jóhannesson et al. 2016), the chaotic three-body problem (Breen et al. 2019), star clusters (Pasquato & Chung 2016; Pang et al. 2020), and black holes (Askar et al. 2019). The subfield of deep learning (DL) has recently found successful application to astronomical problems involving images using convolutional neural networks (CNN; Fukushima & Miyake 1982; LeCun et al. 1989, 1998), for example in detecting gravitational lenses (Hezaveh, Perreault Levasseur & Marshall 2017). Turbulence has a strong impact on the properties of all phases of the interstellar medium (e.g. see the reviews by Elmegreen & Scalo 2004; Scalo & Elmegreen 2004; Hennebelle & Falgarone 2012), likely playing a fundamental role in regulating star formation in molecular clouds (Mac Low & Klessen 2004; Krumholz & McKee 2005; Ballesteros-Paredes et al. 2007; Federrath & Klessen 2012; Hopkins 2013; Semenov, Kravtsov & Gnedin 2016; Burkhart 2018), and also affecting cosmic ray propagation (see Grenier, Black & Strong 2015, and references therein), accretion disc physics (Shakura & Sunyaev 1973), and the intergalactic medium (see e.g. Evoli & Ferrara 2011; Iapichino et al. 2011). Koch et al. (2019) review several techniques used to constrain turbulence properties in observations. The most widespread ones are based on the analysis of power spectra and correlation of the density and/or velocity (e.g. Scalo 1984; Stanimirovic et al. 1999; Lazarian & Pogosyan 2000a; Esquivel & Lazarian 2005; Padoan et al. 2006; Burkhart et al. 2009; Chepurnov et al. 2010), wavelet decomposition of the density/velocity field (e.g. Gill & Henriksen 1990; Stutzki et al. 1998; Ossenkopf, Klessen & Heitsch 2001; Ossenkopf, Krips & Stutzki 2008), probability distribution functions of the density (e.g. Vazquez-Semadeni 1994; Miesch & Scalo 1995; Vázquez-Semadeni, Ballesteros-Paredes & Rodríguez 1997; Ostriker, Stone & Gammie 2001; Federrath, Klessen & Schmidt 2008; Kainulainen et al. 2011; Schneider et al. 2015), or principal component analysis of the density+velocity (e.g. Brunt & Heyer 2002a, b; Roman-Duval et al. 2011). Recently Peek & Burkhart (2019) have shown that a CNN can distinguish between different levels of magnetization in density maps of turbulent magnetized gas. This suggests that mock images representing just density information are already enough to constrain the physics of turbulent gas. In the following, we show that this includes the spectral index of turbulence.
2 METHODS
2.1 Set of hydrosimulations
2.2 Mock image generation
For each simulation, we took snapshots of the column density projected on to three perpendicular axes of the computational domain, allowing us to increase the number of images obtained from each simulation. However, we took care that each set of three resulting images with the same index ended up together either into the training set or into the holdout set, so that our models are tested not just on previously unseen images, but on unseen simulations. Images were generated from a given snapshot by integrating through the entire density cube along three orthogonal directions resulting in column density maps (as could be obtained e.g. by dust emission/absorption). This is a first step towards the use of machine-learning models for future, more sophisticated analyses, taking into further account the velocity information (coming, in real observations, from molecular tracers). Integrated column density maps represent a harder problem for our CNNs because integration strongly reduces the imprint of the velocity field by removing velocity information (see e.g. Lazarian & Pogosyan 2000b, 2004, 2006, 2008; Lazarian et al. 2018). To illustrate the results of our image generation procedure, Figs 1 and 2 show two images with low and high n, respectively.
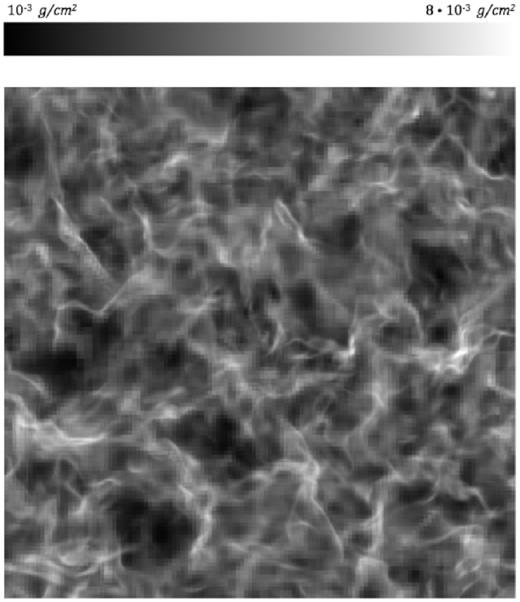
Projected density map along the z-axis for the simulation with the lowest n = 3.0013. Pixel intensity values are normalized to 1. The density to pixel intensity transformation is logarithmic. The generated image is 1000 × 1000 pixels in size, in one channel (grey-scale).
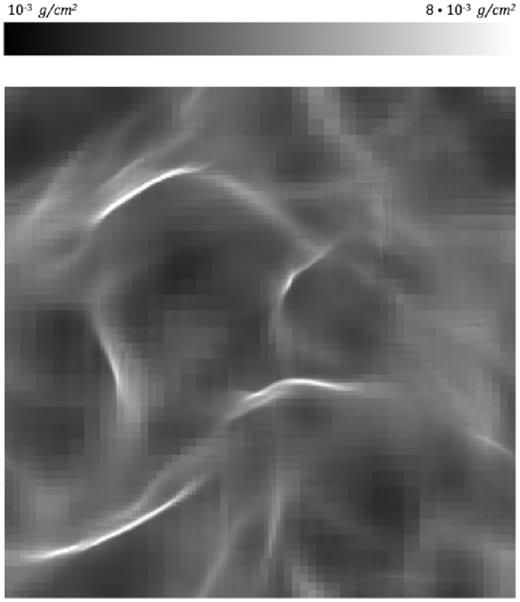
Projected density map along the z-axis for the simulation with the highest n = 4.4997. The colour map and resolution is the same as in Fig. 1.
2.3 Deep learning: neural network architecture
Since the deep CNN AlexNet (Krizhevsky, Sutskever & Hinton 2012) won the 2012 ImageNet competition (Russakovsky et al. 2015), CNNs have been successfully applied to a large variety of computer vision tasks, such as e.g. object detection (Girshick et al. 2014), where they routinely outperform other machine-learning approaches (see e.g. Goodfellow, Bengio & Courville 2016, for more details).
We implemented our neural networks in Keras (Chollet 2015), on top of TensorFlow (Abadi et al. 2015). All our code is written in python and can be found at https://gitlab.com/Piero3/turbolencenn.
The neural network architecture we chose is as follows:
Two 5 × 5 convolutional layers with 32 filters and same padding resulting in a 128 × 128 × 32 output.
A max pooling layer with 2 × 2 filter size and stride 2, resulting in an 64 × 64 × 32 output.
A dropout layer with a variable ratio of dropped units (either 0 or 1/3).
Two 5 × 5 convolutional layers with 64 filters and same padding resulting in a 64 × 64 × 64 output.
A max pooling layer with 2 × 2 filter size and stride 2, resulting in an 32 × 32 × 64 output.
A dropout layer with a variable ratio of dropped units (either 0 or 1/3).
A fully connected (dense) layer with 64 neurons with rectified linear unit activation.
A dropout layer with a variable ratio of dropped units (either 0 or 1/3).
A single neuron with a linear activation with relative squared error loss as cost function.
This architecture was chosen after some trial-and-error experimentation starting from a very shallow initial configuration and progressively adding more layers. Afterwards, we performed a grid search over the few hyperparameters that we decided to explicitly optimize, as discussed below.
2.4 Deep learning: hyperparameter optimization
We train our neural networks on 896 simulations corresponding each to a different spectral turbulence index. Each simulation is projected on three independent directions, obtaining three column density map images. The remaining 104 simulations are set aside to perform a blind test of the accuracy of the trained networks; these simulations were also never used during the initial tests we conducted to determine the overall network architecture. We optimized the hyperparameters of our nets using an |$80{{\ \rm per\ cent}}\!-\!20{{\ \rm per\ cent}}$| train-validation random split. We trained our network for different choices of the dropout ratio: either 1/3 for all dropout layers or zero (corresponding to no dropout), and we compared four optimizers: AdaDelta (Zeiler 2012), AdaGrad (Duchi, Hazan & Singer 2011), RMSprop (Tieleman & Hinton 2012), and Adam (Kingma & Ba 2014a). We train our CNNs for either 500 epochs (if the dropout is set to 1/3) or for 100 epochs (if trained with no dropout). This is done to reduce overfitting for models without dropout in a sort of early stopping scheme (e.g. see Prechelt 1998). We also consider different batch sizes: (32, 64, 128, and 256). We show the resulting training and validation mean squared error (MSE) loss in Table 1, where each training run is sorted by increasing validation MSE. In this phase, we used an |$80\!-\!20\,{{\ \rm per\ cent}}$| train-validation split.
Summary of our hyperparameter optimization: each row corresponds to a different combination of hyperparameters. The MSE loss after either 500 training epochs (models trained with dropout) or 100 epochs (models without dropout) is reported for the training set and for the validation set (last two columns) as a function of the dropout fraction (first column), the optimizer (second column), and the batch size used in training (third column).
| Dropout . | Optimizer . | Batch size . | Epochs . | Train loss . | Val. loss . |
|---|---|---|---|---|---|
| 0.33 | adadelta | 64 | 500 | 0.005 | 0.012 |
| 0.33 | adadelta | 32 | 500 | 0.006 | 0.014 |
| 0.33 | adam | 64 | 500 | 0.018 | 0.014 |
| 0.33 | adam | 256 | 500 | 0.014 | 0.014 |
| 0.00 | adam | 32 | 100 | 0.001 | 0.014 |
| 0.33 | rmsprop | 256 | 500 | 0.015 | 0.016 |
| 0.33 | rmsprop | 32 | 500 | 0.021 | 0.016 |
| 0.00 | adam | 128 | 100 | 0.002 | 0.016 |
| 0.00 | adam | 64 | 100 | 0.001 | 0.016 |
| 0.33 | rmsprop | 128 | 500 | 0.020 | 0.017 |
| 0.00 | rmsprop | 32 | 100 | 0.005 | 0.018 |
| 0.00 | adadelta | 32 | 100 | 0.005 | 0.021 |
| 0.00 | rmsprop | 64 | 100 | 0.013 | 0.021 |
| 0.00 | adadelta | 64 | 100 | 0.010 | 0.022 |
| 0.00 | adagrad | 64 | 100 | 0.008 | 0.023 |
| 0.33 | adam | 128 | 500 | 0.014 | 0.024 |
| 0.33 | adam | 32 | 500 | 0.022 | 0.024 |
| 0.00 | adagrad | 32 | 100 | 0.002 | 0.027 |
| 0.00 | adagrad | 256 | 100 | 0.027 | 0.034 |
| 0.00 | adagrad | 128 | 100 | 0.022 | 0.039 |
| 0.00 | adadelta | 128 | 100 | 0.035 | 0.047 |
| 0.00 | rmsprop | 128 | 100 | 0.018 | 0.052 |
| 0.00 | rmsprop | 256 | 100 | 0.025 | 0.063 |
| 0.00 | adadelta | 256 | 100 | 0.095 | 0.085 |
| 0.33 | adadelta | 128 | 500 | 0.190 | 0.190 |
| 0.33 | adadelta | 256 | 500 | 0.190 | 0.190 |
| 0.33 | rmsprop | 64 | 500 | 0.190 | 0.190 |
| 0.33 | adagrad | 128 | 500 | 0.242 | 0.470 |
| 0.33 | adagrad | 32 | 500 | 0.535 | 0.534 |
| 0.33 | adagrad | 64 | 500 | 0.284 | 0.763 |
| 0.33 | adagrad | 256 | 500 | 0.295 | 0.980 |
| 0.00 | adam | 256 | 100 | 3.622 | 3.511 |
Our best-performing model (in terms of validation loss) is the result of training with the Adadelta optimizer (Kingma & Ba 2014b) for 500 epochs with a batch size of 64 and 1/3 dropout. The validation MSE loss at the end of training is 1.2 × 10⁻². However, this model is clearly overfitting, as the validation loss is much higher than the training loss. The best model that is not overfitting (as shown by it having a higher training loss than validation loss) is the third best in terms of validation loss, achieving a final MSE of 1.4 × 10⁻², and is the result of training with the Adam optimizer for 500 epochs with a batch size of 64 and 1/3 dropout. We adopt this latter model and use it in the following. The evolution of the training and validation loss for this model is shown in Fig. 3.
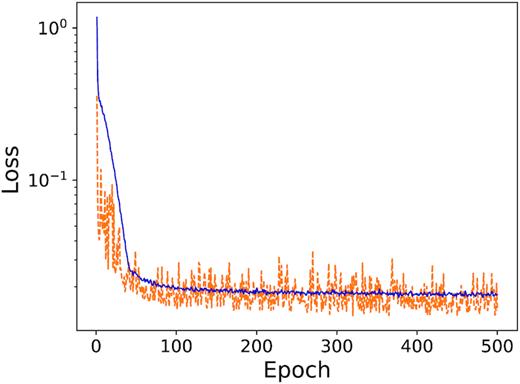
Evolution of the training loss (solid blue curve) and validation loss (dashed orange curve) during training for the adopted CNN.
At this point, our CNN never saw our holdout set of 312 column density snapshots (corresponding to 104 different indexes). This also holds true for our previous, informal optimization that yielded the CNN architecture we adopted in the first place.
2.5 Deep learning: data augmentation
Since running hydrodynamic simulations can be very time consuming and computationally expensive, we augmented the training data-set by applying transformations such as cropping, reflections, and rotations. To perform the data augmentation we used the python library Augmentor.2 With this process we artificially enlarged our data-set from 2688 to 20000 images. The number of combinations of cropping plus reflections and rotations guarantees that we do not have two identical examples in our training data-set or across the training/validation split. The holdout set, which was used neither in training nor in validation, did not undergo augmentation.
3 RESULTS
We re-trained our adopted CNN (trained with 1/3 dropout fraction, the Adam optimizer, batch size of 64; see third row of Table 1) for 500 epochs on the whole new training data-set, described in Section 2.5. After training, we tested our CNN on our holdout set of 312 images resulting from simulations made with the same ingredients of the training simulations. The 312 images correspond to 104 simulations with different turbulence index, seen from three different perpendicular directions. On this set, we did not perform any augmentation process (crop, flip, rotation) as opposed to what we did in training. The predictions of our adopted CNN are shown in Fig. 4. We obtained an MSE between our predictions and the actual spectral turbulence indexes of 0.024.
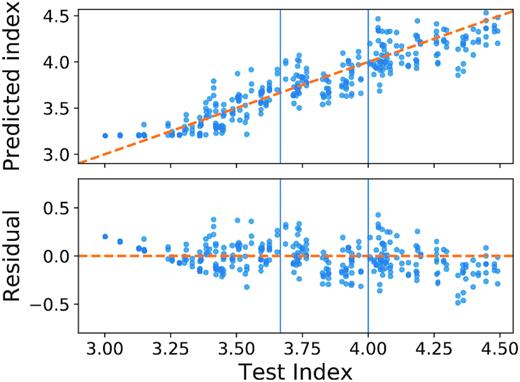
Prediction of the adopted CNN model on the 312 test images in the holdout set. The CNN was not shown these images in training nor in validation, neither was it shown images derived from the same simulations as these. Top panel: power spectrum indexes predicted from the CNN plotted versus the actual indexes labelled as test indexes. Bottom panel: the residuals are plotted versus the test indexes. The vertical line at n = 11/3 and n = 4.0 corresponds to Kolmogorov and Burgers index, respectively.
3.1 Robustness tests: low-pass filter
While our model performs well in the idealized setting we considered, it is expected that regression accuracy will drop in realistic conditions, e.g. when attempting to predict the spectral index of turbulent gas from actual observations. As a first test of robustness under less than ideal conditions we degrade the density maps in our holdout set and measure the resulting drop in performance of our model. We apply Fourier transform to our images and remove high-spatial frequencies (low-pass filter) at different cut-offs. A low-pass filter blurs out the fine spatial structure of the density map, which has a similar effect to reducing the resolution of the image or convolving with an instrumental point spread function, as shown in Fig. 5. Mesh artefacts (e.g. sharp discontinuities in density at cell boundaries) are largely removed by low-pass filtering, as the typical cell size is on the small end of the spatial frequency range for our images.
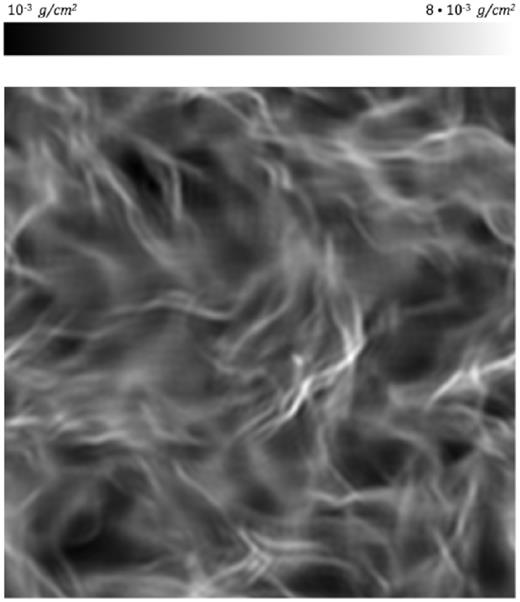
Typical input for our low-pass filter experiment. Spatial frequencies above a threshold are cut-off in Fourier space. Different cut-offs were experimented with.
Fig. 6 shows the MSE of our adopted model on the test set low passed at various cut-off spatial frequencies. The rightmost point corresponds to the unaltered images. As we move left and the cut-off is lowered, MSE increases (performance drops) but not abruptly so. In particular, the relevant mesh frequencies do not stand out as discontinuity points in this graph. This suggests that the model is not picking up on high-frequency mesh artefacts to make its predictions.
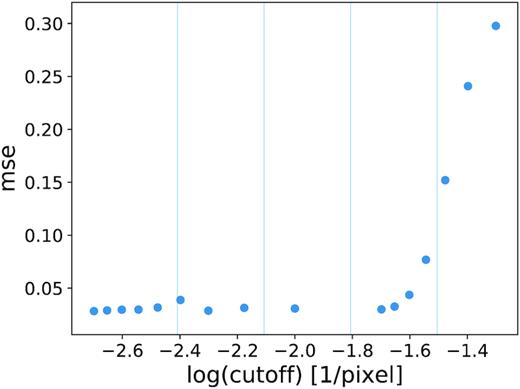
MSE as a function of the spatial frequency cut-off (in 1/pixels) of the low-pass filter, i.e. frequencies below the cut-off are kept, so the leftmost point corresponds to retaining the original image.
3.2 Robustness tests: resolution convergence
Perhaps a more stringent requirement than performing well on images with a different resolution would be to make correct predictions on simulations run at a different resolution. Due to the computational costs of hydrodynamic simulations, we selected only four simulations corresponding to indexes near to the range extremes 3.0 and 4.5 and to the Kolmogorov (11/3) and Burgers regime (4.0). We re-ran these simulations with different AMR resolution limits, namely 2−7 the box side (thus lowering the maximum attainable resolution with respect to the original) and 2−9 the box side (increasing the maximum resolution). We also run a simulation with a fixed, uniform mesh with cells 2−8 the box side. The predictions of our best CNN model, which is trained only on simulations run with AMR and maximum resolution corresponding to 2−8 the box side, are shown in Fig. 7 as a function of the actual spectral indexes. As usual, we calculated our predictions on three independent projections of each simulation, so each index corresponds to three points in the plot. We see that prediction accuracy is as high as on the original simulations for the new, higher, and lower resolution AMR simulations, while it drops somewhat for the uniform mesh. This simple qualitative test suggests that the model predictions are robust with respect to changes in resolution, even though making a quantitative statement in this regard would require rerunning a larger sample of simulations.

Predicted spectral indexes as a function of the actual indexes for three projections of the four simulations we reran with different resolution. The original simulations are shown as blue dots, AMR simulations with lower (higher) resolution limit in yellow (green), and uniform grid simulations in red. The diagonal line is the identity.
4 DISCUSSION AND CONCLUSIONS
We have trained a CNN to predict the spectral index of turbulence of mock column density maps generated by simulations of turbulent gas. Our neural network model accomplishes this task by using only pixel-level information from images.
With a fixed five-layer feedforward network architecture, we obtain a performance of 0.024 in terms of MSE on an holdout test set unseen in training, spanning spectral indexes from n = 3 to n = 4.5. This is an encouraging result as it suggests that plain density maps contain sufficient information for an accurate prediction of the spectral index of turbulence. Moreover, our images are generated by fully projecting the density distribution of the gas along the line of sight, essentially disregarding velocity information. With this in mind, even though the MSE we obtain is still at face value too high for observational applications (Kolmogorov and Burgers indexes differ only at the 2σ level), we expect to reduce it by averaging predictions obtained on independent regions of a given cloud.
To ascertain that our model is indeed using relevant physical information to obtain its predictions we ran a series of tests by degrading our test images by censoring high-spatial frequencies and measuring the resulting drop in performance. We find that blurring out the fine spatial structure of our images (including any mesh artefacts such as abrupt changes in density at projected cell boundaries) in this way progressively lowers our model’s performance, but we do not observe sharp jumps at mesh frequencies, suggesting that the model is not using simulation artefacts to drive its predictions. Additionally, we re-run a handful of simulations with different mesh resolutions, obtaining accurate predictions on the derived images, further supporting the robustness of our results. Possible future developments of this work along these lines are related to using machine learning interpretability techniques on our trained model to reveal explanations as to why a given prediction is cast: intelligible explanation is as important as accuracy in scientific applications.
While these checks suggest that the model is not picking up subtle clues from simulation artefacts, there are still several issues that we need to address before applying this model to actual data: first of all, we need to first identify which observational data are more suitable to be adopted for this analysis. For example, previous theory and numerical studies have shown that in the case of optically thick tracers the spectral index saturates to −3 (Lazarian & Pogosyan 2004; Burkhart et al. 2013), so our CNN might never be able to predict either the density or velocity spectral index. Moreover, the simulations we considered are highly idealized, lacking important physical ingredients such as magnetic fields, relevant chemical reaction networks, and self-gravity. For this proof-of-concept work, we justify this choice based on the much higher computational resources needed to model these ingredients. However, the entity of the bias affecting a deep learning model trained on simplified simulations when applied to real data is still in need of quantification: a first check could be to run a limited number of more physically realistic simulations and evaluate the accuracy of our model predictions on them. Irrespective of the sophistication of their physics, another limitation of simulations is their resolution, which even with AMR cannot fully cover the range of scales spanned by turbulent gas in real systems. However, these issues are shared with any modelling that relies on simulations and are not directly related to our machine-learning approach, which incidentally yields accurate results even on simulations run with a different resolution with respect to the one used in training.
Our CNN approach has different strengths and weaknesses, as opposed to more time-tested approaches such as directly fitting the density power spectrum (obtained e.g. by fast-Fourier transforming an image). For example the latter method, while simpler and easier to interpret, requires some discretion in determining the power-law region of the spectrum to consider, e.g. by setting fiduciary cut-offs in spatial frequencies above and below which the spectrum data is disregarded. Additionally, our networks can be easily repurposed to predicting different physical quantities of the turbulent gas, which may not be immediately accessible to spectral methods.
ACKNOWLEDGEMENTS
This project has received funding from the European Union’s Horizon 2020 research and innovation programme under the Marie Skłodowska-Curie grant agreement No. 664931. AB and MM acknowledge financial support by the European Research Council for the ERC Consolidator grant DEMOBLACK, under contract no. 770017. MP wishes to thank Prof. David W. Hogg, Dr. Gregor Seidel, and Prof. Stella Offner for feedback and discussion.
DATA AVAILABILITY
The data underlying this article will be shared on reasonable request to the corresponding author.


