


ABSTRACT
We study the star formation histories (SFHs) and mass-weighted ages of 331 UVJ-selected quiescent galaxies in 11 galaxy clusters and in the field at 1 < z < 1.5 from the Gemini Observations of Galaxies in Rich Early ENvironments (GOGREEN) survey. We determine the SFHs of individual galaxies by simultaneously fitting rest-frame optical spectroscopy and broad-band photometry to stellar population models. We confirm that the SFHs are consistent with more massive galaxies having on average earlier formation times. Comparing galaxies found in massive clusters with those in the field, we find galaxies with M* < 1011.3 M⊙ in the field have more extended SFHs. From the SFHs we calculate the mass-weighted ages, and compare age distributions of galaxies between the two environments, at fixed mass. We constrain the difference in mass-weighted ages between field and cluster galaxies to |$0.31_{^{-0.33}}^{_{+0.51}}$| Gyr, in the sense that cluster galaxies are older. We place this result in the context of two simple quenching models and show that neither environmental quenching based on time since infall (without pre-processing) nor a difference in formation times alone can reproduce both the average age difference and relative quenched fractions. This is distinctly different from local clusters, for which the majority of the quenched population is consistent with having been environmentally quenched upon infall. Our results suggest that quenched population in galaxy clusters at z > 1 has been driven by different physical processes than those at play at z = 0.
1 INTRODUCTION
Since z ∼ 2.5, the galaxy population demonstrates a marked bimodality in star formation rates (SFRs; e.g. Brinchmann et al. 2004; Brammer et al. 2011; Muzzin et al. 2012), and the quiescent component, representing galaxies with negligible current SFRs, has increased steadily (Faber et al. 2007; Muzzin et al. 2013b; Tomczak et al. 2014; Barro et al. 2017). This indicates that the relatively rapid suppression of star formation (quenching) is a fundamental aspect of galaxy evolution, and one that is largely responsible for the steep decline in cosmic SFR density (e.g. Renzini 2016). The rate of quenching, and indeed galaxy evolution in general, is observed to depend strongly on both stellar mass and environment. In particular, galaxies that are more massive or exist in denser environments are more likely to be quiescent (e.g. Kauffmann et al. 2003, 2004; Brinchmann et al. 2004; Baldry et al. 2006; Weinmann et al. 2006; Kimm et al. 2009).
There have been many studies focused on identifying the main mechanisms that transform galaxies from star forming to quiescent. Simulations that include feedback from active galactic nuclei (AGN) and feedback from star formation have successfully reproduced the SFR bimodality (e.g. Bower et al. 2006; Croton et al. 2006; Hirschmann, De Lucia & Fontanot 2016), if not quite replicating the observed quenched fractions (e.g. Hirschmann et al. 2016; Xie et al. 2020). However, explaining the dependence of the quenched fraction on local environment appears to require additional processes related to the larger scale environmental densities of galaxies (e.g. Baldry et al. 2006; Peng et al. 2012). Environmental quenching is commonly thought to take place as a galaxy accretes into the halo of a larger structure, either by the removal of its gas reservoir through tidal/ram pressure stripping or by preventing gas in the galaxy halo from accreting and forming new stars, sometimes called strangulation (e.g. Gunn & Gott 1972; Larson, Tinsley & Caldwell 1980; Balogh, Navarro & Morris 2000). Evidence for the removal of gas can be seen by the lack of line emission from galaxies approaching larger haloes (e.g. Jaffé et al. 2016; Odekon et al. 2016; Zhang et al. 2019). Denser environments could also favour tidal interactions, or harassment, between galaxies (e.g. Merritt 1983; Moore et al. 1996), which can lead to increased SFRs and accelerated gas consumption (Fujita 2004). Given that the fraction of quiescent galaxies increase with the number density of surrounding galaxies (i.e. rich galaxy clusters versus galaxy groups, e.g. Kauffmann et al. 2004; Peng et al. 2010; Wilman, Zibetti & Budavári 2010; Darvish et al. 2016; or with distance from cluster cores, e.g. Loh et al. 2008; Woo et al. 2013; Lin et al. 2014; Muzzin et al. 2014; Jian et al. 2017; Guglielmo et al. 2019; Pintos-Castro et al. 2019), the effectiveness of environmental quenching is thought to scale with environmental density.
A simple empirical model of environmental quenching is that, upon infall, the SFR of a galaxy rapidly declines, on an e-folding time-scale called the ‘fading time’. Motivated in part by the non-zero fraction of star-forming galaxies in clusters, this quenching is thought to happen at some time after infall, called the delay time. Wetzel et al. (2013) used a sample of local galaxies in the Sloan Digital Sky Survey (SDSS; York et al. 2000) together with a cosmological N-body simulation in the context of this ‘delayed-then-rapid’ model, and found that typical delay times at z = 0 are 2–4 Gyr, and fading times <0.8 Gyr. Galaxy haloes grow hierarchically, however, and this infall-based quenching might happen upon the first infall of a galaxy into a larger halo, which might not be the final cluster halo. So-called ‘pre-processing’ within galaxy group environments may be an important preceding process (e.g. Zabludoff & Mulchaey 1998; Fujita 2004; McGee et al. 2009; De Lucia et al. 2012; Pallero et al. 2019). Observations at higher redshifts have the potential to remove some of the degeneracies associated with this empirical picture, in part because the evolution in galaxy properties like SFRs and gas fractions is decoupled from the rate of dark matter halo mass growth (e.g. McGee, Bower & Balogh 2014).
One direct way to trace galaxy evolution is to measure the stellar mass function (SMF) as a function of redshift and environment for passive and active galaxies (e.g. Fontana et al. 2004; Vulcani et al. 2011, 2013; Muzzin et al. 2013c; van der Burg et al. 2013, 2020; Tomczak et al. 2014; Nantais et al. 2016). Similarly, detailed studies of the stellar populations in galaxies compared across redshift epochs can reveal how the overall population of galaxies has evolved (e.g. Poggianti et al. 1999; Trager et al. 2000a; Sánchez-Blázquez et al. 2009). This is only indirectly connected to changes in star formation, like quenching, and does not allow one to easily identify what subset of the population is undergoing changes at a given time. A complementary approach is to measure the star formation histories (SFHs) of individual galaxies and thus reconstruct the growth of populations (e.g. Heavens, Jimenez & Lahav 2000; Panter, Heavens & Jimenez 2003; Heavens et al. 2004). Comparing the SFHs of galaxies in isolated and dense environments has the potential to provide new information on the effect of environment-specific quenching processes.
Measuring the stellar ages of galaxies as a probe of the SFH is very challenging, however. For all but the nearest galaxies individual stars are not resolved; rather, observations measure the integrated luminosity of the stellar population and thus it is necessary to disentangle the contribution of stars of various masses and ages. The galaxy spectral energy distributions (SEDs) also suffer from degeneracies between galaxy properties (e.g. stellar age, metallicity, and dust) particularly at low resolution (e.g. Worthey 1994). Many studies rely on studying select spectral features, observed at high resolution, which are well calibrated against such degeneracies (e.g. Vazdekis 1999; Trager et al. 2000b) or more recently with full-spectrum fitting (e.g. MacArthur, González & Courteau 2009; Sánchez-Blázquez et al. 2011). Photometry alone cannot distinguish between such model parameters, and age estimates can be strongly influenced by priors (Carnall et al. 2019b; Leja et al. 2019a). The integrated luminosity is also dominated by bright young stars, ‘outshining’ evidence of older stellar populations (Papovich, Dickinson & Ferguson 2001). Galaxies older than ∼5 Gyr have very similar SEDs, making it difficult to precisely estimate the stellar age of quiescent galaxies at low redshifts (e.g. Gallazzi et al. 2005). Moreover, empirical models of stellar evolution are biased by systematic uncertainties and can significantly impact age estimates, particularly for galaxies dominated by intermediate-age stars (e.g. Maraston 2005; Han & Han 2018). While measuring the properties and SFHs of individual galaxies provides the clearest picture of galaxy evolution, this requires relatively large samples of galaxies with sufficiently high signal-to-noise ratio (SNR) continuum spectroscopy.
The consensus of observations at low to moderate redshifts, despite these challenges, is that there is a trend between the SFHs and stellar mass for quiescent galaxies: the SFRs of massive galaxies peaked at earlier times than lower mass systems (sometimes called ‘downsizing’; e.g. Cowie et al. 1996; Brinchmann et al. 2004; Kodama et al. 2004), and correspondingly massive galaxies form their stellar mass earlier (and are therefore older) on average (‘archaeological downsizing’; e.g. Nelan et al. 2005; Thomas et al. 2005, 2010; Treu et al. 2005a,b; Cimatti, Daddi & Renzini 2006; Gallazzi et al. 2014; Pacifici et al. 2016; Carnall et al. 2018; Estrada-Carpenter et al. 2020; Saracco et al. 2020). These trends together are commonly referred to as ‘mass-dependent evolution’.
For massive galaxies, the majority of their stellar mass is formed within only 1–2 Gyr (Gallazzi et al. 2004, 2005; Glazebrook et al. 2004; Bell et al. 2005; Nelan et al. 2005; Thomas et al. 2005, 2010; Treu et al. 2005a; Toft et al. 2012; McDermid et al. 2015; Citro et al. 2016), and have quenched as early as z ∼ 3–4 (e.g. Straatman et al. 2014; Glazebrook et al. 2017; Schreiber et al. 2018b; Forrest et al. 2020a). Low-redshift observations of massive quiescent galaxies (typically early-type galaxies, ETGs) find that galaxies in less dense environments are on average 1–2 Gyr younger than galaxies in massive clusters (e.g. van Dokkum & Stanford 2003; Thomas et al. 2005; Renzini 2006, and references therein). Notably, age differences at low redshifts could be enhanced by environmental effects that come into play only at late times, such as ‘rejuvenation’ (Thomas et al. 2010) or ‘frosting’ (Trager et al. 2000b) of star formation via galaxy mergers or interactions – which occur more frequently in lower mass haloes (e.g. Cooper et al. 2010). Paulino-Afonso et al. (2020) show that star formation can be enhanced for low-to-moderate-mass galaxies even at moderate, ‘filament-like’ overdensities. For these reasons, higher redshift observations can provide better leverage on the differences in galaxy properties related to how they evolved in different environments.
At z ∼ 1, the average ages of ETGs in low-density environments are within 0.5 Gyr of comparable galaxies in galaxy clusters (e.g. Gobat et al. 2008; Rettura et al. 2010, 2011; Thomas et al. 2010; Raichoor et al. 2011; Saracco et al. 2017; Woodrum et al. 2017). The lack of environmental influence at this epoch is supported by Fundamental Plane (FP) studies of ETGs that show that the mass-to-light (M/L) ratios evolve similarly for galaxies in field and cluster environments (e.g. di Serego Alighieri, Lanzoni & Jørgensen 2006a,b; van Dokkum & van der Marel 2007; Saglia et al. 2010; Woodrum et al. 2017). Studies of SFRs between star-forming galaxies in cluster and field environments show mixed results, either predicting little (e.g. Peng et al. 2010; Muzzin et al. 2012) or modest (e.g. Vulcani et al. 2010; Popesso et al. 2011; Koyama et al. 2013; Old et al. 2020, and McGee et al. 2011 for groups) trends between the star-forming main sequence and environment.
Importantly, the present comparisons at z > 1 between field and cluster galaxies are typically made for small samples and/or with limited stellar mass coverage, relying on the measurement of few absorption line indices (e.g. van der Wel et al. 2004; van Dokkum & van der Marel 2007; Gobat et al. 2008; Woodrum et al. 2017; Saracco et al. 2020) or photometric SEDs (e.g. Rettura et al. 2010, 2011; Raichoor et al. 2011; Saracco et al. 2017). While recent spectroscopic surveys have collected larger samples of quiescent galaxies at higher redshifts (e.g. Pacifici et al. 2016; Thomas et al. 2017; Carnall et al. 2019a; Estrada-Carpenter et al. 2019), there has not yet been a systematic study of the SFHs with environment. We can significantly improve our understanding of the differences in SFHs of galaxies related to their environment with the Gemini Observations of Galaxies in Rich Early ENvironments (GOGREEN)1 survey (Balogh et al. 2017,2020). The GOGREEN survey targeted galaxies in clusters and groups at 1 < z < 1.5, and includes isolated ‘field’ galaxies along the line of sight of these structures. With galaxies at lower stellar masses, and at higher redshifts, than preceding surveys [e.g. the Gemini CLuster Astrophysics Spectroscopic Survey (GCLASS), Muzzin et al. 2012; the Galaxy Environment Evolution Collaboration 2 (GEEC2), Balogh et al. 2014], GOGREEN is better suited to test the predictions of galaxy evolution models (e.g. Bower, Benson & Crain 2012; Weinmann et al. 2012).
Taking advantage of the well-sampled, homogeneously selected spectroscopy and broad photometric coverage for hundreds of galaxies observed as part of GOGREEN, we measure the SFHs and mass-weighted ages for quiescent galaxies in both average, ‘field’, environments and in massive galaxy clusters. Comparing the star formation time-scales between galaxies in clusters and field environments, we test simple quenching models that have been proposed to explain the difference in ages between the two populations. This work complements the comparison of the stellar mass distributions measured in van der Burg et al. (2020), and the relation between stellar mass and star formation for star-forming galaxies (Old et al. 2020).
The paper is outlined as follows. In Section 2, we provide a brief description of the GOGREEN sample and the selection of quiescent galaxies used in our analysis. In Section 3, we describe the SFH fitting procedure. In Section 4, we show the SFHs and estimated average ages, and test the robustness of the results against our selection criteria for quiescent galaxies. In Section 5, we discuss the SFHs and average ages as a function of stellar mass and environment in the context of the literature. We also discuss our results in the context of two toy models for environmental galaxy quenching scenarios: either galaxies quench upon being accreted into denser environments, or galaxies in denser environments simply formed earlier. Lastly, in Section 6, we summarize the results.
The magnitudes reported are on the AB magnitude system. We use a Chabrier (2003) initial mass function (IMF), and adopt a flat Λ cold dark matter (ΛCDM) cosmology with Ωm = 0.3 and H0 = 70 km s−1 Mpc−1.
2 DATA AND SAMPLE SELECTION
2.1 The GOGREEN survey
The GOGREEN survey includes 21 galaxy systems at 1 < z < 1.5 selected to be representative of progenitors of local clusters and groups, described in detail in Balogh et al. (2017, 2020). Groups and clusters with a wide range of halo masses were targeted, and within them galaxies with a wide range of stellar masses were targeted. For this work, we include 11 clusters from the GOGREEN survey that have complete spectroscopy and photometry as of 2020.
Table 1 lists the clusters with their coordinates and redshifts (Balogh et al. 2017; van der Burg et al. 2020, see Biviano et al., in preparation for halo masses and velocity dispersions). Three of these systems are from the South Pole Telescope (SPT) survey (Brodwin et al. 2010; Foley et al. 2011; Stalder et al. 2013), nine are from the Spitzer Adaptation of the Red-Sequence Cluster Survey (SpARCS; Muzzin et al. 2009; Wilson et al. 2009; Demarco et al. 2010). Five of the SpARCS clusters were also included in the GCLASS (Muzzin et al. 2012). We add to the number of low-mass galaxies in the GCLASS sample, and increase the sampling at higher masses particularly at z < 1.3.
Description of the GOGREEN galaxy cluster targets.
| Full name | BCG RA, Dec. | Redshift |
|---|---|---|
| (J2000) | ||
| SPT 0205 | 02:05:48.19, −58:28:49.0 | 1.323 |
| SPT 0546 | 05:46:33.67, −53:45:40.6 | 1.068 |
| SPT 2016 | 21:06:04.59, −58:44:27.9 | 1.132 |
| SpARCS 0035−3412a | 00:35:49.68, −43:12:23.8 | 1.335 |
| SpARCS 0219−0531 | 02:19:43.56, −05:31:29.6 | 1.328 |
| SpARCS 0335−2929 | 03:35:03.56, −29:28:55.8 | 1.368 |
| SpARCS 1034+5818 | 10:34:49.47, +58:18:33.1 | 1.388 |
| SpARCS 1051+5818a | 10:51:11.23, +58:18:02.7 | 1.034 |
| SpARCS 1616+545a | 16:16:41.32, +55:45:12.4 | 1.157 |
| SpARCS 1634+4021a | 16:34:37.00, +40:21:49.3 | 1.177 |
| SpARCS 1638+4038a | 16:38:51.64, +40:38:42.9 | 1.194 |
Note. Coordinates and redshifts for each galaxy system in the GOGREEN sample. Spectroscopic redshifts are from Balogh et al. (2020). SpARCS 1033 was excluded in this study because of the lack of K-band photometry. aClusters also in the GCLASS.
GOGREEN provides broad-band photometry and Gemini Multi-Object Spectrograph (GMOS) spectroscopy for a selection of galaxies in each system. The survey strategy and magnitude limits (z′ < 24.25 and [3.6] < 22.5) of the GOGREEN survey enable both a large sampling of bright galaxies and very deep spectroscopy of much fainter galaxies. The full survey is statistically complete for all galaxy types with stellar masses |$\log M_*/\rm {M}_{\odot} \gtrsim 10.3$| at 1 < z < 1.5 (Balogh et al. 2020). Including the systematic offset between stellar mass estimates (see Appendix C), the mass completeness of the sample is |$\log M_*/\rm {M}_{\odot} \gtrsim 10.5$|. Completeness here is characterized as a function of stellar mass and clustercentric distance, where above this limit our sample is representative of an unbiased sampling of the full galaxy population. We note that the lower mass selection used throughout this paper is below this mass completeness threshold, and the conclusions drawn from these galaxies are not necessarily statistically robust.
2.2 Spectroscopic sample
Spectroscopy for the GOGREEN galaxies was taken with the GMOS instruments using the R150 filter and three spectral dither positions (8300, 8500, and 8700 Å). Spectral dithers are done to fill in the gaps between the GMOS CCDs where spectral information is lost. This provides continuous wavelength coverage free of second-order contamination over 6400–10 200 Å. For the redshift range 1 < z < 1.5, this corresponds to about 2500–5250 Å rest frame.
The GMOS detector field of view is 5.5 × 5.5 arcmin2, which roughly matches the size of our clusters (∼2.8 Mpc at z = 1.3). With 1 arcsec slits, the spectra have an observed full width at half-maximum (FWHM) resolution of ∼20 Å (R = 440 ± 60). We used the nod and shuffle mode to maximize the number of slits per exposure, particularly in the cluster centres, and to perform accurate sky subtraction. Specifics of the spectral data reduction can be found in Balogh et al. (2017, 2020). The basic steps follow the Gemini iraf2 reduction procedure, with additional corrections for scattered light and telluric absorption. Wavelength calibrations were established using CuAr lamp observations taken concurrent to the GMOS observations, with reference to night sky lines to account for flexure shifts. The lack of features below 6400 Å results in unreliable calibrations at this end of the spectra. The 1D spectra were extracted and combined. Although a relative sensitivity correction was applied, based on standard star observations, the spectra were not absolute flux calibrated. This requires additional corrections in the fitting procedure discussed in Section 3.
In this study, we included only galaxies for which we could measure a spectroscopic redshift with confidence (quality flag 3 or 4) – this includes 970 galaxies. Spectroscopic redshifts were derived using the Manual and Automatic Redshifting Software (marz; Hinton et al. 2016), as described in Balogh et al. (2020).
2.3 Photometric coverage
GOGREEN has broad photometric coverage for each galaxy system. A full description of the photometry, as well as the calculation of stellar masses and rest-frame colours, is provided in van der Burg et al. (2020). The photometry includes Gemini GMOS (z′), Spitzer Infrared Array Camera (IRAC),3 Very Large Telescope (VLT)-VLT VIsible Multi-Object Spectrograph (VIMOS)4 (U, B, V, R, I, z) and High Acuity Wide field K-band Imager (HAWK-I; Y, J, Ks), Subaru Suprime-Cam (g, r, i) and Hyper Suprime-Cam (z, Y), Magellan FourStar (J1, J, Ks), Canada–France–Hawaii Telescope (CFHT) WirCam (J, Ks) and MegaCam (U), and Blanco DECam (z). The one GOGREEN cluster not included in our sample (SpARCS 1033) did not have K-band data as of the 2019A semester.
Rest-frame colours were derived from best-fitting templates to the observed photometry with eazy (Brammer, van Dokkum & Coppi 2008), assuming an exponentially declining SFR, Calzetti et al. (2000) dust law, Bruzual & Charlot (2003) stellar library, and solar metallicity. Templates were fixed to the spectroscopically determined redshift, and the redshift-corrected best-fitting template was then convolved with U, V, and J filters (see Fig. 1). Galaxies observed in the Cosmic Evolution Survey (COSMOS) fields have rest-frame colours as provided from the UltraVISTA v4.1 catalogue (Muzzin et al. 2013a).
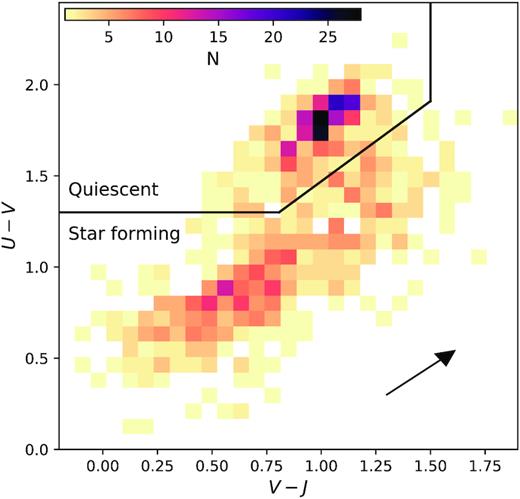
Rest-frame UVJ colours for the GOGREEN spectroscopic sample in the range 1 < z < 1.5, shown as a 2D histogram for both cluster and field galaxies. The black line shows the selection of quiescent galaxies used in this study, as defined by Muzzin et al. (2013b), from star-forming galaxies. The arrow indicates the impact of 1 mag of extinction in the V band, using the Calzetti et al. (2000) dust law.
2.4 Sample selection
The goal of this paper is to compare the ages and SFHs of quiescent galaxies in cluster and field environments. Quiescent galaxies were selected based on their position in rest-frame U−V and V − J colour space, which has been shown to effectively separate star-forming and quiescent galaxies (Labbé et al. 2005; Wuyts et al. 2007; Williams et al. 2009; Patel et al. 2012; Whitaker et al. 2012; Muzzin et al. 2013b) to z < 2.5 (Williams et al. 2010). Including the near-infrared (NIR) colour allows quiescent galaxies to be more clearly distinguished from dusty star-forming galaxies, since dust reddening scatters along the UVJ colour selection vector. We consider alternative selections in Appendix A.
Galaxies were identified as cluster members or field based on their spectroscopic redshifts and projected phase-space locations. A detailed description will be provided in Biviano et al. (in preparation). The field galaxy sample is taken as the galaxies along the line of sight of the clusters, not identified as members, and with spectroscopic redshifts within 1 < z < 1.5. We also include galaxies in the five GOGREEN fields within COSMOS (Muzzin et al. 2013a). These pointings targeted group-mass systems that are otherwise not considered in this paper. We include galaxies that have a line-of-sight velocity more than 900 km s−1 from the targeted group redshift in our field sample. Our sample of quiescent galaxies includes 224 cluster members and 110 field galaxies.
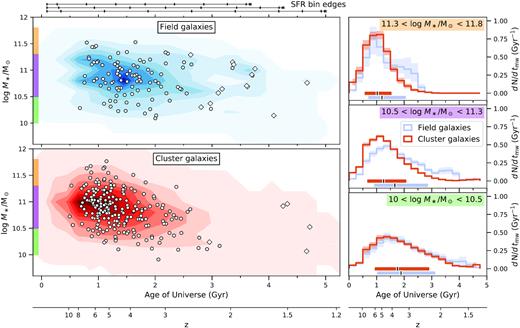
Fig. 2 shows the distribution of our quiescent sample as a function of stellar mass and redshift. Cluster galaxies are coloured orange and shown as hatched histograms, and field galaxies are blue with solid histograms. Stellar masses were determined from SED fits to the photometry and spectroscopy, discussed further in Section 3. The majority of the cluster galaxies are within 1.1 < z < 1.2, while the field galaxies are more evenly spaced in redshift (see Balogh et al. 2020).
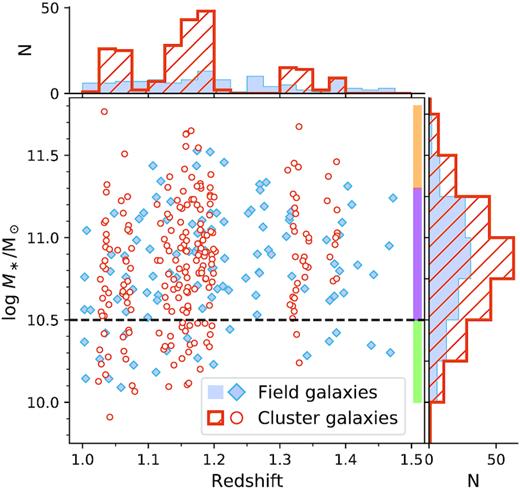
Stellar masses and redshifts for the UVJ-quiescent GOGREEN spectroscopic sample, with corresponding histograms on each axis. Field galaxies are shown as blue diamonds, and cluster member galaxies are red. Coloured blocks indicate the span of mass bins discussed throughout the analysis. A dashed line indicates the mass completeness of our sample, where the lowest mass bin is below this threshold. Note that the stellar masses shown here are derived with non-parametric SFHs, and are systematically offset from those derived using fast as reported in other GOGREEN papers; see Section 3 and Appendix C for details. Our sample ranges 1 < z < 1.5, and stellar masses between |$10^{9.9}$| and |$10^{11.8}\, \mathrm{M}_\odot$|.
3 FITTING STAR FORMATION HISTORIES OF QUIESCENT GALAXIES
SFHs of the quiescent galaxies are constrained by fitting photometric and spectroscopic data with spectral energy templates using the prospector inference code5 (v0.3.0; Leja et al. 2017; Johnson et al. 2019). The physical models are generated from the flexible stellar population synthesis code fsps (Conroy, Gunn & White 2009) with mist stellar evolutionary tracks and isochrones (Choi et al. 2016; Dotter 2016; based on the mesa stellar evolution code, Paxton et al. 2011, 2013, 2015, 2018), and miles6 spectral templates (Vazdekis et al. 2015). Biases related to metallicities are discussed further in Appendix B, where we conclude that any such systematics have a negligible impact on our results.
We assume a non-parametric7 form for the SFHs with a continuity prior (described in Leja et al. 2019a) and Milky Way extinction curve (Cardelli, Clayton & Mathis 1989). We mask the only prominent emission-line region within our spectral range ([O ii]) rather than include a nebular line emission model. Table 2 lists the free parameters in the fitting procedure: redshift, total mass formed, dust optical depth, stellar metallicity, relative8 SFR ratios in 10 age bins, spectral normalization, spectral polynomial coefficients, spectral white noise, and spectral outlier fraction. The priors for each parameter are also provided in this table. The age bins are spaced so that the first four bins correspond to 30, 100, 500 Myr, and 1 Gyr in units of lookback time, and the final bin covers the first 5 per cent of the age of our Universe. The remaining age bins are spaced equally in time.9 Note that galaxies observed at different redshifts will have different age binning in cosmic time (i.e. time since the big bang).
SFH parameters and priors.
| Note | Parameter | Description | Prior |
|---|---|---|---|
| 1 | zred | Redshift | Uniform: zspec ± 0.01 |
| 2 | log (M/M⊙) | Total mass formed | MZR: clipped normal, min = 8, max = 15 |
| 3 | |$\hat{\tau }_{\lambda ,2}$| | Diffuse dust optical depth | Uniform: min = 0, max = 4 |
| 4 | log (Z/Z⊙) | Stellar metallicity | MZR: clipped normal, min = −2, max = 0.19 |
| 5 | |$\log \left(\frac{\mathrm{SFR}(t)}{\mathrm{SFR}(t+\Delta t)}\right)$| | Ratio of the SFR ratios in adjacent age bins | Student t: μ = 0, σ = 0.3, 2 dof |
| 6 | spec_norm | Normalization of the spectra | Uniform: min = 0, max = 100 |
| 7 | p1, p2, p3 | Continuum shape correction polynomial coefficients | Uniform: min = −0.1/(n + 1), max = 0.1/(n + 1) |
| 8 | spec_jitter | Spectra white noise model | Uniform: min = 1, max = 3 |
| 9 | |$f_\mathrm{outlier,\, spec}$| | Spectra outlier fraction | Uniform: min = 10−5, max = 0.5 |
Note. 1 – Spectroscopic redshift. 2 – Total mass is the sum of total stellar mass and mass lost to outflows; see note 3 for a comment on the prior. 3 – We assume a Milky Way extinction curve (Cardelli et al. 1989). 4 – We assume a prior on the stellar mass–metallicity relation (MZR) according to the local trend reported by Gallazzi et al. (2005), where we add the systematic offset between parametric and non-parametric stellar mass estimates (see Appendix C). 5 – Ratio of the SFRs in adjacent bins of the 10-bin non-parametric SFH. The age bins are spaced in lookback time: 0, 30, 100, 500 Myr, and 1 Gyr, five equally spaced bins, and lastly 0.95× the age of our Universe at the observed redshift. For N age bins, there are N − 1 free parameters. 6 – The normalization of the spectra is a free parameter to account for systematics in the relative flux calibration. 7 – The shape of the spectral continuum can be adjusted by a third degree Chebyshev polynomial to account for systematics in the relative flux calibration. 8 – The uncertainty on the spectra can be increased by a given factor, with a likelihood penalty for factors giving reduced χ2 < 1. 9 – An outlier pixel model can increase the errors for individual pixels by a factor of 50, to accommodate for poor matches between the data and spectral templates.
Three of the free parameters help to identify systematics in the spectra. The white-noise inflation (spec_jitter) effectively increases the uncertainties on all spectral points by a multiplicative factor. This is counterbalanced by the standard likelihood penalty term for larger uncertainties. This down-weighting of the spectra is rarely relevant unless the data have high SNR and are more accurate than the models. We also include an outlier pixel model (|${f}_\mathrm{outlier,\, spec}$|) that modifies the likelihood to be more permissive of large deviations from the model. Such large deviations can come from poor matches to the stellar models (due to differences in e.g. α-enhancement) and increases their errors by a factor of 50. The outlier fraction is less than 3 per cent for the majority (95 per cent) of our fits.
In fitting the spectroscopy and photometry together, we need to account for uncertainties in the spectral response calibration, and for the overall flux calibration due to slit losses. Several authors have demonstrated the challenge of simultaneously fitting spectral and photometric data, especially when the spectral continuum is not well characterized (Panter et al. 2007; van der Wel et al. 2016; Belli, Newman & Ellis 2019; Carnall et al. 2019a; Johnson et al. 2019). As described in Section 2.2, the spectra were not absolute flux calibrated. The flux calibration is uncertain due to slit losses, the lack of atmospheric dispersion correction, and uncertainties in the telluric absorption corrections. To accommodate for these effects, the spectral normalization (spec_norm) and a spectrophotometric calibration polynomial are calculated from the ratio of the observed and model spectrum, and applied to the template spectrum prior to assessing the goodness of fit. We use a third-order Chebyshev polynomial since a higher order polynomial could wash out real spectroscopic features.
The spectral fit was restricted to the wavelength range 3525–4400 Å rest frame, covering the majority of useful spectral features (e.g. Ca H&K, Dn(4000), Hδ, G) while minimizing sensitivity to the lowest and highest wavelength ranges where flux calibration is most uncertain due to rapidly changing sensitivity. The lower bound is set by the different resolution of the miles spectral templates at redder wavelengths. Beyond 4400 Å, some of the spectra suffer systematic effects due to insufficiently well-corrected telluric absorption. Because of the limitations of the template spectra, the metallicity was restricted to |${-}2\lt \log Z/\mathrm{Z}_{\odot}\lt 0.19$| and the abundance patterns were fixed to solar. Prior to fitting the spectroscopy, the template spectra are smoothed to match the resolution of the observed spectrum. Lastly, we assumed a minimum photometric error of 5 per cent as a conservative estimate of the calibration uncertainty in the photometry.
prospector uses emcee (Foreman-Mackey et al. 2013) to create an ensemble of walkers that sample the parameter space following an affine invariant algorithm for a given number of steps. We used 64 walkers, iterative ‘burn-in’ in steps of 16, 34, 68, and 124, and a minimum of 1024 iterations thereafter. Each fit was visually confirmed as being converged (i.e. the traces were stable), or the sampling was restarted from the previous maximum probability solution. We take only the last 500 iterations when building the posteriors. The SFHs were sometimes multimodal, particularly where the SNR was poor, which motivated us to use a weighted combination of a differential moves (80 per cent) and snooker differential moves (20 per cent) in the Markov chain Monte Carlo (MCMC) sampling.10
An example of the output of this fitting procedure is shown in Figs 3 and 4. In Fig. 3, the observed photometry (top, green circles) and spectrum (bottom, green line) are shown relative to the template with the highest combined likelihood and prior (maximum a posteriori, MAP; black line). The shaded green regions about the spectrum indicate the uncertainty, while masked regions in the fit are shown as faint green lines. The spectrum is shown relative to the MAP after the spectrophotometric polynomial was applied. A selection of the SFH parameters with their posteriors is shown in Fig. 4 as a corner plot, and the range of SFRs as determined from the relative SFRs. The 50th percentile value of each parameter is listed above its posterior, with uncertainties from the 68 per cent confidence regions.
![Example of typical photometric (green circles, top image) and spectroscopic (green line, bottom image) observations shown with the corresponding maximum a posteriori (MAP) template (black line), as a function of observed wavelength. The grey box indicates the wavelength region covered by the spectra relative to the photometry. The MAP template relative to the spectrum is shown with a polynomial ‘correction’ to account for systematics in the relative flux calibration. Green shaded regions indicate the uncertainty, and masked regions of the spectrum for the SFH fitting (e.g. the [O ii] line at 3727 Å rest frame). The posteriors for select parameters associated with this fit are shown in Fig. 4.](https://oup.silverchair-cdn.com/oup/backfile/Content_public/Journal/mnras/498/4/10.1093_mnras_staa2752/1/m_staa2752fig3.jpeg?Expires=1750565585&Signature=auw1rcqOf~V6p5DIV7jQ6Ed08q0QbuZMHm28HGg8aQy2PIZIlBpfPJnyxUZbPqqHGVqNKKZkYrn9hXjm8vM~mLZKFDI0hjJ8s5Z0YqwFIdAmFqF4ERXhoAaJU8eMR0Azt~JEprhDE26Mbl3UMXEBF9-wyxvCrTtrGChISPe~MD2DJws~CjK277ni~sJJzFgmjBHpshS-HsGeeGWxqgtjGUlw3PIJco5R31oDiv~rj6n3ZSDxjnEcCzFO0Va6VNA2OadCZA5Q2mteh~4wsemYiCjZum2Evy5RCuXfpIS0BbmNtZxhU8p2Kxnd4TKpwswann2NIqT61OesG6ROjHgoFQ__&Key-Pair-Id=APKAIE5G5CRDK6RD3PGA)
Example of typical photometric (green circles, top image) and spectroscopic (green line, bottom image) observations shown with the corresponding maximum a posteriori (MAP) template (black line), as a function of observed wavelength. The grey box indicates the wavelength region covered by the spectra relative to the photometry. The MAP template relative to the spectrum is shown with a polynomial ‘correction’ to account for systematics in the relative flux calibration. Green shaded regions indicate the uncertainty, and masked regions of the spectrum for the SFH fitting (e.g. the [O ii] line at 3727 Å rest frame). The posteriors for select parameters associated with this fit are shown in Fig. 4.
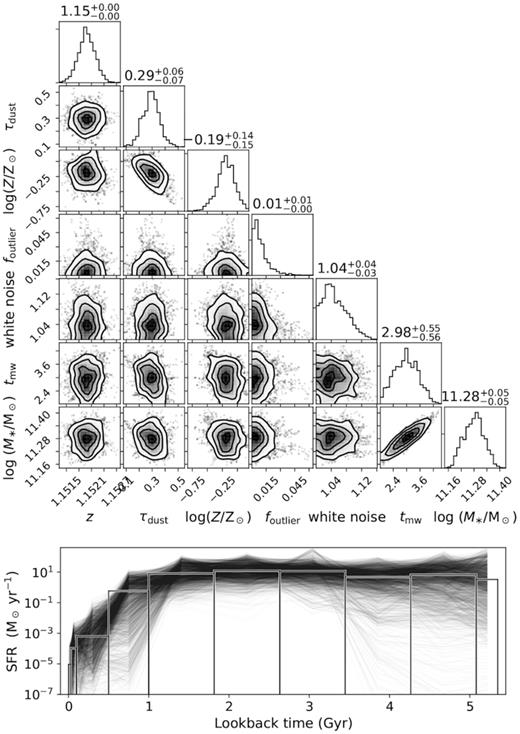
Selected posteriors for the fitting result shown in Fig. 3, which is a typical galaxy from our sample of GOGREEN quiescent galaxies. Top: corner plot showing a selection of posterior distributions for SFH parameters: redshift, metallicity, dust opacity, outlier fraction, and white noise, as well as two derived parameters: mass-weighted age and stellar mass (see Section 3). Posteriors are shown smoothed with a 1σ Gaussian, and the 50th percentiles are indicated on the top of each histogram with 68 per cent credible regions. Bottom: the posteriors for the SFRs are shown as a function of lookback time, where age bins are drawn with heights equal to the median in each bin.
Throughout this work we report the uncertainties as 68 per cent confidence regions (which corresponds to the 16–84th per cent range) as the majority of the distributions are non-symmetric. The lower (16–50th) and upper (50–84th) reported are equivalent to |${\pm} 1 \sigma$| for a normal distribution.
From the SFH posteriors we calculate11 the mass-weighted stellar age (tmw, discussed in Section 4.1) and stellar mass. The latter is determined from the posterior of the total stellar mass formed and the corresponding fraction of surviving stellar mass for each sampling. We confirm that the stellar masses derived using non-parametric modelling are systematically offset from than those derived with parametric models such as exponentially declining SFR models (e.g. using fast; Kriek et al. 2009). This comparison is discussed in Appendix C. We note that the stellar masses reported in other GOGREEN papers (e.g. Balogh et al. 2017; Chan et al. 2019; Old et al. 2020; van der Burg et al. 2020) are derived using fast, and therefore differ from the stellar masses in this paper by +0.2 dex. Since the focus of this paper is a differential comparison between galaxies in cluster and field environments, our results are less sensitive to the systematic effects related to model choices.
Only two of the fits clearly failed to reproduce the observations. For both the spectral continuum is dominated by telluric absorption that was not sufficiently corrected. The final sample includes 331 galaxies, 109 of which are field galaxies and 222 are cluster galaxies.
4 RESULTS
In this section, we present the results of the non-parametric SFH fitting applied to the sample of 331 quiescent GOGREEN galaxies. We explore differences related to stellar mass and density of local environment through comparing the SFHs and mass-weighted ages. We then test our result by refining our selection of quiescent galaxies. In Appendix D we compare features in co-added spectra to the results of fitting the individual galaxies.
4.1 The dependence of star formation histories on mass and environment
Fig. 5 shows the median sSFRs (star formation rates divided by the final stellar mass) for individual galaxies as a function of lookback time. Subplots separate galaxies according to environment and stellar mass. The overall median sSFRs for each selection of galaxies is shown as a bold line, and the 68 per cent confidence ranges are shown as shaded regions. The right-hand column compares sSFRs for galaxies between the two environments, at fixed mass. The bottom row compares SFHs for galaxies between mass selections, at fixed environment. The hatched shaded region in the right-hand column and bottom row show the bootstrapped uncertainties on the medians.
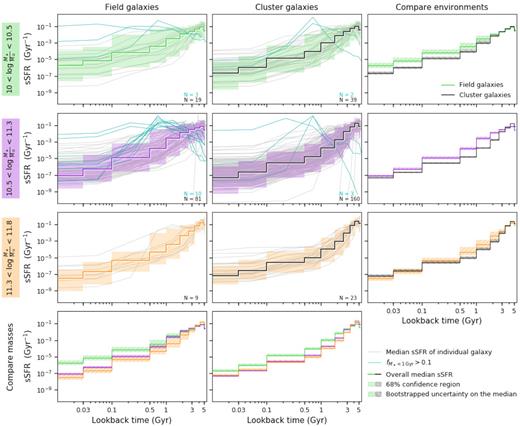
Specific SFR (SFR(t)/|$M_{\ast , z = z_\mathrm{obs}}$|) as a function of lookback time for field and cluster galaxies, in three mass bins. Individual sSFRs are shown as grey lines, where galaxies in which more than 10 per cent of their stellar mass has formed within the last 1 Gyr (see Section 4.3) are coloured cyan. The number of galaxies in each mass and environment selection is labelled at the bottom-right of the subplot. The overall median sSFR in each subsample is shown as a bold line, and is also shown in the right-hand column to compare between environments, and in the bottom row to compare between mass selections. The shaded region indicates the 68 per cent confidence region of the combined sSFRs, while the hatched shaded regions show the bootstrapped uncertainty on the overall median. Two trends are apparent from the median SFHs: higher mass galaxies form their mass earlier (i.e. mass-accelerated evolution), and cluster galaxies form their mass earlier.
The majority of galaxies follow a steady decline in sSFR, consistent with passive evolution. A few galaxies have more shallow declines or more recent star formation. We indicate galaxies that have more than 10 per cent of their stellar mass formed within the last 1 Gyr, with cyan lines in Fig. 5 (and list the number in each panel), and discuss them in Section 4.3. This population is not unexpected, as the UVJ colour selection can include younger galaxies, or those in transition. Four galaxies have extremely rapid declines in SFR, with negligible star formation within the last 1 Gyr.
Comparing galaxies at fixed environment (bottom row of Fig. 5), we find that more massive galaxies have overall earlier star formation activity, and form their stars over shorter time-scales. Lower mass galaxies, on average, have more extended SFHs. This trend is consistent with the ‘mass-dependent evolution‘ scenario (e.g. Nelan et al. 2005; Thomas et al. 2005), sometimes called ‘archaeological downsizing’ (Neistein, van den Bosch & Dekel 2006). Interestingly, the galaxies in our moderate mass bin more closely resemble their higher mass counterparts, but have slightly longer star-forming time-scales.
Comparing galaxies at fixed mass (right-hand column of Fig. 5), galaxies in clusters have overall earlier star formation activity in the sense that the sSFRs decline more quickly. Below masses of 1011.3 M⊙, the sSFRs of field galaxies are higher within the last ∼2 Gyr. In general, field galaxies in our lower mass sample have the flattest (most extended) SFHs.
Rettura et al. (2011) estimated the SFHs of massive ETGs in both clusters and the field at z ∼ 1.3, based on photometric observations, and concluded that while the formation epochs are similar between environments, field galaxies take longer to assemble than cluster galaxies. Specifically, they found that after 1 Gyr of star formation, 75 per cent of cluster galaxies had assembled at least 80 per cent of their final stellar mass, compared with only 35 per cent of field ETGs. We find a smaller difference, but also phrase it slightly differently given that we do not use parametric SFHs and do not constrain the onset of star formation: by z ∼ 5.4 (∼1 Gyr since the big bang), 75 per cent of our higher mass cluster galaxies had formed at least 80 per cent of their final stellar mass, compared to only 50 per cent of field galaxies. Although we find a stronger difference between the SFHs of field and cluster galaxies at moderate stellar masses, the difference is smaller than found by Rettura et al. (2011) (75 per cent versus 46 per cent), but consistent within the uncertainties of the SFHs given the systematic differences in modelling (discussed in Raichoor et al. 2011, in the context of the Rettura et al. 2011 measurements). We discuss the SFHs in the context of mass-dependent evolution and the literature further in Section 5.1.
4.2 The dependence of age on mass and environment
Fig. 6 shows the distribution of the stellar mass and mass-weighted ages, tmw, in units of cosmic time. Contours show the combined posteriors of the field (blue) and cluster (red) galaxies, where white points indicate the medians of the individual posteriors. The typical uncertainty for the mass-weighted ages is 0.52 Gyr, and for the stellar masses 0.043 dex. Diamonds indicate galaxies that have formed more than 10 per cent of their stellar mass within the last 1 Gyr (|$f_{M_\ast {\lt }1\, \mathrm{Gyr}}\gt 0.1$|), discussed in Section 4.3. The right-hand column shows combined age histograms for field and cluster galaxies within three mass ranges. The galaxy sample is bootstrap sampled to determine the variances within the age bins. Medians and 68 per cent credible regions of the combined distributions are indicated with horizontal bars near the bottom axis.
Comparison of stellar masses and mass-weighted ages between field (blue) and cluster (red) galaxies. Left: combined posteriors of stellar masses and tmw (in units of cosmic time), shown as contours. The medians of the individual posteriors are marked with white circles/diamonds. Diamonds indicate young galaxies, which have formed more than 10 per cent of their stellar mass within the last 1 Gyr (discussed in Section 4.3). Horizontal bars at the top of the figure indicate the edges of the age bins for z = 1.5 (top), z = 1.25 (middle), and z = 1 (bottom). The bins were defined in units of lookback time, and therefore do not match up for galaxies observed at different redshifts. Right: combined tmw posteriors for field and cluster galaxies, shown in three mass bins. The medians (black mark) and 68 per cent credible regions (coloured bar) of each distribution are marked at the bottom of each subplot. The shaded regions show the bootstrapped uncertainty of each histogram. Although there are field galaxies that formed as early as the oldest cluster galaxies, and cluster galaxies that formed as late as the youngest field galaxies, on average field galaxies have more extended SFHs to reach the same final stellar mass.
The mass-weighted ages of our sample are distributed primarily in the range 2 < z < 8, where there is a modest mass dependence in that galaxies in our higher mass selection have mass-weighted ages in the range 3 < z < 10, while the lower mass galaxies fall within 2 < z < 6. The majority (>50 per cent) of the higher (lower) mass galaxies have formed at least half of their stellar mass by z ∼ 5.4 (z ∼ 3.3). The shapes of the mass-weighted age distributions are also broader at lower stellar masses, as we saw from the SFHs shown in Fig. 5 and discussed in the previous section. Specifically, at z ∼ 3.3, at least 90 per cent of the higher mass galaxies have formed at least half their stellar mass, compared to only 50 per cent of the lower mass galaxies.
For the lower and higher mass galaxies in our sample, the differences between the mass-weighted ages of galaxies between environments at fixed mass are smaller than the differences across our stellar mass range at fixed environment. This is apparent in the histograms of the mass-weighted ages shown in the right-hand column of Fig. 6: the shapes of the distributions at fixed mass are more similar than between the higher and lower mass galaxies. We do note, however, that the age distributions for field galaxies are shifted towards younger ages, as well as broader. Interestingly, the distribution of mass-weighted ages for the moderate-mass cluster galaxies more closely resembles that of their more massive counterparts, while the field galaxies are more similar to their lower mass counterparts. This is to say that the moderate-mass galaxies in clusters are largely older, while the field galaxies are both younger overall and have an extended tail towards younger ages.
Next we attempt to compare the intrinsic distribution of ages between the field and cluster environments, accounting for the uncertainties on individual measurements. Comparing the rms uncertainties of individual posteriors to that of combined posteriors of similar mass (i.e. |$(\sigma _{\mathrm{ i}}^2 - \sigma _{\mathrm{comb.}}^2)^{-1/2}$|, although neither is necessarily normal), we find that there are significant intrinsic distributions of ages in both the cluster and field sample, with rms of 0.74 and 0.73 Gyr, respectively. The distributions are consistent between environments, however.
In order to better quantify the difference in mass-weighted ages between field and cluster galaxies, we compare the combined age distributions in a cumulative sense. This allows us to compare the cosmic time at which the two populations reach a given fraction of their mass-weighted age distribution. Within small (0.1 dex) mass ranges we select field galaxies and cluster galaxies, calculate their respective combined age distributions, and interpolate the cumulative distributions to the same binning. Within a given mass bin, we include all portions of the posteriors that fall within the limits (i.e. we are not selecting based on the median mass). We then measure the horizontal offset (i.e. in units of time) between the distributions (field – cluster). An example of this procedure is shown in Fig. 7. The mass-selected comparisons are then combined, weighted by the number of samplings from the respective posteriors, and the overall age offset is determined. We bootstrap our galaxy sample 500 times to capture the true variance.
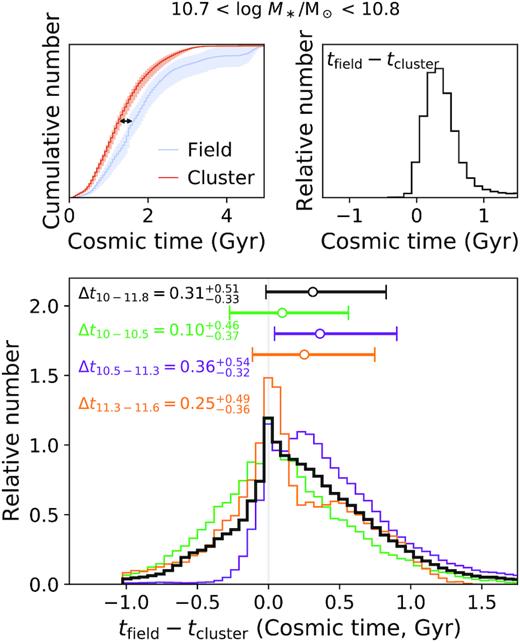
Distributions of offsets between cumulative age distributions of field and cluster galaxies (shown in Fig. 6 as non-cumulative histograms), in units of cosmic time. The top row shows an example of this age comparison for galaxies with stellar masses |$10.7{\lt }\log M_\ast /\rm {M}_{\odot}{\lt }10.8$|. The cumulative mass-weighted age distributions for the field (blue) and cluster (red) galaxies are shown in the top left-hand panel, where the samples have been bootstrapped and the variance is shown as a shaded region. The solid lines show the medians of the bootstrapped distributions. The corresponding offsets in the mass-weighted ages for interpolated bins spanning the cumulative distributions are shown in the top right-hand plot. Galaxies are compared at fixed stellar mass (bins of 0.1 dex) and combined, weighted by the integrated mass within the bins. The combined distributions within the broader mass selections used throughout previous figures are included for reference: |$10{\lt }\log M_\ast /\rm {M}_{\odot}{\lt }10.5$|, green; |$10.5{\lt }\log M_\ast /\rm {M}_{\odot}{\lt }11.3$|, purple; and |$11.3{\lt }\log M_\ast /\rm {M}_{\odot}{\lt }11.8$|, orange. The full mass range combined distribution is shown in black. The median age difference for each mass selection is labelled in the figure, which shows the age difference is within |$0.31_{^{-0.33}}^{_{+0.51}}$| Gyr. The median age difference is larger at lower stellar masses, and smaller for the highest mass galaxies. Error bars indicate the 68 per cent confidence range. This quantitative comparison echoes the qualitative comparison shown in Fig. 6 in that the quiescent cluster galaxies are on average older than comparable field galaxies.
Fig. 7 shows the cumulative age distribution comparisons combined into broader mass selections (coloured histograms), and for the full mass range of our sample (black). The median age difference is shown for each mass selection with error bars corresponding to the 68 per cent confidence region. Across the mass range of our sample, |$10{\lt }\log M_\ast /\mathrm{M}_{\odot}{\lt }11.8$|, the median age difference between field and cluster galaxies is |$0.31_{^{-0.33}}^{_{+0.51}}$| Gyr, in the sense that cluster galaxies are on average older than field galaxies. Interestingly, the age difference is slightly smaller for the lower and higher mass galaxies, and slightly larger for our moderate-mass galaxies. Note that the lower mass selection is below the mass completeness limit of our sample, and is dominated by galaxies z < 1.2. That is to say, the sample of galaxies below 1010.5 M⊙ is not a representative sample of the galaxy population, and the result is not as robust. Omitting the lower mass galaxies does not significantly change our result; however, the median age of the cluster galaxies is instead |${0.35}_{^{-0.32}}^{_{+0.51}}$| Gyr older than that of field galaxies.
We also consider the age comparison between galaxies at the lower end of our redshift selection, 1 < z < 1.2, and find that the age difference is slightly smaller, |${0.21}_{^{-0.39}}^{_{+0.88}}$| Gyr, but still consistent without the main result. On the other hand, galaxies at the higher end of our redshift selection, 1.3 < z < 1.4, have a slightly larger age difference: |${0.39}_{^{-0.74}}^{_{+0.49}}$| Gyr, but age consistent within the uncertainties. Fig. 8 shows the mass-weighted age comparison for each mass and redshift selection of quiescent galaxies. We further test our result by identifying galaxies that are not necessarily passively evolving, discussed in the next section.
![Differences in cumulative mass-weighted age distributions between field and cluster galaxies for different selections of our sample of quiescent galaxies, as described in the text, in units of cosmic time. Ages are first compared within 0.1 dex mass selections, and these comparisons are then combined, weighted by the number of posterior samplings in each selection (see Fig. 7 for an example of this procedure). We show the comparisons in mass ranges of $10{\lt }\log {M}_\ast /\rm {M}_{\odot}{\lt }11.8$, black (i.e. the full mass range); $10.0{\lt }\log {M}_\ast /\rm {M}_{\odot}{\lt }10.5$, green; $10.5{\lt }\log {M}_\ast /\rm {M}_{\odot}{\lt }11.3$, purple; and $11.3{\lt }\log {M}_\ast /\rm {M}_{\odot}{\lt }11.8$, orange. Note that the lowest mass bin is below our completeness limit. The median age difference for each mass selection is marked as a circle with error bars indicating the 68 per cent confidence range. The age comparison between luminosity-weighted ages is also shown, discussed in Appendix F, which predicts a slightly larger (by 0.1 Gyr) age difference than mass-weighted ages for the lower and middle mass ranges. The age comparison result for the full mass range does not significantly change when excluding high-z, low-z, or ‘young’ (${f}_{{M}_\ast {\lt } 1\, \mathrm{Gyr}}$ > 0.1) galaxies, galaxies with [O ii] emission, or galaxies near the UVJ colour quiescent selection boundary (labelled UVJ intermediate). The latter selections would reasonably exclude galaxies transitioning between star forming and quiescence, or which have complex dust properties obscuring star-forming populations. Overall the age difference between field and cluster galaxies is insensitive to recent star formation, unlike the low-redshift galaxies studied in Thomas et al. (2010).](https://oup.silverchair-cdn.com/oup/backfile/Content_public/Journal/mnras/498/4/10.1093_mnras_staa2752/1/m_staa2752fig8.jpeg?Expires=1750565585&Signature=bbRoY4CPfcpJhCUtZ9cZLqoD7e7nmJHxF4041xTbpdTKUXR9npMuHWLS99Ih1a6zsBJVriHiDh4ilHGdAko6SDHRiV2dM31JYMUNeaeeK98LzlMgr34m~R4UKXEZneDnItobJon3XEmWayp-61z4ASxyVCmuQeb2Roa3pUSqlPLfaVLX~B-EFk9bvErhJbDPd0LfPhVs32TftGvam5EhjifFD5pdQHWUQlkpiK3YUmhT2PEAFOLYN4THWxCsObCdvLHlAh-g1IeXKFuVOIHRj9JRuCxr9nXS42CJHAeDL3EjXblw2fUwAM8Xq8dO9JqDxMjQ5VvQELNbwzOSCqc5~g__&Key-Pair-Id=APKAIE5G5CRDK6RD3PGA)
Differences in cumulative mass-weighted age distributions between field and cluster galaxies for different selections of our sample of quiescent galaxies, as described in the text, in units of cosmic time. Ages are first compared within 0.1 dex mass selections, and these comparisons are then combined, weighted by the number of posterior samplings in each selection (see Fig. 7 for an example of this procedure). We show the comparisons in mass ranges of |$10{\lt }\log {M}_\ast /\rm {M}_{\odot}{\lt }11.8$|, black (i.e. the full mass range); |$10.0{\lt }\log {M}_\ast /\rm {M}_{\odot}{\lt }10.5$|, green; |$10.5{\lt }\log {M}_\ast /\rm {M}_{\odot}{\lt }11.3$|, purple; and |$11.3{\lt }\log {M}_\ast /\rm {M}_{\odot}{\lt }11.8$|, orange. Note that the lowest mass bin is below our completeness limit. The median age difference for each mass selection is marked as a circle with error bars indicating the 68 per cent confidence range. The age comparison between luminosity-weighted ages is also shown, discussed in Appendix F, which predicts a slightly larger (by 0.1 Gyr) age difference than mass-weighted ages for the lower and middle mass ranges. The age comparison result for the full mass range does not significantly change when excluding high-z, low-z, or ‘young’ (|${f}_{{M}_\ast {\lt } 1\, \mathrm{Gyr}}$| > 0.1) galaxies, galaxies with [O ii] emission, or galaxies near the UVJ colour quiescent selection boundary (labelled UVJ intermediate). The latter selections would reasonably exclude galaxies transitioning between star forming and quiescence, or which have complex dust properties obscuring star-forming populations. Overall the age difference between field and cluster galaxies is insensitive to recent star formation, unlike the low-redshift galaxies studied in Thomas et al. (2010).
4.3 Recent star formation
Our quiescent sample is selected based on UVJ colours. We have seen in Section 4.1 that our UVJ colour selection does not yield exclusively old galaxies with exponentially declining SFRs (cyan coloured SFHs in Fig. 5, marked with diamonds in Fig. 6). While four galaxies have fairly flat SFHs, most of these galaxies are ‘late bloomers’ with peaks in their sSFRs within the last 1 Gyr (similar to Dressler, Kelson & Abramson 2018). These galaxies are not necessarily ‘frosted’ in the sense of Trager et al. (2000b), or ‘rejuvenated’ in the sense of Thomas et al. (2010) or Chauke et al. (2018), given that these recent peaks account for a substantial fraction of the stellar mass.
Given the breadth of the UVJ-colour selection of these quiescent galaxies, it is conceivable that these galaxies are still in transition (the UVJ-colour selection is discussed further below). In addition, some of our UVJ-selected galaxies show significant [O ii] emission, which may be indicative of ongoing star formation. Both ‘young’ and [O ii]-emitting galaxies are more frequent in our field sample (similar to studies at lower redshifts, e.g. Treu et al. 1999, 2001; van Dokkum et al. 2001; van der Wel et al. 2004; Bernardi et al. 2006). We consider here if either population is the cause of the average mass-weighted age difference we find between field and cluster galaxies.
Fig. 9 shows |${f}_{{M}_\ast {\lt } 1\, \mathrm{Gyr}}$| as a function of stellar mass, separating cluster and field galaxies in colour, and galaxies that also have [O ii] emission are circled. Coloured boxes indicate the ranges of the three mass bins used throughout the paper. The number of galaxies that are ‘young’ by this definition are labelled in Fig. 5 for each mass and environment subsample; 13 of these galaxies are in the field population, accounting for 16 per cent (12 per cent) of the lower (moderate) mass sample. Comparatively, the four ‘young’ galaxies in our cluster sample account for 5 per cent (2 per cent) of the lower (moderate) mass samples. Although the relative fractions of these galaxies are higher in the field population, the overall fractions are still quite low. Indeed, the overall median SFHs shown in Fig. 5 are unchanged within the bootstrapped uncertainty when the ‘young’ galaxies are excluded.
![The fraction of stellar mass formed within the last 1 Gyr as a function of total stellar mass, for our UVJ-selected sample of quiescent galaxies. Galaxies with EW([O ii]) − σEW > 5 Å are circled. Field galaxies are shown as blue diamonds, and cluster galaxies as orange circles. Arrows indicate points below the shown scale. ‘Young’ ${f}_{{M}_\ast {\lt } 1\, \mathrm{Gyr}}$ > 0.1 galaxies are more common among field galaxies, and at stellar masses <1011.3 M⊙. There is no correlation between the presence of [O ii] emission and ${f}_{{M}_\ast {\lt } 1\, \mathrm{Gyr}}$ > 0.1, however. The robustness of age comparison is tested by excluding this population of ‘young’ galaxies, see Fig. 8.](https://oup.silverchair-cdn.com/oup/backfile/Content_public/Journal/mnras/498/4/10.1093_mnras_staa2752/1/m_staa2752fig9.jpeg?Expires=1750565585&Signature=lDpTk4Q6ScUONQeGE6VLiXxyD4oabrA~MnTUx3WzUdct~2ih8XcEPFAQp1lQ~0vS3RZWP1C9UB3MVhUS55x9gyvoaoEx4DxJc64WxqD7xLL5HGyK-enDqlB~BgMsAVT74JkJW4sDRKeUweHHld86pS8avVQVXdXlp2vzYuDuWJc6qUvxZljIl92DEFSy9~iIRFlpPXf9cC2NbXBcw-kQSovLagj19xZErMkWNCCJOsXTwqC5gOaJ4~puN8QjeeX0qS0CzQhdCpQPUap~xS4e9-tKUE3dMJyLc7aPHBuEQPvY0c6P-9z9MqfuKbC6uoVTDTlofOUCEYcH61IMdjuAQA__&Key-Pair-Id=APKAIE5G5CRDK6RD3PGA)
The fraction of stellar mass formed within the last 1 Gyr as a function of total stellar mass, for our UVJ-selected sample of quiescent galaxies. Galaxies with EW([O ii]) − σEW > 5 Å are circled. Field galaxies are shown as blue diamonds, and cluster galaxies as orange circles. Arrows indicate points below the shown scale. ‘Young’ |${f}_{{M}_\ast {\lt } 1\, \mathrm{Gyr}}$| > 0.1 galaxies are more common among field galaxies, and at stellar masses <1011.3 M⊙. There is no correlation between the presence of [O ii] emission and |${f}_{{M}_\ast {\lt } 1\, \mathrm{Gyr}}$| > 0.1, however. The robustness of age comparison is tested by excluding this population of ‘young’ galaxies, see Fig. 8.
The fraction of field galaxies in our sample with significant [O ii] emission (EW([O ii]) − σEW > 5 Å, cf. Appendix A), 17 per cent (19/109), are similarly larger than the 5 per cent (11/222) of cluster galaxies. Moreover, as apparent in the co-added spectra discussed in Appendix D, the strength of [O ii] emission is higher for field galaxies. Similar to our results, Rudnick et al. (2017) find that for a selection of intrinsically old galaxies the prevalence of [O ii] emission was higher for field galaxies, which they attributed to clusters (and groups) being sites where gas accretion on to massive galaxies (above 1010.4 M⊙) was shut off. Indeed, [O ii] emission can result from processes other than star formation (AGN and/or low-ionization nuclear emission-line region, LINER; e.g. Yan et al. 2006; Heckman 2009; Singh et al. 2013), and has complex dependence on interstellar medium (ISM) properties (Hogg et al. 1998). Interestingly, the sites of [O ii] emission in our sample have different mass ranges between environments: for field galaxies the [O ii]-emitting galaxies have masses <1010.9 M⊙ for all but three galaxies, while the cluster galaxies have masses >1010.9 M⊙ for all but three galaxies. We also note that only four of the |${f}_{{M}_\ast {\lt } 1\, \mathrm{Gyr}}$| > 0.1 galaxies also have [O ii] emission.
Fig. 10 shows our quiescent sample in UVJ colour space, where diamonds indicate |${f}_{{M}_\ast {\lt } 1\, \mathrm{Gyr}}$| > 0.1 galaxies, and galaxies with EW([O ii]) − σEW > 5 Å are circled. Interestingly, and perhaps as expected, the ‘young’ galaxies occupy the bluer end of the UVJ colours (except one galaxy), and both the ‘young’ and [O ii]-emitting galaxies preferentially occupy the colour space closer to the boundary of the quiescent selection. This region is below the dashed line in Fig. 10 where the U − V delimiter was increased by 0.3 dex.
![Rest-frame UVJ colours of the GOGREEN quiescent galaxies (plus marks), where ${f}_{{M}_\ast {\lt } 1\, \mathrm{Gyr}}$ > 0.1 galaxies are shown with colours according to the fraction of stellar mass formed within the last 1 Gyr, ${f}_{{M}_\ast {\lt } 1\, \mathrm{Gyr}}$. Cluster galaxies are shown as circles, field galaxies as diamonds. Galaxies with significant [O ii] emission are circled. Only a few of the ${f}_{{M}_\ast {\lt } 1\, \mathrm{Gyr}}$ > 0.1 or [O ii]-emitting galaxies occupy the densest region, i.e. the ‘red clump’. We therefore test our age comparison for galaxies in this clump by increasing the U − V selection by 0.3 dex, shown as a dashed line (in other words, exclude the ‘UVJ intermediate’ galaxies); see Fig. 8.](https://oup.silverchair-cdn.com/oup/backfile/Content_public/Journal/mnras/498/4/10.1093_mnras_staa2752/1/m_staa2752fig10.jpeg?Expires=1750565585&Signature=k8Bv74ttqoDNH0IHd-TEEHvwKhaZ~0XaHtto7SER2dlFQsyx-YLy7YPwhMotNzeHyPhlGI1z93y8nwNOknVqac5cwMzvhDuJ4FC1oLPpvaXXBGWAEhuOdBv6N3vjnR9kfNHi4v9nCvsKD4asAybijDOvlOFMXGFxRg1jMmkpw7jakfOCrApShc36JCgI1YhuOHGzvkXUp6ik14MESSTJ9jGomffg-HurLxMEzkxkPeQ7mGyXsLz8d2mKa1AqY65wUY3Z2JEa-qtyVT-vprLJSlDI-XAzgQvpOqz1J6Xxr~Yb-15h7hAPC~s4nyGjxdzMWNwnsS0t~qoNiXV8fgTkLQ__&Key-Pair-Id=APKAIE5G5CRDK6RD3PGA)
Rest-frame UVJ colours of the GOGREEN quiescent galaxies (plus marks), where |${f}_{{M}_\ast {\lt } 1\, \mathrm{Gyr}}$| > 0.1 galaxies are shown with colours according to the fraction of stellar mass formed within the last 1 Gyr, |${f}_{{M}_\ast {\lt } 1\, \mathrm{Gyr}}$|. Cluster galaxies are shown as circles, field galaxies as diamonds. Galaxies with significant [O ii] emission are circled. Only a few of the |${f}_{{M}_\ast {\lt } 1\, \mathrm{Gyr}}$| > 0.1 or [O ii]-emitting galaxies occupy the densest region, i.e. the ‘red clump’. We therefore test our age comparison for galaxies in this clump by increasing the U − V selection by 0.3 dex, shown as a dashed line (in other words, exclude the ‘UVJ intermediate’ galaxies); see Fig. 8.
We now repeat our measurement of the mass-weighted age difference between field and cluster galaxies, now excluding galaxies that are not intrinsically old. Fig. 8 summarizes the age comparisons for these various selections of quiescent galaxies, relative to the full sample. Our result does not significantly change when excluding ‘young’ (|${f}_{{M}_\ast {\lt } 1\, \mathrm{Gyr}}$| > 0.1) galaxies, galaxies with [O ii] emission, or galaxies near the UVJ-colour quiescent selection boundary (labelled UVJ intermediate). The latter selection would reasonably exclude galaxies transitioning between star forming and quiescence, or which have complex dust properties obscuring star-forming populations. Saying that, the largest change comes from excluding the |${f}_{{M}_\ast {\lt } 1\, \mathrm{Gyr}}$| > 0.1 galaxies, particularly at lower stellar masses. On the other hand, excluding the UVJ intermediate primarily increases the age difference between low-mass galaxies, although the error bars are larger due to smaller numbers of galaxies. The exclusion of [O ii]-emitting galaxies does not visibly affect the age difference at all except for the lower mass galaxies, decreasing the age difference. Overall the age difference between field and cluster galaxies is insensitive to recent star formation, unlike the low-redshift galaxies studied in Thomas et al. (2010).
The age comparison between luminosity-weighted ages is also shown, discussed in Appendix F, which predicts a larger (by 0.1 Gyr) age difference than mass-weighted ages, except for the highest mass galaxies. The luminosity-weighted age is more sensitive to recent star formation, so it is not unexpected that there is a mass dependence between tmw and tlw related to the mass-dependent SFHs.
5 DISCUSSION
The main goal of this work is to compare quiescent galaxies in average density (field) and high density (galaxy cluster) environments, while accounting for any differences related to their stellar mass. We now discuss our result that the age difference is within |$0.31_{^{-0.33}}^{_{+0.51}}$| Gyr in the context of the literature. In Section 5.1, we discuss that our SFHs are consistent with ‘mass-dependent evolution’, and the environmental dependence of the SFHs. In Section 5.2, we compare the mass-weighted age measurements to similar results from the literature, and discuss the difference between mass-weighted ages as a function of environment. We then place the measured age difference in the context of two simple quenching models in Section 5.3, where environmental quenching is purely related to the time since infall, or where there is no environmental quenching but the field population forms later than cluster galaxies.
5.1 Mass-dependent evolution of quiescent galaxies
Decades of work has shown that the bulk of star formation in massive ETGs occurred at high redshifts, and these galaxies have been passively evolving since. Studies connecting intermediate redshift and local observations of the colour–magnitude relations (e.g. Dressler 1980; Ellis et al. 1997; Stanford, Eisenhardt & Dickinson 1998), the evolution of the luminosity function (e.g. De Propris et al. 1999; Toft et al. 2004), the Fundamental Plane (e.g. van Dokkum et al. 1998; Kelson et al. 2000; Cimatti et al. 2006; di Serego Alighieri et al. 2006a,b; Jørgensen et al. 2006, 2007; Beifiori et al. 2017; Woodrum et al. 2017; Saracco et al. 2020), and absorption lines (e.g. Bender, Ziegler & Bruzual 1996; Kelson et al. 2001; Sánchez-Blázquez et al. 2009) suggest that ETGs have been evolving passively since z ∼ 2–3 (see Renzini 2006 for a review). As large-scale surveys became available (e.g. SDSS; York et al. 2000), trends between the SFHs and galaxy properties have increasingly been explored. A robust finding is that more massive galaxies form their stellar mass earlier and over shorter time-scales than lower mass galaxies (e.g. Heavens et al. 2004; Jimenez et al. 2005; Nelan et al. 2005; Thomas et al. 2005, 2010, 2017; Sánchez-Blázquez et al. 2009; Gallazzi et al. 2014), i.e. ‘mass-dependent evolution’. This is similar to the concept of ‘downsizing’ in the sense that there is mass-dependent decline in the SFRs of galaxies with time (e.g. Cowie et al. 1996; Bell et al. 2005; Juneau et al. 2005), or in the growth of the stellar mass function (e.g. Cimatti et al. 2006; Leitner 2012). This downsizing trend can be explained by the fact that more low-mass galaxies are continuously (over time) being added to the quiescent population (Brammer et al. 2011; Muzzin et al. 2013b; Tomczak et al. 2014). On the other hand, merger rates are mass dependent (Khochfar & Silk 2009; Emsellem et al. 2011), and late time rejuvenated star formation is more common in low-mass galaxies (Poggianti et al. 2008, 2009; Thomas et al. 2010; Belli, Newman & Ellis 2015).
The mass dependence of SFHs has been confirmed at higher redshifts, where age indicators are more sensitive to older stellar populations. However, observations beyond z ∼ 1 are challenging. As a result, studies have been mainly limited to surveys of massive galaxies with small samples (e.g. van Dokkum & Brammer 2010; Toft et al. 2012; van de Sande et al. 2013; Belli et al. 2015, 2019; Kriek et al. 2016; Estrada-Carpenter et al. 2019; Saracco et al. 2020), and rely on averaging photometric SFHs (e.g. Rettura et al. 2011; Snyder et al. 2012; Strazzullo et al. 2013; Pacifici et al. 2016; Iyer & Gawiser 2017) or combining spectra (e.g. Gobat et al. 2008; Tanaka et al. 2013; Whitaker et al. 2013; Choi et al. 2014; Onodera et al. 2015). Only recently large, high-redshift spectroscopic surveys have been completed that allow more precise age estimates of individual galaxies. Notably, Chauke et al. (2018) combine high-resolution spectroscopy and photometry for more than 600 galaxies at 0.6 < z < 1 from LEGA-C (van der Wel et al. 2016; Straatman et al. 2018) to show that galaxies with higher stellar velocity dispersions formed both earlier and faster, and that the majority of quiescent galaxies evolve passively since their main star-forming epoch. Carnall et al. (2019a) similarly use the VANDELS survey (McLure et al. 2018; Pentericci et al. 2018) to determine the SFHs for 75 massive quiescent galaxies at 1 < z < 1.3, finding a trend between the average formation times of galaxies and their stellar mass of |$1.48^{_{+0.34}}_{^{-0.39}}$| Gyr dex−1 for M* < 1011 M⊙.
The mass-dependent evolution in the GOGREEN quiescent galaxies is apparent in Fig. 5, where we find the more massive galaxies to have sSFRs that are higher at earlier times, and decline at earlier times, than the lower mass galaxies, at fixed environment. The median mass-weighted ages are shown in Fig. 6 relative to stellar mass, where contours show the combined posteriors. While we see that the ages of lower mass galaxies are younger on average, this appears to be driven by the fact that there is a broader distribution of ages among the lower mass galaxies. Indeed our trend between age and mass in our field sample is both flatter and offset towards older ages than found by Carnall et al. (2019a, and references therein).
The ∼1 Gyr offset in ages could be a result of differences in fitting procedure, where Leja et al. (2019b) report that prospector-α12 predicts older ages and higher stellar masses than standard parametric modelling. Carnall et al. (2019a) use a double power law form for their SFHs, however, which is more flexible than fiducial declining exponential models, so the ages should be more similar than those reported by Leja et al. (2019b). Along the same lines, Forrest et al. (2020b) reconstruct the SFHs of ultramassive (>1011 M⊙) galaxies at 3 < z < 4 and find that the bulk of star formation occurred in the range 4 < z < 6 (≲0.5 Gyr later than the median mass-weighted ages we measure), and the galaxies quenched several hundred Myr later, in some cases as early as z ∼ 4. Besides the difference in parametrization of the SFHs, an alternative explanation for the older ages we find is that it is a result of a lower metallicity in the best-fitting model, since metallicities are strongly degenerate with ages. In fact, as discussed in Appendix B, our metallicities are systematically lower than other studies at intermediate redshifts (e.g. Choi et al. 2014; Estrada-Carpenter et al. 2019; Morishita et al. 2019). An increase in metallicity by a factor of 3 (i.e. +0.5 dex) would decrease the mass-weighted age by ∼0.5 Gyr, which would account for most of the age difference.
There is a stronger age difference between lower and higher mass galaxies at fixed environment than between environments at fixed mass – despite the fact that we find a flatter mass dependence of the SFHs than other studies. For both the cluster and the field populations, the median difference in mass-weighted ages is |${\sim }0.7^{_{+0.3}}_{^{-0.6}}$| Gyr between galaxies of mass 1010–1010.5 and 1011.3–1011.8 M⊙, while the age differences between environments are <0.4 Gyr (see Fig. 8), and are discussed further in the next section. This result is consistent with the results of Saglia et al. (2010) and Woodrum et al. (2017), where both measured the evolution of the M/L ratio between cluster and field galaxies at |$z{\lesssim }0.9$| and z < 1.2, respectively, and found stronger differences between galaxies of different stellar mass than between environments. Similarly, Raichoor et al. (2011) compared ETGs at z ∼ 1.3 to conclude that the age difference between galaxies in cluster and field environments was less significant than between galaxies of different mass.
5.2 Environment-dependent evolution of quiescent galaxies
A number of recent studies find that field galaxies form over longer time-scales than cluster galaxies, however, the exact time-scales have been challenging to robustly quantify. Line strength studies of ETGs at low redshifts find that star formation in low-density environments is delayed by 1–2 Gyr (e.g. Bernardi et al. 1998; Balogh et al. 1999; Thomas et al. 2005; Clemens et al. 2006; Sánchez-Blázquez et al. 2006, see also the review by Renzini 2006). Using the Fundamental Plane, the evolution of the M/L between galaxies at |$z{\lesssim }1.2$| has shown that the slopes are steeper for galaxies in cluster environments, indicating that they formed at slightly higher redshifts than field galaxies (e.g. van Dokkum & van der Marel 2007; Saglia et al. 2010; Woodrum et al. 2017). The M/L evolution can be interpreted as SFHs with models of simple stellar populations (SSPs), taking into account the structural evolution in the size of galaxies (and progenitor bias). van Dokkum & van der Marel (2007) infer that massive galaxies in clusters are ∼0.4 Gyr older than field galaxies, Saglia et al. (2010) estimate a ∼1.6 Gyr age difference, while Woodrum et al. (2017) estimate |${\lesssim }0.3$| Gyr difference for galaxies with low-velocity dispersions but |${\lesssim }$|1 Gyr for high-velocity dispersions. Compared to luminosity-weighted ages derived from Balmer absorption lines, Saglia et al. (2010) find consistent age estimates within their large uncertainties, while Woodrum et al. (2017) find a larger age difference of 1–3 Gyr.
Measuring age differences at low redshifts does not necessarily reflect differences in SFHs at early times, however. Late-stage environmental effects on galaxy evolution (e.g. Thomas et al. 2010), or progenitor effects, can obscure estimates of the ages of the oldest stellar populations; recent star formation can ‘outshine’ older stars making age estimates from the integrated light difficult (Papovich et al. 2001). Moreover, the population of ETGs has been in place since z ∼ 2 (e.g. Bernardi et al. 1998; van Dokkum et al. 2010), where the result is that galaxies older than ∼5 Gyr have similar stellar spectra and are difficult to distinguish (Conroy 2013). In order to explore whether environmental factors affected galaxy formation during the period where the galaxies assembled the majority of their mass requires higher redshift observations.
At z ∼ 1.2, Gobat et al. (2008) measured the ages of ETGs in a massive cluster relative to galaxies in the Great Observatories Origins Deep Survey (GOODS)/Chandra Deep Fields-South (CDF-S) survey via SED fitting photometry and co-added spectroscopy, finding that cluster galaxies formed ∼0.5 Gyr before field galaxies (particularly at <1011 M⊙). On the other hand, for the same cluster Rettura et al. (2010) independently compare the massive ETGs with equivalent galaxies in the GOODS survey, measuring ages from fitting photometry to SEDs (without spectroscopy), and conclude that there is no significant delay in formation epochs between the two environments within the typical uncertainty of ∼0.5 Gyr. Two additional clusters are included in the comparison by Rettura et al. (2011), where again no difference was found in formation times within their average uncertainty, 0.5 Gyr. At z ∼ 1.3, Saracco et al. (2017) compare the median luminosity-weighted ages of elliptical galaxies in three clusters relative to the GOODS, COSMOS, and Cosmic Assembly Near-infrared Deep Extragalactic Legacy Survey (CANDELS) fields. While they find that the structural properties of galaxies in cluster and field environments are consistent at fixed mass, and <1011 M⊙, massive galaxies either assemble ∼0.3 Gyr earlier or assemble more efficiently in clusters.
Our results are fully consistent with these studies. We find that cluster galaxies are on average|$0.31_{^{-0.33}}^{_{+0.51}}$| Gyr older than field galaxies, at fixed stellar mass. While the age difference is largest for galaxies of masses 1010.5–1011.3 M⊙, the age difference is positive (although sometimes consistent with zero) for all mass ranges. This result is robust when carefully removing galaxies that show recent star formation, [O ii] emission, or UVJ colours outside of the red clump (see Section 4.3).
Muzzin et al. (2012) compare Dn(4000) values, as a proxy for stellar age, for quiescent13 galaxies in the GCLASS; a subset of these clusters, and galaxy spectra, is included in GOGREEN. At fixed stellar mass, they find that Dn(4000) is independent of environment except perhaps for their lowest mass galaxies <1010 M⊙. We compare the Dn(4000) of our spectra relative to Muzzin et al. (2012) in Appendix D, where we find modestly larger differences between environments, consistent with our result of a small positive age difference. The GCLASS sample is dominated by z ∼ 0.8 clusters, however, particularly at low stellar masses. Thus, the small difference we observe may be a result of evolution.
An important consideration when comparing to results from the literature is how the lower density sample is defined. Some studies separate galaxies in the cores and outskirts of clusters, or in higher and lower density regions within their sample, or carefully select for galaxies in clusters, groups, or in isolation. Our field sample is selected from the distant foreground and background of our clusters and is therefore expected to be representative of an average patch of our Universe. Comparing galaxies in clusters with those truly isolated in cosmic voids, or exclusively galaxies central to their halo, will likely have a larger contrast in properties than our results. Importantly, the ‘field’ environment may be different at different mass scales; for example, more massive galaxies could be more likely to exist in cosmic overdensities (e.g. groups) than lower mass galaxies. Therefore, the comparison between galaxies of lower stellar masses could reflect different physical factors than between galaxies of higher mass. We leave a comparison of galaxies between different local densities to a future paper.
A second consideration is the selection of quiescent galaxies: several studies classify quiescent galaxies based on morphology, or other star formation tracers than UVJ colours. We do not expect this to significantly impact the relative age measurements, however, as long as the selection is consistent between environments. Saracco et al. (2017) find that at z ∼ 1.3 elliptical galaxies have consistent structure and properties between field and cluster environments, however there are fewer large and massive elliptical galaxies in the field relative to clusters. Such differences between galaxy properties and environment could be important to the quiescent selection in detail.
5.3 Toy models of cluster galaxy evolution
It is well established that at low redshifts the fraction of quiescent galaxies are higher in denser environments (e.g. Baldry et al. 2006). Several studies also find a higher fraction of low-mass quiescent galaxies in denser environments (e.g. Muzzin et al. 2012; Woo et al. 2013). Peng et al. (2010) suggested that these two observations are consistent if galaxies in dense environments are subject to extra ‘environmental quenching’ that is independent of stellar mass, in addition to mass-dependent ‘self-quenching’.
At z ≳ 1 the situation is very different. While there is still an excess of quiescent galaxies in dense environments, the SMFs of quiescent galaxies are consistent between low- and high-density environments (Nantais et al. 2016; van der Burg et al. 2020). Moreover, the shapes of the SMFs for star-forming galaxies are also the same between cluster and field. We add to this picture the fact that there is a small, positive age difference between quiescent cluster and field galaxies. This is difficult to reconcile with the hypothesis that the higher fractions of quenched galaxies in galaxy clusters at this epoch result from the transformation of recently accreted star-forming galaxies.
We first consider whether a simple infall-based quenching model can be simultaneously compatible with both our measured average age difference, and the quenched fractions in cluster and field environments measured by van der Burg et al. (2020). We then consider an alternative model where cluster galaxies formed earlier than field galaxies, and infall-driven quenching is negligible.
In order to determine the mass-weighted age evolution we need a prediction of the average SFH of star-forming galaxies; we assume the SFRs evolve as defined in Schreiber et al. (2015), and that the star formation is instantaneously truncated when the galaxy is ‘quenched’. We compare galaxies with final stellar masses in the range 109.5−1011.5 M⊙. As we are only interested in modelling the global properties of ‘average’ galaxies, we ignore any mass dependence in the data. Therefore we model the self-quenching efficiency using the same form as proposed by Peng et al. (2010) (i.e. η ∝ SFR/M*) using the SFR for an M* = 1010.8 M⊙ galaxy. Given that van der Burg et al. (2020) find the SMFs between star-forming cluster and field populations to have the same shape, we require that the star-forming SMFs in our model similarly do not evolve. Our toy model consists of tracking the number of star-forming and quiescent galaxies from z = 10 (when cluster galaxies are assumed to form) to z = 1.2.14
We acknowledge that this is a simple assumption for the evolution of field galaxies and may not be realistic (e.g. Dressler et al. 2013; Gladders et al. 2013; Schawinski et al. 2014). However, it serves as a useful starting point that characterizes the overall growth in the quiescent population with time. In future work we will consider more sophisticated models, in light of all the available GOGREEN data.
5.3.1 Post-infall environmental quenching and pre-processing
For the infall-based quenching model we assume that all galaxies are subject to self-quenching, while in addition star-forming galaxies that join clusters quench at a given time after infall (tdelay). The infall rate we assume follows the predictions of McGee et al. (2009) for time-scales of galaxies becoming satellites of larger haloes (>1013 M⊙), based on the Millennium Simulation (Springel 2005) with additional prescriptions for halo assembly via merger trees (Helly et al. 2003; Harker et al. 2006) and using the semi-analytic models of Bower et al. (2006).15 This predicts that the rate at which galaxies join larger haloes is effectively constant in time. There are then two parameters in this model that determine the relative populations of star-forming/quiescent and field/cluster galaxies: the normalization of the self-quenching efficiency, and tdelay. Both of these parameters are constrained by observations of the quenched fractions at our fiducial stellar mass, measured for the GOGREEN sample to be |${f}_{\mathrm{Q,\, field}}(z=1.2)=0.3$| and |${f}_{\mathrm{Q,\, cluster}}(z=1.2)=0.65$| (van der Burg et al. 2020). The self-quenching efficiency drives the quenched fraction in the field, while the delay time determines the additional quenching in clusters. We find that a delay time of tdelay ∼ 2.4 Gyr is required to match the observed quenched fractions. This is somewhat longer than expected from dynamical time-scales at this redshift (e.g. Balogh et al. 2016); we caution that our toy model is merely illustrative (we ignore mass dependence and the mass-quenching rate is somewhat arbitrary), and this discrepancy does not significantly affect our conclusions here.
An important consequence of post-infall environmental quenching models is that quiescent galaxies in the field would be on average older than quiescent galaxies in clusters at fixed mass (by |$1.5^{_{+1.3}}_{^{-0.2}}$| Gyr given the tdelay and quenched fractions listed above). This is because the rate that recently quenched galaxies are added to the quiescent population is higher at later times in the cluster, such that the overall population is younger. As we have constructed our model, environmental quenching is stronger at later times (e.g. Nantais et al. 2017), while self-quenching dominates at early times. Muzzin et al. (2012) come to a similar conclusion modelling the evolution of Dn(4000) for early-self-quenching late-environmental-quenching-dominated efficiencies. Given that we find a small, but significant, average age difference between field and cluster galaxies in the opposite sense, we can exclude this model even for delay times approaching the age of our Universe.
One important simplification of this infall-based quenching model is that we have neglected the role of pre-possessing in the field population. That is, galaxies that quenched in locally overdense clumps (i.e. groups or filaments) prior to joining clusters (e.g. Dressler 1980; Fujita 2004; Moran et al. 2007). The infall rate we use predicts the number of galaxies that become satellites of haloes with masses >1013 M⊙ within a given time, and we have considered all such structures ‘clusters’ when realistically some fraction makes up the ‘field’. Secondly, some fraction of these pre-processed groups will eventually accrete on to clusters. McGee et al. (2009)’s model predicts that at z = 1.5 around 20 per cent of galaxies were in haloes of mass 1013–1014 M⊙ h−1 prior to becoming a member of their final halo. Along the same lines, Poggianti et al. (2006) use the fraction of cluster galaxies with [O ii] emission to constrain the fraction of galaxies that were ‘primordially quenched’ at high redshifts, or experienced environmental quenching in haloes above 1014 M⊙. They find that z ∼ 1.5 marks a turnover between these two populations, where only galaxies in haloes with high-velocity dispersions have appreciable numbers of ‘quenched’ galaxies. De Lucia et al. (2012) build on the model of McGee et al. (2009) to show that the accretion history of satellites on to clusters is stellar mass dependent, where lower stellar mass galaxies are more likely to be satellite of a smaller structure when joining a cluster. Moreover, if the groups that accrete on to clusters represent a biased sample (e.g. the oldest groups) this would make the cluster quenched population older on average, and the field younger. In this scenario it is no longer clear that the field quenched population is necessarily older than quiescent cluster galaxies. The exact age differences are difficult to predict, however, as they depend on the distribution of galaxies in groups between field and cluster environments. Lastly, even considering the fact that some galaxies may be part of smaller substructures prior to joining clusters, whether or not they are quenched in such environments likely depends on the halo mass and how long they have been satellites. If the dominant environmental-quenching processes are only relevant over long time-scales, the effect of pre-processing at high redshifts may not be significant. We leave a more complete analysis to a future paper.
5.3.2 Delayed formation of field galaxies
Motivated by this challenge for the simplistic post-infall quenching model to explain our results, we now turn to a model where the self-quenching of cluster galaxies gets a head start relative to the average field. Fig. 11 illustrates this toy model of delayed formation times between cluster and field galaxies. Here the only quenching is self-quenching, which is shown in the top row for cluster galaxies (thin black line, starting at z = 10) normalized such that |${f}_{\mathrm{Q,\, cluster}}(z=1.2)=0.65$|, and for the field galaxies (coloured dashed lines). Galaxies in the two environments quench through the same processes; however, field galaxies form and quench later, starting at a time offset from the cluster, labelled as tΔ.16 For the four delay times, (tΔ = 0.25, 0.5, 1, and 2 Gyr), the difference in quenched fractions between cluster and field galaxies, ΔfQ, and the median cumulative mass-weighted age difference, Δtmw, are calculated and shown in the second and third plots, respectively. The error bars on Δtmw correspond to the 68 per cent region of the age comparison, and the grey region indicates the measured age difference discussed in Section 4.2.
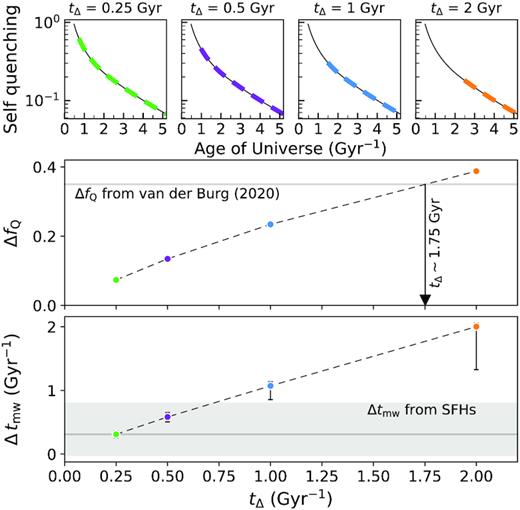
Toy model of the expected difference in quenched fractions and tmw given an offset in the formation of the field population of |$t_\Delta$|. Top: quenching rate for four values of tΔ: 0.25, 0.5, 1, and 2 Gyr. The cluster quenching rate is shown as a black line starting at zform = 10, and field quenching rate as a coloured (according to tΔ) dashed line. Middle: the difference in quenched fractions, ΔfQ, for fixed stellar mass at z = 1.2, for the four tΔ models shown. Larger offsets in the formation of field galaxies correspond to larger ΔfQ. A horizontal line indicates the measured difference in quenched fractions from van der Burg et al. (2020). Bottom: average difference in cumulative tmw distributions, Δtmw, between field and cluster galaxies, with error bars indicating the 68 per cent spread. The grey shaded region indicates the measured average age difference, see Section 4.2. Larger offsets in the formation of field galaxies correspond to larger Δtmw. In the context of this simple model, tΔ < 0.75 Gyr is consistent with our observations, but is inconsistent with the time derived by the difference in quenched fractions.
Fig. 11 shows that any delay time ≳1 Gyr would result in a mass-weighted age difference that is excluded by our data. To match the observed ΔfQ ∼ 0.35, however, would require tΔ ∼ 1.75 Gyr in our simple model. This is larger than the delay in formation time predicted to match the quenched fractions in the toy model of van der Burg et al. (2020) of ∼1 Gyr, which likely is due to different assumptions of the growth of the SMF and mass-dependent self-quenching. In either model, such a long formation delay time would result in a mass-weighted aged difference of >1 Gyr, strongly excluded by our observations.
Neither the simple post-infall environment quenching model nor the delayed-formation model can fully explain the difference in galaxy properties between high- and low-density environments at z = 1. In principle a combination of the two models can, even without pre-processing. For example, with a delay between infall and environmental quenching of ∼2.8 Gyr (which is still long), and delaying the formation of field galaxies by 1 Gyr relative to cluster galaxies, this simple model can simultaneously match both the observed quenched fraction and age difference. Before concluding that such a hybrid model is successful, however, it will be important to test the stellar mass and halo mass dependence of the predictions. We leave this work to a future paper.
6 CONCLUSIONS
In this work, we determined the SFHs for 331 quiescent galaxies in 11 GOGREEN clusters and field galaxies at 1 < z < 1.5 based on rest-frame optical spectroscopy and multiband photometry fit to SED templates with the Bayesian inference code prospector. The following summarizes our comparison of the quiescent field and cluster galaxies.
Comparing SFHs between galaxies of different mass we found that more massive galaxies form earlier, and over shorter time-scales, than lower mass galaxies (see Section 4.1 and the bottom row of Fig. 5). This picture is consistent with the ‘mass-dependent evolution’ scenario. Comparing SFHs between galaxies in cluster and field environments, we conclude that below 1011.3 M⊙ the SFRs declined earlier and more rapidly for galaxies in denser environments, at fixed mass (see the right-hand column of Fig. 5).
From the SFHs we calculate posteriors for mass-weighted ages for each galaxy, shown in Fig. 6 relative to stellar mass. Overall, 90 per cent of all galaxies have formed half their stellar mass by z ∼ 2.2. The majority (>50 per cent) of galaxies with masses 1011.3–1011.8 M⊙ have formed at least half of their stellar mass by z ∼ 5.4, while the same is true for galaxies with masses 1010–1010.5 M⊙ at z ∼ 3.4. The formation times we estimate are older than similar ages in the literature; this may be a consequence of the age–metallicity degeneracy and the fact that our fits prefer somewhat lower metallicities than other studies (see discussion in Section 5.2). Future telescopes, such as the James Webb Space Telescope (JWST), can directly observe galaxies at these redshifts and will be able to confirm our predictions.
We compare the mass-weighted ages for galaxies of similar stellar mass between the two environments (see Fig. 7). The distribution of ages for field galaxies is broader than for cluster galaxies, where the field population has a higher relative fraction of young galaxies. As a result, the mass-weighted age difference between field and cluster galaxies with stellar masses between 1010 and 1011.8 M⊙ is within |$0.31_{^{-0.33}}^{_{+0.51}}$| Gyr, in the sense that cluster galaxies are older on average. This result holds when we exclude galaxies that have formed more than 10 per cent of the stellar mass within the last 1 Gyr, have significant [O ii] emission, or have UVJ colours closer to the star formation population (see discussion in Section 4.3).
We consider two simple models consistent with the higher fraction of quenched galaxies in clusters, and show neither one is consistent with our age measurements. If the environmentally quenched population is built up entirely through post-infall quenching processes (without pre-processing), we predict field galaxies would be older than cluster galaxies – in contrast to our results. On the other hand, if quenching in cluster environments gets a head start, this needs to be >1 Gyr to explain the difference in quenched fraction, which results in an average mass-weighted age difference that is much larger than we observe.
This work builds on previous evidence (Balogh et al. 2016; van der Burg et al. 2020) that the substantial quenched population in galaxy clusters at z > 1 has been built up in a fundamentally different way from clusters at z = 0. In particular, the infall-based environmental quenching models of Peng et al. (2010), Wetzel, Tinker & Conroy (2012), and others, which are so successful at matching local observations, are not able to account for the properties of the GOGREEN cluster sample. The data seem to require that a substantial population of protocluster galaxies are quenched at early times, z > 3, via a process that is accelerated but otherwise indistinguishable from the mass quenching that affects all galaxies. Evidence of quenched populations of massive galaxies at this epoch is growing (e.g. Glazebrook et al. 2017; Schreiber et al. 2018a; Tanaka et al. 2019, 2020; Forrest et al. 2020a, 2020b; Valentino et al. 2020; McConachie et al., in preparation). Environmental quenching must still play a role, but it may only become dominant at z < 1. In future work, we will use the stellar mass and halo mass dependence of these observations to further constrain these toy models; comparison with simulations and semi-analytic models will be important to help identify the physical origin of the quenching mechanisms postulated here (e.g. Kukstas et al., in preparation). Finally, these data indicate that much of the quenching activity responsible for building up galaxy clusters occurred in the protocluster environment at z > 3; data from JWST will be crucial for understanding the nature and cause of this phenomenon.
ACKNOWLEDGEMENTS
We thank the native Hawaiians for the use of Mauna Kea, as observations from Gemini, CFHT, and Subaru were all used as part of our survey. We acknowledge the helpful advice from the referee.
This research is supported by the following grants: National Sciences and Engineering Research Council of Canada (NSERC) CGS-D award (KW), Discovery grants (MLB and AM), and USRA award (KB); European Space Agency (ESA) Research Fellowship (LJO); National Science Foundation (NSF) grants AST-1517863 (GW), AST-1517815 (GR); NASA, through grants GO-15294 (GW), GO-15294.012-A (GR), and the Astrophysics Data Analysis Program (ADAP) 80NSSC17K0019 (GW) and 80NSSC19K0592 (GR). JN acknowledges support from the UNAB Internal Project number DI-12-19/R. BV acknowledges financial contribution from the grant PRIN MIUR 2017 n.20173ML3WW_001 (PI: Cimatti) and from the INAF main-stream funding programme (PI: Vulcani). RD gratefully acknowledges support from the Chilean Centro de Excelencia en Astrofísica y Tecnologías Afines (CATA) BASAL grant AFB-170002. PC acknowledges the support from the ALMA-CONICYT grant no 31180051. Support for program number GO-15294 was provided by NASA through a grant from the Space Telescope Science Institute, which is operated by the Association of Universities for Research in Astronomy, Incorporated, under NASA contract NAS5-26555. GR also acknowledges the support of the International Space Sciences Institute for sponsoring a team meeting and for the European Southern Observatory for supporting him with a visiting fellowship for summer research. This work was made possible by the facilities of the Shared Hierarchical Academic Research Computing Network (SHARCNET:="http://www.sharcnet.ca) and Compute/Calcul Canada.
This paper includes data gathered with the Gemini Observatory, which is operated by the Association of Universities for Research in Astronomy, Inc., under a cooperative agreement with the NSF on behalf of the Gemini partnership: the National Science Foundation (USA), the National Research Council (Canada), CONICYT (Chile), Ministerio de Ciencia, Tecnologa e Innovacin Productiva (Argentina), and Ministrio da Cilncia, Tecnologia e Inovao (Brazil); the 6.5-m Magellan Telescopes located at Las Campanas Observatory, Chile; the Canada–France–Hawaii Telescope (CFHT), which is operated by the National Research Council of Canada, the Institut National des Sciences de l’Univers of the Centre National de la Recherche Scientifique of France, and the University of Hawaii; MegaPrime/MegaCam, a joint project of CFHT and CEA/DAPNIA; Subaru Telescope, which is operated by the National Astronomical Observatory of Japan; and the ESO Telescopes at the La Silla Paranal Observatory under programme ID 097.A-0734. This work was based on data products from observations made with ESO Telescopes at the La Silla Paranal Observatory under ESO programme ID 179.A-2005 and on data products produced by CALET and the Cambridge Astronomy Survey Unit on behalf of the UltraVISTA consortium. This work made use of prospector (Leja et al. 2017; Johnson et al. 2019), python-fsps (Foreman-Mackey et al. 2013), fsps (Conroy & Gunn 2010), astropy (The Astropy Collaboration 2013, 2018), matplotlib (Hunter 2007), scipy (Virtanen et al. 2020), ipython (Pérez & Granger 2007), numpy (van der Walt, Colbert & Varoquaux 2011), pandas (McKinney 2010), and emcee (Foreman-Mackey et al. 2013).
DATA AVAILABILITY
The data underlying this paper are available from the Canadian Advanced Network for Astronomical Research (CANFAR), at https://www.canfar.net/citation/landing?doi=20.0009, DOI:10.11570/20.0009. The GOGREEN Public Data Release 1 (DR1) is available at https://www.canfar.net/storage/list/GOGREEN/DR1, as described in Balogh et al. (2020). More information on this release is available at http://gogreensurvey.ca/data-releases/data-packages/gogreen-and-gclass-first-data-release/.
Footnotes
iraf is distributed by the National Optical Astronomy Observatories, which are operated by the Association of Universities for Research in Astronomy, Inc., under cooperative agreement with the National Science Foundation.
Program ID: 097.A-0734.
Non-parametric here means that the SFH has no specified functional form.
Relative with respect to adjacent bins. For N age bins, there are therefore N − 1 free parameters; see Table 2.
Convergence tests with some representative galaxies demonstrated that 10 bins provide sufficient time resolution, while limiting the number of free parameters in the fitting procedure and the corresponding computational time.
fsps calculates tmw when compute_light_ages = True.
prospector-α uses the prospector framework, but includes additional parameters (such as dust emission, nebular emission, and AGN emission).
This toy model is qualitatively different than the mass-quenching model proposed by Peng et al. (2010), or as implemented by van der Burg et al. (2020). Furthermore, we neglect mergers. Including mergers, however, would only enhance the different galaxy properties between cluster and field environments.
With updated modelling of strangulation, as per Font et al. (2008).
We note that in the simple model of Peng et al. (2010, their section 6) the formation of field galaxies is delayed ∼1 Gyr (zform = 4).
REFERENCES
APPENDIX A: QUIESCENT INDICATORS
In this work, we selected quiescent galaxies by their position in rest-frame UVJ colour space. However, there are several other tracers of SFR that could have been used instead. The Dn(4000) has been used as a proxy for the age of a stellar population (Balogh et al. 1999; Kauffmann et al. 2003; Muzzin et al. 2012) as the strength of the break increases with the fraction of old stars (but also with metallicity). The flux of the [O ii] emission line is sensitive to recent excitations in the ISM from young stars – although indirectly, and is also dependent on the metallicity of the gas. Galaxies selected by each tracer as quiescent are shown in the UVJ plane in Fig. A1. The first columns show the 2D histograms of the GOGREEN spectroscopic sample in UVJ colour space, with galaxies in clusters shown in the first row and galaxies in the field in the second row. The separation of quiescent and star-forming galaxies is shown as a black line.
![2D histograms of the spectroscopic sample in UVJ colour space. The selection criteria of UVJ quiescent galaxies is shown as a black line with arrows indicating the region of quiescent (red) or star-forming (blue) galaxies. In the top (bottom) row, the cluster (field) galaxies are shown. The middle column compares the UVJ selection against Dn(4000) > 1.4, where the Dn(4000) threshold was chosen based on the bimodality of the UVJ selection relative to Dn(4000) shown in the inset histogram. The right-hand column compares the UVJ selection against EW([O ii]) + σEW < 5 Å, where the threshold was chosen based on the bimodality of the UVJ selection relative to EW([O ii]) shown in the inset histogram. This comparison shows that for our sample, UVJ colours are broadly consistent with both Dn(4000) and EW([O ii]) tracers for quiescent galaxies.](https://oup.silverchair-cdn.com/oup/backfile/Content_public/Journal/mnras/498/4/10.1093_mnras_staa2752/1/m_staa2752figa1.jpeg?Expires=1750565585&Signature=LVvzPgmYfOehmkx7elHmnr9Ami658Rt7ieh77xN0ZUZJxvXsjqVdjFHLbQOvZn2DNg28yiG5Ma7FwwclNz9i~mFkKbiqM5Dk6sjMGYHVvVJzFWetTVRQeZvGbzqg7w-QWqf95o6wVglyMahfTVX1JJn4yC20pWCRpYodNWTGyevCOb--jY2VPZSYIZb3zZexScsy65zHigGgaia2rifVnfFhgkJ8THYIxizuuWJb01hjMvg3K5Iyz19y5jr9mPoxa5qV7b0Z~DONIFQHvyBHdej1n89x5MecbQQ5x7hUAIvkl-eUSzyIS~cE6ozfDH4fPNrNsWKWXuRjXDX8f8rFoQ__&Key-Pair-Id=APKAIE5G5CRDK6RD3PGA)
2D histograms of the spectroscopic sample in UVJ colour space. The selection criteria of UVJ quiescent galaxies is shown as a black line with arrows indicating the region of quiescent (red) or star-forming (blue) galaxies. In the top (bottom) row, the cluster (field) galaxies are shown. The middle column compares the UVJ selection against Dn(4000) > 1.4, where the Dn(4000) threshold was chosen based on the bimodality of the UVJ selection relative to Dn(4000) shown in the inset histogram. The right-hand column compares the UVJ selection against EW([O ii]) + σEW < 5 Å, where the threshold was chosen based on the bimodality of the UVJ selection relative to EW([O ii]) shown in the inset histogram. This comparison shows that for our sample, UVJ colours are broadly consistent with both Dn(4000) and EW([O ii]) tracers for quiescent galaxies.
The positions of galaxies in UVJ colour space are then shown for galaxies that satisfy alternative indicators of passive evolution: Dn(4000) > 1.4 in the middle column, and EW([O ii]) + σEW < 5 Å in the right-hand column. Among the cluster galaxies, the highest density of galaxies selected by Dn(4000) or [O ii] is predominantly in the UVJ-quiescent region. A much larger fraction of the ‘quenched’ galaxies in the field are UVJstar forming.
The distribution of UVJquiescent (red) or UVJstar forming (blue) according to Dn(4000) (EW([O ii])) is shown in the inset histogram in the second (third) columns. The selection of quiescent galaxies from Dn(4000) or EW([O ii]) is determined by the break in the UVJquiescent and UVJstar-forming distributions, corresponding to Dn(4000) ∼ 1.4 and EW([O ii]) + σEW < 5 Å. Both Dn(4000) and [O ii] emission select the majority of the UVJ-selected quiescent sample – 79 per cent and 63 per cent, respectively. While only 32 per cent (24 per cent) are UVJ quiescent among the Dn(4000) quiescent ([O ii] quiescent), the contamination of UVJ star-forming galaxies is only 13 per cent (3 per cent). This brief comparison shows that these tracers are broadly consistent, and using Dn(4000) or EW([O ii]) instead to select quiescent galaxies would not qualitatively change our conclusions.
APPENDIX B: MASS–METALLICITY RELATION
Stellar mass, dust, and metallicity are correlated throughout a galaxy’s evolution, and the relation between the two has been well studied in the local Universe (Tremonti et al. 2004; Gallazzi et al. 2005, 2014; Panter et al. 2008; Choi et al. 2014). Observables used to estimate the ages of stellar populations, such as colours and spectral lines, can be strongly degenerate with dust and metallicity. Understanding such degeneracies at z > 1 is challenging, especially given that most studies are limited to small numbers of massive galaxies (Onodera et al. 2012, 2015; Newman et al. 2014; Kriek et al. 2016; Lee-Brown et al. 2017; Morishita et al. 2018, 2019; Estrada-Carpenter et al. 2019). Moreover, without high-resolution spectroscopy it is difficult to accurately model the complex behaviour of these parameters. Given the limited wavelength coverage in our spectra, and typically low SNR, we do not tightly constrain metallicity in our fits; however, it is important to consider the average metallicity we fit, as a function of mass and environment, because of its degeneracy with age. For instance, we find that a difference in metallicity of a factor of 3 (∼0.5 dex) can change the mass-weighted age estimate by ∼0.5 Gyr.
The mist isochrones cover an extended range of metallicities (−4 < [Z/H] < 0.5), while the miles templates are limited to [Z/H] < 0.19. We also impose an additional limit of [Z/H] > −2 to avoid extrapolating the templates to less well-constrained parameter space. Although updated isochrones libraries include variation of α-abundances, the current version of fsps includes only scaled-solar abundances. Studies of high SNR spectra of passive galaxies show that [α/Fe] scales with galaxy properties (e.g. velocity dispersion, stellar mass), and a number of old massive galaxies with supersolar α-abundances have been discovered (Thomas et al. 2005; Conroy, Graves & van Dokkum 2013; Choi et al. 2014; Onodera et al. 2015; Kriek et al. 2016, 2019; Jørgensen et al. 2017, 2018). Underestimating α-abundance affects the slope of the UV–NIR continuum, where Vazdekis et al. (2015) show differences of 10 per cent in optical colours, or 40 per cent in flux within a bandpass, between solar [α/Fe] and +0.4 albeit for galaxies much older than included in our study.
We explored the sensitivity of the metallicity measurements in our fits through the stellar mass–metallicity relation (MZR) and relative to the diffuse dust optical depth. Fig. B1 shows the posteriors of metallicity and dust (left) and stellar masses (right) for the galaxies in our sample, with circles showing the medians of individual posteriors. The GOGREEN measurements are shown relative to the local (field) relation for quiescent SDSS galaxies from Gallazzi et al. (2005), marked as cyan lines corresponding to the 16th and 84th percentiles of the reported trend. Note that this relation was used as a prior in our fitting procedure. We also include the z ∼ 0.7 MZR for quiescent galaxies from Gallazzi et al. (2014) as a blue region. The MZR for quiescent galaxies reported by Choi et al. (2014) at 0.4 < z < 0.55 is shown as pink points, and 0.55 < z < 0.7 as black points with pink error bars. Lastly, we show the |$1 \sigma$| region of individual measurements of 1.6 < z < 2.5 massive galaxies from Morishita et al. (2019) as green boxes. Gallazzi et al. (2005, 2014) and Choi et al. (2014) data are shown corrected for differences in stellar mass estimates (i.e. +0.2 dex, see Appendix C), but not corrected for differences in definitions of solar metallicity or α-abundance. Choi et al. (2014) incorporated α-abundance corrections in their continuum-normalized spectral fitting. Morishita et al. (2019) used a higher limit on metallicity, as they use the updated mist isochrones that extend to [Z/H] < 0.5.
Metallicity as a function of diffuse dust optical depth (left) and stellar mass (right) for the GOGREEN UVJ-quiescent sample. A dashed line indicates solar metallicity, and a solid line indicates the maximum metallicity allowed by the miles spectral templates. The local mass–metallicity relation (MZR) for ETGs from Gallazzi et al. (2004) at |$z \lesssim 0.22$| is shown with two cyan lines indicating the lower and upper limits of the reported 68 per cent confidence region. This relation was used as a prior in our SFH fitting procedure. The MZR for z ∼ 0.7 quiescent galaxies is shown as a blue line with a shaded region indicating the uncertainty region, from Gallazzi et al. (2014). A selection of moderate-redshift quiescent galaxies at 0.4 < z < 0.55 and 0.55 < z < 0.7 from full continuum-normalized spectral fits from Choi et al. (2014) are shown, without correction for differences in α-abundance. A high-redshift sample of massive quiescent galaxies from Morishita et al. (2019) is also included, shown in green. Daggers denote where data have been adapted from the relevant study to compensate for difference in stellar mass estimates. The colour scale shows the density of the combined posteriors in the GOGREEN data, with white circles indicating the median values of the individual posteriors.
We note that these studies all use different methodologies: Gallazzi et al. (2005, 2014) relied on line indices, Choi et al. (2014) use full spectrum SPS modelling for continuum-corrected co-added spectra, while Morishita et al. (2019) use full spectrum SPS modelling of spectroscopy and photometry, more similar to our own procedure. Although not shown in Fig. B1, Leethochawalit et al. (2018) study the MZR with respect to [Fe/H] for quiescent galaxies at z ∼ 0.4 using spectral modelling, and recover values consistent with the highest density (purple) region in our plot (see their fig. 7). Interestingly, Kriek et al. (2019) measure the metallicity of three massive quiescent galaxies at z ∼ 1.4, using high-resolution spectroscopy to measure absorption lines, and find that the [Fe/H] values are ∼0.2 dex lower than the z < 0.7 relation. Jørgensen et al. (2007) similarly find evidence of evolution of cluster galaxies since z ∼ 1. On the other hand, Onodera et al. (2015) find the [Z/H] of 24 massive quiescent galaxies at z ∼ 1.6 to be well in line with the local relation, based on a similar line index analysis.
While our metallicities are lower than reported by similar studies, as long as the MZR does not have a strong environmental dependence, the relative comparison of cluster and field galaxy ages will not be sensitive to our model metallicities. Indeed, we find no difference in the MZR between field and cluster galaxies from our fits. Peng, Maiolino & Cochrane (2015) compared the stellar metallicities of galaxies in SDSS, and found no significant difference between satellite and central galaxies above 1010 M⊙. Tangentially, Maier et al. (2016) measured enhanced gas-phase metallicities of accreted star-forming cluster galaxies relative to comparable field galaxies at z ∼ 0.4 for <1010.5 M⊙, but no significant difference at higher masses.
As mentioned above, there is a degeneracy between age, metallicity, and dust. For completeness we show the combined posteriors of metallicity and the diffuse dust optical depth in the left-hand plot of Fig. B1. The majority of galaxies have very little dust, τλ, 2 < 0.5, even the galaxies with very low metallicities. This perhaps suggests that the dust model we have assumed (i.e. Milky Way extinction curve; Cardelli et al. 1989) is insufficient.
APPENDIX C: PROSPECTOR NON-PARAMETRIC VERSUS fast PARAMETRIC MODELS
We confirm the systematic offset between parametric SFH derived stellar masses using fast (Kriek et al. 2009) with non-parametric SFH derived stellar masses using prospector reported by other studies (e.g. Leja et al. 2019b). Our comparison is shown in Fig. C1, where non-parametric SFH masses are on average 1.6× (0.2 dex) higher. Stellar masses were derived with fast for the same SFH as was used to measure the rest-frame colours with ezgal (see Section 2.3 – a declining exponential SFR). The Subaru–XMM Deep Field (SXDF) galaxies are marked as yellow diamonds in Fig. C1 as their fiducial masses were not derived from fast but from similar template fitting with Bruzual & Charlot (2003) models described in Mehta et al. (2018). The stellar masses used in Old et al. (2020) and van der Burg et al. (2020), as well as in the upcoming data release (Balogh et al. 2020), are based on fast masses, and therefore will differ from the stellar masses in this paper.
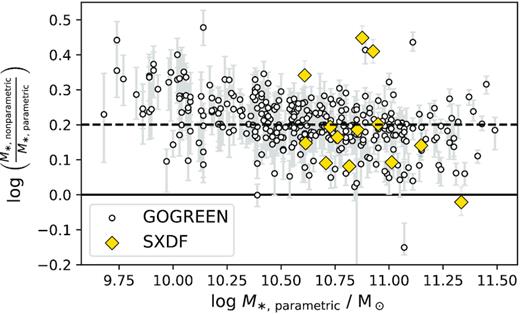
Comparison of fast (parametric) and prospector (non-parametric) derived stellar masses. We confirm the systematic offset reported by Leja et al. (2019b) that non-parametric SFHs yield larger masses, by ∼0.2 dex (shown as a dashed line), with a mild mass dependence. Yellow diamonds indicate SXDF galaxies that have parametric stellar masses from Mehta et al. (2018).
APPENDIX D: AVERAGE SPECTRAL CHARACTERISTICS
In this paper, we have measured galaxy properties on individual galaxies, and then considered the statistics of those measurements. A common alternative in the literature is to combine the data to create an average spectrum/SED, and measure physical parameters from that. As the parameters are non-linearly related to SED shape, these two approaches do not necessarily give the same result.
Fig. D1 shows co-added spectra of cluster galaxies and field galaxies in our sample, each separated into three stellar mass subsamples. Before stacking, the spectra were redshift corrected, binned to a common wavelength sampling, and flux normalized at 4120 Å. Spectra within a given stellar mass and environment subsample were then averaged and bootstrap sampled to determine the uncertainty. Combined galaxies within clusters are shown in orange, and within the field in blue, where the number of contributing galaxies to each spectrum is labelled on the left.
![Combined spectra of quiescent galaxies within mass and environment selections, shown within the wavelength region included in the SFH fitting procedure. The spectra in each subsample were deredshifted, rebinned to a common wavelength sampling, flux normalized about 4120 Å, and then averaged. The uncertainty in the co-added spectra was determined from bootstrapping. Prominent spectral features are labelled on the top axis, and number of galaxies in each co-add are indicated on the left. An alternative to fitting the spectroscopy for individual galaxies and combined the posteriors (as we did in this paper), a common alternative is to combine the data to create an average spectrum/SED, and measure physical parameters from that. While these two approaches do not necessarily give the same result, we qualitatively confirm the similarities between spectra of galaxies of equivalent mass with some exceptions: field galaxies have stronger [O ii] emission, cluster galaxies have slightly stronger Hδ absorption.](https://oup.silverchair-cdn.com/oup/backfile/Content_public/Journal/mnras/498/4/10.1093_mnras_staa2752/1/m_staa2752figd1.jpeg?Expires=1750565585&Signature=BPSTE-CAeHqxsydoJJqML2yUG3-rG4i872gyIE0ScvhfqRj9lEoNfTJTgUK9dOy-C~9A4Fi10V4X8OOw9Cdpxo6Tl~e3lCJPX001yEtNQT5u0z-xMeyn9bNE24tidsc3TPZMcCaha4rp2HeJvwjiBHUIum53TfNqUMbLSJrHowkMlMfg680DyfDyTSos8Ls9~mHw4YW2xdkBsSmzOGhFmfeGnMFtQuc-TnhmN3KIx3IVGQxa6Mm9rke7uyOOuoSf9JQx~nh-kzf1LK4NmJpV42ac3~wH6E8C7e99J8774AWEdqtbtCdxWAMK-Q2bd8tVFqhmOzHWhEMnjakUhA4vbA__&Key-Pair-Id=APKAIE5G5CRDK6RD3PGA)
Combined spectra of quiescent galaxies within mass and environment selections, shown within the wavelength region included in the SFH fitting procedure. The spectra in each subsample were deredshifted, rebinned to a common wavelength sampling, flux normalized about 4120 Å, and then averaged. The uncertainty in the co-added spectra was determined from bootstrapping. Prominent spectral features are labelled on the top axis, and number of galaxies in each co-add are indicated on the left. An alternative to fitting the spectroscopy for individual galaxies and combined the posteriors (as we did in this paper), a common alternative is to combine the data to create an average spectrum/SED, and measure physical parameters from that. While these two approaches do not necessarily give the same result, we qualitatively confirm the similarities between spectra of galaxies of equivalent mass with some exceptions: field galaxies have stronger [O ii] emission, cluster galaxies have slightly stronger Hδ absorption.
The average cluster and field spectra appear very similar overall, with only a few apparent differences. The field population has more prominent [O ii] emission at lower masses, while the cluster galaxies have stronger [O ii] emission at higher masses (although much weaker than in the field). This is likely related to the fact that [O ii] is not strictly related to recent star formation (e.g. from AGN and/or LINER; Yan et al. 2006; Heckman 2009; Singh et al. 2013). On the other hand, absorption lines from Hδ appear stronger for cluster galaxies (except at the lowest stellar masses) suggesting that the cluster galaxies experienced, on average, more recent star formation.
Dn(4000) is commonly used as an age indicator (e.g. Balogh et al. 1999; Kauffmann et al. 2003; Muzzin et al. 2012), because it is insensitive to dust and, as a relatively wide feature, can be measured at high SNR relative to other indices. Dn(4000) is not sensitive to the SFH, however; a galaxy that quenched rapidly and one that quenched slowly can have the same Dn(4000), depending on the relative timing of the quenching. Less apparent from the co-added spectra (and only statistically significant for the moderate-mass galaxies) is that the field spectra have smaller Dn(4000) than cluster galaxies. A comparison is shown in Fig. D2for different mass selections than for the co-added spectra shown in Fig. D1, relative to values measured for galaxies in the GCLASS (Muzzin et al. 2012, averaged over radial bins – see their table 5). We note that the GCLASS sample in the range 1 < z < 1.5 is included in our GOGREEN sample. We increase the reported GCLASS masses and mass selections by 0.2 dex to account for differences in how the stellar masses were estimated; see the discussion in Appendix C: log M*/M|$_{\odot}\, \in$| [9.45, 10.15), [10.15, 10.85), and [10.85, 12.15). Black error bars indicate the uncertainties of the Dn(4000) measurements from the combined spectra, while cyan error bars indicate the systematic uncertainty due to how the spectra are combined (i.e. inverse-weighted averaged, or median combined).
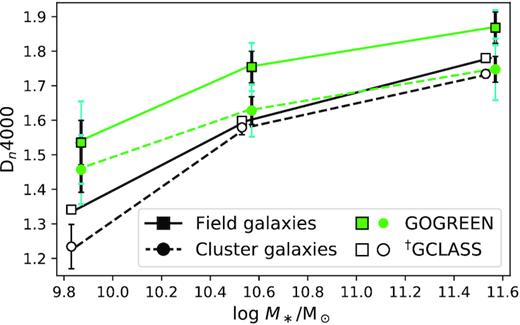
Dn(4000) of averaged spectra as a function of stellar mass, relative to equivalent results from GCLASS (Muzzin et al. 2012) – not the same mass binning as used throughout the paper or the co-added spectra shown in Fig. D1. Masses selected within bins of log M*/M⊙ ∈ [9.45, 10.15), [10.15, 10.85), and [10.85, 12.15) where a 0.2 dex offset was applied to the selection of Muzzin et al. (2012) based on the difference in mass measurement techniques (see Appendix C). Points are shown slightly offset for clarity. Cluster galaxy values are marked with circles, field galaxy values with squares. Green colours mark measurements with GOGREEN, with black error bars corresponding the uncertainty in averaged Dn(4000) values, and cyan error bars showing the systematic error between methods of combining the values. Black outlined points show the measurements from Muzzin et al. (2012) (taken from their table 5, averaged over radial bins). While the GCLASS sample shows small differences in Dn(4000) between environments, on average we find larger differences in the Dn(4000) of the average spectrum of cluster galaxies than field galaxies for the GOGREEN sample – consistent with the sense of the age difference we measure from fitting the SFHs of individual galaxies.
While the GCLASS sample shows small differences in Dn(4000) between environments, on average we find larger differences in the Dn(4000) of the average spectrum of cluster galaxies than field galaxies for the GOGREEN sample. This is consistent with the sense of the age difference we measure from fitting the SFHs of individual galaxies. The GCLASS sample is dominated by galaxies at z ∼ 0.8, particularly at low stellar masses. That we find larger age differences than in GCLASS could hint that the age difference evolves between z ∼ 0.8 and z ∼ 1.2.
APPENDIX E: AGE AS A FUNCTION OF UVJ COLOUR
Mass-weighted ages, tmw, are shown in UVJ colour space in Fig. E1. The sample is divided into five regions in UVJ colour space, delineated by dotted lines, and the median age (and 68 per cent credible regions) is labelled for each. As expected, there is a positive trend between tmw and rest-frame U − V and V − J colours, where the oldest galaxies are clustered towards the upper right of the quiescent region. We find good consistency between our UVJ ages trend and trends in the literature (e.g. Belli et al. 2019; Estrada-Carpenter et al. 2019; Ferreras et al. 2019), despite systematic or procedural differences between studies, for example: SFR parametrization, SED-fitting procedures, how the ages were measured (luminosity weighted, mass weighted, median, etc.), and the mass or redshift range of the samples. The overall age gradient in UVJ colour space is flatter than predicted by Belli et al. (2019), which could be attributed to the aforementioned systematics. However, Carnall et al. (2019a) report their sample of 1 < z < 1.3 quiescent galaxies to have tmw in good agreement with the Belli et al. (2019) relationship despite having similar methodological differences. Although the systematics related to our fitting procedure are important when comparing to the literature, they are less important for the purposes of this study – the differential comparison of cluster and field populations. Our age estimates are discussed further in Section 4.2.
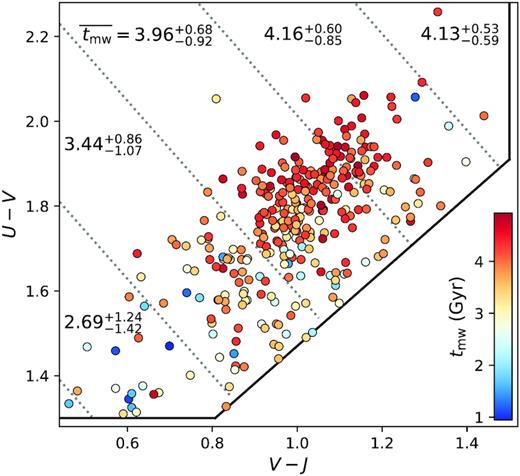
Mass-weighted ages in rest-frame UVJ colour space. The sample is divided into five regions, where the median tmw and 68 per cent credible regions for the galaxies in each bin are labelled. As expected, there is a positive trend between tmw and rest-frame U − V and V − J colours, where the oldest galaxies are clustered towards the upper right of the quiescent region. The majority of galaxies in the ‘red clump’ are the oldest galaxies in our sample, but otherwise there is not a smooth distribution of tmw relative to UVJ colours.
APPENDIX F: LUMINOSITY-WEIGHTED AGES
Fig. F1 shows the distribution of the stellar mass and luminosity-weighted ages, in units of cosmic time (similar to Fig. 6 for mass-weighted ages). Contours show the combined posteriors of the field (blue) and cluster (red) galaxies, where white points indicate the medians of the individual posteriors. Diamonds mark galaxies that have formed more than 10 per cent of their stellar mass within the last 1 Gyr, |${f}_{{M}_\ast {\lt } 1\, \mathrm{Gyr}}$| > 0.1, discussed in Section 4.3. Compared to the mass-weighted ages, the luminosity-weighted ages are younger on average, but not uniformly younger. As a result the age distributions are broadened.
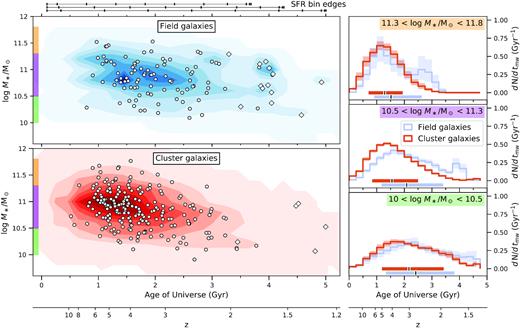
Comparison of stellar masses and luminosity-weighted ages between field (blue) and cluster (red) galaxies. Left: combined posteriors of stellar masses and tlw (in units of cosmic time), shown as contours. The medians of the individual posteriors are marked with white circles/diamonds. Diamonds indicate |${f}_{{M}_\ast {\lt } 1\, \mathrm{Gyr}}$| > 0.1 galaxies (formed more than 10 per cent of their stellar mass within the last 1 Gyr). Horizontal bars at the top of the figure indicate the edges of the age bins for z = 1.5 (top), z = 1.25 (middle), and z = 1 (bottom). The bins were defined in units of lookback time, and therefore do not match up for galaxies observed at different redshifts. Right: combined tlw posteriors for field and cluster galaxies, shown in three mass bins. The medians (black mark) and 68 per cent credible regions (coloured bar) of each distribution is marked at the bottom of each subplot. The shaded regions show the bootstrapped uncertainty of each histogram. Although there are field galaxies that formed as early as the oldest cluster galaxies, and cluster galaxies that formed as late as the youngest field galaxies, on average field galaxies formed at later times.
Following the same mass-matched cumulative age comparison as for tmw, we find that cluster galaxies are on average |${0.39}_{^{-0.40}}^{_{+0.58}}$| Gyr older than field galaxies, a ∼0.1 Gyr larger difference. Fig. 8 compares this age comparison to that with mass-weighted ages.
