


ABSTRACT
We present NuSTAR (Nuclear Spectroscopic Telescope Array) observations of four active galactic nuclei (AGNs) located within 15 Mpc. These AGNs, namely ESO 121-G6, NGC 660, NGC 3486, and NGC 5195, have observed X-ray luminosities of L2–10 keV,obs ≲ 1039 erg s−1, classifying them as low-luminosity AGN (LLAGN). We perform broad-band X-ray spectral analysis for the AGN by combining our NuSTAR data with Chandra or XMM–Newton observations to directly measure their column densities (NH) and infer their intrinsic power. We complement our X-ray data with archival and new high-angular resolution mid-infrared (mid-IR) data for all objects, except NGC 5195. Based on our X-ray spectral analysis, we found that both ESO 121-G6 and NGC 660 are heavily obscured (NH > 1023 cm−2; L2–10 keV,int ∼ 1041 erg s−1), and NGC 660 may be Compton thick. We also note that the X-ray flux and spectral slope for ESO 121-G6 have significantly changed over the last decade, indicating significant changes in the obscuration and potentially accretion rate. On the other hand, NGC 3486 and NGC 5195 appear to be unobscured and just mildly obscured, respectively, with L2–10 keV,int < 1039 erg s−1, i.e. genuine LLAGN. Both of the heavily obscured AGNs have Lbol > 1041 erg s−1 and λEdd ≳ 10−3, and are detected in high-angular resolution mid-IR imaging, indicating the presence of obscuring dust on nuclear scale. NGC 3486, however, is undetected in high-resolution mid-IR imaging, and the current data do not provide stringent constraints on the presence or absence of obscuring nuclear dust in the AGN.
1 INTRODUCTION
Based on the unification model of active galactic nuclei (AGNs; e.g. Antonucci 1993; Urry & Padovani 1995; Bianchi et al. 2012; Netzer 2015; Ramos Almeida & Ricci 2017), the different characteristics seen in the optical spectra of Type 1 and Type 2 Seyferts are caused by the viewing angle towards the central region of the AGN. Depending on the orientation of the AGN system with respect to our line of sight (l.o.s.), an optically and geometrically thick region (torus) of gas and dust can obscure our direct view towards the broad-line region (BLR), resulting in the different properties that we observe for the two AGN classes. The direct identification of the broad-line emission results in a Type 1 classification, while the apparent absence of the BLR results in a Type 2 classification. One of the key observational pieces of evidence supporting this theory comes from spectropolarimetry in which some Type 2 sources show broad permitted lines in their polarized spectra, consistent with that seen in Type 1 Seyfert total spectra, indicating that the nuclear regions of Type 2 Seyferts are obscured from our direct view, but can be seen if the emission is scattered into our l.o.s. (e.g. Antonucci & Miller 1985; Capetti et al. 1995; Kishimoto 1999; Antonucci 2002).
Despite being successful in describing the physical structure for the majority of nearby AGNs, there is some evidence that this model might not be valid for AGNs with low luminosities (Lbol ≲ 1042 erg s−1) and low accretion rates (Lbol/LEdd ≲ 10−3). In particular, the BLR and obscuring structure, which are probably supported by radiation pressure, are expected to collapse and disappear if the pressure drops too low (e.g. Elitzur & Shlosman 2006; Hönig & Beckert 2007; Elitzur & Ho 2009). There is some observational support for this basic picture (e.g. Maoz et al. 2005; Ho 2008; Trump et al. 2011; Hernández-García et al. 2016; González-Martín et al. 2017), although due to the intrinsic faintness of the low-luminosity AGN (LLAGN) emission, the current data are limited in many cases. Several studies have also predicted that LLAGNs lack a standard accretion disc (Shakura & Sunyaev 1973), and instead are powered by an advection-dominated accretion flow at the central region (e.g. Narayan et al. 1998; Quataert 2001; She et al. 2018). This is supported by observational evidence through the lack of an ultraviolet bump in the spectral energy distribution of LLAGN, which is a signature for an optically thick, geometrically thin accretion disc (e.g. Ho 1999; Nemmen et al. 2006; Eracleous, Hwang & Flohic 2010). The lack of broad Fe K α emission in many LLAGNs also supports this view as it suggests the absence (or truncation) of a standard accretion disc (e.g. Terashima et al. 2002).
The study of LLAGNs is therefore important in our understanding of the AGN physical structure and accretion physics, as well as for building a complete census of AGN over a broad range in luminosity. The faintness of LLAGNs, however, makes them challenging to study. In this paper, we define LLAGNs as those with an intrinsic 2–10 keV X-ray luminosity of L2–10 keV,int < 1040 erg s−1.
The observed luminosity of an AGN can also mislead our interpretation of the nature of the source. AGNs can appear to be of a low luminosity, when in fact they are deeply buried from our view by the dusty torus, or larger scale obscuration, suppressing the observed emission. Many studies have shown that the majority of AGN accretion occurs in the obscured phase, in which the central engine is hidden from our view by dust/gas with column densities of NH ≥ 1022 cm−2 (see recent review by Hickox & Alexander 2018). This is also evident from the spectral shape of the cosmic X-ray background (CXB) radiation, in which a significant population of obscured AGNs is required to account for the high-energy peak of the CXB spectrum (e.g. Setti & Woltjer 1989; Gandhi et al. 2007; Gilli, Comastri & Hasinger 2007; Treister, Urry & Virani 2009; Draper & Ballantyne 2010; Akylas et al. 2012; Ueda et al. 2014; Comastri et al. 2015). Many AGN population studies support the above works that indeed show that obscured AGNs dominate the overall AGN population in the universe (e.g. Risaliti, Maiolino & Salvati 1999; Alexander et al. 2001; Panessa et al. 2006; Akylas & Georgantopoulos 2009; Brightman & Nandra 2011; Ajello et al. 2012; Aird et al. 2015; Buchner et al. 2015; Ricci et al. 2015). Obscured AGNs, however, can be very challenging to identify, especially those in which the obscuring column density exceeds the Compton-thick (CT) threshold (NH ≳ 1.5 × 1024 cm−2). Unambiguous identification of these sources requires high-quality broad-band X-ray spectral analysis to properly characterize their spectra and directly measure the NH value of the obscuring material. This can be particularly challenging to achieve for distant sources and intrinsically low-luminosity obscured AGNs as they often require deep X-ray observations in order to gain sufficient counts for detailed X-ray spectral analyses.
Over the last few years, we started a programme to study the X-ray properties of a complete sample of AGNs within D ≤ 15 Mpc, identified on the basis of the high-ionization [Ne v] λ14.3 μm emission line (ionization energy = 97.1 eV) detection (Goulding & Alexander 2009), to form the most complete census of the CT AGN population and the NH distribution of AGNs in the local universe. Our aim is to directly measure the NH values for each AGN by performing broad-band X-ray spectroscopy (over ∼2 orders of magnitude in energy range) using data from multiple focusing X-ray observatories, primarily the Nuclear Spectroscopic Telescope Array (NuSTAR; Harrison et al. 2013), in combination with Chandra and XMM–Newton. The results of the first two sources in the sample observed by NuSTAR as part of our programme, i.e. NGC 5643 and NGC 1448, are presented in Annuar et al. (2015, 2017), respectively. For both of these sources, we unambiguously identified the AGN as a CT AGN. In this paper, we present new NuSTAR observations and direct column density measurements for a further four AGNs within the sample, namely ESO 121-G6, NGC 660, NGC 3486, and NGC 5195. The observed X-ray luminosities of these AGNs are of the order of 1039 erg s−1, comparable with the luminosity threshold for ultraluminous X-ray sources (ULXs; refer to Kaaret, Feng & Roberts 2017, for a recent review on ULXs; see the left-hand panel of Fig. 1).1 The observed X-ray luminosities of our sources suggest that they are LLAGNs. However, a comparison of their observed X-ray luminosities to their [Ne v] λ14.3 μm emission line luminosities suggests that they are underluminous in X-rays when compared to that found for typical AGNs (see the right-hand panel of Fig. 1). This suggests that the X-ray emission in these AGNs may be heavily obscured.
![Left: 2–10 keV luminosity versus distance for the AGN presented in this work (observed luminosity; red), in comparison with the Swift-BAT AGN (intrinsic luminosity; grey; Ricci et al. 2015). Our AGNs are approximately an order of magnitude fainter than the limit of the Swift-BAT AGN. The dashed line indicates the luminosity threshold for ULXs. Right: Observed 2–10 keV luminosity versus [Ne v] λ14.3 μm luminosity for the AGN presented in this work (red). The [Ne v] luminosity for NGC 3486 was predicted from its [O iv] luminosity as it does not have a [Ne v] line measurement from Spitzer. The solid line corresponds to the intrinsic relationship derived by Weaver et al. (2010) (σ ≈ 0.5 dex) using Swift-BAT AGN (grey). On the basis of this simple comparison, our AGNs appear to be significantly underluminous in X-rays.](https://oup.silverchair-cdn.com/oup/backfile/Content_public/Journal/mnras/497/1/10.1093_mnras_staa1820/1/m_staa1820fig1.jpeg?Expires=1750341040&Signature=XtWpEav8uH8o-pKD56593u0Lnn-4PWX0bnbuT~sZrCoimxv~LJsP~imGxzt9V7IvWRO07R8U1IjPLD-1KR8OyckC9~JY~2ObAwS01lCiItFFubzfv0QNCi1G88FWxL220DQfTiJUUxh1O6wjxyOWZHpG3G63nN0WoxLx1VaY7tMungToB9yuum2pN-pd4JgjMITaZsPdapnHSCpRCKRLNlSgYNse5XgMNqXRvg5BFpF4gH5kDoetOqY~Bf3hj5bFCzIsGpkK7yA8zYsS6edB09gwJDICui~877sB5MGT08OBjIUl3L7XABAnTHtQOB6KlKN5eXx6aoo7dc2Q84dAaQ__&Key-Pair-Id=APKAIE5G5CRDK6RD3PGA)
Left: 2–10 keV luminosity versus distance for the AGN presented in this work (observed luminosity; red), in comparison with the Swift-BAT AGN (intrinsic luminosity; grey; Ricci et al. 2015). Our AGNs are approximately an order of magnitude fainter than the limit of the Swift-BAT AGN. The dashed line indicates the luminosity threshold for ULXs. Right: Observed 2–10 keV luminosity versus [Ne v] λ14.3 μm luminosity for the AGN presented in this work (red). The [Ne v] luminosity for NGC 3486 was predicted from its [O iv] luminosity as it does not have a [Ne v] line measurement from Spitzer. The solid line corresponds to the intrinsic relationship derived by Weaver et al. (2010) (σ ≈ 0.5 dex) using Swift-BAT AGN (grey). On the basis of this simple comparison, our AGNs appear to be significantly underluminous in X-rays.
In this paper, we perform broad-band X-ray spectral analysis and explore the mid-infrared (mid-IR) properties of the AGN to investigate their nature, i.e. to explore whether they are indeed buried AGNs as suggested by their [Ne v] luminosity or whether they are intrinsically LLAGNs. The characterization of these AGNs is important in allowing us to build a complete census of the nearby AGN population over a broad range of obscuration and luminosities, and to help us further test AGN physical models. We describe each source, and detail their mid-IR and X-ray observations in Section 2. We also present the broad-band spectral modelling and results in Section 2. In Section 3, we conduct additional X-ray and mid-IR analyses to further investigate the nature of the AGN, and discuss their properties. Finally in Section 4, we summarize our conclusions and provide brief details on our future work.
2 OBSERVATIONS AND SPECTRAL ANALYSIS
In this section, we describe each AGN target, their X-ray observations, the data reduction procedures adopted in this work, and the X-ray spectral analysis of each AGN. In addition, we also detail the high-spatial resolution mid-IR observations for the AGN. In Tables 1 and 2, we present a summary of the AGN basic properties and their X-ray observations, respectively. We summarize the main results of our spectral analysis in Table 3.
AGNs and their basic properties.
| Name | D | Hubble | Spectral | log MBH | |$\log {L_{[\rm O\,{\small IV}]}}$| | |$\log {L_{[\rm Ne\,{\small V}]}}$| | log L12 μm | |$\log {L_{[\rm O\,{\small III}], corr}}$| | log LIR |
|---|---|---|---|---|---|---|---|---|---|
| (Mpc) | type | class | (M⊙) | (erg s−1) | (erg s−1) | (erg s−1) | (erg s−1) | (L⊙) | |
| (1) | (2) | (3) | (4) | (5) | (6) | (7) | (8) | (9) | (10) |
| ESO 121-G6 | 14.5 | Sc | H ii | 6.10 | 39.04 | 38.21 | 40.28c | – | 9.70 |
| NGC 660 | 12.3 | Sa | L | 7.35 | 39.71 | 38.85 | 41.18c | 40.03 | 10.49 |
| NGC 3486 | 9.2 | Sc | S2 | 6.50a | 38.53 | 37.71b | <40.10d | 38.19f | 9.31 |
| NGC 5195 | 8.3 | Irr | L | 7.31 | 37.89 | 37.22 | <41.90e | 37.12 | 9.50 |
Notes. Column (1) Galaxy name; (2) distance in Mpc; (3) Hubble classification of the host galaxy – S: Seyfert, L: LINER, and H ii: H ii region; (4) optical spectral class on the basis of emission line diagnostic diagrams (e.g. Kewley et al. 2001); (5) black hole mass relative to the mass of the Sun, M⊙; (6)–(9) [O iv], [Ne v], 12 μm continuum, and [O iii] (corrected for the Balmer decrement) luminosities in units of erg s−1, respectively; (10) total IR luminosity relative to the luminosity of the Sun, L⊙. All data are taken from Goulding & Alexander (2009) or Goulding et al. (2010), unless indicated by additional references.
Log of X-ray observations used in this work.
| Name | R.A. | Dec. | Observatories | ObsID | Date | Energy band | Net exposure time | Net count rate |
|---|---|---|---|---|---|---|---|---|
| (keV) | (ks) | (10−3 cts s−1) | ||||||
| (1) | (2) | (3) | (4) | (5) | (6) | (7) | (8) | (9) |
| ESO 121-G6 | 6:07:29.86 | −61:48:27.61 | XMM–Newton | 0403072201 | 2007-01-20 | 0.5–10 | 11.5 | 2.49 ± 0.77 |
| Chandra | 19523 | 2017-12-23 | 0.5–8 | 32.1 | 31.15 ± 1.29 | |||
| – | 20892 | 2017-12-24 | 0.5–8 | 22.0 | 30.36 ± 1.54 | |||
| NuSTAR | 60201063002 | 2017-12-25 | 3–50 | 98.6 | 48.41 ± 0.75 | |||
| NGC 660 | 01:43:02.32 | 13:38:44.90 | Chandra | 15333 | 2012-12-18 | 0.5–8 | 22.8 | 4.03 ± 0.42 |
| – | 15587 | 2012-11-20 | 0.5–8 | 27.7 | 4.24 ± 0.39 | |||
| – | 18352 | 2015-08-26 | 0.5–8 | 10.0 | 3.29 ± 0.57 | |||
| NuSTAR | 60101102002 | 2015-08-23 | 3–30 | 112 | 1.41 ± 0.14 | |||
| NGC 3486 | 11:00:23.87 | 28:58:30.49 | XMM–Newton | 0112550101 | 2001-05-09 | 0.5–10 | 9.3 | 20.79 ± 0.30 |
| NuSTAR | 60001150002 | 2015-01-26 | 3–24 | 57.8 | <0.74 | |||
| NGC 5195 | 13:29:59.41 | 47:15:57.29 | Chandra | 19522 | 2017-03-17 | 0.5–8 | 37.8 | 8.21 ± 0.51 |
| NuSTAR | 60201062002 | 2017-03-16 | 3–24 | 94.3 | 0.25 ± 0.08 | |||
| – | 60201062003 | 2017-03-17 | 3–24 | 326 | 0.50 ± 0.05 |
Notes. (1) Galaxy name; (2) and (3) AGN positions that were used to extract the spectra; (4) observatory; (5) observation identification number; (6) observation ut start date; (7) energy band in keV; (8) the net (clean) exposure time in ks; (9) net count rate within the extraction region in the given energy band in units of 10−3 s−1. The net exposure times and count rates for NuSTAR and XMM–Newton are the total values from the FPMs and EPIC cameras, respectively.
X-ray analysis results.
| Name | Facility | Model | Energy band | Γ | log NH | log L2–10 keV,obs | log L2–10 keV,int | χ2 or C-stat / d.o.f | SC |
|---|---|---|---|---|---|---|---|---|---|
| (keV) | (cm−2) | (erg s−1) | [erg s−1] | ||||||
| (1) | (2) | (3) | (4) | (5) | (6) | (7) | (8) | (9) | (10) |
| ESO 121-G6 | C + N | MY torus | 0.5–50 | 1.89 ± 0.08 | 23.33 ± 0.03 | 40.53 | 41.01 | 373/318 (χ2) | 0.10 ± 0.02 |
| C + N | torus | 0.5–50 | 1.89|$^{+0.11}_{-0.06}$| | 23.29 ± 0.02 | 40.53 | 41.01 | 368/317 (χ2) | 0.10 ± 0.02 | |
| NGC 660 | C + N | MY torus | 0.5–30 | 1.8a | 23.78|$^{+0.18}_{-0.22}$| | 39.07 | 39.76 | 181/186 (C-stat) | 0.31 ± 0.13 |
| C + N | torus | 0.5–30 | 1.8a | ≥24.73 | 39.05 | ≥41.24 | 206/187 (C-stat) | 0.31 ± 0.13 | |
| NGC 3486 | XMM + N | zwabs(zpow) | 0.5–24 | 1.52|$^{+0.43}_{-0.24}$| | ≤21.14 | 38.58 | 38.58 | 27/34 (C-stat) | – |
| NGC 5195 | C + N | zwabs(zpow) | 0.5–24 | 2.12|$^{+0.61}_{-0.23}$| | 22.07|$^{+0.40}_{-0.81}$| | 38.80 | 38.82 | 226/243 (C-stat) | – |
Notes. Column (1) AGN name; (2) X-ray facilities used in the analysis (C: Chandra; N: NuSTAR; XMM: XMM–Newton); (3) best-fitting models to the spectra; (4) energy band used in the analysis in units of keV; (5) best-fitting photon index (afixed); (6) best-fitting column density measured in cm−2; (7 and 8) observed and absorption-corrected (intrinsic) 2–10 keV luminosities, respectively, in units of erg s−1; (9) fit statistic results and statistical approach; and (10) spectral curvature value (Koss et al. 2016; see Section 3.1).
NuSTAR, launched on 2012 June 13, is the first focusing high-energy X-ray observatory in orbit (Harrison et al. 2013). The energy range over which it is sensitive (i.e. 3–79 keV) provides excellent coverage for detecting the characteristic signatures of obscured AGNs, such as the photoelectric cut-off at E < 10 keV, the fluorescence Fe K α line emitted at ∼6.4 keV, and the Compton hump at ∼30 keV. In addition, it also provides an ∼100× improvement in sensitivity and over an order of magnitude improvement in angular resolution (18 arcsec for full width at half-maximum, FWHM; 58 arcsec for half-power diameter) with respect to the previous generation of high-energy X-ray observatories such as INTEGRAL and Swift-BAT. These advantages make NuSTAR an ideal instrument to identify obscured and relatively low-luminosity AGNs, which may have been missed by previous high-energy X-ray observatories.
We processed the NuSTAR data for our sources with the NuSTAR Data Analysis Software (nustardas) v1.4.1 within heasoft v6.15.1 with CALDB v20191219. The nupipeline v0.4.3 script was used to produce the calibrated and cleaned event files using standard filter flags. We extracted the spectra and response files from each of the NuSTAR focal plane modules (FPM A and FPM B), using the nuproducts v0.2.5 task.2 The spectra and response files from each of the NuSTAR FPMs were combined together using the addascaspec script to increase the overall signal-to-noise ratio of the data.3 In addition to the spectral extraction, we also combined the NuSTAR event files from the two FPMs using xselect to produce the total event file.4 The total count images at different energy bands were then produced from the resultant event files using the dmcopy task in ciao (see below).
In addition to NuSTAR, we also used new and archival low-energy X-ray observations from Chandra and XMM–Newton to facilitate our X-ray spectral analysis of the AGN at low energies (E ≲ 3 keV), where NuSTAR is not sensitive. The higher spatial resolution provided by Chandra is crucial in helping us to reliably account for contaminating emission to the NuSTAR spectrum from off-nuclear X-ray sources. The Chandra data were reprocessed to create event files with updated calibration modifications using the ciao v4.6 pipeline (Fruscione et al. 2006) following standard procedures. We then used the dmcopy task to produce X-ray images of each source in different energy bands, and extracted the source spectra using the specextract task in ciao. For XMM–Newton, we analysed the Pipeline Processing System data products using the Science Analysis Software (SAS v13.5.0) with the standard filter flags. Background flares were excised from the data by visually examining the source light curves, and the X-ray spectra from the three EPIC cameras were then extracted using the evselect task in SAS. The spectra extracted for the EPIC MOS1 and MOS2 cameras were combined using the epicspeccombine task in SAS.
We performed our spectral analysis using xspec v12.8.2. We included a fixed Galactic absorption component for each source (Kalberla et al. 2005) using the xspec model ‘phabs’ in all spectral fits, and assumed solar abundances for all models. Due to the modest quality of our data, we also fixed the cross-calibration uncertainties of each observatory with respect to NuSTAR to the values found by Madsen et al. (2015) using a constant parameter, C, unless stated otherwise. Given the non-negligible contribution of background to the weak source flux in most cases, particularly in the NuSTAR and XMM–Newton data, we binned our spectra to a minimum of 5 counts per bin for the NuSTAR and XMM–Newton data, and 1 count per bin for the Chandra data using the grppha task in heasoft, except for ESO 121-G6 (see Section 3.1).5 We then optimized the fitting parameters using the Poisson C-statistic (Cash 1979) for all AGNs with the exception for ESO 121-G6, which was fitted using the chi-squared (χ2) statistic. All errors are quoted at 90 |${{\ \rm per\ cent}}$| confidence.
2.1 ESO 121-G6
ESO 121-G6 is a highly inclined (i = 90○)6 galaxy located at a distance of 14.5 Mpc. The AGN in the galaxy was discovered in 2009 using the [Ne v] line detection (Goulding & Alexander 2009). The source lacks sensitive nuclear optical spectroscopy, and is therefore unclassified at optical wavelengths. However, due to the edge-on inclination of the galaxy along our l.o.s., the optical emission from the AGN is expected to be severely absorbed by the host galaxy. Prior to our study, this galaxy had only been observed in X-rays by XMM–Newton in 2007 for 15 ks (ObsID 0403072201), in which the data show a weak point source within 5 arcsec of the 2MASS position of the galaxy (RA = 06:07:29.86, Dec. = −61:48:27.3). The average net count rate measured from the three EPIC cameras is CR0.5–10 ∼ 1.3 × 10⁻³ counts s−1, corresponding to f0.5–10 ∼ 3.8 × 10⁻¹⁵ erg s−1 cm−2, assuming a simple power-law model with Galactic absorption (Γ = 1.74|$^{+1.14}_{-1.26}$|). The observed 2–10 keV luminosity of the AGN measured from these data, L2–10 keV,obs ∼ 5.4 × 1038 erg s−1, is significantly lower than that expected from the [Ne v] luminosity, suggesting heavy obscuration of the nuclear source (see Fig. 1). This is also the case when we compare the X-ray luminosity with the 12 μm luminosity of the AGN measured at high spatial resolution (see Sections 2.1.1 and 3 and Fig. 9), providing further evidence that the AGN is heavily obscured at X-ray energies, and is possibly CT.
2.1.1 High-spatial resolution Mid-IR observation
We observed ESO 121-G6 at mid-IR wavelengths at high spatial resolution in 2010 using the Thermal-Region Camera Spectrograph (T-ReCS; field of view 28|${_{.}^{\prime\prime}}$|8 × 21|${_{.}^{\prime\prime}}$|6; 0.09 arcsec pixel−1; Telesco et al. 1998), mounted on the Gemini-South telescope. The observations were carried out on 2010 October 25 (Program ID: GS-2010B-Q-3; PI: F. Bauer) for ≈319 s on-source time using the N-band filter (λ = 7.4–13.4 μm) in parallel chop and nod mode. We reduced the data using the midir pipeline in iraf provided by the Gemini Observatory, and performed the image analysis using the idl package mirphot, following Asmus et al. (2014). We detected a compact core on top of faint extended emission tracing the host morphology (see Fig. 2). We estimated the unresolved, nuclear flux by subtracting a manually scaled point source from the image, leaving a flat residual as judged by eye. Owing to this, the uncertainty on the nuclear flux is relatively large. The flux we measured is 3 ± 2 mJy at 12 μm, corresponding to a luminosity of L12 μm = (1.9 ± 1.2) × 1040 erg s−1.
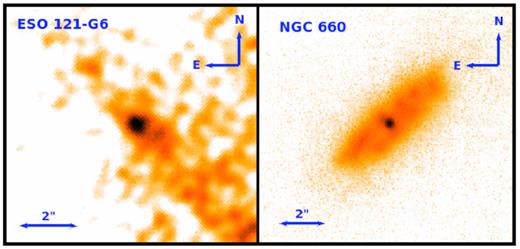
Gemini-South T-ReCS (|$\lambda _{\rm mean} = 10.3 \, \mu$|m) and VLT VISIR mid-IR (|$\lambda _{\rm mean} = 8.7 \, \mu$|m) images of ESO 121-G6 (left) and NGC 660 (right), respectively. The ESO 121-G6 image has been smoothed with a Gaussian function of radius 3 pixels (0.3 arcsec) for visual clarity.
2.1.2 X-ray observations and data extraction
ESO 121-G6 was observed at X-ray wavelength with NuSTAR on 2017 December 25 with an on-source exposure time of texp = 50.1 ks (ObsID: 60201063002). Our NuSTAR observation was assisted by contemporaneous Chandra observations (ObsID: 19523 and 20892; texp = 32.6 and 22.3 ks, respectively), which provided lower energy X-ray data as well as a higher angular resolution X-ray image of the galaxy. The Chandra data revealed two point sources within ∼3 arcsec of the 2MASS position of the galaxy in the broad Chandra band of 0.5–8 keV. This is the first time that the two sources are resolved and detected in X-ray. We used the wavdetect tool within ciao to determine the centroid position of the two central sources in this energy band, setting the threshold parameter to 1 × 10⁻⁷. One of the Chandra sources is detected at 2–8 keV, and is located at a position of RA = 6:07:29.86 and Dec. = −61:48:27.61, with formal wavdetect errors of 0|${_{.}^{\prime\prime}}$|03 and 0|${_{.}^{\prime\prime}}$|01, respectively.7 This is consistent with the 2MASS position of the galaxy within 0.5 arcsec. The other point source was detected at RA = 6:07:30.12 and Dec. = −61:48:30.21, with formal wavdetect errors of 0|${_{.}^{\prime\prime}}$|21 and 0|${_{.}^{\prime\prime}}$|09 (see footnote 7), respectively, and is undetected by Chandra at 2–8 keV. We therefore assumed that the former is the AGN, and used this position when extracting the X-ray spectra of the AGN. In Fig. 3, we show the combined Chandra RGB image of ESO 121-G6.
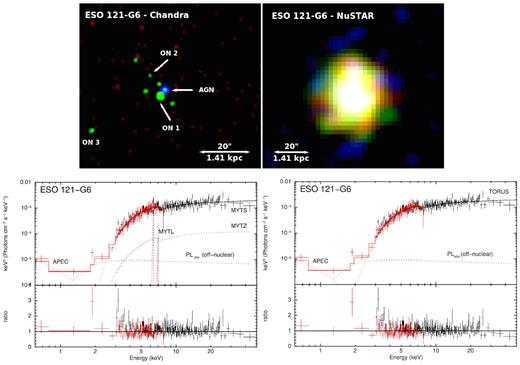
Top: Chandra and NuSTAR RGB images of ESO 121-G6 (Chandra – Red: 0.5–1 keV, Green: 1–2 keV, Blue: 2–8 keV; NuSTAR – Red: 3–8 keV, Green: 8–24 keV, Blue: 24–50 keV). The off-nuclear sources that were detected within the 50 arcsec-radius extraction region in Chandra are labelled as ON 1, ON 2, and ON 3. The images are smoothed with a Gaussian function of radius 3 pixels, corresponding to 1.5 and 7.4 arcsec for Chandra and NuSTAR, respectively. North is up and east is to the left in all images. Bottom: Best-fitting MY torus (left) and torus (right) models to the combined NuSTAR (black) and Chandra (red) data of ESO 121-G6. The data have been rebinned to a minimum of 3σ significance with a maximum of 500 bins for visual clarity. The top panel shows the data and unfolded model in E2FE units, while the bottom panel shows the ratio between the data and the folded model. The spectra were fitted using the MY torus (Murphy & Yaqoob 2009) and torus (Brightman & Nandra 2011) models to simulate the obscuring torus, an apec component, a scattered power-law component to model the emission at the softest energies, and a power-law component to model the off-nuclear source located north-west of the AGN (ON 1). ON 2 and ON 3 were not included in the spectral fitting as they were only weakly detected, and their contributions are insignificant. The model components fitted to the data are shown as dotted curves, and the combined model fit is shown as solid curves.
A source consistent with the Chandra position of the AGN was detected in both of the NuSTAR observations, with significant counts up to ∼50 keV. The combined NuSTAR RGB image of the source is shown in Fig. 3. The count rate detected in the combined NuSTAR data in the 3–50 keV band is 4.84 × 10⁻² counts s−1. We extracted the NuSTAR spectra of the AGN using a 50 arcsec-radius circular region, corresponding to |${\sim}70{{\ \rm per\ cent}}$| encircled energy fraction. The Chandra spectrum was also extracted using the same size region to match the NuSTAR extraction region. The background for both the Chandra and NuSTAR spectra was extracted using a circular region of 100 arcsec radius from a source-free area.
2.1.3 X-ray spectral fitting
To reliably model the X-ray spectra of the AGN in ESO 121-G6, we need to account for contributions from the off-nuclear point source detected within the extraction region of the Chandra data, located south-east of the AGN (labelled as ON 1 in Fig. 3). We extracted the spectrum of this off-nuclear source using a small 1.5 arcsec-radius circular region. The background flux was extracted using a 20 arcsec-radius circular aperture from a source-free region. We note that there are a further two faint sources detected within the extraction region of the AGN in the 0.5–8 keV energy band (labelled as ON 2 and ON 3 in Fig. 3); however, we did not include them in our spectral analysis of the AGN as they are only weakly detected, and their contributions are insignificant. We modelled the X-ray spectrum of the brightest off-nuclear source (ON 1) extracted from Chandra between 0.5 and 8 keV using a simple power-law model, absorbed by the host galaxy absorption (tbabs) and Galactic column, |$N_{\rm {H}}^{\rm {Gal}}$| = 4.06 × 1020 cm−2 (Kalberla et al. 2005). We assumed that the source is located within ESO 121-G6 (z = 0.004 039). The best-fitting photon index and host galaxy absorption measured by the model are Γ = 2.15|$^{+1.01}_{-0.81}$| and NH = 1.23|$^{+1.03}_{-0.92}$| × 1022 cm−2, respectively (C-stat/d.o.f = 28/25). The model also inferred a 0.5–8 keV intrinsic luminosity of L0.5–8 keV, int = 7.70|$^{+1.74}_{-1.52}$| × 1038 erg s−1, below the luminosity threshold for a ULX, suggesting that the off-nuclear source is likely to be an X-ray binary. The measured luminosity is ∼2 orders of magnitude fainter than the observed luminosity measured for the AGN (L0.5–8 keV, obs, AGN ∼ 2.6 × 1040 erg s−1).
We then proceeded to analyse the X-ray spectra of the AGN. Given the relatively high count rates for the AGN in both the Chandra and NuSTAR data, we binned the spectra to a minimum of 20 counts per bin and optimize our fitting using the chi-squared statistic. We first fitted the Chandra and NuSTAR spectra of the AGN simultaneously between 3 and 50 keV using a simple power-law model, absorbed by the Galactic column. The fit was poor (reduced χ2 ∼ 3) due to significant excess between ∼5 and 10 keV, likely to be associated with spectral bump caused by obscuration. The best-fitting photon index measured from this model is relatively flat Γ3–50 ≈ 0.95, suggesting severe absorption of the AGN flux along our l.o.s. If we measured the photon index between 2 and 10 keV using the same model, we obtained Γ2–10 keV = 0.16 ± 0.07. This is significantly flatter than that measured for the archival XMM–Newton data in the same band, i.e. Γ2–10 keV = 1.74|$^{+1.14}_{-1.26}$|, even after accounting for the large statistical uncertainties.
We then modelled the broad-band X-ray spectrum of the AGN in ESO 121-G6 between 0.5 and 50 keV using physically motivated torus models by Murphy & Yaqoob (2009) and Brightman & Nandra (2011), called the MY torus and torus models, respectively. These models were produced using a Monte Carlo approach to simulate obscuring gas and dust with different geometries. The main difference between the two models is the adopted torus geometry. The MY torus model assumes a toroidal absorber geometry, and the torus model simulates a spherical torus with a biconical cut-out. While the l.o.s. column density for the MY torus model depends on the inclination angle, this is not the case for the torus model. The torus model can measure the column density up to NH = 1026 cm−2, but the MY torus model only allows a measurement up to NH = 1025 cm−2. However, the direct (mytz), scattered (myts), and line components (mytl) of the MY torus model can be disentangled from each other, allowing more freedom in modelling of the data. We note that an improved and more complex version of torus has been developed by Baloković et al. (2018), which would allow for more accurate and detailed modelling of the AGN. However, due to the larger number of parameters and limited number of X-ray counts for our sources, we do not use this model in our paper.
For both models, we fitted the spectra by fixing the inclination angle to the upper limit value of the model (i.e. θinc = 87○ for the torus model, and θinc = 90○ for the MY torus model), to simulate an edge-on inclination torus. For the MY torus model, we simply modelled the spectra by coupling all of the parameters of myts and mytl to mytz. The relative normalizations of myts and mytl with respect to mytz were fixed to 1. In addition to this torus component, we also added other components to model the spectra at lower energies (E ≲ 2 keV). These include the ‘apec’ component (Smith et al. 2001) to model the thermal emission from a hot interstellar medium, a power-law component to simulate the scattered emission from the AGN, and the model component for the off-nuclear source, with its power-law normalization allowed free to vary to account for any flux variations of the source between the Chandra and NuSTAR observations.8
We are able to get a good fit to the data using both models, with the torus model having a marginally better fit statistic than the MY torus model (χ2/d.o.f = 368/317 for the torus model, and χ2/d.o.f = 373/318 for the MY torus model). In Table 3, we detail the results measured by both models, which agree very well with each other. The models infer a photon index and column density of Γ ≈ 1.9 and NH ≈ 2.0 × 1023 cm−2, respectively. The photon index measured is close to the median value found for the overall (non-blazar) Swift-BAT AGN, i.e. 1.78 ± 0.01 (Ricci et al. 2017). The column density measured indicates that ESO 121-G6 is a heavily obscured AGN, but not CT. The scattering fraction measured with respect to the intrinsic power law is small, i.e. fscatt ≪ 1 |${{\ \rm per\ cent}}$|, but consistent with that found in many other obscured AGNs (e.g. Noguchi et al. 2010; Gandhi et al. 2014; Gandhi et al. 2015). The apec thermal component indicates a plasma temperature of kT ≈ 0.2 keV. Based on these models, we calculated observed and intrinsic luminosities of L2–10 keV,obs ≈ 3.4 × 1040 erg s−1 and L2–10 keV,int ≈ 1.0 × 1041 erg s−1, respectively. The intrinsic luminosity we measured is consistent with that inferred from the AGN mid-IR luminosity (see Section 3), supporting the results from our X-ray spectral analysis. In Fig. 3, we show the broad-band X-ray spectrum of the AGN and our best-fitting models.
The observed luminosity we measured for the AGN is about two orders of magnitude higher than that measured in the archival XMM–Newton data (i.e. L2–10 keV,obs = 5.37 × 1038 erg s−1), suggesting substantial variability between the XMM–Newton observation and our more recent X-ray observations of the source over a period of a decade (2007 and 2017, respectively; see Fig. 4). The observed photon index of the AGN has also become significantly harder over this 10 yr period (i.e. from Γ2–10 keV = 1.74|$^{+1.14}_{-1.26}$| to 0.16 ± 0.07). These results indicate that the AGN has varied between the 2007 XMM–Newton observation and our 2017 Chandra and NuSTAR observations, both in terms of luminosity and spectral shape, suggesting that ESO 121-G6 could be a candidate for an X-ray changing-look AGN.

X-ray flux of the AGN in ESO 121-G6 in the 2–10 keV band observed by XMM–Newton in 2007, and Chandra and NuSTAR in 2017. The significant difference between the two fluxes suggests that the source could be a candidate for a changing-look AGN in the X-rays.
2.2 NGC 660
NGC 660, located at a distance of 12.3 Mpc, is classified as a rare polar ring galaxy with a LINER-type (low-ionization nuclear emission-line region) nuclear spectrum in the optical. In 2013, a high-resolution radio observation by e-MERLIN revealed a radio outburst at the centre of the galaxy from a compact and extremely bright continuum source (Argo et al. 2015). The radio source, which was not detected in previous radio observations, is probably associated with a newly awoken AGN in the galaxy (Argo et al. 2015). The galaxy has been observed multiple times in the X-ray band at low energies by Chandra and XMM–Newton between 2001 and 2012 prior to the radio outburst. The Chandra data revealed diffuse emission at the centre of the galaxy, which peaks at the position of the radio source (RA = 01:43:02.32 ± 1.02 mas and Dec. = 13:38:44.90 ± 0.78 mas; Argo et al. 2015). The diffuse X-ray emission heavily contaminates the central source emission up to ∼6 keV. Although the radio observations indicate that there is significant variability, we found no significant spectral or flux variability between the two sufficiently long Chandra observations (texp ≥ 10 ks), conducted in 2012 November (ObsID 15333; exposure time texp = 23.1 ks) and 2012 December (ObsID 15587; exposure time texp = 28.1 ks), i.e. f0.5–8, obs = 5.12|$^{+1.65}_{-2.31}$| × 10−14 and 6.29|$^{+1.92}_{-2.49}$| × 10−14 erg s−1 cm−2, respectively. Comparing the X-ray flux of the AGN measured from the archival Chandra data with multiwavelength intrinsic luminosity indicators such as radio continuum and narrow-line region emission lines (measurements taken after and before the outburst, respectively) indicates that the source emission is severely suppressed in X-rays, suggesting heavy obscuration.
2.2.1 High-spatial resolution mid-IR observation
NGC 660 was observed at high angular resolution in the mid-IR band using the upgraded Very Large Telescope (VLT) Imager and Spectrometer for mid-IR (VISIR; field of view 38 arcsec × 38 arcsec; 0.045 arcsec pixel−1; Käufl et al. 2015; Kerber et al. 2016). The source was observed on 2018 August 15 [Program ID: 0101.B-0386(A); PI: A. Annuar] for 1 h (on-source time), using the J8.9 filter (λ = 7.8–9.5 μm) in parallel chop and nod mode. The data were reduced with the custom-made python pipeline, VISIC & Isaac Pipeline Environment (VIPE; Asmus, in preparation; https://github.com/danielasmus/vipe), and flux calibrated using the consecutively observed standard stars HD 22663 and HD 26967 from Cohen et al. (1999) standard catalogue. Similar to ESO 121-G6, a compact nucleus is detected, but in NGC 660, the compact emission is surrounded by relatively bright host emission (an almost edge-on starburst ring; see Fig. 2). We measured the flux of the unresolved core using a manual point source function scaling at 8.9 μm, which was then converted to 12 μm using a correction factor of 1.33 ± 0.21, assuming the typical Type 2 Seyfert mid-IR spectral energy distribution from Asmus et al. (2014). The resulting 12 μm flux density measured is 32 ± 11 mJy, corresponding to a luminosity of L12 μm = (1.5 ± 0.6) × 1041 erg s−1.figure
2.2.2 X-ray observations and data extraction
We observed NGC 660 at hard X-ray energies with NuSTAR in 2015 (after the radio outburst) for 56.0 ks (2015 August 23; ObsID 60101102002), contemporaneously with a short Chandra observation (ObsID 18352; texp = 10.1 ks) to further check for potential variability of the nuclear source at X-ray wavelengths. We reduced our new Chandra data of the source, and compared it to the two archival Chandra observations mentioned earlier. Although the count rate measured for our data is lower than that measured in the two archival data sets, they are consistent with each other within the statistical uncertainty. Therefore, we combined the event files for the observations together using xselect (texp,tot = 60.5 ks), and produced the resultant Chandra images of the source at 0.5–3 and 3–8 keV using dmcopy. The images are shown in Fig. 5. We extracted the total spectrum of the AGN from a small circular region of 1.5 arcsec radius centred on the radio position, to exclude as much contamination as possible from the complex non-AGN emission. A 20 arcsec-radius circular aperture was used to extract the background counts from an offset, source-free region. The total count rate measured from the combined Chandra data in the 0.5–8 keV band is 4.05 × 10⁻³ counts s−1.
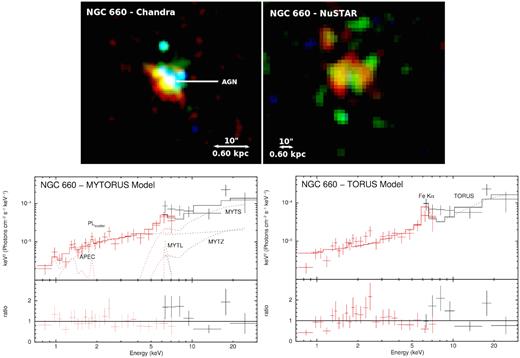
Top: Chandra and NuSTAR RGB images of NGC 660 (Chandra – Red: 0.5–1 keV, Green: 1–2 keV, Blue: 2–8 keV; NuSTAR – Red: 3–8 keV, Green: 8–24 keV, Blue: 24–30 keV). The spectra were extracted using a 20 arcsec-radius region for NuSTAR and 1.5 arcsec radius for Chandra (to minimize contamination from off-nuclear emission), centred on the radio position of the AGN (Argo et al. 2015). The images are smoothed with a Gaussian function of radius 3 pixels, corresponding to 1.5 and 7.4 arcsec for Chandra and NuSTAR, respectively. North is up and east is to the left in all images. Bottom: Best-fitting MY torus (left) and torus (right) models to the combined NuSTAR (black) and Chandra (red) data of NGC 660. The data have been rebinned to a minimum of 3σ significance with a maximum of 500 bins for visual clarity. The top panel shows the data and unfolded model in E2FE units, while the bottom panel shows the ratio between the data and the folded model. The spectra were fitted using the MY torus (Murphy & Yaqoob 2009) and torus (Brightman & Nandra 2011) models to simulate the obscuring torus, an apec component as well as a scattered power-law component to model the emission at the softest energies (this component is not visible in the torus model plot as its contribution is very low). The direct, scattered and line components of the MY torus model are labelled as mytz, myts, and mytl, respectively. The model components fitted to the data are shown as dotted curves, and the combined model fit is shown as solid curves.
The AGN is detected in both of the NuSTAR FPMs. We show the combined RGB image of the AGN from the two FPMs in Fig. 5. The NuSTAR spectrum of NGC 660 from each FPM was extracted using a circular aperture of 20 arcsec radius (corresponding to |${\sim}30{{\ \rm per\ cent}}$| of the NuSTAR encircled energy fraction) centred on the radio position of the AGN. The aperture size was chosen to minimize contamination from off-nuclear sources observed in the Chandra data. The background photons were collected from an annular segment centred on the AGN with inner and outer radii of 50 and 100 arcsec, respectively. We detected significant counts up to ∼30 keV from the combined FPM spectrum, and measured a net count rate of 1.41 × 10⁻³ counts s−1 in the 3–30 keV band. However, the Chandra data revealed that our NuSTAR spectrum is heavily contaminated by off-nuclear emission up to E ∼ 6 keV. We therefore excluded the NuSTAR data below this energy for our analysis. The NuSTAR count rate of the AGN in the 6–30 keV band is 8.83 × 10⁻⁴ counts s−1.
2.2.3 X-ray spectral fitting
As mentioned in Section 2.2.2, for our X-ray spectral analysis of NGC 660, we only modelled the NuSTAR spectrum above 6 keV as we expect the data to be heavily contaminated by non-AGN emission below this energy, as indicated by the Chandra data. However for Chandra, we modelled the full energy range (0.5–8 keV) as the spectrum was extracted from a much smaller region, significantly reducing contamination from off-nuclear emission. We first fitted the Chandra and NuSTAR spectra of NGC 660 simultaneously between 3 and 30 keV using a simple power-law model, absorbed by the Galactic column (|$N_{\rm {H}}^{\rm {Gal}}$| = 4.64 × 1020 cm−2; Kalberla et al. 2005). The redshift was fixed at z = 0.003 896 in the spectral analysis. The best-fitting photon index measured from the spectra is relatively flat, i.e. Γ = 0.69 ± 0.19 (C-stat/d.o.f. = 206/236), indicating significant X-ray absorption along our l.o.s. An excess of emission at E ∼ 6 keV also suggests the presence of Fe K α line emission. Adding a Gaussian component to our fit to model the emission indeed confirms a significant Fe K α emission centred at E = 6.49|$^{+0.10}_{-0.28}$| keV, with an equivalent width of EWFe K α = 0.65|$^{+0.58}_{-0.60}$| keV, indicating significant obscuration, possibly CT if we account for the upper limit uncertainty of the line equivalent width (EWFe K α ≥ 1 keV for CT; e.g. Maiolino et al. 1998; Comastri 2004).
We then proceeded to fit the broad-band X-ray spectrum of NGC 660 (0.5–30 keV) with the MY torus and torus models, similar to ESO 121-G6 (see Section 2.1). For the MY torus model, we also include a scattered power-law component to model the low-energy part of the AGN spectrum, and the apec component to model the non-AGN component at low energies. However, for the torus model, we only included the scattered power-law component as the apec component could not be constrained, and we are able to obtain a good fit without this component. We fixed the photon index in both models to Γ = 1.8 (approximately the typical mean value for the Swift-BAT AGN; Ricci et al. 2017) as it could not be constrained.
For the MY torus model, we measured a column density of NH = 6.09|$^{+3.19}_{-2.43}$| × 1023 cm−2 (C-stat/d.o.f = 182/186), indicating a heavily obscured AGN, close to the CT regime within the statistical uncertainties. The scattering fraction measured for the AGN is relatively high, i.e. fscatt 14|$^{+11}_{-6}\, {{\ \rm per\ cent}}$|; however, we note that, given the relatively low-quality data, this scattered component will also include contributions from other processes such as unresolved X-ray binaries, meaning that the intrinsic scattering fraction could be smaller than this value. The plasma temperature measured by the apec model component is kT = 0.34|$^{+0.79}_{-0.16}$| keV. The observed and intrinsic luminosities measured from this model are L2–10 keV,obs = 1.19 × 1039 erg s−1 and L2–10 keV,int = 5.74 × 1039 erg s−1, respectively. The intrinsic luminosity measured using this model is significantly lower than that predicted by the X-ray:12 μm intrinsic relationship derived by Asmus et al. (2015) (see Section 3 and Fig. 9), suggesting that the obscuring column may be higher than what we measured from this model, and is potentially CT.
We are able to also get an equally good fit with the torus model (C-stat/d.o.f = 206/187). However, the results obtained are quite different than the MY torus model. The column density measured by this model is in the CT regime, i.e. NH ≥ 5.38 × 1024 cm−2, and the intrinsic luminosity inferred after accounting for this extreme obscuration is L2–10 keV,int ≥ 1.74 × 1041 erg s−1. This luminosity is consistent with that predicted by the X-ray:12 μm correlation (see Section 3 and Fig. 9). In Fig. 5, we show the broad-band X-ray spectrum of the AGN in NGC 660 and our best-fitting models.
2.3 NGC 3486
NGC 3486 is a face-on galaxy located at a distance of 9.2 Mpc and has an optical nuclear spectrum that identifies it as a Type 2 Seyfert (Ho et al. 1997). The object had previously been observed in X-rays by Chandra (ObsID 393; 1999 November 3; texp = 1.8 ks) and XMM–Newton (ObsID 0112550101; 2001 May 9; texp = 15.2 ks). While a source associated with the optical nuclear position of the galaxy is detected in the XMM–Newton data, along with a ULX ∼23 arcsec from the nucleus (Foschini et al. 2002), nothing was detected in the short Chandra observations (Ho et al. 2001). NGC 3486 is one of four galaxies in Goulding & Alexander (2009) that lacks high-resolution Spitzer-IRS spectroscopic data, and therefore no [Ne v] flux measurement was made. However, an [O iv] emission line is clearly detected in the low-resolution Spitzer-IRS spectroscopy and the optical spectrum indicates that NGC 3486 hosts an AGN. Previous works have performed X-ray spectral analysis on the XMM–Newton data of NGC 3486 and found some evidence for it to be heavily obscured, e.g. a relatively flat power-law photon index at 2–10 keV (Cappi et al. 2006; Brightman & Nandra 2008).
2.3.1 Mid-IR observation
The central part of NGC 3486 has been observed at high spatial resolution in the mid-IR (N-band filters) in 2010 with the Michelle instrument, mounted on the Gemini-North telescope (0.1005 arcsec pixel−1). However, nothing was detected in the images (Asmus et al. 2014). The upper limit on the 12 μm flux density derived from the data is 5.1 mJy. This corresponds to an upper limit luminosity of L12 μm < 1.3 × 1040 erg s−1.
2.3.2 X-ray observations and data extraction
We observed NGC 3486 at hard X-ray energies with NuSTAR on 2015 January 26 for texp = 28.9 ks (ObsID 60001150002). The observation was coordinated with a short Swift X-ray Telescope (XRT; Burrows et al. 2005) observation to facilitate our X-ray analysis at low energies (ObsID 00080813001; texp ∼ 5 ks). Neither the AGN nor the ULX in NGC 3486 were significantly detected in either our NuSTAR or Swift-XRT observations using the detection technique adopted in other NuSTAR studies of faint sources (significance ≲2.6σ; e.g. Luo et al. 2013, Lansbury et al. 2014; Stern et al. 2014).9 The upper limits to the count rates measured for the AGN in the XRT and NuSTAR observations (total for both FPMs) are CR0.5–10, AGN < 3.75 × 10⁻³ counts s−1 and CR3–24, AGN < 0.74 × 10⁻³ counts s−1 at 0.5–10 and 3–24 keV, respectively. Based on webpimms,10 the XRT flux corresponds to an upper limit flux of f0.5–10, AGN < 1.49 × 10⁻¹³ erg s−1 cm−2, assuming z = 0.002 72, |$N_{\rm {H}}^{\rm {Gal}}$| = 1.90 × 1020 cm−2 (Kalberla et al. 2005), and Γ = 1.8. The flux measured from the XMM–Newton data, i.e. ∼1.3 × 10⁻¹³ erg s−1 cm−2 (Cappi et al. 2006), is consistent with this upper limit, which could be an indication that the AGN has not significantly varied; however, we could not rule out variability towards lower fluxes. The upper limit count rate measured for the ULX is CR0.5–10, ULX < 4.41 × 10⁻³ counts s−1, corresponding to an upper limit flux of f0.5–10, ULX < 1.66 × 10⁻¹³ erg s−1 cm−2. The flux measured for the ULX from the archival XMM–Newton data, i.e. ∼7.7 × 10⁻¹⁴ erg s−1 cm−2 (Foschini et al. 2002), is also consistent with the upper limit measured with our new data.
Although the AGN in NGC 3486 is not significantly detected in our NuSTAR data, we extracted the spectra to assist our broad-band X-ray spectral analysis of the source with the archival XMM–Newton data. We extracted the XMM–Newton spectra of the AGN from the three EPIC cameras (PN, MOS1, and MOS2) using a circular source region of 10 arcsec in radius (to avoid the ULX), centred on the optical position of the AGN obtained from the Sloan Digital Sky Survey Catalog (RA = 11:00:23.87, Dec =+28:58:30.49). The background photons were measured in an annular segment around the source, with inner and outer radii of 15 and 30 arcsec, respectively, avoiding the ULX emission. For the NuSTAR data, we extracted the spectra from both FPMs using a 20 arcsec-radius circular region for the source, and an annular segment with inner and outer radii of 50 and 100 arcsec for the background spectrum. For our spectral analysis, we did not use the Swift-XRT data as they do not provide additional constraints beyond those already achieved by the XMM–Newton and NuSTAR data. We show the X-ray RGB images of NGC 3486 in Fig. 6.
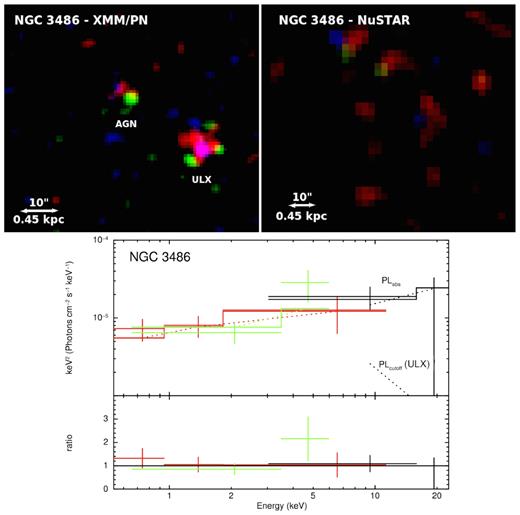
Top: XMM–Newton and NuSTAR RGB images of NGC 3486 (XMM–Newton – Red: 0.5–1 keV, Green: 1–2 keV, Blue: 2–10 keV; NuSTAR – Red: 3–10 keV, Green: 10–15 keV, Blue: 15–24 keV). The spectra were extracted using a 20 arcsec-radius region for both NuSTAR and XMM–Newton, centred on the optical position of the AGN. The images are smoothed with a Gaussian function of radius 3 pixels, corresponding to 9.6 and 7.4 arcsec for Chandra and NuSTAR, respectively. North is up and east is to the left in all images. Bottom: Best-fitting model to the combined NuSTAR (black), XMM–Newton PN (red), and MOS1+2 (green) data of NGC 3486. The data have been rebinned to a minimum of 3σ significance with a maximum of 500 bins for visual clarity. The spectra were fitted using an absorbed power-law model to simulate the AGN emission, and a cut-off power law to account for possible contamination by the ULX in the NuSTAR spectrum. The model components fitted to the data are shown as dotted curves, and the combined model fit is shown as solid curves.
2.3.3 X-ray spectral fitting
Due to the low quality of the archival XMM–Newton data and our NuSTAR data of NGC 3486 (∼75 counts and not significantly detected, respectively), we modelled its spectra between 0.5 and 24 keV using a simple power-law model, absorbed by a fixed Galactic column, |$N_{\rm {H}}^{\rm {Gal}}$| = 1.90 × 1020 cm−2 (Kalberla et al. 2005), with an additional absorption component, zwabs, to simulate the intrinsic absorption of the source. We fixed the redshift to z = 0.002 272 in our model. Although the nearby ULX is not significantly detected in the NuSTAR data, faint emission consistent with the ULX position can be seen in the NuSTAR 3–8 keV image (see Fig. 6). Therefore, we include a cut-off power-law component in our model to account for the ULX contribution in the NuSTAR data. We set the photon index of the ULX to that measured by Foschini et al. (2002) using the XMM–Newton data (i.e. ΓULX = 2.2), assuming that it has not significantly varied between the XMM–Newton and NuSTAR observations, and fixed the X-ray energy cut-off at 10 keV, consistent with that found in other ULXs (e.g. Bachetti et al. 2013; Walton et al. 2013; Walton et al. 2014; Rana et al. 2015). The flux normalization of the component was left free to vary.11 We did not include any additional components (e.g. apec) to model potential additional non-AGN emission at the soft energies as they could not be constrained.
The best-fitting photon index and column density measured by our model for the AGN are Γ = 1.52|$^{+0.43}_{-0.24}$| and NH ≤ 1.37 × 1021 cm−2 (C-stat/d.o.f = 27/34), respectively. The column density measured indicates that NGC 3486 is unobscured, and is a very low luminosity AGN with an intrinsic luminosity of L2–10 keV,int = 3.84 × 1038 erg s−1. If we fitted our model only to the XMM–Newton data, in which the AGN and the ULX are better resolved, we obtained consistent results. Our analysis disagree with the previous suggestions that the source is likely to be CT by previous low X-ray energy studies (Cappi et al. 2006; Brightman & Nandra 2008). Furthermore, we predict that the AGN would have been about an order of magnitude brighter in the NuSTAR 3–24 keV band if it were CT (assuming the torus model with NH = 1.5 × 1024 cm−2). However, the non-detection of the source in the NuSTAR observation could also indicate a heavily CT source with NH ≥ 1025 cm−2.
We show the spectra for NGC 3486 and our best-fitting model in Fig. 6. The unobscured nature of NGC 3486 as revealed by our spectral analysis contradicts with the optical type 2 classification of the source. Therefore, the AGN could be a candidate for a ‘true’ type 2 AGN, i.e. an AGN in which the BLR is genuinely absent (e.g. Panessa et al. 2009; Trump et al. 2011; Bianchi et al. 2012). However, it should be noted that high-sensitivity observations have recently revealed BLRs in sources previously thought to be true type 2 AGNs (e.g. Bianchi et al. 2019).
2.4 NGC 5195
NGC 5195 (also known as M51b), located at a distance of 8.3 Mpc, is an irregular galaxy interacting with NGC 5194 (M51a). The nucleus is classified as a LINER in the optical band, and the galaxy has been observed numerous times in X-rays by Chandra, XMM–Newton, and NuSTAR, most of the time as part of the overall M51 system. While much of the attention of previous studies has focused on its brighter and more picturesque companion, NGC 5195 came to widespread attention in recent years when it was observed to undergo a violent X-ray outburst, potentially associated with AGN feedback (Schlegel et al. 2016). Its companion, NGC 5194, has been confirmed to be a low-luminosity CT AGN using multiple X-ray data sets including NuSTAR (Xu et al. 2016). A variable ULX (ULX-7), identified in the northern spiral arm of NGC 5194, was recently identified to be powered by neutron star (Brightman et al. 2020; Rodríguez Castillo et al. 2020). We observed NGC 5195 as part of the M51 system with NuSTAR in 2017 (Brightman et al. 2018). Based on Fig. 1, the observed X-ray luminosity of the source measured from archival data is significantly lower than that expected from the [Ne v] line emission, suggesting that the nuclear source is heavily buried.
2.4.1 High-spatial resolution mid-IR observation
As opposed to its more famous companion NGC 5194, NGC 5195 has not been observed at mid-IR wavelengths at high spatial resolution. However it is detected by WISE (Wright et al. 2010), and the W3 band (12 μm) luminosity measured from the profile fitting photometry, tracing the unresolved component, is L12 μm, WISE = 7.94 × 1041 erg s−1 (Cutri & et al. 2013), which we regard here as upper limit on the nuclear mid-IR flux since the low angular resolution of WISE means that the host galaxy could contaminate the mid-IR emission from the AGN.
2.4.2 X-ray observations and data extraction
We observed the M51 system with NuSTAR (PI: M. Brightman; ObsID: 60201062002 and 60201062003; texp = 47.2 and 163 ks, respectively), coordinated with Chandra (ObsID 19522; 38.2 ks) in 2017 March. Our Chandra data revealed two point sources within ∼5 arcsec of the radio position of NGC 5195 (RA = 13:29:59.534 ± 1 mas and Dec. = +47:15:57.33 ± 10 mas; Rampadarath et al. 2018), which were not resolved in previous observations (e.g. Terashima & Wilson 2001; Schlegel et al. 2016; see Fig. 7). This is likely due to the fact that NGC 5195 has generally been located off-axis in previous Chandra observations, where the point spread function is larger. We used wavdetect to determine the centroid position of the two central sources in the Chandra energy band of 2–8 keV. Based on this, we found that one of the Chandra sources is located at position of RA = 13:29:59.41 and Dec. = +47:15:57.29, with formal wavdetect errors of 0|${_{.}^{\prime\prime}}$|10 and 0|${_{.}^{\prime\prime}}$|10 (see footnote 7), respectively, consistent with the e-MERLIN position of the nucleus within ∼1.5 arcsec. Therefore, we used the position of this Chandra source when extracting the X-ray spectra of the AGN. The other point source (off-nuclear) was detected at RA = 13:29:59.21 and Dec. = +47:16:00.01, with formal wavdetect errors of 0|${_{.}^{\prime\prime}}$|19 and 0|${_{.}^{\prime\prime}}$|11 (see footnote 7), respectively.
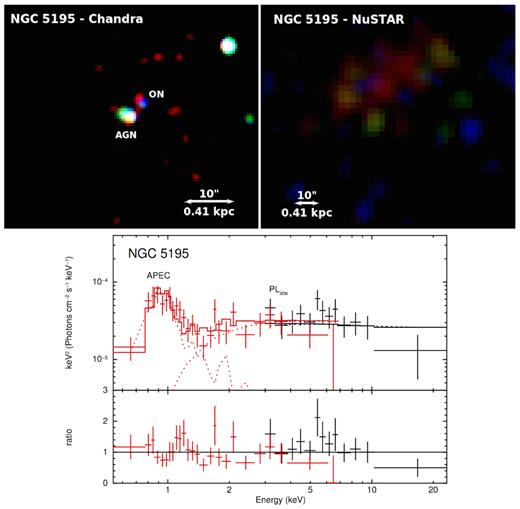
Top: Chandra and NuSTAR RGB images of NGC 5195 (Chandra – Red: 0.5–1 keV, Green: 1–2 keV, Blue: 2–8 keV; NuSTAR – Red: 3–10 keV, Green: 10–15 keV, Blue: 15–24 keV). The spectra were extracted using a 20 arcsec-radius region for both NuSTAR and Chandra. The images are smoothed with a Gaussian function of radius 3 pixels, corresponding to 1.5 and 7.4 arcsec for Chandra and NuSTAR, respectively. North is up and east is to the left in all images. Bottom: Best-fitting model to the combined NuSTAR (black) and Chandra (red) data of NGC 5195. The data have been rebinned to a minimum of 3σ significance with a maximum of 500 bins for visual clarity. The spectra were fitted using an absorbed power-law model, an apec component to model the emission at the softest energies, and an additional power-law component to model the off-nuclear source at the north-west of the AGN (labelled as ON in the image – this component is not visible in the plot as the flux normalization is very low). The model components fitted to the data are shown as dotted curves, and the combined model fit is shown as solid curves.
A source near the Chandra position of the AGN was detected in both of the NuSTAR observations, with significant counts up to ∼10 keV. The combined NuSTAR RGB image of the source is shown in Fig. 7. The count rate detected in the combined NuSTAR data in the 3–10 keV band is 4.59 × 10⁻⁴ counts s−1. This source could be associated with either the AGN or the off-nuclear source. We extracted the NuSTAR spectra using a 20 arcsec-radius circular region adopting the Chandra position of the AGN as the centroid position. The background was extracted using a 100 arcsec-radius aperture from an offset source-free region. The Chandra spectrum was also extracted using a 20 arcsec-radius circular region to match the NuSTAR extraction region. The background for the Chandra spectrum was extracted using a circular region of 50 arcsec radius from a source-free area. In addition, we also extracted the spectrum of the off-nuclear point source detected within the extraction region of the Chandra data to account for its contribution to the extracted spectra. The source flux was extracted using a small 1.5 arcsec-radius region, and the background flux was extracted using a 50 arcsec-radius aperture from a source-free region.
2.4.3 X-ray spectral fitting
For the spectral analysis of NGC 5195, we did not include its archival NuSTAR data (2012 October 29; ObsID 60002038002; texp = 16.7 ks) as we found that the source fluxes in the 3–8 keV bands are different from each other within the statistical uncertainties at 90 |${{\ \rm per\ cent}}$| confidence limit, i.e. L3–8 keV, obs = 0.55|$^{+0.09}_{-0.07}$| × 10−13 and 1.08|$^{+0.49}_{-0.41}$| × 10−13 erg s−1 cm−2, for our new data and the archival data, respectively. Investigation of the older Chandra data of NGC 5195, in which the nucleus and the off-nuclear source were unresolved by Rampadarath et al. (2018), also revealed that the nucleus has varied by a factor of ∼3 between data taken in 2000 and 2012. The flux variability may be attributed to either the AGN or the nearby off-nuclear source. Because of this, we also did not include the older Chandra data in our analysis.
We first constrained the contribution from the off-nuclear source detected near the AGN in the Chandra data (see Fig. 7). We took the same basic approach as for ESO 121-G6 by modelling the source between 0.5 and 8 keV using a simple power-law model, absorbed by the host galaxy and the Galactic column, |$N_{\rm {H}}^{\rm {Gal}}$| = 1.79 × 1020 cm−2 (Kalberla et al. 2005), assuming that it is located within NGC 5195 (z = 0.001 551). The best-fitting photon index and host galaxy absorption measured by the model for the off-nuclear source are Γ = 0.48|$^{+0.81}_{-0.65}$| and NH < 5.61 × 1021 cm−2, respectively (C-stat/d.o.f = 26/25). The 0.5–8 keV intrinsic luminosity inferred from the model is L0.5–8 keV, int = 1.61|$^{+0.93}_{-0.33}$| × 1038 erg s−1, lower than the luminosity limit for a ULX, suggesting that the off-nuclear source is more likely to be an X-ray binary. The photon index measured, however, is quite low for an X-ray binary (typically Γ ∼ 2; e.g. Yang et al. 2015), even after accounting for the statistical uncertainties.
We then modelled the broad-band X-ray spectrum of the AGN between 0.5 and 24 keV using a power-law model absorbed by the Galactic and intrinsic absorption (zwabs), an apec component to model the soft energy emission, and the off-nuclear source component to account for its contribution in the extracted spectrum of the AGN. The photon index and host galaxy absorption of the off-nuclear source were fixed to the values measured earlier, but the flux normalization parameter was left free to vary in the spectral analysis. Based on this model, we measured an obscuring column density of NH = 1.17|$^{+1.75}_{-0.99}$| × 1022 cm−2 (C-stat/d.o.f = 226/243), indicating that the AGN is just mildly obscured (potentially unobscured within the statistical uncertainties), and is therefore a very low luminosity AGN (L2–10 keV,int = 6.60 × 1038 erg s−1), similar to NGC 3486. The best-fitting photon index measured is Γ = 2.12|$^{+0.61}_{-0.23}$|, and the apec thermal component indicated a plasma temperature of kT = 0.95|$^{+0.08}_{-0.16}$| keV. In general, our results are in agreement with those found by Brightman et al. (2018) and Rampadarath et al. (2018), who fitted the same data using slightly different models. We show the broad-band X-ray spectra of NGC 5195 in Fig. 7.
3 DISCUSSION
In this paper, we presented broad-band X-ray spectral fittings of four AGNs with L2–10 keV,obs ≈ 1039 erg s−1 at D ≤ 15 Mpc to investigate the nature of their obscuration and intrinsic power. Fig. 8 shows a plot of the intrinsic 2–10 keV luminosity versus NH values measured for the AGN. It can be clearly seen from this figure that two of the AGNs, i.e. ESO 121-G6 and NGC 660, are heavily obscured, and the remaining two, NGC 3486 and NGC 5195, appear to be unobscured and mildly obscured, respectively, and intrinsically LLAGNs (L2–10 keV,int < 1040 erg s−1). In this section, we further investigate the results obtained from our X-ray spectral fitting with an X-ray spectral curvature (SC) analysis (Section 3.1) and undertake a joint comparison of the AGN X-ray and mid-IR data (Section 3.2). We then look at the Eddington ratios of the AGN, and discuss the difference between the heavily obscured AGN and the genuine LLAGN (Section 3.3).
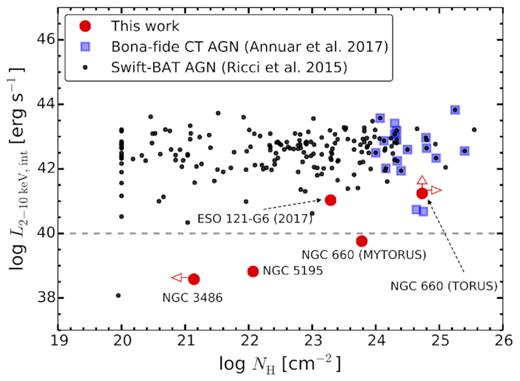
Intrinsic 2–10 keV luminosity versus NH plot for the AGN presented in this work (red), and the Swift-BAT AGN located at D ≤ 100 Mpc (black; Ricci et al. 2015). The dashed line indicates the luminosity threshold we use to define LLAGN. The blue squares mark the bona fide CT AGN from Annuar et al. (2017).
3.1 X-ray SC analysis
Koss et al. (2016) developed an SC analysis technique that uses weighted averages of different energy bands above 10 keV to estimate the Compton thickness of an AGN. For CT AGN, the SC value calculated is SCCT ≥ 0.4 (Koss et al. 2016; Baronchelli et al. 2017). We applied this technique to the two AGNs in our sample that are detected at E > 10 keV, i.e. ESO 121-G6 and NGC 660. For ESO 121-G6, we determined an SC value of 0.10 ± 0.02, indicating that it is not a CT AGN, in support of our X-ray spectral modelling of the AGN. For NGC 660, however, we inferred an SC value of 0.31 ± 0.13, i.e. consistent with CT absorption within the statistical uncertainties. These constraints are also consistent with our X-ray spectral modelling of the source in which we found both Compton-thin and Compton-thick solutions. On the basis of our X-ray analyses, it is therefore clear that NGC 660 is heavily obscured and may be a CT AGN. We therefore consider the NH value measured from the best-fitting MY torus model (i.e. NH = 6.09|$^{+3.19}_{-2.43}$| × 1023 cm−2) as a lower limit column density for this source. The intrinsic luminosity measured from the best-fitting MY torus model (i.e. L2–10 keV,int = 5.74 × 1039 erg s−1) should therefore also be considered as a lower limit.
3.2 X-ray and mid-IR data
To further investigate the nature of the AGN in our sample, we complement the X-ray analysis of the sources with archival and new high-angular resolution mid-IR data. The mid-IR continuum emission from an AGN is produced as a result of heating by the X-ray to optical (mainly ultraviolet) radiation emitted from the accretion disc. Therefore, it can be used to provide an accurate estimate for the intrinsic X-ray luminosity of the AGN, even when heavily obscured (e.g. Gandhi et al. 2009). Given the low luminosity of these AGNs, even the detection of compact mid-IR emission is important as it indicates that a dusty torus is present in these systems. However, mid-IR emission from an AGN can be contaminated by dust surrounding young forming stars. Therefore, high-angular resolution observations are crucial in resolving the AGN emission from these contaminating sources. In Figs 9 and 10, we compare the intrinsic 2–10 keV luminosities measured for the AGN from our X-ray analyses, with their 12 μm and [Ne v] luminosities, respectively. Below we detail and discuss the mid-IR and X-ray results for each AGN.
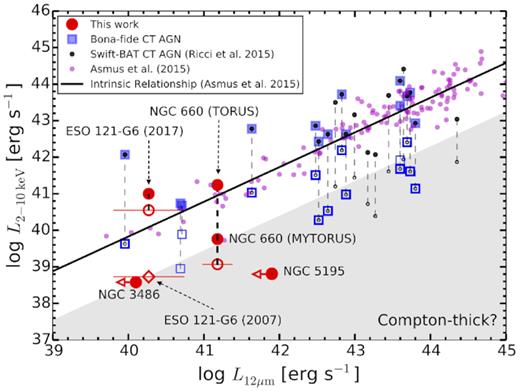
The 2–10 keV versus 12 μm luminosities of the AGN presented in this work. The solid line corresponds to the intrinsic relationship derived by Asmus et al. (2015) (σ ≈ 0.3 dex). The AGN sample used by Asmus et al. (2015) to construct their relationship is plotted in magenta. The open and filled red circles indicate the observed and intrinsic 2–10 keV luminosities of our AGN as measured from X-ray spectroscopy, respectively. For CT AGN, the X-ray emission that we observed is generally attributed to X-ray photons that are scattered or reflected from the back side of the torus, which consists of just a few per cent of the intrinsic power of the AGN in the 2–10 keV band (e.g. Iwasawa, Fabian & Matt 1997; Matt et al. 2000; Baloković et al. 2014; Annuar et al. 2017). The grey shaded region represents a factor of 25× suppression of X-ray flux, which we have adopted as an indirect diagnostic for CT AGN (e.g. Alexander et al. 2008; Rovilos et al. 2014). The black circles and blue squares indicate the Swift-BAT CT AGN (Ricci et al. 2015) and bona fide local CT AGN (adopted from Annuar et al. 2017). The 12 μm luminosities for all AGNs are obtained from high-angular resolution mid-IR observations with the exception of NGC 5195, for which an upper limit was obtained from WISE.
![The 2–10 keV luminosity versus [Ne v] λ14.3 μm luminosity plot adapted from Fig. 1 (right-hand panel) to show the intrinsic 2–10 keV luminosity of the AGN presented in this work. The open and filled red circles indicate the observed and intrinsic 2–10 keV luminosities of our AGN as measured from X-ray spectroscopy, respectively.](https://oup.silverchair-cdn.com/oup/backfile/Content_public/Journal/mnras/497/1/10.1093_mnras_staa1820/1/m_staa1820fig10.jpeg?Expires=1750341040&Signature=4kGoH-jw5YLjucTZq6fUG2IV4~mw-TvrecDqhujWUF3dazxNAZVUBePNTkN7zg5oKblOV0jhu5POHnuDPFKRs6PQN2Wzo-570buWI70utizIMSs7js-SrrxAqBmqRMC3SWcDib4wwFFQ~L7y1GySzqAtikGId8ZXVwOllg9DKeQi~yUYkIk6Ex1RldINSo7CI1a2sseacnUQAVBAqdEcVcFXwlsJNsD-DfM~LbKgFWwJdCqcbl38Fkf1v~WYO7Wh~NnGV40wccUF9bKurnmHzGdEHPMMDGIRqiX913DXC7~SyxgstH7tWOSDiv-Prfv5RimIEuQKzqsyII3jve2pMA__&Key-Pair-Id=APKAIE5G5CRDK6RD3PGA)
The 2–10 keV luminosity versus [Ne v] λ14.3 μm luminosity plot adapted from Fig. 1 (right-hand panel) to show the intrinsic 2–10 keV luminosity of the AGN presented in this work. The open and filled red circles indicate the observed and intrinsic 2–10 keV luminosities of our AGN as measured from X-ray spectroscopy, respectively.
ESO 121-G6: The intrinsic luminosity measured for ESO 121-G6 using our X-ray data is found to be consistent with that predicted by the 2–10 keV:12 μm intrinsic relationship of Asmus et al. (2015) (Fig. 9) and 2–10 keV:[Ne v] correlation derived by Weaver et al. (2010) (Fig. 10). It can also be seen from Fig. 9 that the observed 2–10 keV luminosity of the AGN measured from the XMM–Newton data in 2007 is significantly lower than our more recent X-ray data, and lies in the grey region of the plot, suggesting that the AGN may have been CT at the time of this XMM–Newton observation. The steep X-ray spectral slope measured (Γ = 1.74|$^{+1.14}_{-1.26}$|) in a CT scenario would require that ESO 121-G6 was heavily CT (NH >1025 cm−2) and only scattered X-ray emission was detected, which would also explain the drop in X-ray flux by ∼2 orders of magnitude. However, we cannot confirm this interpretation from the current data, and it is also possible that the AGN was unobscured and in a low luminosity state in 2007. Long-term monitoring with NuSTAR and XMM–Newton or Chandra is required to better constrain the physical origin of the variability of ESO 121-G6.
NGC 660: The intrinsic luminosity we measured for NGC 660 from the best-fitting MY torus model is significantly lower than that estimated from its 12 μm luminosity (see Fig. 9). However, the intrinsic luminosity inferred using the torus model, which measured a CT column density, is in agreement with that predicted by the Asmus et al. (2015) relationship (see Fig. 9). This is also the case when comparing the intrinsic X-ray luminosities of the AGN from the two models with its [Ne v] line luminosity (see Fig. 10). Therefore, considering both the mid-IR and X-ray data, we favour the CT solution from the torus model to explain the X-ray emission from NGC 660. In fact, if we fixed the power-law normalization of the MY torus model so that the intrinsic luminosity of the AGN agrees with that estimated by the 12 μm luminosity, we are also able to find an acceptable fit (C-stat/d.o.f = 196/188), which gives a CT column density of NH = 5.71|$^{+2.10}_{-1.06}$| × 1024 cm−2, consistent with the lower limit measured with the torus model. Longer X-ray observations, particularly at hard X-ray energies, will be required to unambiguously confirm this.
NGC 3486: The low X-ray luminosity, non-detection by NuSTAR at >8 keV, and lack of X-ray absorption signatures suggest that NGC 3486 could be a genuine LLAGN. However, these data are also consistent with a heavily CT AGN (NH >1025 cm−2) where the observed X-ray emission is scattered. Mid-IR data can help distinguish between these two competing scenarios since a heavily CT AGN would be intrinsically luminous and hence bright in the mid-IR waveband in comparison to the X-ray emission. NGC 3486 is undetected in the high-resolution mid-IR observations and the upper limit X-ray:12 μm luminosity ratio places it just below the threshold for a mild CT absorption (NH ∼ 1024 cm−2; see Fig. 9). Consequently, we believe that the non-detection of NGC 3486 in the mid-IR emission is more consistent with a LLAGN than a heavily CT AGN.
NGC 5195: Unfortunately, NGC 5195 lacks high-spatial resolution mid-IR data, limiting the sensitivity of any mid-IR:X-ray analyses. The current upper limit on the WISE AGN luminosity is unable to distinguish between a Compton-thick and Compton-thin solution. However, we note that the X-ray data analyses themselves already strongly argue for a mildly obscured scenario (NH ∼ 1022 cm−2).
The 2–10 keV luminosity from the AGN in both NGC 3486 and NGC 5195 is lower than that expected given their [Ne v] luminosities (see Fig. 10). While this could indicate that the AGN is intrinsically more luminous than that suggested by the X-ray luminosity, this interpretation would be inconsistent with the evidence we have presented on these two objects. An alternative scenario is that other extreme processes within the host galaxy (e.g. stellar processes and supernovae) are significantly contributing to the [Ne v] line luminosity measured (Contini 1997; Georgakakis et al. 2011; Izotov, Thuan & Privon 2012; Greene, Strader & Ho 2019). This could be further investigated in the future using high-angular resolution mid-IR observations, such as by the James Webb Space Telescope (JWST) Mid-IR Instrument, which might allow us to spatially resolve the [Ne v] line emission in this galaxy and investigate its origin.
3.3 Lbol versus MBH
Fig. 11 shows a plot of bolometric luminosity (Lbol) versus black hole mass (MBH) for the AGN presented in this work. The bolometric luminosities for the AGN in our sample were estimated using the absorption-corrected 2–10 keV luminosities and assuming the bolometric correction (κ) relationship determined by Nemmen, Storchi-Bergmann & Eracleous (2014) for LLAGN [i.e. κ ≈ 13 (L2–10 keV,int/1041 erg s−1)−0.37]. The black hole masses were measured using different methods, i.e. ESO 121-G6 and NGC 3486 using the bulge luminosities (Goulding et al. 2010; McKernan et al. 2010, respectively), while NGC 660 and NGC 5195 were determined using the stellar velocity dispersion (Barth, Ho & Sargent 2002; Ho et al. 2009, respectively). Based on this figure, we can see that the two AGNs that were found to be heavily obscured (i.e. ESO 121-G6 and NGC 660) are accreting material at a considerably higher rate (i.e. λEdd = Lbol/LEdd ≳ 10−3, assuming the torus model for NGC 660) than the other two unobscured intrinsically LLAGNs.
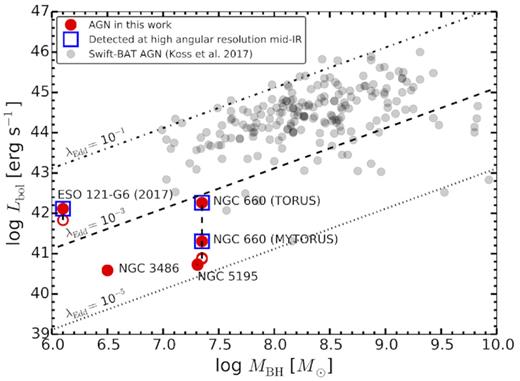
The bolometric luminosity versus MBH for the AGN presented in this work (red; the open and filled circles indicate observed and intrinsic luminosities, respectively), and the Swift-BAT AGN sample (grey; Koss et al. 2017). Open blue squares mark AGNs in this work that are detected at high-spatial resolution mid-IR observations. The dashed–dot, dashed, and dotted lines indicate constant Eddington ratios (Lbol/LEdd) of λEdd = 10−1, 10−3, and 10−5, respectively.
4 CONCLUSION AND FUTURE WORK
In this paper, we presented NuSTAR observations for four AGNs located at D ≤ 15 Mpc with observed X-ray luminosities of L2–10 keV,obs ≲ 1039 erg s−1. We combined our NuSTAR data with low energy data from Chandra (contemporaneous in most cases) or XMM–Newton, and performed broad-band X-ray spectral fitting of the AGN to directly measure their column densities in order to determine whether they are genuinely LLAGNs (L2–10 keV,int < 1040 erg s−1) or deeply buried AGNs. Based on the constraints from our spectral modelling, we determined that two of the AGNs, i.e. ESO 121-G6 and NGC 660, are heavily obscured, and the remaining two, i.e. NGC 3486 and NGC 5195, appear to be unobscured and mildly obscured, respectively, and intrinsically LLAGN. Both the heavily obscured AGNs are detected at high spatial resolution in the mid-IR, indicating the presence of obscuring dust. Both the LLAGNs, however, lack mid-IR detection at high angular resolution (one which has been imaged in such mode but was not detected, and one has not yet been imaged in such mode). We therefore could not constrain the existence of torus for these objects at this wavelength. More sensitive observations using JWST, for example, will be required to provide a firm constraint.
From our X-ray spectral analysis, we also found that ESO 121-G6 could be a candidate for a changing-look AGN in X-rays, and that NGC 660 is a likely CT AGN. In addition, we also suggested that NGC 3486 could be a true type 2 AGN (i.e. AGN with no BLR), as its X-ray classification (unobscured) is at odds with its optical Type 2 Seyfert classification. However, further deeper (and monitoring for ESO 121-G6) observations at different wavelengths (e.g. optical and X-rays) need to be carried out for these AGNs in order to confirm these findings.
These four AGNs are a part of our nearby AGN sample located within D ≤ 15 Mpc. In our next paper, we will present our NuSTAR data and X-ray analysis results for the remaining (four) AGNs in our sample that lack reliable NH measurements previously. We will also combine our results for the whole D ≤ 15 Mpc AGN sample to form detail overview and overall census of the CT AGN population and the NH distribution of AGN in the local universe. This will be important towards our understanding of the overall AGN population and the CXB radiation.
ACKNOWLEDGEMENTS
We acknowledge financial support from the Ministry of Higher Education Malaysia Fundamental Research Grant Scheme grant code FRGS/1/2019/STG02/UKM/02/7 (AA), the Science and Technology Facilities Council grant codes ST/P000541/1 and ST/T000244/1 (DMA), and ST/R000506/1 (PG). FEB acknowledges support from the CONICYT grant CATA-Basal AFB-170002, FONDECYT Regular 1190818 and 1200495, and Chile’s Ministry of Economy, Development, and Tourism’s Millennium Science Initiative through grant IC120009, awarded to The Millennium Institute of Astrophysics, MAS. DA acknowledges funding through the European Union’s Horizon 2020 and Innovation programme under the Marie Sklodowska-Curie grant agreement no. 793499 (DUSTDEVILS). MB acknowledges support from the Black Hole Initiative at Harvard University, which is funded in part by the Gordon and Betty Moore Foundation (grant GBMF8273) and in part by the John Templeton Foundation. CR acknowledges support from the CONICYT+PAI Convocatoria Nacional subvencion a instalacion en la academia convocatoria año 2017 PAI77170080, and Fondecyt Iniciacion grant 11190831. PB acknowledges financial support from the STFC and the Czech Science Foundation project no. 19-05599Y. EN acknowledges financial contribution from the agreement ASI-INAF n.2017-14-H.0 and partial support from the EU Horizon 2020 Marie Skłodowska-Curie grant agreement no. 664931.
NuSTAR is a project led by the California Institute of Technology (Caltech), managed by the Jet Propulsion Laboratory (JPL), and funded by the National Aeronautics and Space Administration (NASA). We thank the NuSTAR Operations, Software and Calibrations teams for support with these observations. This research has made use of the NuSTAR Data Analysis Software (nustardas) jointly developed by the ASI Science Data Center (ASDC, Italy) and the California Institute of Technology (USA). The scientific results reported in this article are based on observations made by the Chandra X-ray Observatory and data obtained from the Chandra Data Archive. This research has made use of software provided by the Chandra X-ray Center (CXC) in the application packages CIAO. This work was also based on observations obtained with XMM–Newton, an ESA science mission with instruments and contributions directly funded by ESA Member States and NASA. Besides these, we also used observations collected at the European Organisation for Astronomical Research in the Southern hemisphere under ESO programme 0101.B-0386(A).
This research made use of Astropy,12 a community-developed core Python package for Astronomy (Astropy Collaboration 2013; Astropy Collaboration 2018). We also used data obtained through the High Energy Astrophysics Science Archive Research Center (HEASARC) Online Service, provided by the NASA/Goddard Space Flight Center, and the NASA/IPAC extragalactic Database (NED) operated by JPL, Caltech under contract with NASA.
Facilities: Chandra, Gemini, NuSTAR, Swift, VLT, WISE, and XMM–Newton.
DATA AVAILABILITY
The data used in this paper are publicly available to access and download as follows:
X-ray data
From NASA’s High Energy Astrophysics Science Archive Research Center (https://heasarc.gsfc.nasa.gov/docs/archive.html). Details of the observations, including the observation identification numbers, are listed in Table 2.
Mid-IR data
ESO121-G6: From the Gemini Observatory Archive (https://archive.gemini.edu/searchform); Program ID: GS-2010B-Q-3; PI: F. Bauer.
NGC 660: From the European Southern Observatory Science Archive Facility (http://archive.eso.org/eso/eso_archive_main.html); Program ID: 0101.B-0386(A); PI: A. Annuar.
Footnotes
Further details on the NuSTAR data analysis procedure can be found at https://heasarc.gsfc.nasa.gov/docs/nustar/analysis/nustar_swguide.pdf.
More details on the addascaspec script can be found at https://heasarc.gsfc.nasa.gov/docs/asca/adspecinfo.html.
The xselect user guide can be found at https://heasarc.gsfc.nasa.gov/ftools/xselect/xselect.html.
Further details on the grppha task can be found at https://heasarc.gsfc.nasa.gov/docs/journal/grppha4.html.
The host galaxy inclination was obtained from the HyperLeda website (http://leda.univ-lyon1.fr/).
The Chandra positional errors quoted represent 1σ statistical errors estimated by wavdetect. These positional errors do not take into account of additional uncertainties in the source position such as the signal-to-noise ratio, off-axis angle, and astrometric uncertainties. Hence, the true uncertainty on the X-ray source position is likely to be larger than those quoted (i.e. of the order of 0|${_{.}^{\prime\prime}}$|3–0|${_{.}^{\prime\prime}}$|6; see section 3.4.1 of Alexander et al. 2003). We therefore assume a positional uncertainty of 0|${_{.}^{\prime\prime}}$|6 for the Chandra sources.
We note that the flux normalization of the off-nuclear source is consistent with that measure using the Chandra data alone with smaller aperture size.
The XRT data were reduced using the xrtpipeline v0.13.0, which is part of the XRT Data Analysis Software (xrt-das) within heasoft.
webpimms is a mission count rate simulator tool, available online at https://heasarc.gsfc.nasa.gov/cgi-bin/Tools/w3pimms/w3pimms.pl.
We note that the flux normalization of the off-nuclear source is slightly lower than that measured in the Chandra data alone using smaller aperture, but is consistent within 99 |${{\ \rm per\ cent}}$| confidence level.
