-
PDF
- Split View
-
Views
-
Cite
Cite
Abhik Ghosh, Florent Mertens, Gianni Bernardi, Mário G Santos, Nicholas S Kern, Christopher L Carilli, Trienko L Grobler, Léon V E Koopmans, Daniel C Jacobs, Adrian Liu, Aaron R Parsons, Miguel F Morales, James E Aguirre, Joshua S Dillon, Bryna J Hazelton, Oleg M Smirnov, Bharat K Gehlot, Siyanda Matika, Paul Alexander, Zaki S Ali, Adam P Beardsley, Roshan K Benefo, Tashalee S Billings, Judd D Bowman, Richard F Bradley, Carina Cheng, Paul M Chichura, David R DeBoer, Eloy de Lera Acedo, Aaron Ewall-Wice, Gcobisa Fadana, Nicolas Fagnoni, Austin F Fortino, Randall Fritz, Steve R Furlanetto, Samavarti Gallardo, Brian Glendenning, Deepthi Gorthi, Bradley Greig, Jasper Grobbelaar, Jack Hickish, Alec Josaitis, Austin Julius, Amy S Igarashi, MacCalvin Kariseb, Saul A Kohn, Matthew Kolopanis, Telalo Lekalake, Anita Loots, David MacMahon, Lourence Malan, Cresshim Malgas, Matthys Maree, Zachary E Martinot, Nathan Mathison, Eunice Matsetela, Andrei Mesinger, Abraham R Neben, Bojan Nikolic, Chuneeta D Nunhokee, Nipanjana Patra, Samantha Pieterse, Nima Razavi-Ghods, Jon Ringuette, James Robnett, Kathryn Rosie, Raddwine Sell, Craig Smith, Angelo Syce, Max Tegmark, Nithyanandan Thyagarajan, Peter K G Williams, Haoxuan Zheng, Foreground modelling via Gaussian process regression: an application to HERA data, Monthly Notices of the Royal Astronomical Society, Volume 495, Issue 3, July 2020, Pages 2813–2826, https://doi.org/10.1093/mnras/staa1331
Close - Share Icon Share
ABSTRACT
The key challenge in the observation of the redshifted 21-cm signal from cosmic reionization is its separation from the much brighter foreground emission. Such separation relies on the different spectral properties of the two components, although, in real life, the foreground intrinsic spectrum is often corrupted by the instrumental response, inducing systematic effects that can further jeopardize the measurement of the 21-cm signal. In this paper, we use Gaussian Process Regression to model both foreground emission and instrumental systematics in ∼2 h of data from the Hydrogen Epoch of Reionization Array. We find that a simple co-variance model with three components matches the data well, giving a residual power spectrum with white noise properties. These consist of an ‘intrinsic’ and instrumentally corrupted component with a coherence scale of 20 and 2.4 MHz, respectively (dominating the line-of-sight power spectrum over scales k∥ ≤ 0.2 h cMpc−1) and a baseline-dependent periodic signal with a period of ∼1 MHz (dominating over k∥ ∼ 0.4–0.8 h cMpc−1), which should be distinguishable from the 21-cm Epoch of Reionization signal whose typical coherence scale is ∼0.8 MHz.
1 INTRODUCTION
Observations of the redshifted 21-cm signal from neutral Hydrogen hold the promise of revealing the detailed astrophysical processes occurring during the Epoch of Reionization (EoR) and the Cosmic Dawn (CD). The 21-cm signal can provide insights into the formation and evolution of the first structures in the Universe (see e.g. Furlanetto, Oh & Briggs 2006; Morales & Wyithe 2010; Pritchard & Loeb 2012; Mellema et al. 2013, for reviews): for example, when the intergalactic medium (IGM) is still largely neutral, it is a sensitive probe of the first sources of Ly α and X-ray radiation (Mesinger & Furlanetto 2007; Santos et al. 2010, 2011; McQuinn & O’Leary 2012; Fialkov, Barkana & Visbal 2014; Fialkov et al. 2017) and, during the subsequent EoR, its large-scale fluctuations map the evolution of the global ionization fraction (Lidz et al. 2008; Bolton et al. 2011). The 21-cm emission gives insights into the nature of formation of the first stars, galaxies, and their impact on the physics of the IGM (Loeb & Furlanetto 2013; Zaroubi 2013).
At present, several experiments are attempting to detect the power spectrum of the 21-cm signal from the EoR (e.g. GMRT,1 LOFAR,2 MWA,3 PAPER4) or the sky-averaged 21-cm emission using a single dipole (Bowman & Rogers 2010; Greenhill & Bernardi 2012; Patra et al. 2015; Bernardi et al. 2016). Some of these ongoing efforts have achieved increasingly better upper limits on the 21-cm signal power spectra (Ali et al. 2015; Beardsley et al. 2016; Patil et al. 2017; Barry et al. 2019; Kolopanis et al. 2019; Li, Pober & Barry 2019), showing the way for the second-generation experiments such as the Square Kilometre Array (SKA5) and the Hydrogen Epoch of Reionization Array (HERA6). Recently, a detection of an absorption profile in the sky-averaged 21-cm signal centred at 78 MHz has been reported (Bowman et al. 2018), although the unexpected depth of the trough is calling for independent confirmations (Fraser et al. 2018) – including interferometric observations (Gehlot et al. 2019).
The main challenge in detecting the faint 21-cm signal is the presence of Galactic and extra-galactic foregrounds that are around 3–4 orders of magnitude stronger (e.g. Bernardi et al. 2009, 2010; Ghosh et al. 2011; Dillon et al. 2014; Parsons et al. 2014). Foregrounds as well as the instrumental response have a highly correlated continuum spectrum and can, in principle, be separate from the 21-cm signal that has structure on smaller frequency scales due to the intrinsic redshift evolution of the IGM (e.g. Bharadwaj & Sethi 2001; Zaldarriaga, Furlanetto & Hernquist 2004; Santos, Cooray & Knox 2005). However, the inherent smoothness of the foreground emission is often compounded by the interferometric response (mode-mixing), including frequency-dependent primary beams, side-lobe from bright, mis-subtracted sources, and ionospheric distortions (Bowman, Morales & Hewitt 2009; Koopmans 2010; Ghosh et al. 2011; Vedantham, Udaya Shankar & Subrahmanyan 2012; Yatawatta et al. 2013; Barry et al. 2016; Vedantham & Koopmans 2016; Patil et al. 2017; Byrne et al. 2019; Gehlot et al. 2019). Polarization leakage due to improper calibration may also add additional spectral structures to the unpolarized cosmological 21-cm window (Geil, Gaensler & Wyithe 2011; Asad et al. 2015; Nunhokee et al. 2017).
The study of foreground properties and their separation from the 21-cm signal have been a very active research area over the years (e.g. Datta, Bowman & Carilli 2010; Liu & Tegmark 2011; Morales et al. 2012; Trott, Wayth & Tingay 2012; Dillon et al. 2014). One strategy is to attempt to ‘avoid’ foregrounds, i.e. to avoid k modes that are contaminated by foregrounds and to estimate the 21-cm power spectrum using the uncontaminated modes. This assumes that foregrounds are well localized in k-space and the mode-mixing effects can be kept well under control (Thyagarajan et al. 2015). This foreground avoidance method has the disadvantage of considerably reducing the sensitivity of the instrument because of reduction in the number of k-modes that can be probed to characterize the EoR signal (Pober et al. 2014). The second approach involves subtracting the best possible foreground model and, possibly, recover access to the foreground-dominated power spectrum region. One of the possible disadvantages here is the risk of contamination of the cosmological 21-cm signal from the cleaning process. Foreground wedge also corrupts nearly all the redshift space 21-cm signal, making it difficult to extract cosmological information without foreground subtraction (Pober 2015; Jensen et al. 2016). There are also recent efforts to develop a somewhat hybrid analysis where a Galactic and Extragalactic All-sky MWA (GLEAM; Hurley-Walker et al. 2017) catalogue of sources including Pictor A and Fornax A were first subtracted from Precision Array for Probing the Epoch of Re-ionization data and then the power spectrum was estimated. This is equivalent to an additional visibility-based filtering within the foreground avoidance paradigm (Kerrigan et al. 2018).
Chapman et al. (2016) pointed out that blind foreground removal methods such as Generalized Morphological Component Analysis (GMCA; Chapman et al. 2013) can still model relatively non-smooth foregrounds effectively on short baselines (k⊥ ≲ 0.2 h cMpc−1), while avoidance suffers some degradation as the frequency-dependent small-scale structure cannot be confined purely in a region at small k∥ modes. Several techniques have been proposed to model and remove foreground emission taking advantage of its spectral smoothness, including parametric (Jelić et al. 2008; Bonaldi & Brown 2015) and non-parametric methods (Harker et al. 2009; Chapman et al. 2013; Mertens, Ghosh & Koopmans 2018; Mertens et al. 2020). Both methods have the limitation that they may suppress the 21-cm signal and do not always reach a level of modelling error better than the noise for k ≤ 0.3 h cMpc−1, compared to the desired level of the 21-cm signal power spectrum (Mertens et al. 2018). In general, foreground subtraction allows to use virtually all k modes at the risk of contamination of the 21-cm signal, whereas foreground avoidance does not corrupt the cosmological signal within the EoR window, but cannot take advantage of any mode in the foreground wedge.
Recently, a novel, non-parametric (in the signal) method based on Gaussian Process Regression (GPR) has been studied in detail with simulations, where intrinsic smooth foregrounds, mid-scale frequency fluctuations associated with mode-mixing, Gaussian random noise, and a basic 21-cm signal model, are modelled with Gaussian Process (GP), and subsequently a separation with a precise estimation of the uncertainty was carried out (Mertens et al. 2018; Gehlot et al. 2019). The advantage of this method over previous ones is its implementation in a Bayesian framework that allows to incorporate different physical processes in the form of covariance structure priors (currently spectral and possible spatial implementation in future) on the various components. GPR further allows much better control over the coherence structure (and hence power spectra) of all components rather then be ‘blind’ for their physical origins, as are GMCA, Independent Component Analysis, or fitting polynomials. Further, it also offers a good way to extract foreground models from the data.
In this paper, we apply GPR to model foregrounds in a ∼100 min long observation with HERA-47. The GPR method was originally developed to be applied to observations with good uv coverage, but here we adapted it to work directly to visibilities, without being affected by the sparse HERA uv coverage. Foreground modelling helps us to assess the level of contamination of the data and the covariance models that can properly describe foregrounds. It can ultimately guide the foreground cleaning process and help finding the scales that should be safe to use in a foreground avoidance approach. We use the line-of-sight and the delay power spectrum in the (k⊥, k∥) plane as our metric to characterize the foreground models.
The paper is organized as follows: Section 2 summarizes our observations along with the delay power spectrum estimation procedure; Section 3 describes our technique to calculate the foreground power spectrum using the GPR formalism. Finally, we conclude in Section 4. Cosmological parameters used here are from Planck Collaboration XIII (2016).
2 OBSERVATIONS AND DATA REDUCTION
The HERA (DeBoer et al. 2017) is an ongoing experiment to use the red-shifted 21-cm radiation originating from the cosmological distribution of neutral hydrogen (|$\rm H\,{\small I}$|) to study the formation of first stars and black holes from CD (z ∼ 30) to the full IGM ionization history (6 ≲ z ≲ 12). In its final configuration, the array will consist of 350 parabolic dishes of ∼14 m diameter, with an effective area of ∼154 m2 per antenna, closely packed in a hexagonal split-core (Dillon & Parsons 2016), plus outriggers up to ∼1 km distance. The experiment is optimized for robust power spectrum detection while minimizing foreground contamination (Pober et al. 2014; Thyagarajan et al. 2015; Ewall-Wice et al. 2017)
In this paper, we used data from the deployment of the first 47 dish (HERA–47) array. It covers a frequency range of 100–200 MHz with a channel resolution of ∼97.6 kHz. The results presented in this paper were generated from 10 nights of HERA–47 data, starting on 2017 October 5, using only the ‘xx’ polarization cross-products. In the paper, we refer to this as stokes ‘I’. We selected snapshots of 10 min (see Fig. 1 for the corresponding uv coverage) of data close to 21h Local Sidereal Time (LST) over 10 d from the HERA data repository.7 In total, we used around 100 min of data. We used the pyuvdata8 software (Hazelton et al. 2017) to convert the correlator output to the Common Astronomy Software Applications (casa)9 Measurement Set format. Antenna 50 was found to be bad for the initial 7 d and was permanently flagged. We also flagged the band edges as well as the channels that were persistently affected by Radio Frequency Interference, i.e. mostly the following channels: 0–100, 379–387, 510–512, 768–770, 851–852, and 901–1023, where channel ‘0’ corresponds to 100 MHz and channel ‘1023’ to 200 MHz. We then used the casa task RFLAG to perform further flagging in time and frequency. The threshold for ‘timedevscale’ and ‘freqdevscale’ was fixed to the default values of ‘5’ each. This implies that for each channel any visibility will be flagged if the local RMS of its real and imaginary part, is larger than five times (RMS + median deviation) within a sliding time window. Similarly, for each integration time, the real and imaginary parts of the visibilities were flagged if they exceed five times the deviation from the median value across channels.
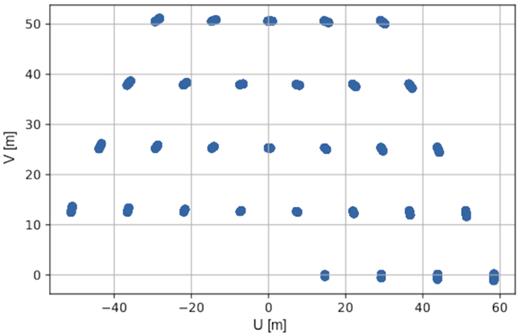
This figure shows the 10 min uv coverage around 150 MHz of HERA-47 which are analyzed in this paper.
Calibration was performed using custom casa pipelines.10 The starting flux density model included the five brightest point sources within the HERA field of view (GLEAM 2101–2800, GLEAM 2107–2525, GLEAM 2107–2529, GLEAM 2101–2803, and GLEAM 2100–2829), chosen from the MWA GLEAM point source catalogue (Hurley-Walker et al. 2017). Their model flux density was corrected for the HERA primary beam response following the electromagnetic simulations of the HERA feed and dish (Fagnoni & de Lera Acedo 2016), obtaining a flux density estimate for each source at each frequency channel. This sky model was used to solve for three types of antenna gains: antenna-based delay (‘K’ term in the casa terminology), followed by a complex gain for all the channels and the whole 10 min interval (‘G’ term in the casa terminology) and by a complex bandpass calibration (‘B’ term in the casa terminology). Calibration solutions were determined for the snapshot observation on 2017 October 15 and applied to the rest of the nine nights of data, though data from each day was flagged individually. The calibration solutions are used as-is, and are not smoothed across frequency before applying them to the data. This can allow spectral-dependent calibration errors generated by unmodelled sky sources and baseline-dependent systematics to be applied to the data, and can further corrupt the EoR window (Kern et al. 2020b); however, in this work we seek to model these terms through a combination of the foreground mode mixing and periodic kernel discussed next.
Calibrated visibilities were phased to a common right ascension α = 21h and Fourier transformed into 21° × 21° images using the w-projection algorithm with 128 planes and the multifrequency synthesis algorithm to combine the whole bandwidth together. Uniform weights were used, leading to a 43.2 arcmin × 35.4 arcmin synthesized beam. Each image was conservatively deconvolved down to a threshold of |$10{{\ \rm per\ cent}}$| of the image peak using the Cotton–Schwab algorithm implemented in the casaCLEAN task.
Images of the 10 snapshots are shown in Fig. 2. Images at different days are very similar, qualitatively showing good instrumental stability. Image to image variation of the RMS noise in regions of the sky that are mostly empty (away from phase center and void of sources) is between 0.35 and 0.45 Jy beam−1. In these parts of the sky, the primary beam response for the individual fields is considerably lower than the field centre and we expect them to be noise dominated. As the primary beam response slightly changes based on the transit time at the HERA location, we find that the peak flux density of the images varies up to |$5\!-\!10{{\ \rm per\ cent}}$| over the 10 d (Fig. 3), likely due to time variations of the bandpass and imperfect primary beam corrections across snapshots – the primary beam was computed for the first snapshot but observations took place at slightly different LSTs. This variation essentially sets the accuracy of our absolute flux density calibration. We also note that Cygnus A is above the horizon at the time when observations were taken. Although ∼70° away from the pointing direction and therefore heavily attenuated by the primary beam, it still appears as a source with ∼7 Jy beam−1 peak flux density, possibly affecting the bandpass calibration. We also leave for future work the application of techniques that leverage on the array redundancy to improve calibration (Marthi & Chengalur 2014; Zhang, Liu & Parsons 2018; Grobler, Bernardi & Kenyon 2018; Dillon et al. 2018; 2020).

This figure shows 10 snapshot images from HERA-47 at 150 MHz. The flux density scale is in Jy beam−1 units.
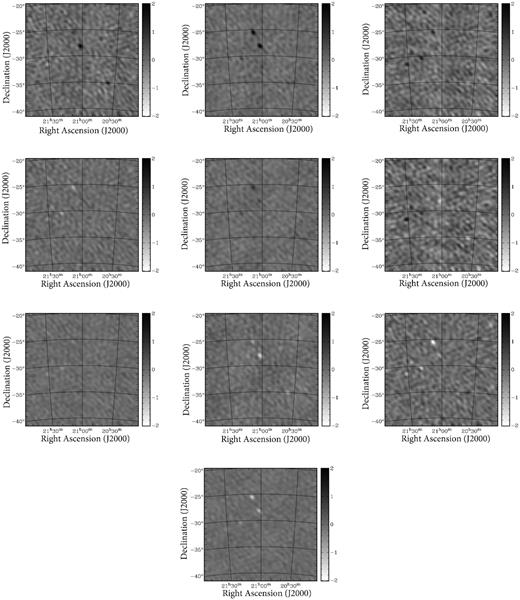
This figure display the ‘difference image’ where the mean image has been subtracted out. The flux density scale is in Jy beam−1 units.
2.1 LST binning and SEFD evaluation
We bin each night of visibility data in LST. We chose a 2 min bin resolution, such that we can minimize the variation of the primary beam. For each observing night and LST bin, we only average redundant baselines (e.g. baselines of the same length and orientation). This ensures that we are coherently averaging the baselines and not mixing up emissions from the sky as the earth rotates.
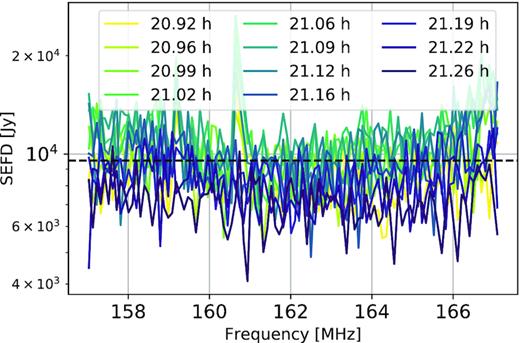
Estimated SEFD as a function of frequency for the different LST bins. The dashed line shows the mean value for all the LST bins and frequency channels.
Visibilities observed at the same LST time should ‘see’ the same sky. Assuming that over the 2-min LST bin the change in the primary beam is not significant, all the 2-min averaged visibilities corresponding to similar LST bins are therefore also coherently averaged (after baselines of same length and slope have been averaged). Visibility data sets from different LST bins, on the other hand, correspond to different parts of the sky and therefore cannot be coherently averaged. However, the 21-cm signal power spectra should only depend on baseline length, not time. We can thus incoherently combine them when producing power spectra (e.g. we average the power spectrum from different LST bins). In the following subsection, we describe our power spectrum estimation procedure. We focus our discussion on the line-of-sight and delay power spectrum in the k⊥−k∥ plane or, equivalently, baseline–delay plane.
2.2 Delay power spectrum
Fig. 5 shows the delay power spectrum for a 2 min LST binned data (e.g. we consider one LST bin only) as a function of k∥, up to τ ∼ 3.6 μs, corresponding to k∥ ∼ 2.0 h cMpc−1. We used a 10 MHz bandwidth centred at 162.06 MHz to estimate the delay spectrum. We found most of the foreground power is confined within k∥ ≤ 0.2 h cMpc−1 and foreground excess beyond that is largely limited for most baselines, however, there is some signature of a signal with an ∼1 MHz period (Kern et al. 2020a), corresponding to k∥ ∼ 0.5 h cMpc−1, for all the baselines considered.
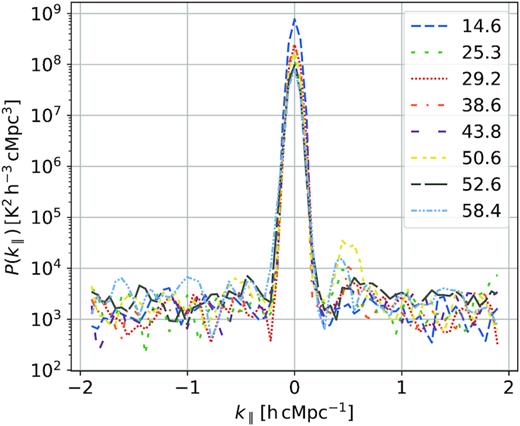
Power spectrum of a 2 min LST binned data as a function of k∥ for the baselines included in our analysis. The baselines in units of meters are shown in the legend.
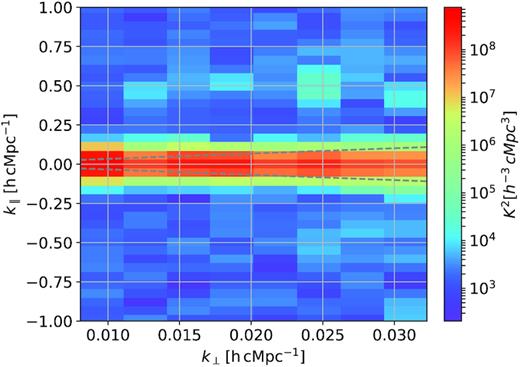
Delay power spectrum in the (k⊥−k∥) plane for a 2 min LST binned data. The dashed line represents the horizon line corresponding to θmax = 90°.
3 GAUSSIAN PROCESS REGRESSION AND FOREGROUND CHARACTERIZATION
The delay power spectrum results show that the data is mostly dominated by foregrounds. GPR offers a way to model these foregrounds in a maximum likelihood way. In this section, we summarize the GPR formalism (for a detailed review of how the method works see Mertens et al. 2018) and apply it to model foreground components in HERA-47 observations.
In this framework, the different components of 21-cm observations, such as the astrophysical foregrounds, mode-mixing contaminants, and the 21-cm signal, are modelled with a GP. A GP is the joint distribution of a collection of normally distributed random variables (Rasmussen et al. 2005; Gelman et al. 2014). The covariance matrix of this distribution is specified by a covariance function, which defines the covariance between pairs of observed data points (i.e. at different frequencies). The co-variance function ultimately determines the structure that the GP will be able to model (for example, here the smoothness of the foregrounds).
The GPR process requires the choice of the model for the covariance function and a selection of the best-fittingting parameters of such a model (what we call the hyper-parameters). Model selection is done in a Bayesian sense by maximizing the marginal likelihood, also called the evidence, which is the integral of the likelihood over the prior range, given the data. For a fixed model, standard gradient-based optimization or Monte Carlo Markov Chain (MCMC) methods can be adapted to determine the best-fitting parameters of the covariance functions. We note here that currently we model the data only in the frequency axis and no baseline dependence has been introduced in the hyper-parameter optimization with GPR (i.e. there is no dependence on baseline length). This assumption is supported by Fig. 5, where we can see that the power spectrum is similar for different baseline lengths.
Assuming that the GP co-variance model is optimal and taking |$\langle \bf {d} \bf {d}^{H}\rangle = K_{\mathrm{f}} + K_{\mathrm{r}}$|, then |$\langle E(\boldsymbol {f_{\mathrm{ fg}}})E(\boldsymbol {f_{\mathrm{ fg}}})^H \rangle = K_{\mathrm{f}} - \mathrm{cov}(\boldsymbol {f_{\mathrm{ fg}}})$|. This highlights that to obtain the expected co-variance model of the foregrounds, Kf, directly from |$E(\mathbf {f_{fg}})$|, we need to un-bias the estimator using |$\mathrm{cov}(\mathbf {f_{fg}})$|. We implement a similar unbiasing for the delay power-spectra of the different foreground components by first taking the delay transform of |$E(\mathbf {f_{fg}})$| and |$\mathrm{cov}(\mathbf {f_{fg}})$| and then adding them in the power spectrum domain. We finally normalize by the observed cosmological volume to construct the delay power spectrum P(k⊥, k∥) in units of |${\rm K^{2} \, [h^{-3}\, cMpc^{3}}]$|. More specifically, we calculate the covariance matrices by fitting the hyper-parameters to all the data, while the posterior mean is obtained for each time-averaged visibility (so, the covariance calculated from |$E(\mathbf {f_{fg}})$| is not necessarily the same as the initial Kf). In this paper, we consider the power spectrum of the different foreground components. This implies calculating |$E(\boldsymbol {f_{\mathrm{ fg}}})$| for each of the foreground components, where we replace Kf by the optimized co-variance of the corresponding foreground component (while keeping the term in square brackets, [Kf + Kr], the same, since it is the total co-variance).
3.1 Covariance functions
3.2 Foreground modelling
In general, the coherence scale is expected to be dependent on the baseline length, with longer baselines de-correlating faster than shorter baselines. We investigate this effect by implementing a ‘per-baseline’ GPR approach that allows us to model a coherence scale for different baseline lengths using a smaller data set with an increased number of degrees of freedom. We found that the coherence scale decreases at longer baselines (Fig. 8), from l ∼ 3.2 MHz for the 14.6 m baseline to l ∼ 2.2 MHz for ∼60 m baseline. In the ‘all-baselines’ GPR implementation, the optimal coherence scale was about 2.4 MHz, which falls inside the maximum–minimum range of ‘per-baseline’ GPR approach. These results further agree well with our initial choice of the 2–20 MHz prior range for the medium-scale frequency fluctuations introduced in Section 3.1. The main reason for this behaviour is the limited baseline range used in this analysis over which the foreground co-variance remains similar.
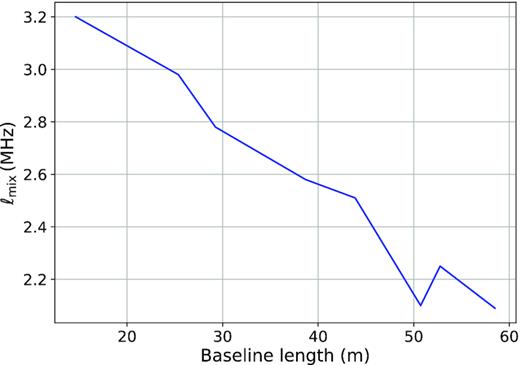
The optimized co-variance scale lmix for the mode-mixing kernel as a function of baseline lengths using a ‘per-baseline’ GPR technique.
The inclusion of significantly longer baselines would likely require a ‘per-baseline’ GPR fit as the foreground coherence will change more significantly across the range of baseline lengths. This could be implemented without significantly increasing the number of degrees of freedom by allowing the coherence scale parameters to be a function of the baseline length. We leave this investigation for future work.
We then considered all nights, coherently LST combined data sets for which we estimate different foreground components using GPR. For the GPR foreground modelling and the power spectrum estimation we used the python package ps_eor.14
Fig. 9 shows the power spectrum and the variance across frequency for the different foreground components that we recover using the GPR technique. Note that in our GPR power spectrum estimation method, the hyper-parameters of the covariance model are optimized using the Bayesian evidence. Doing an MCMC, we then get the posterior distribution of these hyper-parameters, and this is the first source of uncertainty that we use and propagate to the power spectra. The shaded area in Fig. 9 shows the propagated 2σ uncertainty on the hyper-parameters and the uncertainty on the model fit (equation 9) and from the MCMC run (for details see Section 3.2.3) on to the different foreground power spectrum components. An important point to note here is that the uncertainty on the power spectra that we estimate are correct assuming that our assumed co-variance functions are appropriate.

Power spectra and derived foreground components after GPR analysis of the coherently averaged combined data: spherically averaged power spectra (left-hand panel), delay spectra averaged over all baselines (middle panel). The right-hand panel shows the variance of the different foreground components across frequency. The shaded area highlights the uncertainty (2σ) from the GP process (equation 9) and the uncertainty on the model fit from the MCMC run on to the foreground power spectrum components.
We notice that the ‘FG mix’ model has a small coherence scale (2–3 MHz) and therefore the variance has a wave-like pattern, but for the intrinsic foregrounds it is mostly smooth across frequency. We detect a ‘bump’ in the power spectrum around k∥ ∼ 0.5 h cMpc−1, corresponding to a ∼900 ns delay, indicating the presence of a non-negligible contamination in the data (possibly due to internal signal chain reflections, or a more dominant instrumental cross-talk feature spanning delays of 800–1200 ns that does not look like an EoR signal and can therefore be filtered out, Kern et al. 2020a), which we investigate in more detail in Section 3.2.1.
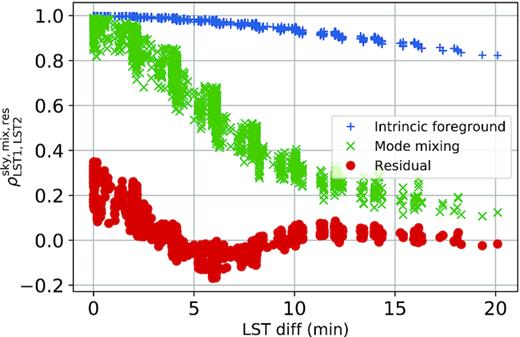
Correlation coefficient |$\rho _{{\rm LST1, LST2}}^{{\rm sky, mix, res}}$| as a function of LST difference for all the night, LST-binned data. Each marker symbol (‘ + ’, ‘x’ or ‘o’) represents an LST difference.
3.2.1 Characteristics of the periodic signal
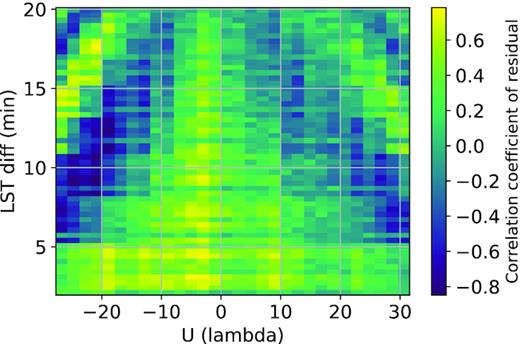
Correlation coefficients of the residual visibility data after GPR as a function of baseline length and LST difference. The plot shows very strong dependence of the periodic signal on baseline length |u| and it also varies with LST difference.
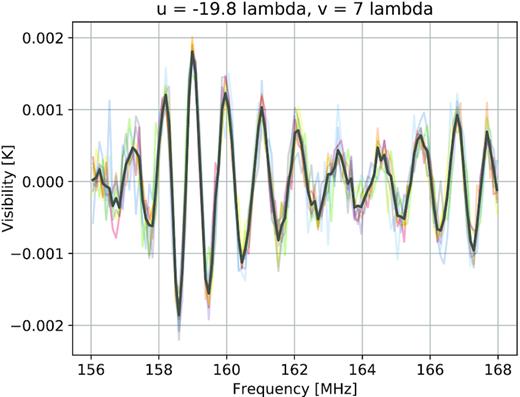
Example of the periodic signal for 38.6 m baseline with coordinates |$(u, v) =(-19.8, 7)\, \lambda$|. The real part of the visibility is shown in ‘K’ units. The different transparent lines correspond to different LST data sets on which we apply a frequency phase offset to align the periodic signal. This signal can be fitted using GPR with a combination of an RBF and Cosine co-variance kernel (the solid line).
Kern et al. (2020a) provides a thorough investigation of such systematic effect, attributing it to a combination of instrumental cross-coupling (e.g. mutual coupling and cross-talk) and cable reflections within the analogue signal chain. Kern et al. (2019) present methods for modelling and removing these systematic terms in the data. In the following section, we show how it can be modelled and subtracted in the GPR formalism.
3.2.2 Filtering the periodic signal with GPR
Fig. 13 displays the power spectrum of different GPR modelled components including the periodic signal. We notice that the periodic signal peaks around ∼0.4–0.8 h cMpc−1. In the middle panel, we display the GPR model that nicely isolates the periodic signal component around k∥ ∼ 0.5 h cMpc−1. In general, we find that the periodic signal is k dependent. It appears at k ∼ 0.17 h cMpc−1, reaching a ∼107 mK2 peak at k ∼ 0.4 cMpc−1 – approximately six orders of magnitude brighter than the expected 21-cm power spectrum (Mesinger et al. 2011).

Same as Fig. 9 but now including the periodic signal and the estimated noise power spectrum and variance.
The average variance across frequency for the periodic signal component is ∼3.8 × 10⁴ mK2, while the mean variance of the mode-mixing signal is around ∼1.2 × 10⁷ mK2, approximately three orders of magnitude higher. The noise power spectrum shown in Fig. 13 is estimated by splitting the data set in even and odd times with a 10.7 s time separation and taking the difference between the two. At this time resolution, the foregrounds cancel out almost perfectly. We find the residual power spectrum level is close to the estimated noise power spectrum, especially at |k∥| ≥ 0.85 h cMpc−1.
The residual in Fig. 14 reveals that there is still some time correlation left, but overall, we find the residuals have become more uncorrelated and noise-like compared to Fig. 10 where the GP foreground co-variance was modelled only with a combination of ‘sky’ and ‘mode-mixing’ kernels.

Same as Fig. 10, but here the periodic signal has been modelled with an RBF and cosine kernel and then removed.
3.2.3 Foreground model hyper-parameter uncertainties
We sampled the posterior distribution of the foreground model hyper-parameters and characterize their correlation with an MCMC. We used the emcee python package15 (Foreman-Mackey et al. 2013), which uses an ensemble sampler algorithm based on the affine-invariant sampling algorithm (Goodman & Weare 2010).
Fig. 15 shows the resulting posterior probability distribution of the GP model hyper-parameters. The variance of the EoR kernel, which was modelled with a GP exponential kernel, is found to be un-constrained and low. The data can be well modelled by the ‘sky’, ‘mix’, ‘per’ (periodic) foreground kernels and the noise covariance matrix (modelled with a fixed variance) that contributes a large part of the variance at large k∥. We compared the evidence values with and without the EoR co-variance kernel in the GP optimization. We find the evidence remains mostly unchanged and the Bayes factor (Jeffreys 1961) is around ∼0.93 for GP models with and without the EoR co-variance kernel. This essentially confirms that the signal is dominated by a noise-like component once the foregrounds are removed and adding an EoR kernel has an insignificant effect. Overall, the confidence intervals of other kernel hyper-parameters are reasonably well constrained, except the variance of the ‘21-cm signal’ component that is consistent with zero. The significance of the coherence scale of the ‘21-cm signal’ is also reduced given the non-significant variance of this component. Table 1 highlights the parameter estimates and confidence intervals for the posterior probability distribution of the foreground model hyper-parameters. The estimated median values of the frequency coherence scale of the ‘sky’ and ‘mix’ covariance kernel is about 19.4 and 2.4 MHz, respectively, which is close to the GPR optimized values as presented in Section 3.2.
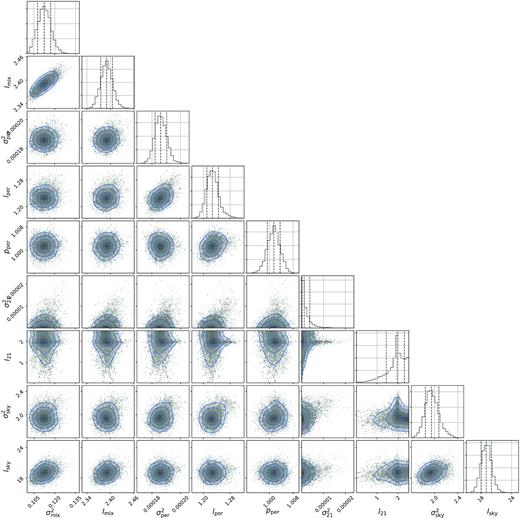
Posterior probability distributions of the GP model hyper-parameters. We show here the coherence scale and strength of the EoR co-variance kernel (l21 in MHz and σ21 in K2), the coherence scale and strength of the mode-mixing foreground kernel (lmix in MHz, σmix in K2), the intrinsic foreground kernel (lsky in MHz, σsky in K2) and the periodic co-variance kernel hyper-parameters (|$l_{{\rm per}}, \, p_{{\rm per}}$| in MHz and |$\sigma _{{\rm per}}^2$| in K2). The vertical dashed lines show the first, second, and third (Q1, Q2, and Q3) quantile levels. The diagonal panels represent the marginalized probability distribution of each parameter.
Summary of the estimated median and confidence intervals (first and third quantile levels (Q1 and Q3)) of the respective GP model hyper-parameters including the periodic co-variance kernel.
| Hyper-parameter . | Prior . | Estimate . |
|---|---|---|
| lmix (MHz) | |$\mathcal {U}(2, 20)$| | |$2.40 \substack{+0.02\\-0.01}$| |
| |$\sigma _{{\rm mix}}^2 \ ({\rm K}^2)$| | |$\mathcal {U}(0.1, 0.9)$| | |$0.115 \substack{+0.007\\-0.005}$| |
| lsky (MHz) | |$\mathcal {U}(10, 200)$| | |$19.42 \substack{+1.25\\-1.18}$| |
| |$\sigma _{{\rm sky}}^2 \ ({\rm K}^2)$| | |$\mathcal {U}(0.02, 2.5)$| | |$1.89 \substack{+0.10\\-0.09}$| |
| lper (MHz) | |$\mathcal {U}(1, 5)$| | |$1.23 \substack{+0.01\\-0.01}$| |
| pper (MHz) | |$\mathcal {U}(0.628, 1.256)$| | |$0.999 \substack{+0.002\\-0.002}$| |
| |$\sigma _{{\rm per}}^2 \ ({\rm K}^2)$| | |$\mathcal {U}(0.00001, 0.01)$| | |$0.000183\substack{+0.000004\\-0.000003}$| |
4 DISCUSSION AND CONCLUSIONS
In this paper, we have used a novel foreground separation method, first introduced in Mertens et al. (2018), in order to model foregrounds with the HERA-47 array. The mainstream HERA data analysis takes advantage of the concept of avoiding foregrounds and provides a single-baseline power spectrum estimate: recent data analysis showed evidence of systematic effects that contaminate the EoR window, and motivated the development of strategies to mitigate their impact to the avoidance paradigm (Kern et al. 2020b). An alternative effort to detect the 21-cm signal using closure quantities is actively being pursued (Thyagarajan, Carilli & Nikolic 2018; Carilli et al. 2018; Carilli, Thyagarayan & Kent 2020).
The method presented here uses GPR to model various stochastic foreground components, such as the spectrally smooth intrinsic sky, mode-mixing components generating from the chromatic instrument and imperfect calibration, as well as a 21-cm signal. It therefore bears analogies with the avoidance approach as they both attempt to model and subtract systematic effects in the EoR window, but also more broadly models the foreground emission – which is not within the purpose of the avoidance approach. Foreground modelling may be a necessary step in order to reduce the leakage in the EoR window and access the high signal-to-noise ratio small k modes (e.g. Kerrigan et al. 2018; Ewall-Wice et al. 2020; Lanman, Pober & Kern 2020).
Our analysis included a different co-variance function for each of intrinsic sky, mode-mixing, and 21-cm signal components in the GP modelling. We found that the frequency coherence scale of the ‘sky’ and ‘mix’ co-variance kernel are about 20 and 2.4 MHz, respectively. As a comparison, the typical (theoretical) frequency coherence scale for the 21-cm EoR signal is found to be around ∼0.8 MHz, when fitted to the co-variance of a simulated 21-cm EoR template. The foreground power spectrum is shown to be contaminated by an ∼1 MHz periodic signal whose amplitude changes from baseline to baseline. The periodic signal dominates the 0.25 < k < 0.9 h cMpc−1 range. We included a combination of RBF and a cosine kernel to model this signal within our GPR method and found a fairly cleaner and flatter residual power spectrum across the 0.05 < k < 1.83 h cMpc−1 range. The residual power spectrum is also mostly consistent with the estimated noise power spectrum, especially at high k∥ values, whereas residuals are still present in the foreground and periodic signal-dominated region of the pwoer spectrum.
As foreground subtraction is potentially at risk of altering the 21-cm signal, we plan to further explore this approach using more HERA data and test the cleaning with signal injection tests using full-scale HERA simulations. In this paper, we have restricted ourselves to foreground modelling only and left the characterization of residual power spectra to future work, which will include end-to-end signal injection tests.
Finally, we note that the foreground model used in this paper might not be complete, although it seems to be enough at this noise level. In particular, it does not include other foregrounds contaminants such as the instrumental polarization leakage, residual RFIs, and the phase errors caused by the ionosphere or imperfect calibration. We plan to include these additional subtle effects in our GP co-variance modelling. In addition to these, we intend to implement a per-baseline GPR approach where the coherence scale parameters are a function of the baseline length without exploding the number of degrees of freedom of the GPR fit. This will be relevant for longer HERA baselines where the larger baselines will de-correlate faster compared to the shorter baselines. Also, the present mode-mixing model can be improved by integrating the k⊥ dependence of the foreground wedge. We further plan to include the isotropic nature of the 21-cm signal and its evolution at different redshift bins, which will also ensure a more sensitive and detailed modelling.
ACKNOWLEDGEMENTS
We thank the anonymous referee and the editors for their useful comments and suggestions. This material is based upon work supported by the National Science Foundation under grant nos. 1636646 and 1836019 and institutional support from the HERA collaboration partners. This work is funded in part by the Gordon and Betty Moore Foundation and the National Research Foundation of South Africa (grants nos. 103424 and 113121). HERA is hosted by the South African Radio Astronomy Observatory (SARAO), which is a facility of the National Research Foundation, an agency of the Department of Science and Innovation. Parts of this research were supported by the Australian Research Council Centre of Excellence for All Sky Astrophysics in 3 Dimensions (ASTRO 3D), through project number CE170100013. AG would like to thank SARAO for support through SKA postdoctoral fellowship, 2016. AG would also like to thank Dr. Sushanta Kumar Mondal for editing some of the figures. FGM and LVEK would like to acknowledge support from a SKA-NL Roadmap grant from the Dutch ministry of OCW. LVEK, FGM, and BG also acknowledge support by an NWO–NRF Exchange Programme in Astronomy and Enabling technologies in Astronomy (NWO grant no. 629.003.021). GB acknowledges support from the Royal Society and the Newton Fund under grant NA150184. MGS acknowledges support from the SARAO and the National Research Foundation (grant no. 84156). GB acknowledges funding from the INAF PRIN-SKA 2017 project 1.05.01.88.04 (FORECaST). We acknowledge the support from the Ministero degli Affari Esteri e della Cooperazione Internazionale – Direzione Generale per la Promozione del Sistema Paese Progetto di Grande Rilevanza ZA18GR02. AL acknowledges support from the New Frontiers in Research Fund Exploration grant program, a Natural Sciences and Engineering Research Council of Canada Discovery Grant and a Discovery Launch Supplement, the Sloan Research Fellowship, as well as the Canadian Institute for Advanced Research Azrieli Global Scholars program. We acknowledge the HERA staff who made these observations possible.
Footnotes
Low-Frequency Array, http://www.lofar.org.
Murchison Widefield Array, http://www.mwatelescope.org.
Precision Array to Probe EoR, http://eor.berkeley.edu.
REFERENCES
Author notes
NSF Astronomy and Astrophysics Postdoctoral Fellow.
Nithyanandan Thyagarajan is a Jansky fellow of the National Radio Astronomy Observatory.


