


ABSTRACT
Results of the analysis of the variability of the H β and H α broad emission-line profiles and the He ii λ4686 Å emission-line fluxes in the 3C 390.3 nucleus during 1992–2014 are present. The observed velocity-dependent lag for the Balmer lines is similar to that expected from the Keplerian disc configuration, although there are some differences. Probably, a radial infall motion can be present in the broad-line region of 3C 390.3 in addition to the Keplerian rotation. The lag of the broad He ii line is 26 ± 8 d, significantly less than that of the Balmer lines, so the He ii emission region is much smaller in size. In terms of the power-law relationship between line and optical continuum fluxes with slowly varying scale factor c(t): |$F_{\rm line}\propto c(t)\, F_{\rm cont}^a$|, the power a is 1.03 for the broad He ii line, while according to Paper I, the power is equal to 0.77 and 0.54 for the broad H β and H α lines, respectively. It means that the variability amplitude is the largest in the He ii, less in H β, and more less in H α. However, the Balmer lines contain a long-term trend that is not seen in the helium line. The narrow He ii line is variable with the amplitude (max-to-min ratio) Rmax ≈ 3, which is much greater than the variability amplitudes of both the narrow Balmer lines and the narrow [O iii] λ5007 Å line.
1 INTRODUCTION
A major goal of extragalactic researches is to understand spatially unresolved internal structure of the active galactic nuclei (AGN), in particular, the structure, kinematic, and physical conditions in the broad-line region (BLR). The BLR consists of high-velocity gas (up to ∼20 000 km s−1) that is ionized and heated by the time-variable, high-energy continuum of the central source. This gas produces broad emission lines (BEL). While most of the BEL profiles are roughly symmetric, some AGN show strong redward or blueward asymmetries, bumps, and shelves in the BEL profiles. In addition, the BEL profiles are strongly variable in flux, responding or ‘reverberate’ to the continuum variations, as well as in shape.
A long-term monitoring of AGN is an effective way to study the BLR and to distinguish among various proposed BLR models. High-temporal-resolution time series of the continuum and broad-line fluxes are of particular interest for the reverberation mapping (RM) studies. RM (Blandford & McKee 1982; Peterson 1993, 2014) is a powerful tool to investigate the BLR size, structure, and kinematics. Under some simple assumptions, the emission-line response to the continuum variations is a convolution of the continuum light curve with a so-called transfer function Ψ(τ) (for the total line flux) or Ψ(τ, λ) (for the line flux at wavelength λ). The transfer function reflects BLR size, geometry, and kinematics. In its simplest form, the mean time delay (or lag τ) between continuum and emission-line variations is measured by the cross-correlation function (CCF) for the respective light curves and it represents a typical BLR size. The lag at the CCF peak (or τpeak) is approximately equal to a lag that divides a transfer function into two equal areas (Sergeev et al. 1999b).
From the time delay as a function of line-of-sight velocity, it is possible to distinguish among geometric and kinematic BLR configurations (e.g. flattened versus spherical geometry and rotation, infall, or outflow kinematics). For example, the Keplerian disc produces a velocity-symmetric structure with lower lags at the far profile wings, while the radial motion produces an asymmetric velocity structure with smaller delays on the red/blue profile wings for infall/outflow, respectively. Such detailed velocity-resolved analyses have been applied to about 10 AGN (e.g, Sergeev et al. 1999a; Denney et al. 2009; Bentz et al. 2010; Denney et al. 2010; Doroshenko et al. 2012; Grier et al. 2013; Pei et al. 2017; De Rosa et al. 2018). In general, the BLR kinematics has been found to be a rotational or infall motion, but the BLR appears to be more complex in some objects, e.g. combined virial motion and infalling gas in Mrk 6 (Sergeev et al. 1999a; Doroshenko et al. 2012; Grier et al. 2013).
However, the long-term profile variations (months to years) seem to be completely independent of the continuum variations, so their origin can not be ascribed to reverberation effects (e.g. Sergeev et al. 2002). Reasons for the long-term profile evolution are not clear. They can be related to the multicomponent BLR model with multiple physical components (e.g. Stirpe, de Bruyn & van Groningen 1988; Peterson et al. 1990; Malkov, Pronik & Sergeev 1997; Sergeev, Pronik & Sergeeva 2001), or to the inhomogeneities in a disc-like BLR, such as hotspots (Zheng, Veilleux & Grandi 1991; Newman et al. 1997; Sergeev, Pronik & Sergeeva 2000; Flohic & Eracleous 2008) or spiral arms (Chakrabarti & Wiita 1994; Storchi-Bergmann et al. 2017), or to the line emissivity redistribution in space, which depends on the continuum brightness (e.g. broad H β line was found to be broader when the continuum flux is weaker in accordance with the photoionization models e.g. Cackett & Horne 2006), dynamic changes of the BLR, or the anisotropic continuum emission (e.g. Goad & Wanders 1996), or to some other reasons.
The nucleus of the radio galaxy 3C 390.3 is a prototype to so-called double-peaked emitters, objects with strongly double-peaked broad-line profiles (red and blue bumps or shoulders). This nucleus is among the best-studied objects of this class and its variability history is well known (e.g. Osterbrock, Koski & Phillips 1976; Barr et al. 1980; Yee & Oke 1981; Netzer 1982; Veilleux & Zheng 1991; Zheng 1996; Wamsteker et al. 1997; Dietrich et al. 1998; O’Brien et al. 1998; Gezari, Halpern & Eracleous 2007; Shapovalova et al. 2010; Dietrich et al. 2012; Afanasiev et al. 2015).
The double-peaked profiles are often believed to be a signature of the relativistic Keplerian disc, either circular or elliptical (e.g. Chen & Halpern 1989; Chen, Halpern & Filippenko 1989; Eracleous et al. 1995). Inhomogeneities in the disc surface brightness have been proposed in order to explain variations of the profile shapes (see above). Alternative BLR models to account for the double-peaked profiles include outflowing biconical gas streams (Veilleux & Zheng 1991; Zheng et al. 1991) and binary black holes (e.g. Peterson, Korista & Cota 1987; Gaskell 1996; Zhang, Dultzin-Hacyan & Wang 2007).
This study is a continuation of the previous studies of the 3C 390.3 nucleus carried out in the Crimean Astrophysical Observatory (CrAO) since 1992 (Sergeev et al. 2002, 2011; Sergeev, Nazarov & Borman 2017, hereafter Paper I). The observations are described in Section 2. The velocity-resolved variability characteristics and the velocity-resolved lags for the H β and H α lines are presented in Sections 3.2 and 3.3. In Section 3.4, the lag for the He ii λ4686 Å BEL is determined and its variability patterns are compared to those of the Balmer lines. The obtained results are summarized in Section 4.
2 OBSERVATIONS AND DATA REDUCTION
2.1 Optical spectroscopy
Optical spectra of 3C 390.3 have been obtained at the 2.6-m Shajn telescope of the CrAO since 1992. The results of the observations for the periods 1992–2000, 2001–2007, and 1992–2014 are published in Sergeev et al. (2002, 2011)and Paper I, respectively. The spectra were registered at the two separate spectral regions centred at the H α and H β lines. More details about observations, observational setup, and spectral data processing are in Sergeev et al. (2002, 2011) and Paper I. Below I briefly recall how the spectra of 3C 390.3 were calibrated in flux.
At first, the spectra have been scaled to match the fluxes of the selected narrow emission lines that are assumed to be constant over time-scales of the monitoring programme. The scaling procedure has been performed according to the method of residuals as described by van Groningen & Wanders (1992). However, in the case of 3C 390.3, the underlying difficulty is that there are evidences for the narrow-line variability (Clavel & Wamsteker 1987; Zheng et al. 1995; Paper I). A discrepancy between spectral and photometric light curves of 3C 390.3 (Paper I) has been attributed to this variability. So, it was assumed that the photometric measurements are correct, while the spectral measurements are wrong because this variability. Therefore, in Paper I, the spectra were re-scaled to achieve an agreement between the spectral and photometric data sets. To correct the spectral measurements, the φ(t) function has been recovered to re-scale the spectra as described in Sergeev et al. (2011). It was selected to be a small-degree polynomial function of time (see Paper I).
The narrow lines have been separated from the broad-line profiles as described in Sergeev et al. (2002), Sergeev et al. (2007). So, low-state spectra of 3C 390.3 were used to isolate the narrow-line components. Unfortunately, in contrast to Sergeev et al. (2007), the [O iii] λ5007 line is apparently blended with the broad H β line. Therefore, as a first iteration, it was adopted that there is no broad H β line underneath the [O iii] λ5007 line profile, but only a continuum with a constant flux. This continuum was measured at the red side of the [O iii] profile and then subtracted from [O iii]. Taking in a mind that the lines of the [O iii] λ4959+5007 doublet are scaled and shifted versions of each other, an initial [O iii] λ4959 profile can easily be obtained. After subtraction of this profile, the red H β wing on the blue side of the [O iii] λ5007 profile is free of narrow lines, and we can use both the blue and red wavelength windows for a local straight-line pseudo-continuum that represents the red wing of the broad H β line beneath the [O iii] λ5007 line. After the third iteration, there are no more changes in the obtained [O iii] λ5007 narrow-line profile.
The obtained [O iii] λ5007 profile has been used as a template to separate other narrow lines (H β, He ii, H α, [N ii], [S ii], [O i]), again for the low-state H β- and H α-region spectra. The separation of the narrow lines was based on the assumption that a broad-line profile beneath the narrow line(s) is sufficiently smooth for the low-order interpolation underneath the narrow line(s) and that the narrow-line profiles are similar to that of [O iii] λ5007. For this purpose, the multidimensional optimization algorithm was used. Finally, the spectrum of the narrow lines has been created in order to obtain broad-line components by subtraction the narrow-line components from each spectrum.
The subtraction of the narrow lines has been applied to the spectra that were scaled in flux using the narrow-line fluxes ([O iii] and [O i] in the H β and H α spectral regions, respectively (see Paper I). Since the narrow Balmer lines vary in flux stronger than that of [O iii] and [O i] (Paper I), these lines were subtracted alone. Then the narrow-line free H β and H α broad profiles were re-scaled using the φ(t) scale factor to account for the narrow-line variability.
Fig. 1 illustrates the separation of the narrow lines from the low-state mean spectrum, which was done by Sergeev et al. (2002).
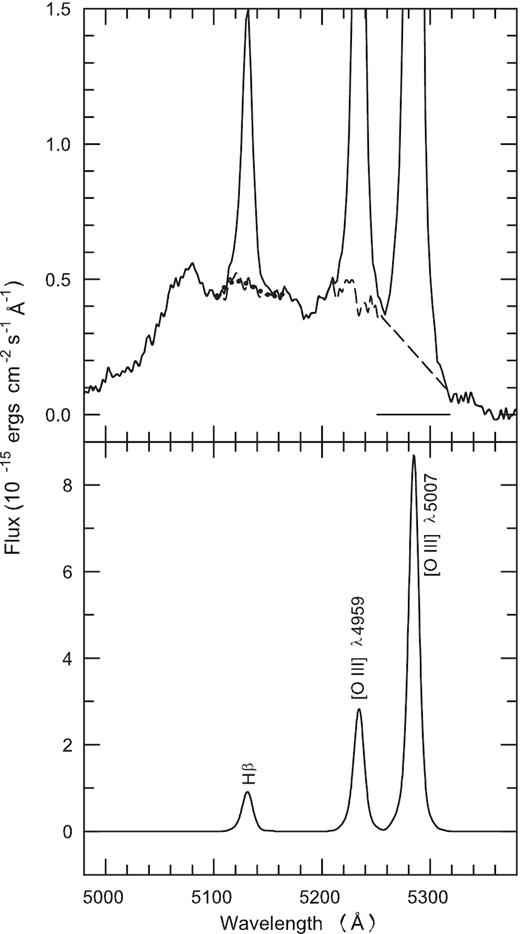
Remake and visualization of the separation of the narrow-line components in the H β region in 3C 390.3, which was performed by Sergeev et al. (2002). Top panel: solid line is a mean of the low-state spectra, dashed line is the H β broad-line profile (It is only different from the solid line at the narrow line positions), and dotted line is the low-order interpolation underneath the H β narrow-line profile (see the text for more details). Horizontal line indicates the wavelength window for which the red wing of the broad H β line was assumed to be a straight line. Bottom panel: Narrow-line component that was used to obtain the H β broad-line profile for each spectrum.
While uncertainties in our H α-region fluxes are much greater than in the H β-region ones because large uncertainties in the flux-scaling factors determined from the relatively weak [O i] λ6300 narrow line, the flux-independent profile shapes of H α are more reliable than that of H β.
2.2 Optical photometry
Regular CCD broad-band photometric observations of the selected AGN, including 3C.390.3, have been started at the CrAO in 2001. The instrumentation, reductions, and measurements of our photometric data are described in Doroshenko et al. (2005) and Sergeev et al. (2005). The V-filter photometric measurements of 3C 390.3 were calibrated to match the F5100 spectral fluxes of the continuum and to obtain a joined continuum light curve (see Paper I for more details).
3 RESULTS
3.1 Light curves for individual profile segments
The H β and H α broad-line profiles were divided into 8 and 10 velocity-space bins, respectively. The bin boundaries are given in Table 1 and shown in Fig. 2. The boundaries were chosen to have approximately the same flux for each bin for the mean as well as for rms profiles and by considering the four periods of observations from Paper I: 1993–1997, 2005–2007, 2008–2014, and the entire period of CCD observations of 3C 390.3 at the CrAO (1992–2014). The motivation for the data division into the periods is that these periods were used for the cross-correlation analysis in Sergeev et al. (2002, 2011) and Paper I. The 1998–2004 period has been excluded from the cross-correlation analysis because poor data sampling for both the H β and H α lines. On the other hand, this division can be used to check for changes in the variability characteristics, e.g. lag changes. The light curves for the chosen bins were computed as given in Sergeev et al. (2002, 2011).
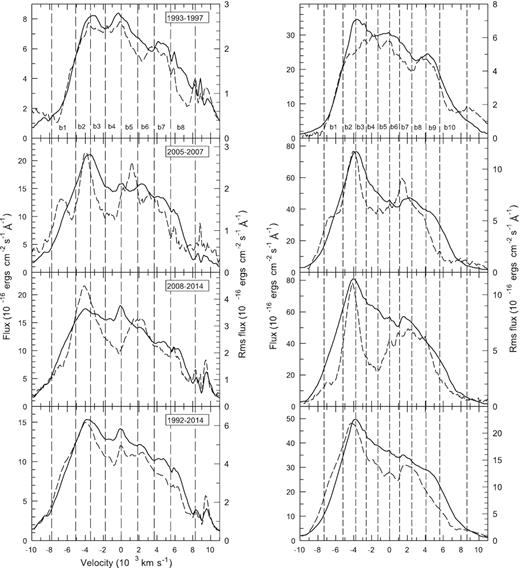
Mean (solid lines) and rms (dashed lines) profiles of the broad H β (left-hand panels) and H α (right-hand panels) lines for the following periods of observations (from the top to bottom): 1993–1997, 2005–2007, 2008–2014, and 1992–2014. The left-hand axes in each panel are for the mean fluxes, while the right-hand axes in each panel are for the rms fluxes.
Emission-line bins.
| Bin | Line | Boundaries | Velocity |
|---|---|---|---|
| No. | (Å) | (km s−1) | |
| 1 | H β | 5000–5045 | −6424 |
| 2 | H β | 5045–5073 | −4254 |
| 3 | H β | 5073–5101 | −2599 |
| 4 | H β | 5101–5131 | −886 |
| 5 | H β | 5131–5163 | +925 |
| 6 | H β | 5163–5195 | +2774 |
| 7 | H β | 5195–5227 | +4620 |
| 8 | H β | 5227–5275 | +6912 |
| 1 | H α | 6760–6808 | −6253 |
| 2 | H α | 6808–6840 | −4491 |
| 3 | H α | 6840–6867 | −3198 |
| 4 | H α | 6867–6897 | −1954 |
| 5 | H α | 6897–6927 | −650 |
| 6 | H α | 6927–6953 | +562 |
| 7 | H α | 6953–6985 | +1812 |
| 8 | H α | 6985–7022 | +3292 |
| 9 | H α | 7022–7058 | +4850 |
| 10 | H α | 7058–7130 | +7140 |
The narrow-line variability leads to the appearance of fictive long-term trends in the derived light curves when the obtained spectra are scaled in flux using narrow-line fluxes. All the results of this paper are given with accounting for this trend (see Paper I, for more details).
3.2 Variability characteristics
The basic variability characteristics of 3C 390.3 for the selected bins of the H β and H α broad-line profiles are summarized in Table 2. As in Paper I, it was considered the four periods of observations: 1993–1997, 2005–2007, 2008–2014, and the entire period of CCD observations of 3C 390.3 at the CrAO (1992–2014). In Table 2, the column ‘Bin No.’ is the bin number, the Fvar parameter is the rms fractional variability, and the Rmax parameter is simply the max-to-min ratio of fluxes. Both the parameters are corrected for the observational uncertainties.
Variability characteristics of the broad H α, H β, and He ii λ4686 Å emission lines.
| Bin | 1993–1997 | 2005–2007 | 2008–2014 | 1992–2014 | |||||||||
|---|---|---|---|---|---|---|---|---|---|---|---|---|---|
| No. | Line | Mean | Fvar | Rmax | Mean | Fvar | Rmax | Mean | Fvar | Rmax | Mean | Fvar | Rmax |
| 1 | H β | 1.29 | 0.315 | 2.72 | 4.51 | 0.142 | 1.62 | 4.83 | 0.169 | 1.95 | 3.71 | 0.443 | 8.30 |
| 2 | H β | 2.00 | 0.316 | 2.90 | 5.34 | 0.125 | 1.55 | 4.70 | 0.247 | 2.49 | 4.06 | 0.398 | 6.80 |
| 3 | H β | 2.20 | 0.312 | 2.74 | 5.13 | 0.094 | 1.36 | 4.54 | 0.194 | 1.92 | 3.98 | 0.350 | 4.87 |
| 4 | H β | 2.39 | 0.316 | 2.44 | 4.55 | 0.092 | 1.36 | 4.89 | 0.137 | 1.75 | 4.01 | 0.324 | 4.67 |
| 5 | H β | 2.36 | 0.292 | 3.06 | 4.76 | 0.146 | 1.58 | 4.91 | 0.181 | 1.86 | 4.06 | 0.349 | 5.37 |
| 6 | H β | 1.99 | 0.306 | 2.41 | 4.77 | 0.116 | 1.41 | 4.16 | 0.218 | 2.15 | 3.64 | 0.371 | 5.02 |
| 7 | H β | 1.99 | 0.297 | 2.66 | 4.15 | 0.101 | 1.43 | 3.60 | 0.178 | 1.92 | 3.24 | 0.319 | 4.30 |
| 8 | H β | 2.12 | 0.203 | 2.06 | 3.31 | 0.072 | 1.27 | 3.78 | 0.158 | 1.64 | 3.15 | 0.269 | 3.12 |
| 1–8 | H β | 12.7 | 0.308 | 2.56 | 29.6 | 0.112 | 1.43 | 28.0 | 0.188 | 2.00 | 23.5 | 0.366 | 5.18 |
| 1 | H α | 5.46 | 0.199 | 2.14 | 16.5 | 0.159 | 1.50 | 20.4 | 0.052 | 1.34 | 10.4 | 0.601 | 5.92 |
| 2 | H α | 9.18 | 0.163 | 1.90 | 21.3 | 0.155 | 1.50 | 23.9 | 0.119 | 1.59 | 14.0 | 0.471 | 4.08 |
| 3 | H α | 9.09 | 0.159 | 1.78 | 19.1 | 0.123 | 1.38 | 19.7 | 0.081 | 1.48 | 12.7 | 0.390 | 3.14 |
| 4 | H α | 9.10 | 0.189 | 1.94 | 16.4 | 0.111 | 1.31 | 19.1 | 0.051 | 1.34 | 12.2 | 0.364 | 3.10 |
| 5 | H α | 9.09 | 0.172 | 1.86 | 14.0 | 0.129 | 1.30 | 17.2 | 0.063 | 1.41 | 11.2 | 0.335 | 2.85 |
| 6 | H α | 7.67 | 0.156 | 1.55 | 11.1 | 0.159 | 1.44 | 13.8 | 0.096 | 1.66 | 9.07 | 0.330 | 3.21 |
| 7 | H α | 8.34 | 0.161 | 1.62 | 14.7 | 0.177 | 1.58 | 17.7 | 0.115 | 1.69 | 10.9 | 0.399 | 3.20 |
| 8 | H α | 8.58 | 0.189 | 1.84 | 15.8 | 0.138 | 1.41 | 17.5 | 0.130 | 1.64 | 11.3 | 0.379 | 3.30 |
| 9 | H α | 8.11 | 0.180 | 1.84 | 12.9 | 0.066 | 1.23 | 12.9 | 0.107 | 1.55 | 9.58 | 0.274 | 2.50 |
| 10 | H α | 7.45 | 0.150 | 1.70 | 10.2 | 0.033 | 1.20 | 10.9 | 0.054 | 1.26 | 8.63 | 0.207 | 2.07 |
| 1–10 | H α | 83.8 | 0.155 | 1.76 | 155.9 | 0.131 | 1.35 | 179.8 | 0.077 | 1.47 | 112.7 | 0.377 | 3.20 |
| 4820–4920Å | He ii | 0.858 | 0.373 | 4.48 | 1.68 | 0.253 | 3.05 | 1.19 | 0.539 | >10 | 1.24 | 0.470 | >10 |
Note. Units for the ‘Mean’ (mean flux) columns are 10−14erg cm−2 s−1 cm−2 s−1.
The considered variability characteristics for any light curve can only be compared to another light curve when both of them are sampled identically. However, there is a notable difference in the sampling of our H α-region and H β-region light curves. To avoid effect of sampling, I have selected quasi-simultaneous data points from both regions to construct identically sampled light curves. Their variability characteristics are given in Table 3 and the Fvar parameter is shown in Fig. 3.
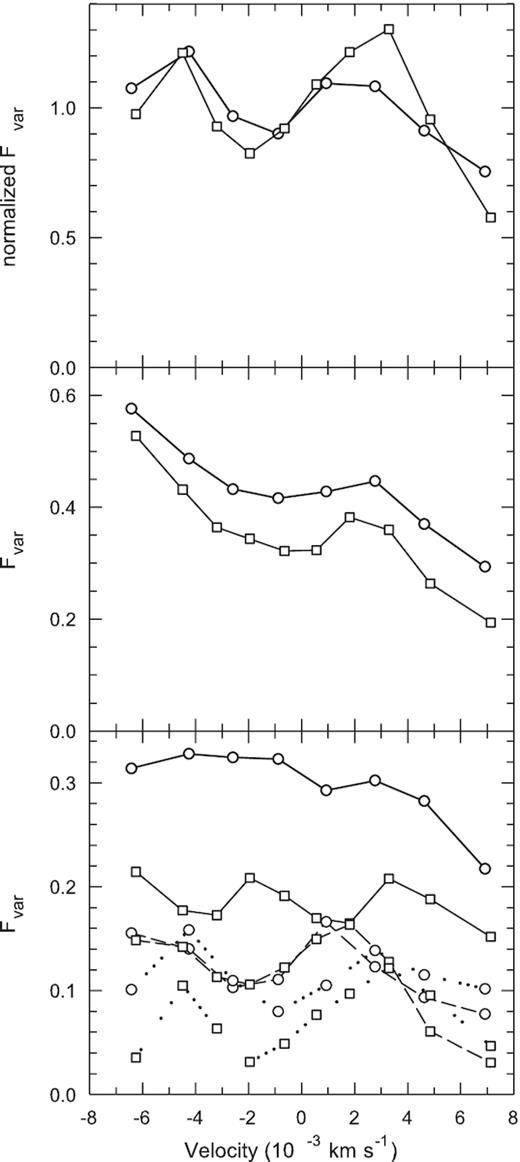
Fractional variability amplitudes for the selected bins of the broad-line profiles. Bottom panel shows amplitudes for the H β (open circles) and H α (open squares) lines for 1993–1997 (solid lines), 2005–2007 (dashed lines), and 2008–2014 (dotted lines). Middle panel shows amplitudes for the entire period of observations, i.e. 1992–2014. Top panel shows the mean normalized amplitudes for the above three periods. The H β and H α light curves are identically sampled in order to correct comparison of amplitudes between both lines (see also Table 3).
Variability characteristics of the identically sampled broad H α, H β, and He ii λ4686 Å emission lines.
| Bin | 1993–1997 | 2005–2007 | 2008–2014 | 1992–2014 | |||||||||
|---|---|---|---|---|---|---|---|---|---|---|---|---|---|
| No. | Line | Mean | Fvar | Rmax | Mean | Fvar | Rmax | Mean | Fvar | Rmax | Mean | Fvar | Rmax |
| 1 | H β | 1.24 | 0.314 | 2.80 | 4.39 | 0.155 | 1.53 | 5.31 | 0.101 | 1.61 | 3.27 | 0.576 | 7.84 |
| 2 | H β | 1.90 | 0.328 | 2.75 | 5.33 | 0.140 | 1.41 | 5.43 | 0.159 | 1.99 | 3.75 | 0.487 | 6.35 |
| 3 | H β | 2.04 | 0.325 | 2.60 | 5.13 | 0.103 | 1.36 | 5.01 | 0.110 | 1.64 | 3.62 | 0.432 | 4.78 |
| 4 | H β | 2.23 | 0.323 | 2.35 | 4.59 | 0.111 | 1.36 | 5.28 | 0.080 | 1.43 | 3.67 | 0.416 | 4.07 |
| 5 | H β | 2.27 | 0.293 | 3.07 | 4.67 | 0.166 | 1.54 | 5.42 | 0.105 | 1.41 | 3.74 | 0.428 | 5.02 |
| 6 | H β | 1.90 | 0.302 | 2.47 | 4.70 | 0.123 | 1.45 | 4.78 | 0.139 | 1.53 | 3.39 | 0.447 | 4.38 |
| 7 | H β | 1.95 | 0.283 | 2.79 | 4.07 | 0.093 | 1.29 | 3.98 | 0.115 | 1.50 | 3.02 | 0.370 | 3.92 |
| 8 | H β | 2.05 | 0.217 | 1.89 | 3.30 | 0.077 | 1.26 | 3.74 | 0.102 | 1.47 | 2.87 | 0.294 | 3.10 |
| 1–8 | H β | 12.1 | 0.309 | 2.54 | 29.4 | 0.123 | 1.36 | 31.2 | 0.112 | 1.59 | 21.4 | 0.453 | 4.86 |
| 1 | H α | 5.57 | 0.214 | 1.86 | 16.7 | 0.149 | 1.53 | 20.5 | 0.036 | 1.21 | 12.9 | 0.528 | 5.13 |
| 2 | H α | 9.33 | 0.177 | 1.71 | 21.5 | 0.142 | 1.46 | 24.2 | 0.105 | 1.38 | 16.7 | 0.432 | 3.70 |
| 3 | H α | 9.16 | 0.173 | 1.66 | 19.3 | 0.113 | 1.36 | 20.0 | 0.063 | 1.24 | 14.7 | 0.364 | 2.86 |
| 4 | H α | 9.19 | 0.209 | 1.75 | 16.5 | 0.106 | 1.32 | 19.2 | 0.031 | 1.17 | 13.9 | 0.344 | 2.74 |
| 5 | H α | 9.21 | 0.191 | 1.69 | 14.1 | 0.122 | 1.32 | 17.3 | 0.049 | 1.37 | 12.6 | 0.322 | 2.57 |
| 6 | H α | 7.68 | 0.170 | 1.63 | 11.2 | 0.150 | 1.48 | 13.9 | 0.077 | 1.34 | 10.2 | 0.323 | 2.85 |
| 7 | H α | 8.30 | 0.165 | 1.60 | 14.8 | 0.164 | 1.59 | 17.9 | 0.097 | 1.39 | 12.6 | 0.382 | 3.21 |
| 8 | H α | 8.66 | 0.208 | 1.78 | 15.9 | 0.128 | 1.44 | 17.7 | 0.122 | 1.65 | 12.9 | 0.359 | 3.21 |
| 9 | H α | 8.14 | 0.188 | 1.94 | 13.0 | 0.061 | 1.25 | 13.1 | 0.096 | 1.32 | 10.6 | 0.264 | 2.66 |
| 10 | H α | 7.64 | 0.152 | 1.65 | 10.2 | 0.031 | 1.21 | 10.9 | 0.047 | 1.17 | 9.22 | 0.194 | 2.20 |
| 1–10 | H α | 84.9 | 0.168 | 1.55 | 157.1 | 0.121 | 1.35 | 181.7 | 0.060 | 1.28 | 129.1 | 0.358 | 2.86 |
| 4820–4920Å | He ii | 0.819 | 0.316 | 4.58 | 1.50 | 0.262 | 2.92 | 1.65 | 0.380 | 14.5 | 1.24 | 0.440 | 9.59 |
Note. Units for the ‘Mean’ (mean flux) columns are 10−14 erg cm−2 s−1.
As can be seen from Table 2 and Fig. 3, the variability amplitude for 1992–2014 (both Fvar and Rmax) is the largest in the far blue wing (Bin no. 1) of the H β and H α lines and it is the smallest in the far red wing of both lines (Bin nos 8 and 10, respectively). Except for these bins, the variability amplitude is slightly greater in the blue wing as compared to the red wing.
3.3 Velocity-resolved lag measurements
The time delays between various light curves were determined as in Sergeev et al. (2002, 2011) and Paper I, i.e. using the interpolation cross-correlation function (ICCF, e.g. Gaskell & Sparke 1986; White & Peterson 1994). The results of the cross-correlation analysis are given in Table 4 and shown in Fig. 4 for the three periods of observations mentioned above: 1993–1997, 2005–2007, and 2008–2014.
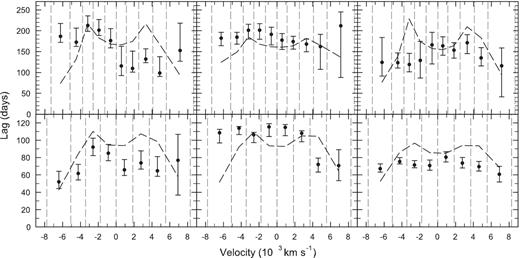
Velocity-resolved lag measurements for the H α (top set of panels) and H β lines (bottom set of panels) for the three observational periods (from the left- to right-hand side): 1993–1997, 2005–2007, and 2008–2014. Dashed lines represent time delays expected from the Keplerian disc model (see the text). Vertical dashed lines are the bin boundaries.
Cross-correlation results.
| Bin | Line | 1993–1997 | 2005–2007 | 2008–2014 | Mean | ||||||
|---|---|---|---|---|---|---|---|---|---|---|---|
| No. | τpeak | τcent | rmax | τpeak | τcent | rmax | τpeak | τcent | rmax | τcent | |
| 1 | H β | |$44.9^{+18.3 }_{-3.8 }$| | |$51.8^{+12.4}_{-7.6 }$| | 0.932 | |$105.2^{+11.7}_{-11.1 }$| | |$108.5^{+4.0 }_{-11.7}$| | 0.807 | |$57.1^{+11.7}_{-1.4 }$| | |$67.1^{+5.6}_{-3.9}$| | 0.911 | 75.8 ± 12.2 |
| 2 | H β | |$48.8^{+10.0 }_{-4.9 }$| | |$61.6^{+10.5}_{-7.5 }$| | 0.953 | |$108.9^{+9.2 }_{-6.2 }$| | |$113.8^{+2.0 }_{-7.3 }$| | 0.929 | |$57.7^{+10.3}_{-1.0 }$| | |$75.3^{+4.7}_{-2.7}$| | 0.966 | 83.6 ± 11.7 |
| 3 | H β | |$67.9^{+35.1 }_{-18.1}$| | |$92.1^{+10.3}_{-9.8 }$| | 0.926 | |$107.3^{+0.8 }_{-13.0 }$| | |$106.3^{+2.8 }_{-9.0 }$| | 0.920 | |$55.8^{+6.3 }_{-1.6 }$| | |$71.3^{+5.1}_{-3.1}$| | 0.948 | 89.9 ± 8.4 |
| 4 | H β | |$68.1^{+28.3 }_{-16.7}$| | |$84.9^{+10.3}_{-8.5 }$| | 0.936 | |$108.3^{+14.8}_{-6.3 }$| | |$115.4^{+3.6 }_{-11.1}$| | 0.883 | |$55.7^{+23.5}_{-2.4 }$| | |$70.7^{+6.4}_{-5.3}$| | 0.921 | 90.3 ± 10.1 |
| 5 | H β | |$49.7^{+16.0 }_{-5.0 }$| | |$65.8^{+12.0}_{-6.6 }$| | 0.930 | |$124.0^{+0.2 }_{-25.0 }$| | |$114.7^{+3.5 }_{-9.5 }$| | 0.855 | |$54.3^{+66.8}_{-4.1 }$| | |$80.4^{+6.4}_{-5.6}$| | 0.910 | 87.0 ± 10.5 |
| 6 | H β | |$50.0^{+21.7 }_{-1.8 }$| | |$73.8^{+14.0}_{-7.2 }$| | 0.918 | |$107.2^{+6.5 }_{-13.0 }$| | |$107.9^{+3.2 }_{-9.6 }$| | 0.875 | |$54.9^{+30.4}_{-16.0}$| | |$73.5^{+6.6}_{-5.5}$| | 0.921 | 85.1 ± 8.7 |
| 7 | H β | |$50.3^{+17.6 }_{-1.1 }$| | |$64.6^{+16.5}_{-6.4 }$| | 0.918 | |$80.1 ^{+5.0 }_{-9.9 }$| | |$71.9 ^{+7.5 }_{-8.7 }$| | 0.889 | |$54.9^{+3.9 }_{-8.1 }$| | |$69.5^{+6.1}_{-5.1}$| | 0.919 | 68.7 ± 5.2 |
| 8 | H β | |$40.3^{+106.9}_{-7.6 }$| | |$76.8^{+31.5}_{-40.0}$| | 0.825 | |$77.2 ^{+14.6}_{-31.1 }$| | |$70.6 ^{+18.5}_{-17.3}$| | 0.706 | |$54.8^{+14.1}_{-4.9 }$| | |$60.7^{+9.3}_{-8.8}$| | 0.508 | |$69.4^{+10.9}_{-16.2}$| |
| 1 | H α | |$210.2^{+20.0}_{-14.9 }$| | |$186.2^{+31.2}_{-14.0}$| | 0.854 | |$182.8^{+35.9}_{-33.1}$| | |$182.2^{+13.9}_{-18.1}$| | 0.937 | |$113.8^{+71.4}_{-16.5}$| | |$124.0^{+59.9}_{-32.6}$| | 0.709 | 164.1 ± 18.2 |
| 2 | H α | |$196.2^{+24.7}_{-17.4 }$| | |$172.4^{+33.9}_{-10.1}$| | 0.870 | |$183.1^{+34.8}_{-12.3}$| | |$184.5^{+11.7}_{-16.9}$| | 0.956 | |$113.9^{+21.3}_{-6.1 }$| | |$123.3^{+23.6}_{-12.8}$| | 0.890 | 160.0 ± 15.0 |
| 3 | H α | |$219.9^{+21.2}_{-13.2 }$| | |$212.4^{+23.1}_{-13.9}$| | 0.894 | |$193.3^{+31.8}_{-9.1 }$| | |$200.9^{+14.7}_{-20.9}$| | 0.940 | |$116.8^{+19.3}_{-11.8}$| | |$118.8^{+26.6}_{-17.5}$| | 0.870 | 177.4 ± 23.2 |
| 4 | H α | |$208.2^{+28.5}_{-12.4 }$| | |$201.2^{+25.6}_{-12.4}$| | 0.908 | |$223.7^{+4.1 }_{-41.4}$| | |$201.1^{+16.0}_{-21.8}$| | 0.940 | |$116.9^{+64.4}_{-41.7}$| | |$128.9^{+45.6}_{-42.5}$| | 0.655 | 177.1 ± 20.2 |
| 5 | H α | |$196.0^{+28.1}_{-48.0 }$| | |$176.0^{+29.3}_{-17.1}$| | 0.868 | |$189.8^{+33.1}_{-29.1}$| | |$190.9^{+17.5}_{-24.9}$| | 0.939 | |$180.8^{+23.5}_{-67.0}$| | |$165.8^{+30.2}_{-45.3}$| | 0.643 | 177.6 ± 16.3 |
| 6 | H α | |$91.7 ^{+81.0}_{-11.4 }$| | |$115.4^{+47.2}_{-22.9}$| | 0.721 | |$182.8^{+24.1}_{-45.0}$| | |$177.4^{+16.1}_{-22.1}$| | 0.942 | |$181.0^{+6.1 }_{-60.2}$| | |$163.2^{+22.3}_{-21.9}$| | 0.816 | 152.0 ± 15.6 |
| 7 | H α | |$93.8 ^{+59.0}_{-12.8 }$| | |$109.4^{+41.9}_{-8.8 }$| | 0.689 | |$182.8^{+17.0}_{-45.7}$| | |$173.7^{+13.0}_{-18.0}$| | 0.929 | |$135.2^{+45.7}_{-18.1}$| | |$153.2^{+17.9}_{-19.1}$| | 0.868 | 145.5 ± 11.8 |
| 8 | H α | |$91.7 ^{+83.4}_{-4.4 }$| | |$131.8^{+24.9}_{-8.2 }$| | 0.841 | |$179.2^{+10.1}_{-45.5}$| | |$167.9^{+12.5}_{-18.6}$| | 0.942 | |$171.8^{+45.9}_{-52.6}$| | |$171.0^{+19.7}_{-25.7}$| | 0.762 | 156.9 ± 11.5 |
| 9 | H α | |$76.9 ^{+58.9}_{-8.1 }$| | |$98.3 ^{+39.3}_{-7.8 }$| | 0.789 | |$188.1^{+8.9 }_{-87.4}$| | |$161.9^{+29.7}_{-54.7}$| | 0.851 | |$116.9^{+35.0}_{-4.6 }$| | |$134.6^{+24.9}_{-19.0}$| | 0.852 | 131.6 ± 17.2 |
| 10 | H α | |$195.9^{+40.9}_{-111.7}$| | |$152.6^{+65.7}_{-25.9}$| | 0.740 | |$197.0^{+52.2}_{-110 }$| | |$211.5^{+33.3}_{-124 }$| | 0.698 | |$116.8^{+35.5}_{-118 }$| | |$115.9^{+42.7}_{-74.3}$| | 0.233 | 160.0 ± 34.2 |
| – | He ii λ4686 Å | |$23.1^{+24.2}_{-13.1}$| | |$32.6^{+18.9}_{-13.9}$| | 0.812 | |$39.3^{+9.9}_{-7.0}$| | |$37.2^{+6.9}_{-7.6}$| | 0.836 | |$22.9^{+1.0}_{-14.8}$| | |$13.0^{+7.7}_{-8.3}$| | 0.908 | 25.9 ± 8.2 |
The lags were measured from both the location of the maximum value of the ICCF correlation coefficient (rmax) and from the ICCF centroid based on all points with r ≥ 0.8rmax (designated as τpeak and τcent, respectively). The lag uncertainties were computed using the model-independent Monte Carlo flux randomization/random subset selection (FR/RSS) technique described by Peterson et al. (1998). Also given in the last column of Table 4 and shown in Fig. 5 is the unweighted mean lag for the three periods of observations. The uncertainties in the mean lag were computed as described in Paper I. Except Bin No. 8 of the H β line, the derived probability distributions of the mean lag were found to be close to the normal distribution, so only ± uncertainties are given (no + and − separately).
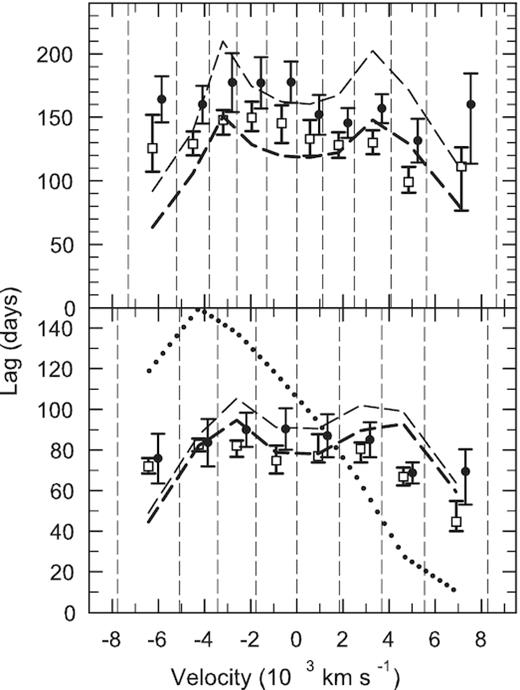
Velocity-resolved lag measurements for the H α (top panel) and H β lines (bottom panel). Filled circles are unweighted mean lag over three periods of observations (lag measurements for each period are shown in Fig. 4), while open squares are time delays obtained from the entire observational period but with removing a long-term trend (see the text). Dashed lines and dotted line represent time delays as expected from the Keplerian disc model and from the spherically symmetrical shell with radial infall motion, respectively. The filled circles are offset by +400 km s−1 for clarity. The thick dashed lines represent best fit to the open squares by varying the black hole mass in terms of the Keplerian disc model. Vertical dashed lines are the bin boundaries.
As was shown in Paper I , the reverberation mapping can only be applied to the entire period of observations of the 3C 390.3 nucleus after removing a long-term trend. This trend has been expressed by a slowly varying scale factor c(t) in the power-law relationship between the line and continuum fluxes: |$F_{\rm line}\propto c(t)\, F_{\rm cont}^a$|. In Paper I, a power-law index a was found to be 0.77 and 0.54 for the H β and H α total fluxes, respectively. This lag has been computed for the considered bins and it is shown in Fig. 5. As can be seen from Fig. 5, the lag for the entire period is slightly less than the lag averaged over the individual periods (the lag from Table 4, last column).
Finally, it was checked what the velocity-dependent lag is expected from the simplest kinematic models of the BLR. In Sergeev et al. (2002), a model profile produced by the relativistic Keplerian disc configuration (e.g. Chen et al. 1989; Eracleous & Halpern 1994) has been fitted to the mean observed profiles of the H β and H α lines. For the H β line, the following disc parameters have been obtained: |$r_{\rm in} = 104\, r_g$|, |$r_{\rm out} = 840\, r_g$|, i = 27|${_{.}^{\circ}}$|6, and α = 2.48, where |$r_g = 2\, G\, M / c^2$| is the gravitational radius and the disc parameters are the inner/outer radii, inclination angle (i = 0 for pole-on configuration), and emissivity per unit surface: ε(r) ∝ r−α. Fig. 6 shows the observed and fitted profiles for this configuration as well as the lag-velocity dependence expected from. To simulate observed H β and H α light curves, the model-dependent mass of the central black hole has been set to |$2.5\times 10^9$| and |$4.1\times 10^9\, \mathrm{M}_\odot$| for the H β and H α lines, respectively (see section 3.5, table 7 from Paper I). The mass difference probably reflects a difference between kinematics of the emission regions of both lines. The expected lag-velocity dependence for the Keplerian disc model is shown in Figs 4 and 5 by dashed lines. The thick dashed line in Fig. 5 represents the best fit to the observed lag-velocity dependence by varying the black hole mass in terms of the Keplerian disc model. The best fit gives the black hole mass of |$2.4\times 10^9$| and |$3.1\times 10^9\, \mathrm{M}_\odot$| for the H β and H α lines, respectively.
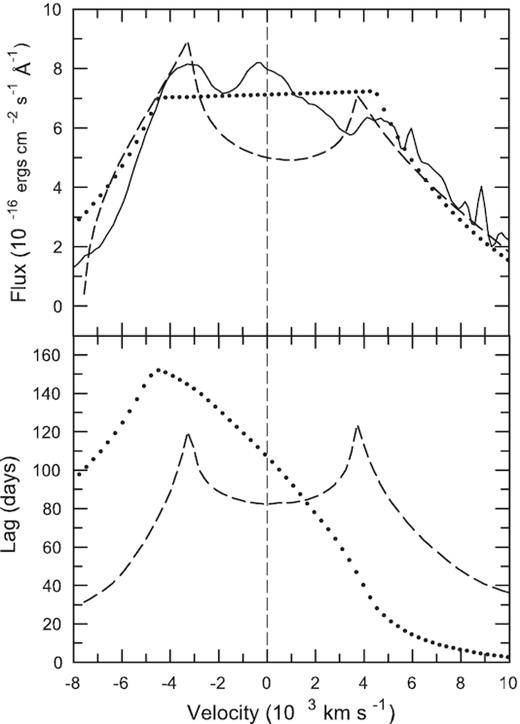
Solid line in the top panel is the observed broad profile of the H β line. Dashed and dotted lines in the same panel are fit to the observed profile in terms of the Keplerian disc model and the spherically symmetric shell with the radial infall motion, respectively. Bottom panel shows a velocity-resolved lag as expected from both models.
Similarly, I have considered a spherically symmetric shell with radial free-fall motion. The fitting results for the H β line and the expected lag-velocity dependence for this configuration are shown in the Fig. 5. For the H β line, the following shell parameters have been obtained: |$r_{\rm in} = 510\, r_g$|, |$r_{\rm out} = 4450\, r_g$|, and α = 3.22, where emissivity per unit volume is ε(r) ∝ r−α. The model-dependent black hole mass has been selected to match the observed lag for the total H β fluxes and it was found to be |$5.0\times 10^8\, \mathrm{M}_\odot$|.
It is obvious that the observed velocity-dependent lag strongly contradicts the spherical infall configuration for which a maximum lag value among the bins in the blue wing should exceed a minimum lag value among the bins in the red wing by 15 times (Fig. 5). Instead, the observed dependence is similar to that expected from the disc configuration as can be seen from Figs 4 and 5, although there are some differences. For example, the observed lag for the Bin No. 7 for the H β line is significantly less than the expected from the disc model and the observed lag-velocity dependence does not look clearly a double-peaked, as expected. Also, it seems that the blue wing lag is greater than the red wing lag, which is a signature of infall motion. However, the significance of the lag difference between both wings as compared to the expected difference in terms of the considered disc model was found to be ≈2.5σ, so the presence of an additional infall motion is not significant enough.
There are numerous observational evidence for the existence of the gas infall motion in AGN, e.g. reverberation mapping results (Denney et al. 2009; Grier et al. 2013, 2017) or redshifted absorption lines (Shi et al. 2016; Rubin 2017; Zhou et al. 2019). It is obvious that there must be mechanisms for angular momentum loss of the line-emitting gas for such a motion. These mechanisms (except for galaxy interactions) can, for example, be the tidally disrupted dusty clumps (Wang et al. 2017) or magnetorotational instability (Gaskell & Goosmann 2013).
3.4 He ii λ4686 Å
Since the broad He ii λ4686 Å line is blended with the broad H β line, it is impossible to measure its total flux. So, its flux has been measured in the blue wing at the wavelength range of 4820–4920 Å (heliocentric reference frame), which is at the line-of-sight velocity range from −7730 to −1570 km s−1. It seems that the broad He ii line is free from any other broad-line features at above range. Several weak narrow-line features were removed from the broad He ii profile using the [O iii] λ5007 Å narrow-line profile as a template in order to obtain a pure He ii broad-line fluxes. The continuum zones for the He ii line were chosen to be 4428–4448 and 4735–4775 Å. The narrow He ii line fluxes have been measured as well using the [O iii] line profile as a template to separate He ii narrow line from the He ii+H β broad-line profiles. The mean and rms He ii+H β profiles are shown in Fig. 7.
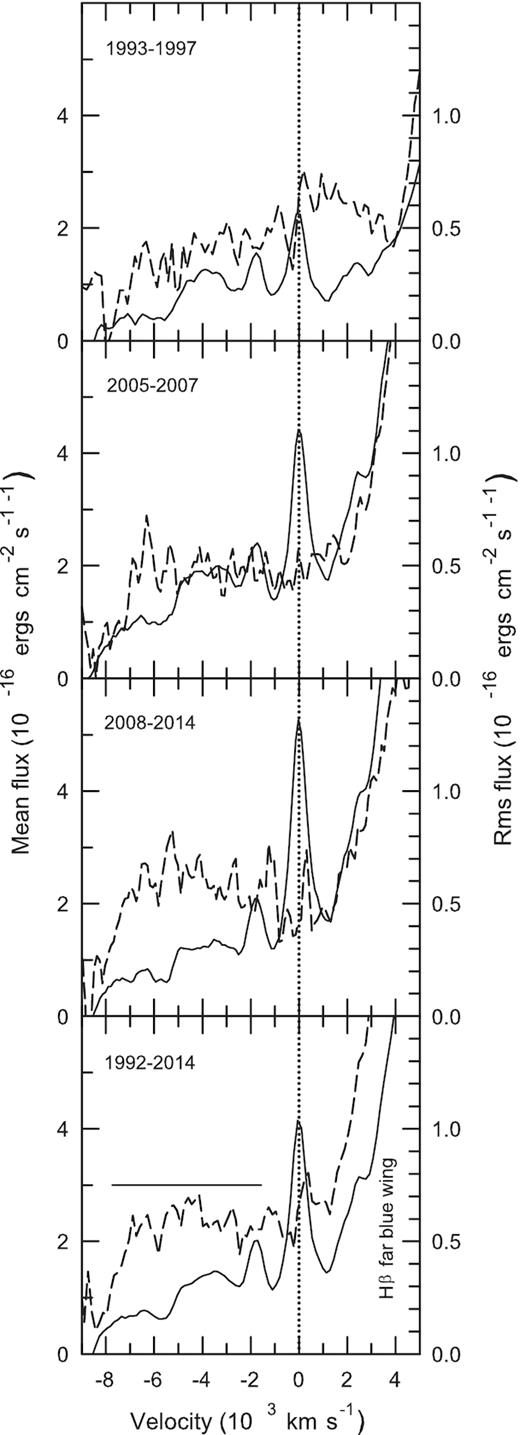
Mean (solid lines) and rms (dashed lines) profiles of the He ii λ4686 Å line superposed on the far blue wing of the broad H β line for the following periods of observations (top-to-bottom): 1993–1997, 2005–2007, 2008–2014, and 1992–2014. The left-hand axes are the mean fluxes, while the right-hand axes are the rms fluxes. The rms pfofiles consist of the broad-line components only (narrow-line components are previously subtracted), while the mean profiles consist of both the broad and narrow components. Vertical dotted lines indicate zero velocity, while the solid horizontal line at the bottom panel indicates the integration zone to obtain the light curve of the broad He ii line. The variability of the narrow He ii line is clearly seen.
Both the broad and narrow He ii line light curves are shown in Fig. 8. The optical continuum and the H β light curves from Paper I are shown in the same figure for comparison. The variability characteristics of the broad He ii line are given in Table 2 and 3, last rows. Both the Fvar and Rmax values are corrected for the observational uncertainties. As can be seen from Tables 2 and 3, the variability amplitude of the broad He ii line is greater than that of the Balmer lines for all observational periods. However, the He ii fractional variability amplitude (Fvar) for the entire observational period is comparable to that of H β (Table 3), while the max-to-min ratio of fluxes (Rmax) is much greater for the He ii line. This is because the Balmer lines and the optical continuum contain a long-term trend that is not seen in the helium line (Fig. 8). This trend provides an additional increase in the variability amplitude of the Balmer lines and the optical continuum as compared to the He ii line when the entire observational period is considered.
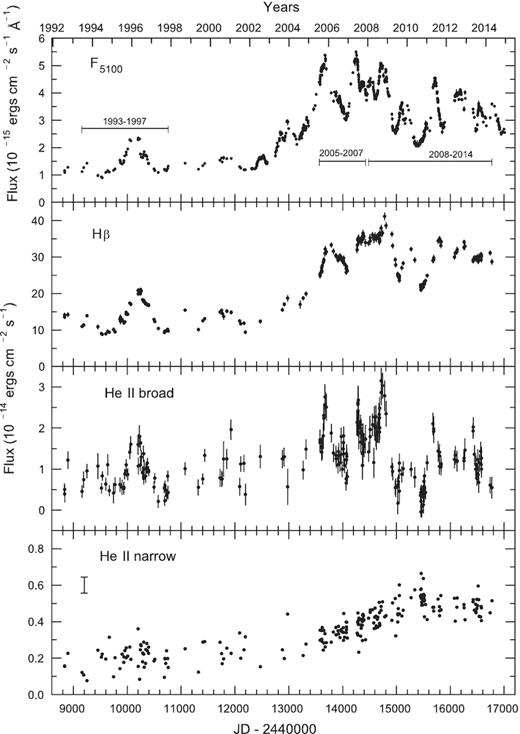
Light curves (from the top to bottom panels) for the continuum at λ5100 Å and for the broad H β and broad and narrow He ii λ4686 Å emission lines. The vertical error bar in the bottom panel represents uncertainties derived from the point-to-point scattering.
The narrow He ii line is variable as well with the variability amplitude Rmax ≈ 3. It is greater than the variability amplitudes of both the narrow Balmer lines (Rmax = 1.6) and narrow [O iii] line (Rmax = 1.3); see Paper I. The cross-correlation function for the narrow He ii light curve gives a response to the continuum variations with a lag of |$\tau _{\rm cent} = 1298^{+90}_{-78}$| d and rmax = 0.825. However, cross-correlation analysis cannot be applicable in this case because the narrow He ii light curve is not only time-shifted, but too smooth. It does not trace continuum events except for the long-term trend.
The cross-correlation results for the broad He ii line are given in Table 4, last row. As can be seen from Table 4, the lag uncertainty for the He ii line for 1993–1997 is more than twice greater than the uncertainties for 2005–2007 and 2008–2014, while the uncertainties for the last two periods are approximately the same. Therefore, the mean lag value in the last colum and last row of Table 4 is a weighted mean. The statistical weights were chosen to be 1/4, 1, and 1 for above three periods. The uncertainty in the mean lag value was computed as described in Paper I using probability distributions for τcent for each period. These distributions were obtained using the model-independent Monte Carlo FR/RSS technique described by Peterson et al. (1998) and they are shown in Fig. 9. The mean lag value for the He ii line is 26 ± 8 d, significantly less than that of the Balmer lines (cf. Paper I), so the He ii emission region is much smaller in size.
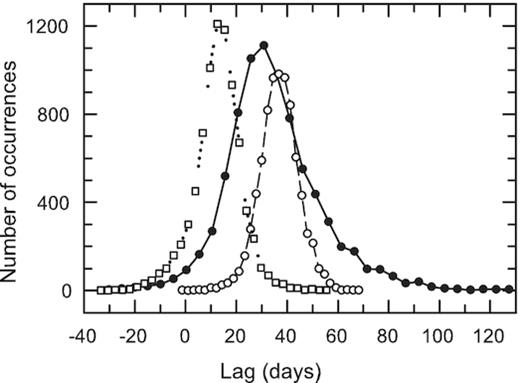
Probability distributions for a lag (τcent) between optical continuum and He ii λ4686 Å broad emission line for 1993–1997 (filled circles connected by a solid line), 2005–2007 (open circles connected by a dashed line), and 2008–2014 (open squares connected by a dotted line). The distributions are derived from the FR/RSS technique.
Finally, I have applied the cross-correlation analysis for the He ii line to the entire observational period, but with removing a long-term trend. As for the Balmer lines in Paper I, this trend has been expressed by a slowly varying scalefactor c(t) in the power-law relationship between the line and continuum fluxes: |$F_{\rm line}\propto c(t)\, F_{\rm cont}^a$|. The lag was found to be |$25.9^{+7.2}_{-9.0}$| d, while a power-law index a equals to 1.03. In Paper I, this index was found to be 0.77 and 0.54 for the H β and H α total fluxes, respectively. So, the variability amplitude must be largest in the He ii line, less in H β, and more less in H α, just as observed.
4 SUMMARY
The observed velocity-dependent lag for the Balmer lines is similar to that expected from the Keplerian disc configuration, although there are some differences. Probably, a radial infall motion can be present in the BLR of 3C 390.3 in addition to the Keplerian rotation.
The mean weighted lag of the broad He ii λ4686 Å emission line is 26 ± 8 d, significantly less than that of the Balmer lines (cf. Paper I), so the He ii emission region is much smaller in size. This value need to be corrected for time dilation by dividing by 1 + z to put it into the rest frame.
In terms of the power-law relationship between line and continuum fluxes in 3C 390.3: |$F_{\rm line}\propto c(t)\, F_{\rm cont}^a$|, where c(t) is a slowly varying scale factor, a power-law index a for the broad He ii λ4686 Å line is equal to 1.03, while according to Paper I, it is equal to 0.77 and 0.54 for the H β and H α lines, respectively. It means that the variability amplitude is the largest in the He ii, less in H β, and more less in H α. However, the He ii variability amplitude (Fvar) for the entire observational period is comparable to that of H β because the Balmer lines and optical continuum light curves both contain a long-term trend that is not seen in the helium line.
The narrow He ii λ4686 Å line is variable with the variability amplitude Rmax ≈ 3. It is greater than the variability amplitudes of both the narrow Balmer lines (Rmax = 1.6) and the narrow [O iii] λ5007 Å line (Rmax = 1.3); see Paper I. So, the narrow He ii line emission region is more compact than that of the Balmer lines and [O iii].
The variability amplitude is found to be the largest in the far blue wing of the broad H β and H α lines, and it is the smallest in the far red wing of both lines.
ACKNOWLEDGEMENTS
The CrAO CCD cameras have been purchased through the US Civilian Research and Development Foundation for the Independent States of the Former Soviet Union (CRDF) awards UP1-2116 and UP1-2549-CR-03.
