-
PDF
- Split View
-
Views
-
Cite
Cite
James Binney, Trapped orbits and solar-neighbourhood kinematics, Monthly Notices of the Royal Astronomical Society, Volume 495, Issue 1, June 2020, Pages 895–904, https://doi.org/10.1093/mnras/staa1103
Close - Share Icon Share
ABSTRACT
Torus mapping yields constants of motion for stars trapped at a resonance. Each such constant of motion yields a system of contours in velocity space at the Sun and neighbouring points. If Jeans’ theorem applied to resonantly trapped orbits, the density of stars in velocity space would be equal at all intersections of any two contours. A quantitative measure of the violation of this principle is defined and used to assess various pattern speeds for a model of the bar recently fitted to observations of interstellar gas. Trapping at corotation of a bar with pattern speed near |$36\, \mathrm{Gyr}^{-1}$| is favoured and trapping at the outer Lindblad resonance is disfavoured. As one moves around the Sun the structure of velocity space varies quite rapidly, both as regards the observed star density and the zones of trapped orbits. The data seem consistent with trapping at corotation.
1 INTRODUCTION
The release of kinematic data from Gaia in 2018 April allowed the study of velocity space with unprecedented precision. Study of this space was opened up by the first astrometric satellite, Hipparcos (Perryman et al. 1997). Hipparcos did not provide line-of-sight velocities so Dehnen (1998) mapped velocity space using five-dimensional data. The all-sky nature of the Hipparcos catalogue enabled him to infer the probability density of stars in velocity space, but individual stars could only be assigned locations in velocity space on the release of data from the Geneva–Copenhagen Survey (hereafter GCS; Nordström et al. 2004; Holmberg, Nordström & Andersen 2009; Casagrande et al. 2011), which measured, inter alia, line-of-sight velocities v∥. Once the GCS data were available it became clear that little of the structure in velocity space is due to dissolving groups of coeval stars since prominent structures contained stars widely spread in age and chemical composition (Famaey et al. 2005).
Dehnen (1999, 2000) proposed that the ‘Hercules stream’, the dominant feature at low azimuthal velocity V, is caused by the outer Lindblad resonance (OLR) of the Galactic bar. More recently, Pérez-Villegas et al. (2017) have attributed the Hercules stream to the bar’s corotation resonance, but this association is controversial (Monari et al. 2017a; Fragkoudi et al. 2019; Trick et al. 2019a). De Simone, Wu & Tremaine (2004) investigated the possibility that much of the remaining structure is caused by spiral arms, a possibility that was been examined several times subsequently (e.g. Sellwood 2010; Hahn, Sellwood & Pryor 2011; McMillan 2011, 2013).
The last decade has seen growing awareness of the value of angle-action coordinates for Galactic dynamics, in part due to the discovery of an algorithm, the ‘Stäckel Fudge’ (Binney 2012), for computing angles and actions |$(\boldsymbol {\theta },{\boldsymbol J})$| from ordinary phase-space coordinates (x, v) of particles moving in any realistic axisymmetric Galactic potential Φ(R, z). Several papers (e.g. Binney & Schönrich 2018; Bland-Hawthorn et al. 2019; Hunt et al. 2019; Trick, Coronado & Rix 2019b; Vasiliev 2019) have used this algorithm to discuss distributions of angle-action coordinates using data from Gaia’s second data release (Gaia Collaboration 2018b).
The distribution of stars in three-dimensional action space has attracted the most attention because, by the theorem of Jeans (1916), a relaxed Galaxy would be fully described by this distribution. Moreover, each point in this space is associated with three characteristic frequencies Ωr, Ωϕ, and Ωz, and the planes on which these frequencies satisfy a resonant condition |${\boldsymbol N}\cdot {\boldsymbol \Omega}=m\Omega _{\rm p}$| are of interest. Here N is a vector with integer components, m is another integer, and Ωp is the ‘pattern speed’ of the Galactic bar or a system of spiral arms. Several attempts have been made, with mixed success, to identify features in the computed density of stars in action space with such resonant planes (Monari et al. 2017b, 2019; Fragkoudi et al. 2019; Hunt et al. 2019).
Any system of angle-action coordinates is a valid system of canonical coordinates for phase space and the distribution of stars in its action space may be of interest, but the system is most valuable if the Galaxy’s Hamiltonian H(x, v) is a function H(J) of the actions alone. Hitherto stars have been assigned locations in action space under the assumption that the Galaxy’s gravitational field is axisymmetric although the bar and spiral structure ensure that it is not. Hence, the coordinates employed do not make the true Hamiltonian a function H(J). In this paper, the mapping between velocity space and action space is discussed using actions that make the Hamiltonian of a realistic model of the Galaxy’s barred gravitational field a function H(J) of the actions only.
Introduction of a rotating bar qualitatively changes the structure of action space. In fact, through the phenomenon of resonant trapping, it splits action space into disjoint pieces because there is a separate action space for each family of trapped orbits. Previous papers in this series (Binney 2016, 2018, 2020) demonstrated that torus mapping (Binney & McMillan 2016, and references therein) in combination with resonant perturbation theory, enables one to compute, with remarkable accuracy, the mapping |$(\boldsymbol {\theta },{\boldsymbol J})\rightarrow ({\boldsymbol x},{\boldsymbol v})$| for any family of resonantly trapped orbits. One can also compute the boundaries of the region in the action space of the underlying axisymmetric model that should be excised and replaced with the action space of the trapped orbits. Outside this excised area, non-resonant perturbation theory can be used to modify actions computed under the assumption of axisymmetry into actions that reflect the presence of the bar.
Section 2 reviews the methodology by which maps |$(\boldsymbol {\theta },{\boldsymbol J})\rightarrow ({\boldsymbol x},{\boldsymbol v})$| are computed for resonantly trapped orbits. Section 3 discusses the structure in velocity space of orbits trapped at corotation, while Section 4 presents a similar exercise for orbits trapped at the OLR. Section 5 compares predictions for trapping at corotation with Gaia data for velocity spaces at points a kpc distant from the Sun. Section 6 sums up.
2 BACKGROUND
The work reported here relies on torus mapping, which was introduced by McGill & Binney (1990), completed by Binney & Kumar (1993) and brought to a high state of development in the PhD thesis of Kaasalainen (Kaasalainen 1994, 1995a, b; Kaasalainen & Binney 1994). A publicly available implementation of the technique in c++ was released as the ‘Torus Mapper’ (hereafter tm) by Binney & McMillan (2016). The key idea is that orbital tori in phase space (surfaces J = constant) can be constructed by injecting an analytically obtained ‘toy torus’ into the Galaxy’s phase space with a canonical map that is adjusted to minimize the variance of the Galaxy’s Hamiltonian within the three-dimensional volume of the injected torus. The toy torus is obtained by solving the Hamilton–Jacobi equation by separation of variables, typically under the assumption of a spherical potential.
The injected torus is characterized by the numbers that define the toy torus and the canonical transformation. Fewer than 100 numbers almost always suffice. Once a torus has been constructed, not only can the position of a star with the given actions be predicted at negligible cost arbitrarily far in the past or the future, but one can determine whether a star will reach any given location x, and, if it does, determine the velocities it will then have, and the contribution it will make to the stellar density at x. Consequently, a torus contains much more information than the time series one obtains by integrating an orbit with a Runge–Kutta or similar algorithm.
Given a grid of injected tori in action space, intervening tori can be quickly constructed by interpolation (Binney & McMillan 2016). This possibility plays a key role in the construction of the tori of trapped orbits by resonant perturbation theory. This theory uses a canonical transformation to isolate a ‘slow angle’ and its conjugate action. One neglects the dependence of the Hamiltonian on the remaining ‘fast’ angles and solves for the motion in the two-dimensional space of the slow angle and action. Motion in this two-dimensional phase space is essentially that of a pendulum, which up to a certain critical energy oscillates, but above this energy circulates (Lichtenberg & Lieberman 1983). A companion paper (Binney 2020) shows that the traditional approach to this problem breaks down in the case of Lindblad resonances but can be fixed up within the context of tm.
Resonant perturbation theory works exceptionally well in combination with torus mapping for two reasons. First, torus mapping (which is not a perturbative technique) enables one to construct an integrable Hamiltonian H0(J) that is much closer to the true Hamiltonian H(θ, J) than one can come in traditional applications of perturbation theory. Second, tm allows one not only to handle motion in the plane of the slow angle and action more completely than hitherto, but also to include subsequently contributions from the fast angles.
When an orbit becomes trapped, the actions conjugate to its two fast angles remain (approximately) constants of motion, while the slow action can no longer serve as a conserved quantity. Its place as an action is taken by the action of libration |${\cal J}$| which is the amplitude of motion in the plane of the slow angle and its action. The variable conjugate to |${\cal J}$| is the angle of libration θℓ, which evolves linearly in time with a new angular frequency Ωℓ. There is an upper limit |${\cal J}_{\rm max}$| on the action of libration, which corresponds to the action of a pendulum that has just enough energy to reach top dead centre but cannot quite pass over it. Just as the period of a pendulum tends to infinity as its energy approaches the critical value, so a star’s libration frequency Ωℓ tends to zero as |${\cal J}$| tends to |${\cal J}_{\rm max}$|.
2.1 Solar position and velocity
Distances are taken from Schönrich, McMillan & Eyer (2019), who adopt |$8.27\, \mathrm{kpc}$| as the distance to the Galactic Centre and |$(U_0,V_0,W_0)=(11.1,250,7.47)\, \mathrm{km\, s}^{-1}$| as the Sun’s Galactocentric velocity. According to this assumption, the Sun is moving towards the Galactic Centre, ahead of the local circular speed |$\Theta _0=239\, \mathrm{km\, s}^{-1}$| and up out of the plane. The angle between the bar’s long axis and the Sun–Centre line is taken to be 25 deg.
2.2 Units
The units of mass, length, and time are |$1\, {\rm M}_\odot$|, |$1\, \mathrm{kpc}$|, and |$1\, \mathrm{Myr}$|, respectively. The unit of velocity is then |$\, \mathrm{kpc}\, \mathrm{Myr}^{-1}\simeq 978\, \mathrm{km\, s}^{-1}$|, so actions have units of |$\, \mathrm{kpc}^2\, \mathrm{Myr}^{-1}$|. Frequencies are plotted in units of Gyr|$^{-1}=0.978\, \mathrm{km\, s}^{-1}\, \mathrm{kpc}^{-1}$|.
2.3 Galactic potential
The Galactic potential is modelled as the sum of an axisymmetric part and a modulation in azimuthal angle ϕ that carries no net mass. The axisymmetric component is the potential fitted by McMillan (2017) to a variety of data tweaked to yield |$R_0=8.27\, \mathrm{kpc}$| and |$\Theta _0=239\, \mathrm{km\, s}^{-1}$| by increasing the central surface density and scale length of the stellar disc from 8.96 × 10⁸ to |$9.2\times 10^8\, {\rm M}_\odot \, \mathrm{kpc}^{-2}$| and from 2.5 to |$2.6\, \mathrm{kpc}$|.
The azimuthal angle is measured relative to the bar’s long axis, which rotates at angular frequency Ωp. Sormani et al. (2015) adopted |$v_0=220\, \mathrm{km\, s}^{-1}$|, and inferred from longitude velocity plots of H i and CO that |$A\gtrsim 0.4$| and |$r_{\rm q}\simeq 1.7\, \mathrm{kpc}$|. The results below are for |$v_0=220\, \mathrm{km\, s}^{-1}$|, A = 0.4, and |$r_{\rm q}=1.7\, \mathrm{kpc}$|.
The expansion Φ(R, z, ϕ) = Φ0(R, z) + Φ2(R, z)cos (2ϕ) must be regarded as the simplest non-trivial analytic form for the potential of a barred galaxy. This approximation has been adopted in numerous prior studies (e.g. Dehnen 1999; Sormani et al. 2015; Monari et al. 2017b) of our Galaxy. Ultimately, terms |$\propto \cos (4\phi),\, \cos (6\phi)$| and perhaps even cos (3ϕ) will have to be added, and there are already indications that such additional terms may play important roles (Pérez-Villegas et al. 2017; Monari et al. 2019). Including these terms lies beyond the scope of this paper, which breaks new ground by applying orbital tori to stars measured by Gaia and potentially trapped by the bar.
3 ORBITS TRAPPED AT COROTATION
At corotation Jϕ is the slow action that is replaced by |${\cal J}$|, and its conjugate angle θϕ is replaced by the angle of libration θℓ. Jr plays the role of the surviving fast action |$J_3^{\prime }$|.
Fig. 1 shows the location in local velocity space of orbits trapped by the Sormani et al. bar if |$\Omega _{\rm p}=33\, \mathrm{Gyr}^{-1}$|. These orbits were obtained by sampling the action-space plane |$J_z=0.0025\, \mathrm{kpc}^2\, \mathrm{Myr}^{-1}$| on a non-uniform rectangular grid. The chosen value of Jz causes stars to make excursions |$\sim 300\, \mathrm{pc}$| above and below the plane, but plays no essential role; any similar choice would yield equivalent results. We restrict attention to instants when a star passes the Sun moving upwards.
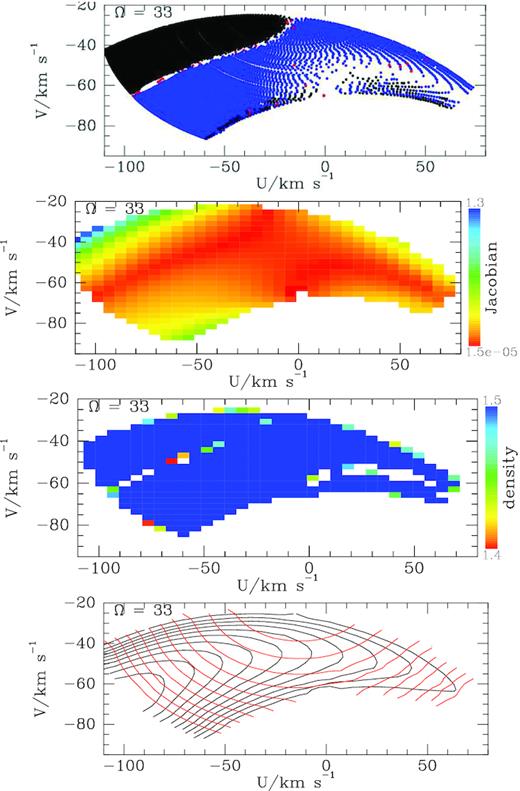
The location in local velocity space of orbits trapped at corotation by a bar with pattern speed |$33\, \mathrm{Gyr}^{-1}\simeq 33\, \mathrm{km\, s}^{-1}\, \mathrm{kpc}^{-1}$|. The top panel shows the velocities at which trapped orbits pass through the Sun. Most orbits reach us with two velocities (with vz > 0); one velocity is plotted in black and the other in blue. The second panel down shows on a linear scale the absolute value of the Jacobian (1). The third panel down shows (using base-10 logarithms) the (essentially uniform) density that we obtain in observable velocity space because action space was sampled for a uniform density. The bottom panel shows contours of constant Jr in red and constant |${\cal J}$| in black. The range of libration actions is |$(0.053,0.16)\, \mathrm{kpc}^2\, \mathrm{Myr}^{-1}$|.
3347 of the 3611 orbits (tori) plotted in Fig. 1 visit the Sun at two different velocities. In the top panel one velocity is marked by a blue dot and the other is marked by a black dot. 191 orbits visit with four velocities and half these visits are marked with blue and half with black points. 14 orbits appear to visit at a single velocity that lies along the junction of the black and blue regions. These orbits probably really visit with two velocities that are too close to distinguish numerically – if an orbit’s blue point lies close to the blue/black junction, so does its black point. Similarly, 13 orbits appear to visit with three velocities, one of which lies at the junction of the regions occupied by orbits that visit twice and four times, so again the odd number of visits is probably due to failure to distinguish two visits.
3.1 Density of stars in velocity space
The attainment of a constant velocity–space density through cancellation of the large variations in D and in the dot density is striking. Where the dots are sparse in the top panel, |$1/D=\partial (\boldsymbol {\theta })/\partial ({\boldsymbol x})$| is large because a given torus (almost) reaches the Sun for a wide range of angle variables. Hence, parts of velocity space coloured red in the second panel of Fig. 1 are populated by large contributions from a small number of tori.
3.2 Contours of constant action
The bottom panel of Fig. 1 shows contours of constant Jr (red) and constant |${\cal J}$| (black). Jr increases from top to bottom, and |${\cal J}$| increases from left to right along the centre of the wing-shaped region. The two sets of contours become tangent to one another along the curve on which the blocks of black and blue dots meet in the top panel. This parallelism indicates that the matrix ∂vi/∂Jj that connects the v and J coordinate systems for velocity space has become degenerate. This does not imply any failure of the |$(\boldsymbol {\theta },{\boldsymbol J})$| system; it just signals that one needs to specify the value of an angle variable in addition to the value of Jr (or |${\cal J}$|) to specify unambiguously a velocity. As |${\cal J}$| decreases, the black contours shrink on to a point that lies near |$(-100,-70)\, \mathrm{km\, s}^{-1}$|. This is the velocity of the orbit that has the minimum libration action (∼0.053) required to reach the Sun: |${\cal J}=0$| for the closed resonant orbit, which does not pass through the Sun.
The red and black contours are also tangent in the lower right of the wing, where the dots are very sparse in the top panel.
Fig. 2 shows how the radial and libration periods 2π/Ωr and 2π/Ωℓ vary within velocity space. The radial periods lie within the very narrow range 130–|$132\, \mathrm{Myr}$| while the libration periods, which increase with libration amplitude, are all longer by more than an order of magnitude. The shortest periods are |$\sim 1.6\, \mathrm{Gyr}$| and the longest plotted exceed |$4.6\, \mathrm{Gyr}$|. Strictly, the periods go to infinity at the edge of the trapping zone, but the increase with |${\cal J}$| is finally very rapid and orbits with very long libration periods are probably unphysical in the sense that in the portion of phase space that they appear to occupy, orbits are really chaotic.
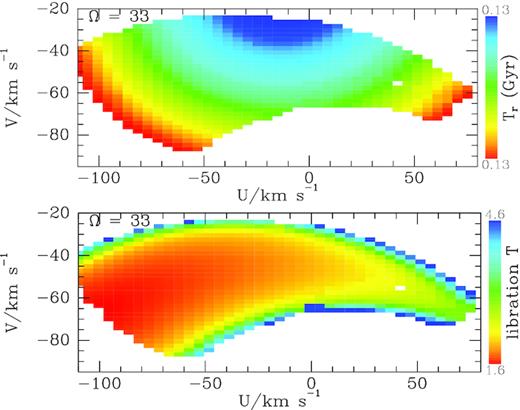
The radial period (upper) and libration period (lower) of orbits trapped at corotation as a function of solar-neighbourhood velocity. Periods are given in Gyr: |$T_r\in (0.1300,0.1324)\, \mathrm{Gyr}$|.
3.3 Comparison with Gaia data
The top panel of Fig. 3 superposes the contours of constant action from the bottom panel of Fig. 1 on to a representation of the density of stars in the Gaia catalogue that lie within |$0.3\, \mathrm{kpc}$| of the Sun and have line-of-sight velocities in the Gaia DR2 catalogue. This representation is designed to bring out local fluctuations in the star density that are easily masked by the large contrast in the stellar density between (U, V) ≃ (0, 0) and the edge. Specifically, the plotted quantity is the logarithm to base 10 of the ratio of the measured star density to the density given by an analytic distribution function (DF) for the discs (thin and thick) and the stellar halo. The stars all have parallax errors smaller than 20 per cent of their parallaxes and were assigned distances by Schönrich et al. (2019) using the Bayesian algorithm of Schönrich & Aumer (2017). The cloud-in-cell algorithm was used to compute the density of Gaia stars on a grid of 100 × 100 cells.
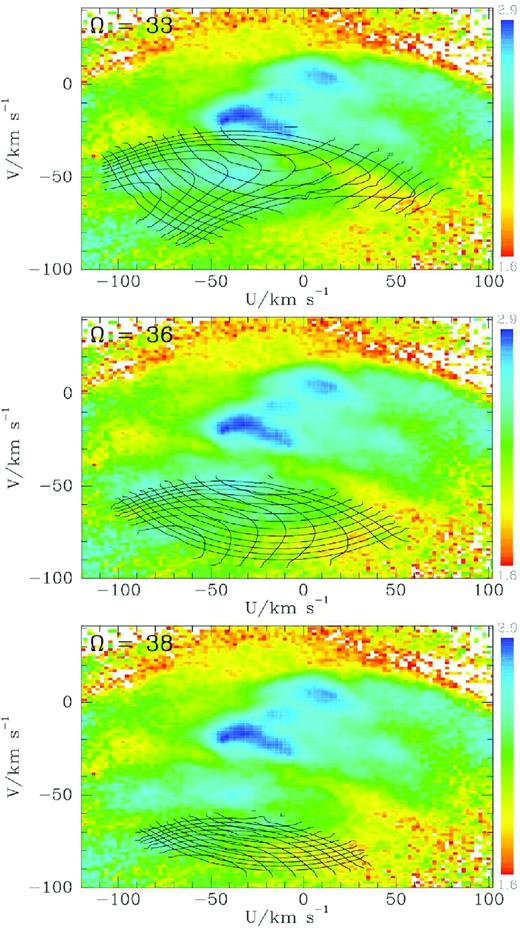
The contours of constant actions for orbits trapped at corotation by a bar with pattern speeds 33 (top) 36 (middle), and |$38\, \mathrm{Gyr}^{-1}$| superposed on the density of stars in velocity space obtained by selecting stars that lie within |$0.3\, \mathrm{kpc}$| and have line-of-sight velocities from the RVS. The quantity plotted is the logarithm to base 10 of the ratio of the measured density to the prediction of an analytic DF.
The Gaia data are for stars that cover a wide range of values of the vertical action, but since moderate changes in the Jz value for which tori are computed does not change contours of conserved quantities in the (U, V) plane, the spread of Jz values of the Gaia stars is immaterial.
In the top panel of Fig. 3, the region covered by the contours is more extensive than the part of the plane that lies below the depression that runs across the figure from centre left to lower right. However, if one trimmed the contours back to include only orbits with libration periods shorter than |$\sim 2\, \mathrm{Gyr}$|, they would fit the region below the depression rather nicely. The middle panel of Fig. 3 superposes contours for |$\Omega _{\rm p}=36\, \mathrm{Gyr}^{-1}$|. The contours now seem unconnected to the data. The bottom panel, which shows contours for |$\Omega _{\rm p}=38\, \mathrm{Gyr}^{-1}$| reveals an alternative fit to the data: now the contours provide a reasonable fit to a depression in the observed star density that lies below the one that might be fitted by |$\Omega _{\rm p}=33\, \mathrm{Gyr}^{-1}$|.
3.4 Implication of Jeans theorem
In Fig. 3, most contours of constant |${\cal J}$| cut several contours of constant Jr twice. Hence, we can identify sets of velocities that correspond to identical actions. If the adopted potential is reasonably accurate and the disc has had time to phase mix, then Jeans’ theorem would apply and the density of stars in the UV plane would take the same value at every velocity in a given set of velocities. We can test this conjecture since our tori visit just such matched velocities, and at these velocities we should find equal densities of Gaia stars.
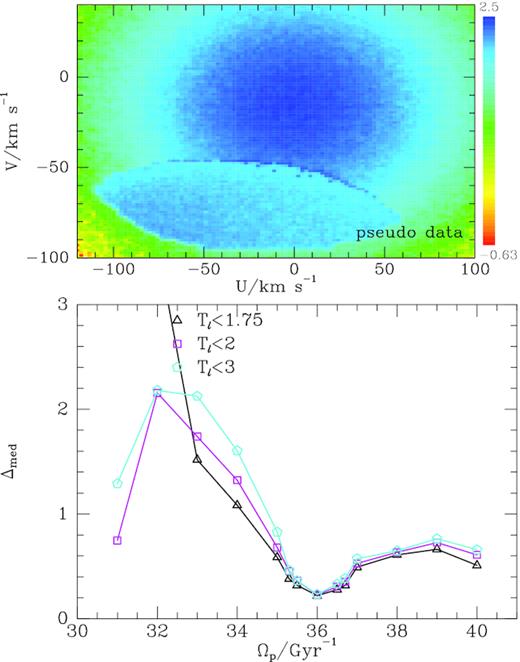
Upper panel: pseudo-data generated with TM for pattern speed |$\Omega _{\rm p}=36\, \mathrm{Gyr}^{-1}$|. The level of Poisson noise is that expected with |$750\, 000$| stars in the sample. Lower panel: median values of the statistic (7) obtained when testing the pseudo-data against various pattern speeds.
Fig. 5 shows values of Δmed computed in the same way with Gaia data. Jeans’ theorem is most likely to apply to the tori with the shortest libration periods – when libration periods are long, we cannot assume that phase mixing has rendered the DF essentially independent of the angle variables. Fig. 5 shows that longer maximum libration periods yield larger values of Δmed as expected. As in the lower panel of Fig. 4, all three curves have a minimum centred on |$36\, \mathrm{Gyr}^{-1}$|. In the case of the shortest period orbits, this minimum occurs at Δmed = 0.39, which is not much above the value that Fig. 4 suggests we should expect on account of Poisson noise alone, and the Gaia data undoubtedly contain more small-scale structure than just Poisson noise. Thus, Fig. 5 is consistent with trapping at corotation for |$\Omega _{\rm p}\simeq (36\pm 1)\, \mathrm{Gyr}^{-1}$|.
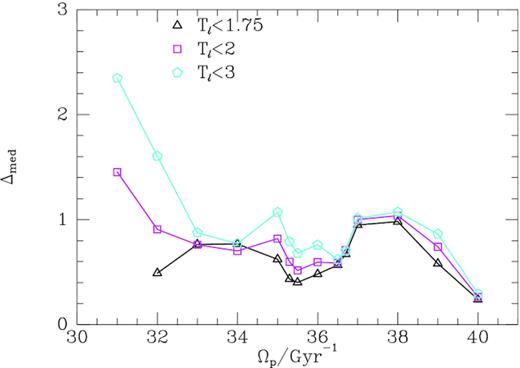
Median values of the statistic (7) for different bar pattern speeds and maximum libration periods Tℓ. Each symbol corresponds to a maximum libration period as marked in Gyr.
At the lowest pattern speeds, few tori have periods as short as |$T_\ell \lt 3\, \mathrm{Gyr}$|, so in Fig. 5 there is no black triangle for |$\Omega _{\rm p}=31\, \mathrm{Gyr}^{-1}$| and the black triangle for |$\Omega _{\rm p}=32\, \mathrm{Gyr}^{-1}$| is based on a small number of tori. At the highest pattern speeds, the area of the (U, V) plane covered by trapped orbits shrinks, and this automatically causes Δmed to fall because the velocities of each visiting torus converge. Hence the decline in Δmed at |$\Omega _{\rm p}\gt 38\, \mathrm{Gyr}^{-1}$|, which is somewhat mirrored in Fig. 4, should probably be discounted.
4 ORBITS TRAPPED AT OLR
At OLR the slow angle is |$\theta _1^{\prime }=\theta _r+2\theta _\phi$|. The value of this linear combination of θr and θϕ is set by the angle of libration θℓ. The fast action is |$J_3^{\prime }=J_\phi -2J_r$| and it is complemented by the action of libration |${\cal J}$|.
Fig. 6 shows the footprint in the UV plane of orbits that are trapped at the OLR with |$\Omega _{\rm p}=43\, \mathrm{Gyr}^{-1}$|. As in the case of corotation, the great majority of trapped orbits visit the Sun (with vz > 0) at either two or four points in the UV plane: in this case 682/1000 visit twice (blue/black dots) and 220 visit four times (red dots). The middle panel of Fig. 6 explains the increased popularity of four visits: several red contours (of constant Jϕ − 2Jr) cut black contours (of constant |${\cal J}$|) four times each, whereas in the bottom panel of Fig. 1 each red contour cuts a black contour at most twice. We saw above that orbits correspond to intersections of contours, so four intersections imply four visit. Stars that visit twice have either the smallest Jr or the smallest |${\cal J}$| consistent with reaching the Sun.
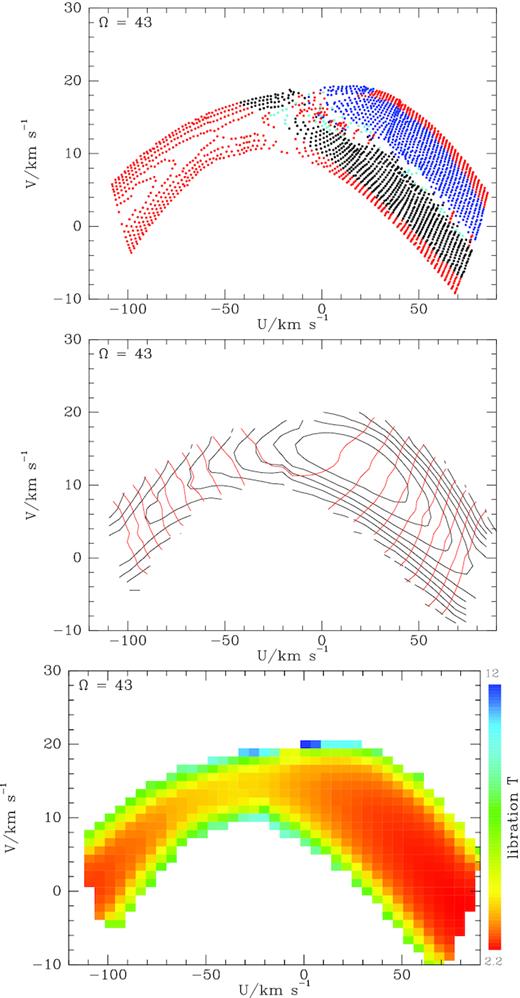
The locations in local velocity space of orbits trapped at OLR of a bar with pattern speed |$43\, \mathrm{Gyr}^{-1}$|. The top panel shows the velocities at which trapped orbits pass through the Sun. Most orbits reach us with either two (black/blue points) or four (red points) velocities (with vz > 0). Cyan points, marking single or triple visits, lie where two distinct velocities may not be distinguished. In the second panel down red curves are contours of the conserved action |$J_3^{\prime }=J_r-2 J_\phi$| while contours of constant libration action |${\cal J}$| are black. The values of |${\cal J}$| increase with the length of the contour, while the values of |$J^{\prime }_3$| increase roughly with |U|. The bottom panel shows the means in each cell of the libration period. Note that, unlike in Fig. 1 the vertical and horizontal scales differ.
The bottom panel of Fig. 6 shows that all orbits contributing to Fig. 6 have long libration periods: periods start at |$2.2\, \mathrm{Gyr}$|.
Fig. 7 overlays contours like those plotted in the middle panel of Fig. 6 on the representation of the density of stars in the Gaia DR2 RVS sample used in Fig. 3. For |$\Omega _{\rm p}\lesssim 37\, \mathrm{Gyr}^{-1}$|, the region occupied by trapped orbits lies at values of V that are too large to be of interest. Consequently, if trapping at corotation is relevant, as Fig. 3 suggests, trapping at OLR will be unimportant. In Fig. 7, the region occupied by trapped orbits moves down as Ωp is increased. The upper boundaries of the regions of trapping in the lower two panels of Fig. 7 are occupied by orbits with the largest values of |$J_3^{\prime }$| and thus the smallest values of Jr. That is, the top edges of these panels lie on contours of constant |$J_3^{\prime }$|.
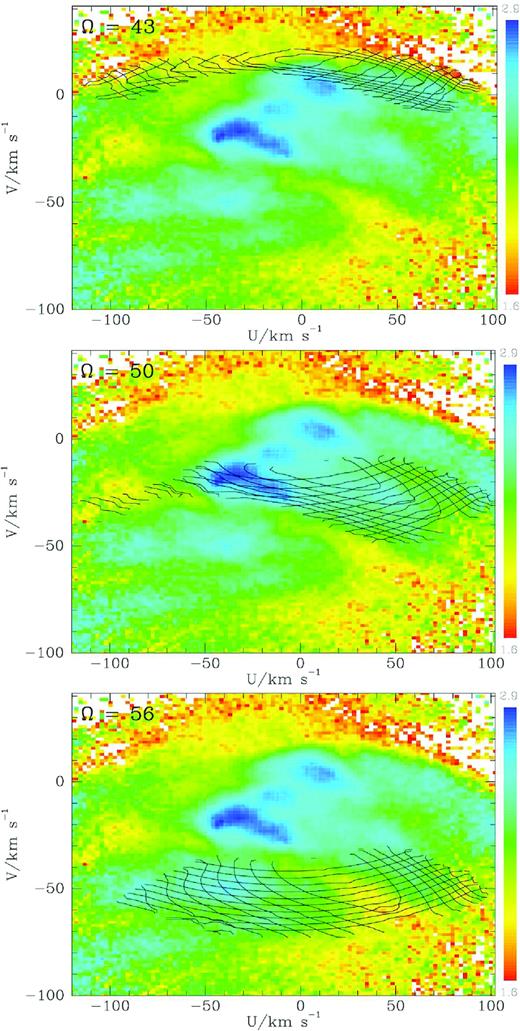
The density of RVS stars in local velocity space as in Fig. 3 together with contours of constant actions for orbits trapped at the OLR of bars with pattern speeds (from top to bottom) Ωp = 43, 50, and |$56\, \mathrm{Gyr}^{-1}$|.
The middle panel of Fig. 7 shows that when |$\Omega _{\rm p}=50\, \mathrm{Gyr}^{-1}$|, stars reach the Sun with small negative values of V, and for the most part positive values of U. Fig. 8 explains the bias to positive U (movement towards the Galactic Centre) by showing part of an orbit with a small value of |${\cal J}$| together with the location of the Sun. The view is from the south, so in an inertial frame the bar and the disc rotate counterclockwise, but pictured here in the bar’s rotating frame the orbit circulates clockwise, and as it passes the Sun, it is moving from apocentre at the bar’s major (x)-axis towards pericentre near the minor axis. Hence, orbits with small |${\cal J}$| visit us with U > 0.
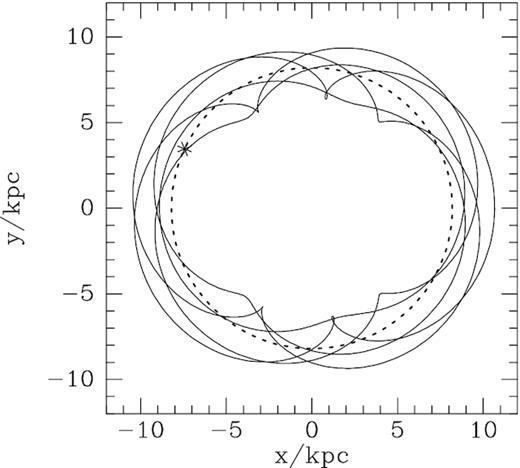
An orbit trapped at OLR in a bar with |$\Omega _{\rm p}=50\, \mathrm{Gyr}^{-1}$|. The star marks the Sun’s location and the dashed curve is a circle of radius R0. The long axis of the bar is horizontal and the Galaxy is viewed from the south, so the bar rotates counterclockwise and in its frame the star circulates clockwise.
Following Kalnajs (1991), the seminal discussion by Dehnen (2000) emphasizes closed orbits and in consequence considers that the OLR imposes a bimodality on the solar neighbourhood associated with untrapped orbits that circulate inside or outside the resonance. The focus here is on the trapped orbits, which could not be computed by the real-space perturbation theory that Dehnen employed. These orbits are moving inwards not outwards as they pass the Sun, and as such cannot account directly for the Hercules stream. The Hercules stream could, nevertheless, comprise untrapped orbits that circulate outside the OLR, and this is essentially the proposal Dehnen (2000) came to by following orbits from an axisymmetric initial configuration as the amplitude of a bar was ramped up at constant pattern speed.
Of the 2139 orbits computed for |$\Omega _{\rm p}=50\, \mathrm{Gyr}^{-1}$|, 1795 visit the Sun twice with vz > 0 and just 246 visit three or four times. Thus increasing Ωp has made four visits less popular. The stars that still visit four times make up the tail of contours in the middle panel of Fig. 7 that extends leftwards of |$U=-60\, \mathrm{km\, s}^{-1}$|. The tail is made up of stars with large libration actions that also visit on the upper and lower edges of the band of contours at U > 0 (cf. the top panel of Fig 6).
The bottom panel of Fig. 7 shows that when |$\Omega _{\rm p}=56\, \mathrm{Gyr}^{-1}$| the region occupied by trapped orbits has moved to lower V than in the middle panel for |$\Omega _{\rm p}=50\, \mathrm{Gyr}^{-1}$|, and is now less biased to positive U. The tail formed by stars that visit four times has vanished.
Even for large values of Ωp, orbits trapped at OLR all have very long libration periods: the upper panel of Fig. 9 shows that with |$\Omega _{\rm p}=50\, \mathrm{Gyr}^{-1}$| the libration periods start at |$1.3\, \mathrm{Gyr}$|; with |$\Omega _{\rm p}=56\, \mathrm{Gyr}^{-1}$| they start at |$0.92\, \mathrm{Gyr}$|. Hence phase mixing cannot be assumed to have purged the DF of angle dependence, and a compelling case cannot be made for the applicability of Jeans’ theorem.
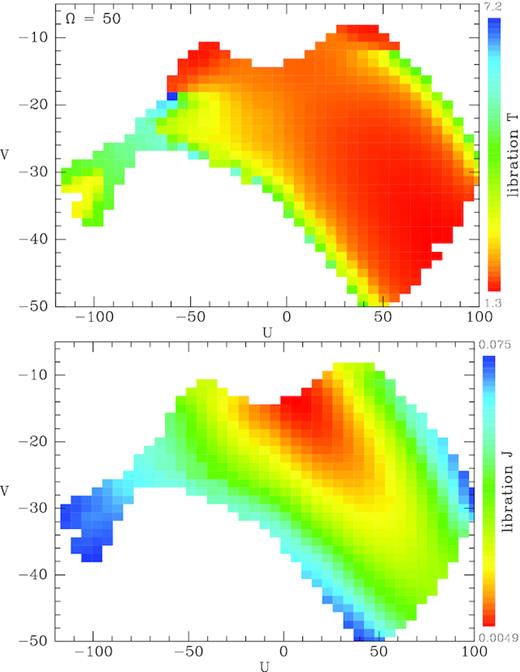
Upper panel: The distribution of libration periods of orbits trapped at OLR when |$\Omega _{\rm p}=50\, \mathrm{Gyr}^{-1}$|. Lower panel: Distribution of libration actions |${\cal J}$| of these orbits.
Fig. 10 shows the location in action space of visiting orbits for three values of Ωp. At higher pattern speeds, the OLR comes closer to the Sun. When the OLR is distant, the Sun can be reached only from eccentric resonant orbits, and then only with a large libration amplitude. As the OLR approaches, smaller libration amplitudes are required to reach the Sun, and it becomes easier to reach the Sun from the least eccentric resonant orbit. Consequently, the block of orbits that visit us moves down and to the left in Fig. 10. In the right two panels, the spikes at Jr ≃ 0.02 along the top edges of the populated region signal the value of Jr at which a clear division between trapped and untrapped orbits vanishes, as explained in Binney (2020).

Locations in action space of orbits trapped at OLR that visit the Sun. On the x-axis we have the radial action of the underlying perfectly resonant orbit: the conserved action |$J_3^{\prime }$| is a function of this value. Libration actions |${\cal J}$| are plotted vertically. A blue point indicates two visits to the Sun with vz > 0, a red point indicates four such visits, and a cyan point indicates one or three visits. A green square indicates a failure to visit.
In Fig. 7, the only intriguing coincidence between a feature in the observed star density and the structure of a trapped zone is the match in the middle panel between the most pronounced ridge in the star density and the lower edge of the zone. However, the median values of the statistic Δ defined by equation (7), which are plotted in Fig. 11, do not favour |$\Omega _{\rm p}=50\, \mathrm{Gyr}^{-1}$| as a pattern speed. Inspection of the middle panel of Fig. 7 makes clear why Δ is large in the case |$\Omega _{\rm p}=50\, \mathrm{Gyr}^{-1}$|: intersections of contours in the heavily populated, deep blue region |$(-30,-18)\, \mathrm{km\, s}^{-1}$| are paired with intersections of the same contours in the much more sparsely populated light blue region around |$(58,-16)\, \mathrm{km\, s}^{-1}$|. Fig. 11 indicates that the preferred pattern speeds lie between 53 and |$55\, \mathrm{Gyr}^{-1}$|, consistent with the value of |$54\, \mathrm{Gyr}^{-1}$| originally proposed by Dehnen (2000). However, all the values of Δmed plotted in Fig. 11 are significantly larger than the values for trapping at corotation shown in Fig. 5. Hence the Δmed statistic disfavours trapping at OLR.
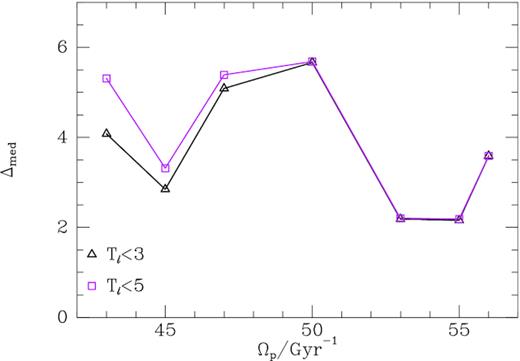
Median values of the statistic (7) for different bar pattern speeds and maximum libration periods Tℓ. Each symbol corresponds to a maximum libration period as marked in Gyr.
5 VELOCITY SPACES A KPC AWAY
Gaia, unlike Hipparcos, allows us to examine velocity space at locations that are significantly removed from the Sun. Fig. 12 shows star densities at the three locations reached by moving |$1\, \mathrm{kpc}$| towards the Galactic Centre and in or against the direction of Galactic rotation. In each case stars are included if they lie within |$0.3\, \mathrm{kpc}$| of the point in question. The contours overplotted are those of constant actions for trapping at corotation with |$\Omega _{\rm p}=36\, \mathrm{Gyr}^{-1}$|, which was the value of Ωp favoured by the star density at the Sun. In these panels the coordinate system is Cartesian, so U is the component of velocity parallel to the Sun–Centre line and V is the component parallel to the direction of rotation at the Sun. The distribution of stars is centred on negative U at (x, y) = (0, −1) and on positive U at (0,1) because at these locations the circular velocity has a non-vanishing U component with that sign. No plot is given for the fourth cardinal point, |$1\, \mathrm{kpc}$| further from the Galactic Centre, because no stars trapped at CR reach there when |$\Omega _{\rm p}=36\, \mathrm{Gyr}^{-1}$|.
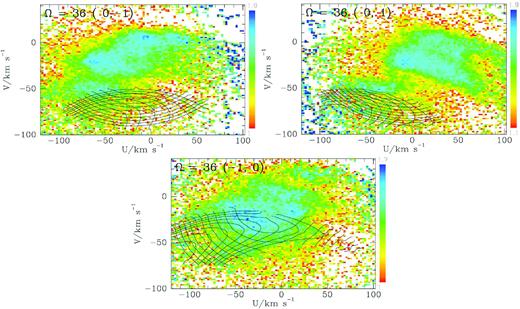
Contours of constant actions when |$\Omega _{\rm p}=36\, \mathrm{Gyr}^{-1}$| superposed on the density of RVS stars in the velocity space at four locations |$1\, \mathrm{kpc}$| from the Sun – the coordinates of the locations are given after the pattern speed at top left of each panel. Even at |$y=\pm 1\, \mathrm{kpc}$|, U remains the component of velocity parallel to the Sun–Centre direction, and V is always the perpendicular component. The anticentre lies upwards and rotation takes stars from left to right.
Fig. 12 shows that zones of entrapment move around velocity space quite rapidly as we move around the Sun. While no striking agreement between star densities and zones of entrapment is evident, it is in every panel possible to imagine qualitative similarities. The median values of the statistic Δ defined by equation (7) are Δmed = 0.30 towards the Galactic Centre, and 0.08 and 0.96 towards and against Galactic rotation. These values are consistent with what we would expect if our potential were correct and Jeans’ theorem applied.
6 CONCLUSIONS
An improved version of the torus-mapping code tm has been used to determine the velocity–space locations of stars that are trapped at the corotation and OLRs of bars of various pattern speeds. The potential adopted includes only the m = 2 component of the bar. Monari et al. (2019) have recently presented evidence that some of the ridges in the Gaia DR2 data evident in Figs 3 and 7 are associated with resonances driven by m = 3 and m = 4 components of the bar’s potential. Extension of this work to more sophisticated potentials would be relatively straightforward and is a promising direction for future work.
tm computes the actions of trapped stars, so contours of the two functions on which the Galaxy’s DF would depend if Jeans’ theorem applied to trapped orbits can be added to plots of the observed density of stars in velocity space. From intersections of contours one can identify sets of two or four velocities at which the density of stars would be equal if the adopted potential were correct and Jeans’ theorem applied. The median value of the quantity defined by equation (7) over trapped tori defines a measure Δmed of the extent to which the observed star density violates this prediction. A plot of Δmed versus pattern speed weakly supports trapping at corotation in a bar with pattern speed |$(36\pm 1)\, \mathrm{Gyr}^{-1}$|. The values taken by Δmed at locations displaced from the Sun by a kpc in the cardinal directions are consistent with the hypothesis of trapping at corotation with |$\Omega _{\rm p}=36\, \mathrm{Gyr}^{-1}$|.
The above chain of argument is open to the objection that the libration periods of trapped orbits may be too long for Jeans’ theorem to apply because stars have not had time to phase mix. At corotation libration periods tend to be |$\gtrsim 1.6\, \mathrm{Gyr}$| and larger than the radial period by a factor ∼12. An indication that this issue is a real one is the tendency of Δmed to increase as tori with longer libration periods are included.
The hypothesis that orbits trapped at the bar’s OLR significantly structure local velocity space yields values of the Δmed statistic that are appreciably larger than the values associated with the hypothesis of trapping at corotation. Hence this statistic disfavours trapping at OLR and the associated large values of Ωp. Amongst all possible values of Ωp for trapping at OLR, the Δmed statistic favours |$\Omega _{\rm p}=54\pm 1\, \mathrm{Gyr}^{-1}$|, which is the value originally suggested by Dehnen (2000).
A fundamental problem with a connection between the Hercules stream and trapping at the OLR is that stars trapped in a fast bar tend to visit the Sun at U > 0 (approaching the Galactic Centre) whereas the Hercules stream lies at U < 0. The libration periods of stars trapped at the OLR of a fast bar are only slightly shorter than the libration periods of stars trapped at corotation when |$\Omega _{\rm p}\simeq 36\, \mathrm{Gyr}^{-1}$|.
Everything presented here follows from the model potential employed. This is soundly based on empirical data, but more accurate and complete model potentials Φ will surely emerge from successive Gaia data releases. Any change to the circular-speed curve defined by the axisymmetric component of Φ will shift the regions of entrapment radially. Changes to the potential’s non-axisymmetric component will affect the widths of these zones.
The impact of resonant trapping on Gaia data has two distinct aspects. One is the nature of trapped orbits, which has been addressed here. Another is how those orbits are populated, which is a much harder question. From Dehnen’s (1999) seminal study onwards, most analyses of velocity space have implicitly assumed that the density of stars can be predicted by assuming adiabatic growth of the bar’s strength at a constant pattern speed. There is no physical basis for this assumption and the question of how trapped orbits are populated cannot be answered so simply.
The bar is unlikely to have a constant pattern speed because the latter is a measure of the angular momentum in the bar, which has both sources and sinks. Dynamical friction of the bar against the dark halo and the outer disc removes angular momentum, making the bar slower and longer. Conversely, angular momentum is stripped from gas that falls through corotation and is then funnelled to the central molecular zone (Debattista & Sellwood 2000; Athanassoula 2002, 2003). N-body simulations suggest that the bar gradually slows, so its resonances move out through the disc.
Slowing of Ωp does not invalidate the current approach providing |$\dot{\Omega _{\rm p}}/\Omega _{\rm p}^2\ll 1$|, which is probably the case, for then orbits will evolve adiabatically and phase space is likely to be structured by the actions, which are adiabatic invariants.
A star whose orbit lies in the path in action space of a resonance has a probability to become trapped (and hence transferred to the action space of trapped orbits), and a probability to be dumped on the far side of the resonance (Henrard 1982). The magnitudes of these probabilities depend on the speed at which the resonance is moving and growing/shrinking (e.g. Binney & Tremaine 2008, problem 3.42). Indeed, if the resonance is shrinking, stars will always be dumped, while if it is growing strongly while moving slowly, a star is much more likely to be trapped than dumped. The corotation resonance is expected to grow as the bar slows (Chiba, Friske & Schönrich 2020), so orbits once captured will remain trapped and move outwards with the resonance. These considerations imply that the DF within a trapped zone will depend on the complete history of the relevant resonance and thus of the bar.
Some stars will have become trapped during bar formation, which happens essentially on a dynamical time-scale (Raha et al. 1991). Such stars may have been transported a significant distance outwards. Other stars will have been swept up later as the bar slowed and strengthened. Hence the density of stars in and around a bar’s trapped zone in velocity space must contain a wealth of information about the history of our disc.
The natural approach is to follow the dynamics of stars using the angle-action coordinates of the instantaneous bar. Chiba et al. (2020) have recently made a start on this enterprise in the context of a simple razor-thin disc. The task is challenging because both the instantaneous bar structure and its history have to be inferred. The technology displayed here could be used to develop this line of attack. In this context the ability of tm to model vertical motions in parallel with motion in the plane is likely to prove important because Jz is known to be strongly correlated with chemistry and age (e.g. Bland-Hawthorn et al. 2019).
ACKNOWLEDGEMENTS
I thank an anonymous referee for insightful comments that have led to material improvements in the work presented here. This work has been supported by the Leverhulme Trust and the UK Science and Technology Facilities Council under grant number ST/N000919/1.


