-
PDF
- Split View
-
Views
-
Cite
Cite
I Khabibullin, E Churazov, R Sunyaev, C Federrath, D Seifried, S Walch, X-raying molecular clouds with a short flare: probing statistics of gas density and velocity fields, Monthly Notices of the Royal Astronomical Society, Volume 495, Issue 1, June 2020, Pages 1414–1432, https://doi.org/10.1093/mnras/staa1262
Close - Share Icon Share
ABSTRACT
We take advantage of a set of molecular cloud simulations to demonstrate a possibility to uncover statistical properties of the gas density and velocity fields using reflected emission of a short (with duration much less than the cloud’s light-crossing time) X-ray flare. Such a situation is relevant for the Central Molecular Zone (CMZ) of our Galaxy where several clouds get illuminated by an ∼110 yr-old flare from the supermassive black hole Sgr A* . Due to shortness of the flare (Δt ≲ 1.6 yr), only a thin slice (Δz ≲ 0.5 pc) of the molecular gas contributes to the X-ray reflection signal at any given moment, and its surface brightness effectively probes the local gas density. This allows reconstructing the density probability distribution function over a broad range of scales with virtually no influence of attenuation, chemo-dynamical biases, and projection effects. Such a measurement is key to understanding the structure and star formation potential of the clouds evolving under extreme conditions in the CMZ. For cloud parameters similar to the currently brightest in X-ray reflection molecular complex Sgr A, the sensitivity level of the best available data is sufficient only for marginal distinction between solenoidal and compressive forcing of turbulence. Future-generation X-ray observatories with large effective area and high spectral resolution will dramatically improve on that by minimizing systematic uncertainties due to contaminating signals. Furthermore, measurement of the iron fluorescent line centroid with sub-eV accuracy in combination with the data on molecular line emission will allow direct investigation of the gas velocity field.
1 INTRODUCTION
Reflection of X-ray emission on molecular clouds in the Central Molecular Zone (CMZ) has proved to be a powerful tool for reconstructing the activity record of the Milky Way’s supermassive black hole (SMBH) Sgr A* over past few hundred years (Sunyaev, Markevitch & Pavlinsky 1993; Koyama et al. 1996; Revnivtsev et al. 2004; Muno et al. 2007; Ponti et al. 2010; Terrier et al. 2010; Capelli et al. 2012; Ryu et al. 2013; Zhang et al. 2015; Krivonos et al. 2017; Chuard et al. 2018; Kuznetsova et al. 2019; Ponti et al. 2013, for a review). Namely, it has been shown that Sgr A* experienced at least one flare ∼110 yr ago, which had a total fluence of ∼1047 erg and lasted for not longerthan Δt ≲ 1.6 yr (Churazov et al. 2017a; Terrier et al. 2018). The latter point follows directly from rapid variability of the X-ray emission observed from the smallest substructures inside the illuminated molecular clouds (Clavel et al. 2013; Churazov et al. 2017a), and it has several important implications.
First of all, this provides strong support for the X-ray reflection paradigm itself, meaning that the bulk of the observed X-ray emission cannot be produced due to interaction of molecular gas with cosmic rays (either low-energy protons or high-energy electrons, e.g. Yusef-Zadeh, Law & Wardle 2002; Dogiel et al. 2009; Tatischeff, Decourchelle & Maurin 2012; Chernyshov et al. 2018).
Secondly, it allows us to limit possible scenarios for the primary source of illumination (e.g. Zubovas, Nayakshin & Markoff 2012; Sacchi & Lodato 2019), since the minimum required luminosity exceeds 1039 erg s−1 for Δt = 1.6 yr, while it equals few× 1044 erg s−1, i.e. Eddington luminosity of Sgr A* , for Δt as short as 1 h (Churazov et al. 2017a). Further investigation of the light curves of the smallest resolved substructures will help improving on that even more (Churazov et al. 2017c).
Finally, short duration of the flare implies that only a very thin layer of molecular gas, |$\delta z\sim \upsilon _{z}\Delta t\lesssim 0.5\, ({\upsilon _z}/{c})\, (\Delta t/ 1.6\, \mathrm{yr})$| pc, contributes to the reflection signal at any given moment (see Figs 1 and 2 for illustrations), where the line-of-sight speed of the illumination front1 propagation |${\upsilon} _z$| ranges from 0.5c to ∞ depending on the relative position of the primary source, cloud, and observer (e.g. Churazov et al. 2017a). As far as |$\upsilon _z$| does not exceed c by a large factor, the thickness of the layer stays much smaller than the size of the whole molecular cloud, L ∼ 10 pc, so it is the local number density rather than projected column density of molecular gas that determines the observed X-ray emission.
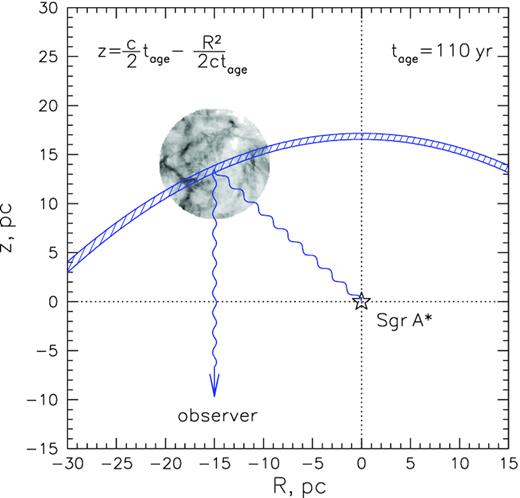
Geometry of reflection for a short Sgr A* flare (happened tage = 110 yr ago) on a molecular cloud, viewed from above the Galactic Plane, z is the line-of-sight distance, and R is the projected distance from Sgr A*. The light propagates from the source to the cloud and then to the observer, so that equal-time-delay requirement ensures that only the gas between two parabolas |$z=\frac{c}{2}t_{\rm age}-\frac{R^2}{2ct_{\rm age}}$| (hatched region) contributes to the reflected emission viewed by a distant observer at z = −∞.
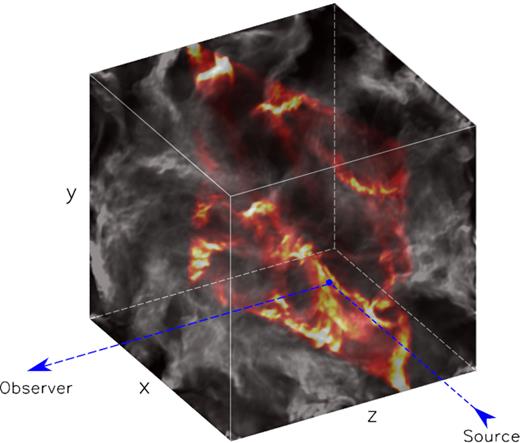
Schematic illustration of molecular cloud illumination by a short X-ray flare. At any given moment, a thin slice of the gas (shown in bright colour) is illuminated and contributes to the reflected emission visible to a distant observer. A weaker signal associated with the second scattering is discussed in Section A3. All the intervening gas along the photons’ path from the source to the reflector and to the observer (blue dashed lines) contributes to the attenuation of the reflection signal, which is set by the column density of the intervening gas and effective (scattering and absorbing) cross-section in a given energy band.
As a result, density fluctuations inherent to the molecular gas imprint themselves both in the spatial fluctuations of the reflected emission and temporal variation of the signal at any given position due to propagation of the illumination front across the cloud. Over the time span of the available Chandra and XMM–Newton data, Δt ∼ 20 yr, an |$\sim \upsilon _z\Delta t\sim 6 ({\upsilon _z}/{c})$| pc-thick slab of the molecular gas has been ‘scanned’ by the X-ray flare. Comparison of statistical properties of temporal variations over this period with those of spatial variations derived from individual ‘snapshots’ (under assumption of fluctuations isotropy) allowed Churazov et al. (2017a) to measure the illumination front propagation speed, vz ≈ 0.7c, and derive relative line-of-sight position, z ≈ 10 pc behind Sgr A* , for the molecular complex Sgr A that is currently the brightest one in X-ray reflected emission (Ponti et al. 2010; Clavel et al. 2013; Terrier et al. 2018).
Moreover, high penetrative power of X-rays above 3 keV and very weak sensitivity of the reflection albedo to the thermodynamic and chemical state of gas imply that the observed signal should be a linear and pretty much unbiased proxy for the local gas density inside the illuminated layer. Thinness of this layer means virtually no averaging due to line-of-sight projection is involved, so the statistics of X-ray surface brightness IX is directly linked to statistics of the total molecular gas density ρ, namely ρ ∝ IX as long as the absorbing column density is below few× 1023 cm−2 (Churazov et al. 2017b). This is in drastic contrast to the commonly used line emission proxies that are hindered by projection effects, self-shielding, and excitation- and chemistry-related biases (e.g. Mills & Battersby 2017, and references therein).
The simplest statistics of the gas density is its probability distribution function (PDF)|$\mathrm{ PDF}(\rho)\propto \frac{\mathrm{ d}V(\rho)}{\mathrm{ d}\rho }$|, i.e. the fraction of volume filled with the gas of a given density ρ. Since the density field inside molecular clouds is shaped by a complex interplay between supersonic turbulence, self-gravity, magnetic fields, and stellar feedback, the gas density PDF bears invaluable information on how this interplay actually proceeds and in which way it determines the dynamical state of the cloud (Girichidis et al. 2014; Kainulainen, Federrath & Henning 2014; Donkov, Veltchev & Klessen 2017; Chen et al. 2018; Donkov & Stefanov 2018).
Namely, quasi-isothermal supersonic MHD turbulence is believed to define the density field at 1–10 pc scales, resulting in the lognormal distribution function (Vazquez-Semadeni 1994) with the width determined by the Mach number of the turbulent motions, nature of forcing, and relative magnetization of the gas (Padoan, Nordlund & Jones 1997; Federrath, Klessen & Schmidt 2008; Molina et al. 2012; Federrath & Banerjee 2015; Nolan, Federrath & Sutherland 2015).
Self-gravity of the dense gas is expected to lead to the formation of a high-density tail at subparsec scales (Klessen 2000; Kainulainen et al. 2009; Kritsuk, Norman & Wagner 2011; Federrath & Klessen 2013; Girichidis et al. 2014), where the transition from turbulent to coherent motions happens, and the large-scale turbulent cascade links with the gravitationally bound star-forming cores (e.g. Goodman et al. 1998). Due to this, ∼0.1 pc scales are crucial for determining a cloud’s overall star formation efficiency (e.g. Williams et al. 2000; Ward-Thompson et al. 2007). This 0.1 pc scale also coincides with the sonic scale (e.g. Federrath 2016) and the typical width of interstellar filaments (Arzoumanian et al. 2011), important building blocks of molecular clouds and the primary sites for star formation.
In this regard, dense gas of the CMZ presents a particularly interesting study case because of the very dynamic and extreme environment of the Galactic Center, and also because of low star formation efficiency inferred for it (compared to the average efficiency measured for molecular clouds in the Galactic disc; Longmore et al. 2013; Kruijssen et al. 2014; Ginsburg et al. 2016; Kauffmann et al. 2017a; Barnes et al. 2017). High density and pressure of the surrounding medium, high energy density of cosmic rays, and intensive disturbances due to supernova explosions are all capable of affecting physics of molecular clouds in the CMZ, plausibly making them more similar to the molecular gas in high-redshift star-forming galaxies (e.g. Kruijssen & Longmore 2013).
Measuring the PDF(ρ) over a broad range of the scales is a key for clarifying the particular mechanism(s) responsible for this suppression, e.g. high level of solenoidally forced turbulence (Federrath et al. 2016), and also whether this is a generic property of such an environment or whether it differs from cloud to cloud, e.g. as a result of the different orbital evolution histories (Kauffmann et al. 2017b). The evolution of the dense gas flows in centres of galaxies is very interesting from a theoretical point of view (e.g. Sormani et al. 2018), while it is also of great practical importance in connection with feeding (and feedback) of SMBHs (e.g. Alexander & Hickox 2012).
It turns out that both duration of the Sgr A* X-ray flare and angular resolution accessible with current X-ray observatories (∼1 arcsec, corresponding to ∼0.04 pc at the Galactic Center distance) in principle do allow reconstruction of the gas density PDF from ∼10 pc down to the subparsec scales based on the maps of reflected X-ray emission, and the first attempt of such study has been performed by Churazov et al. (2017c). The observed PDF(IX), based on the Chandra data taken in 2015, appears to be well described by the lognormal distribution with a width σI ≈ 0.8, where σI is the standard deviation of the surface brightness normalized by its mean. Taken at face value, this would imply (using the velocity dispersion inferred from molecular line emission, e.g. Ponti et al. 2010) predominantly solenoidal driving of turbulence inside this cloud, similar to the conclusion drawn by Federrath et al. (2016) after analysing properties of another CMZ cloud, the so-called ‘Brick’ cloud, which is indeed characterized by very low star formation efficiency (Kauffmann et al. 2017a, b; Barnes et al. 2017).
However, the observed shape of PDF(IX) is subject to several statistical distortions, both at the low- and high-surface brightness (viz. low and high density) ends of the distribution. This severely limits the dynamic range of the scales over which a reliable measurement can be done, so that the least affected part of the PDF spans only a range of factor of ∼5 in probed densities. The impact of some of these distortions has been illustrated by Churazov et al. (2017c) on analytically constructed examples of the molecular gas density distributions.
In this study, we take advantage of a set of idealized simulations of supersonic isothermal turbulence (Federrath et al. 2008) and global simulations of molecular clouds (from the SILCC-Zoom project; see Walch et al. 2015; Girichidis et al. 2016; Seifried et al. 2017) in order to explore the possibility to recover statistical properties of the gas density distribution and derive corresponding characteristics of the underlying turbulent velocity field. We discuss an optimal technique and formulate requirements for the observations with current and future X-ray facilities that will allow such measurements to be performed. Additionally, we discuss the feasibility and implications of the gas velocity field exploration via spectral mapping using the 6.4 keV iron fluorescent line.
The structure of the paper reads as follows: In Section 2, we outline the link between the gas density statistics and underlying fundamental processes operating inside molecular clouds (primarily supersonic turbulence) and describe sets of idealized and more realistic numerical simulations that we exploit for illustration of the density statistics reconstruction using illumination by short X-ray flares. In Section 3, we describe the basic properties of the X-ray reflection signal and its connection to the physical characteristics of the illuminated gas under conditions relevant for Sgr A* illumination of the clouds in the CMZ. In Section 4, we check whether the dynamical range provided by X-ray reflection signal allows robust diagnostics of the turbulence characteristics, given the limitations by opacity and finite duration of the flare. We consider observational limitations of the real data, formulate the requirements, and discuss prospects of current and future X-ray facilities in Section 5. A summary of the paper follows in Section 6.
2 GAS DENSITY AND VELOCITY FIELDS INSIDE MOLECULAR CLOUDS
Molecular clouds are believed to arise due to cold gas condensation accompanied by gravitational contraction and fragmentation into dense collapsing cores, followed by seeding of pre-stellar objects, star formation, and its feedback (McKee & Ostriker 2007; Heyer & Dame 2015). Thus, they are extremely important building blocks of the interstellar medium, facilitating a complicated multiscale link between global (galaxy-scale) gas flows and life cycles (formation, evolution, and death) of individual stars (Walch et al. 2015). This fact is also reflected in the complexity of their internal structure, composed by hierarchies of (dynamic) substructures, shaped by various processes at different scales (Clark et al. 2012; Seifried et al. 2017).
2.1 Supersonic turbulence
The scaling coefficient b has been shown to depend on the nature of turbulence forcing, being equal to 1/3 for solenoidal (divergence-free) forcing, 1 for compressive (curl-free) one, and some intermediate value for a mixture of both (Federrath et al. 2008). Although there might be additional factors influencing the exact value of the parameter b (Nolan et al. 2015, e.g. it might depend on whether the gas is indeed isothermal or not), a factor of 3 difference between solenoidal and compressive forcing suggests that it might be in principle possible to distinguish between these two cases by solving for equation (3) with σs and |$\mathcal {M}_\beta$| provided by observations (Federrath et al. 2010).
In Fig. 3, we put a lognormal distribution of gas density in the context of the scales that are linearly probed by means of X-ray reflection. As can be seen, the dynamic range accessible to X-ray observations matches very well the range where the density PDF(ρ) varies very prominently, meaning that the width of the density distribution σs can be robustly inferred from the observed distribution of IX. This picture is, however, based on a certain size–density relation, which is of course a gross simplification and we drop it by taking advantage of an extensive set of high-resolution (10243) 3D simulations of solenoidally or compressively forced supersonic (with root-mean-square Mach number |$\mathcal {M}\approx 5.5$|) turbulence2 (Federrath et al. 2008).
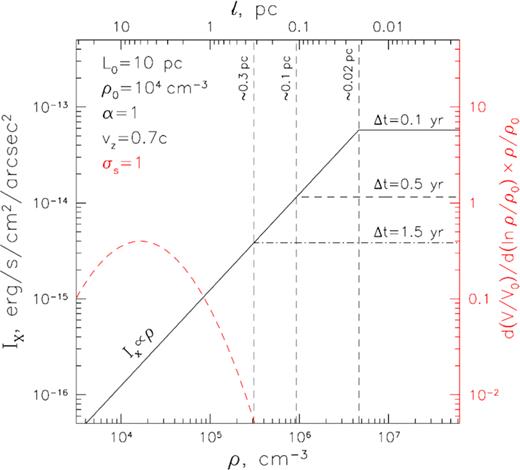
Relation between surface brightness of reflected X-ray emission and gas density (and characteristic size) of a substructure inside a molecular cloud with power-law density (bottom axis)–size (top axis) scaling relation ρ ∝ l−α with α = 1, and ρ0 = 104 cm−3 at L0 = 10 pc. Surface brightness normalization corresponds to the flare fluence LXΔt = 3 × 1046 erg (4–8 keV) and source-to-cloud distance Dsc = 30 pc. The front propagation speed along the line of sight is set equal to |$\upsilon _z=0.7c$|, while the flare’s duration is Δt = 0.1, 0.5, and 1.5 yr for solid, dashed, and dash–dotted lines, respectively. The relation is linear down to the scale marked with thin vertical dashed lines for each flare’s duration. The red dashed curve (corresponding to the right y-axis) shows mass (i.e. fraction of volume multiplied by density) distribution between the scales for a cloud having lognormal density distribution with a mean density of ρ0 = 104 cm−3 and σs = 1 (see the text for details).
In-depth analysis of these simulations at different evolutionary times shows that the shape of PDF(ρ) is indeed well described by the lognormal shape, and also that the mass–size scaling relation for the cloud’s substructures is quite close to the prediction of the third scaling relation of Larson (1981) (see, however, Kritsuk et al. 2011, for a discussion of possible caveats and level of uncertainty in that conclusion).
2.2 Global picture
Of course, the supersonic turbulence is not the only agent shaping density and velocity fields inside molecular clouds. In particular, at smaller (sub-pc) scales, gravity starts playing an increasingly significant role, marking the transition from random turbulent motions to coherent ones at the so-called sonic scale λs ∼ 0.1 pc. The formation and contraction of compact gravitationally bound substructures lead to a prominent distortion of the high end of the density distribution function, particularly in the form of power-law tails well above the extrapolation of the lognormal distribution to these scales (e.g. Ostriker et al. 1999; Klessen 2000; Cho & Kim 2011; Kritsuk et al. 2011; Federrath & Klessen 2013; Girichidis et al. 2014; Burkhart, Stalpes & Collins 2017). It is worth mentioning that the ‘cascading turbulence’ paradigm bears certain caveats and recent observations (Traficante et al. 2018) seem to provide support to the scenario in which multiscale collapse motions dominate in the turbulent velocity field (e.g. Ballesteros-Paredes, Vázquez-Semadeni, Palau & Klessen et al. 2018).
This high-density tail is crucial for the star formation rate and the star formation efficiency of the cloud (e.g. Krumholz & McKee 2005; Elmegreen 2008; Hennebelle & Chabrier 2011; Padoan & Nordlund 2011; Federrath & Klessen 2012; Salim, Federrath & Kewley 2015; Burkhart 2018). In this respect, molecular clouds in the CMZ are of particular interest because the star formation efficiency measured for them appears to be an order of magnitude lower compared to the molecular clouds in the Galactic disc (Longmore et al. 2013; Kruijssen et al. 2014; Ginsburg et al. 2016; Kauffmann et al. 2017a; Barnes et al. 2017). This might be a consequence of the very specific Galactic Center environment, e.g. as a result of intensive forcing of solenoidal turbulence due to tidal shears (Federrath et al. 2016), or reflect some evolutionary track of the dense gas flows in the dynamic gravitational potential (Kruijssen, Dale & Longmore 2015; Sormani et al. 2018; Dale, Kruijssen & Longmore 2019; Kruijssen et al. 2019).
Thus, it is clear that the simple picture considered earlier has relevance only for a certain range of scales, which is set by the evolutionary state and environmental conditions of a particular cloud.
In order to explore this in more detail, we take advantage of the output produced by 3D ‘zoom-in’ simulations SILCC-Zoom (Seifried et al. 2017), which are part of the SILCC (SImulating the LifeCycle of molecular Clouds) project (Walch et al. 2015; Girichidis et al. 2016). These simulations model the self-consistent formation and evolution of molecular clouds in their larger scale galactic environment. They follow the non-equilibrium formation of H2 and CO including (self-)shielding and important heating and cooling processes, which allows for an accurate description of the thermodynamical and chemical properties of the clouds. The clouds are modelled in a small section of a galactic disc with solar neighbourhood properties and a size of 500 pc × 500 pc |$\times \, \pm$|5 kpc in which turbulence is initially driven by supernova explosions.
During the course of the simulations, two ‘zoom-in’ regions are selected in which molecular clouds are about to form. The clouds in these zoom-in regions are then modelled with a high spatial resolution of up to 0.12 pc using adaptive mesh refinement while simultaneously keeping the galactic environment at lower resolution. Such a resolution of 0.12 pc appears sufficient for the flare duration ≳0.3 yr, and it also translates into spatial binning at level ≈3 arcsec at the distance of the Galactic Center (dGC ≈ 8.2 kpc; Gravity Collaboration et al. 2019), which matches quite well the angular resolution provided by the best current (Chandra) and future (Lynx and ATHENA) X-ray observatories (see Section 5.1 for a discussion of the instrument resolution impact on probing the gas density PDF).
A possible caveat of using these simulations is that molecular clouds in the CMZ might have different properties compared to the clouds in the Galactic disc, which were the primary focus of modelling in the SILCC project. Nevertheless, the properties that are of greatest importance for our study (i.e. sampling variance of the PDF shape and impact of self-gravity and feedback on it) should be qualitatively similar, allowing to illustrate the possibility of the PDF reconstruction over the turbulence-dominated range of scales. Namely, the lognormal shape of the gas density PDF (with a power-law tail at later times) is indeed recovered in these simulations when the dense gas is considered. Of course, these simulations also contain much more tenuous gas, so the full density PDF has a more complicated shape reflecting multiphase nature of the gas. Once again, we stress out that exact PDF signatures of this multiphase picture might be different for the CMZ clouds.
In the next section, we model the distribution function for the surface brightness of the reflected X-ray emission resulting from illumination of these simulated molecular clouds by a short X-ray flare.
3 REFLECTION OF A SHORT X-RAY FLARE ON MOLECULAR GAS
The possibility of using reflection of X-ray emission for simultaneous studies of interstellar medium and activity records of illuminating sources has been envisaged long ago (e.g. Vainshtein & Sunyaev 1980). Indeed, interaction of X-ray radiation with cold atomic and molecular gas is both very well understood from a theoretical point of view (Sunyaev & Churazov 1996, 1998; Vainshtein, Syunyaev & Churazov 1998; Sunyaev, Uskov & Churazov 1999) and in application to numerous astrophysical situations (see Fabian & Ross 2010, for a recent review), including illumination of a secondary star in X-ray binaries and reflection by its atmosphere (Basko, Sunyaev & Titarchuk 1974), reflection on accretion disks, and reprocessing of active galactic nucleus emission on the surrounding torus (George & Fabian 1991). Characteristics of the resulting emission (intensity, spectrum, polarization, etc.) can be readily modelled, especially when certain simplifying assumptions might be adopted.
Namely, for the illumination of molecular clouds in the CMZ by the short X-ray flare from Sgr A* , one may safely neglect influence of X-ray radiation on the ionization, thermal, or chemical state of the irradiated gas (see, however, Mackey et al. 2019, for possible consequences of powerful X-ray illumination over a more extended period of time).
Besides that, column densities of the molecular clouds in the CMZ typically do not exceed |$N_{\mathrm{ H}}\, \sim 10^{24}$| cm−2, hence their optical depth with respect to electron scattering, τT ∼ NHσT ≲ 0.66. Furthermore, the fraction of scattered to absorbed photons scales as σT/(σT + σph), where σph is the cross-section for photoelectric absorption. Given that σph exceeds σT for photon energies E ≲ 15 keV (for solar abundance of heavy elements), single-scattering approximation is sufficient in most cases, except for the most massive clouds like Sgr B2, the densest compact cores, and if Compton shoulder of the fluorescent line is of particular concern (e.g. Molaro, Khatri & Sunyaev 2016). The impact of the primary X-ray reflection signal contamination by doubly scattered emission is described in Appendix A.
For a known geometry of illumination and observation, the problem then reduces to a single value describing the efficiency of X-ray reflection in a certain energy band, i.e. X-ray reflection albedo or effective scattering cross-section (e.g. Churazov et al. 2017c). The latter should take into account the contribution of the fluorescent lines falling inside the energy band, and for the 4–8 keV band this results in an effective scattering cross-section σ4−8, which is a factor of 1.7 larger than σT for 90° scattering and for solar abundance of heavy elements, as far as |$N_{\mathrm{ H}}\, \lesssim 3\times 10^{23}$| cm−2 (see Churazov et al. 2017c, for a detailed discussion). These conditions ensure that the illuminated gas is optically thin with respect to photoelectric absorption, so it fully contributes to the reflected signal. At |$N_{\mathrm{ H}}\, \gtrsim 3\times 10^{23}$| cm−2, some fraction of the gas gets self-shielded and the reflection efficiency drops (Churazov et al. 2017c).
As far as the size of the cloud L is much less than its distance to the primary source Dsc, the illumination front propagation speed |$\upsilon _z$| does not vary significantly across the whole extent of the illuminated region. In principle, it ranges from 0.5c to ∞, depending on the relative position of the primary source, cloud, and observer, so that for the Sgr B2 cloud it was estimated at level of 3c, while for the currently brightest in X-ray reflection molecular complex Sgr A it was measured equal to 0.7c (Ponti et al. 2010; Churazov et al. 2017a). This implies line-of-sight extent of the illuminated region at level |$\delta z= v_{z}\Delta t\approx 0.3 (\Delta t/\mathrm{yr})({\upsilon _z}/{c})$| pc, which is significantly smaller than the characteristic size of this molecular complex, L ∼ 10 pc (Ponti et al. 2010), for Δt ≲ 2 yr and any |$\upsilon _z$| not exceeding c by a large factor.
Of course, in reality the smallest possible ΔΩ is set by effective spatial resolution of the X-ray data, determined both by angular resolution of the telescope and statistical significance of the signal, and we consider the impact of the corresponding limitations in Section 5.1.
Let us consider a substructure inside the molecular cloud that has line-of-sight extent l and constant density ρH, l(x, y). If l > δz, then the integration in equation (7) is trivial and gives |$\bar{\rho }_\mathrm{ H}(x,y,z)=\rho _{\mathrm{ H},l}(x,y)$|. Combining this with equation (4), one can see that IX ∝ ρH, l(x, y) in this case, so IX simply maps the number density of such a substructure in the linear fashion.
Consider now the opposite case – a substructure of size l less than δz, i.e. having a constant density ρH, l(x, y) inside some subrange of δz and zero density outside it. The integration in equation (7) gives here |$\bar{\rho }_\mathrm{ H}(x,y,z)=\frac{l}{\delta z}\rho _{\mathrm{ H},l}(x,y)$|. That means, one gets IX ∝ lρH, l(x, y), indicating that reflected emission of smaller structures gets suppressed due to incomplete filling of the illumination front thickness by them.
For instance, would the third scaling relation of Larson (1981) hold for the substructures, NH(l) ≡ ρH(l)l = const., hence ρH(l) ∝ 1/l, i.e. α = 1 and IX ∝ ρH(l)0 = const. for l < δz. Clearly, a stronger (α > 1) or weaker (α < 1) scaling will result in, respectively, weaker or stronger suppression of X-ray reflection from substructures at the high-density end.
We illustrate this effect in Fig. 3 for various durations of the flare and a molecular cloud having size–density relation for substructures in the form of ρH(l) ∝ l−α with α = 1, and gas number density 104 cm−3 at l = 10 pc, broadly similar to the currently brightest in X-ray reflection molecular complex Sgr A (cf. table 2 in Ponti et al. 2010) and the ‘Brick’ molecular cloud (Federrath et al. 2016). As can been seen, it is in principle possible to linearly probe scales at least down to 0.3 pc, corresponding to a gas density of ∼3 × 105 cm−3 in this case. For flare duration as short as 0.5 yr (0.1 yr), the smallest linearly probed scale is 0.1 pc (0.02 pc), corresponding to a density of 106 cm−3 (5 × 106 cm−3). Thus, the dynamic range provided by X-ray reflection observations spans 1.5–2.5 orders of magnitude in density.
It is worth mentioning that the integrated column density of such a cloud would be NH ∼ 3 × 1023 cm−2, while the scaling with α = 1 means that the column density stays the same over the whole range of substructure scales. This ensures applicability of the optically thin approximation over the full accessible dynamical range.
In principle, it is possible that several substructures with size l ≪ δz overlap in projection. The probability of such an occasion is determined essentially by their number density, intimately related to the gas density PDF. The expected shape (e.g. lognormal) of this distribution function decreases rapidly at the high-density end (see Section 2), ensuring that the overlap probability is also a decreasing function of the gas density in this part of the distribution. Finite angular resolution of the real data could, of course, substantially boost this probability, but it also proportionally smears down the X-ray reflection signal produced from such substructures, so the resultant (i.e. summed and smeared) surface brightness is very unlikely to overshoot significantly the maximum IX level predicted by linear scaling in equation (8) (see Section 5.1 for an in-depth discussion of that point).
Of course, real molecular clouds have much more complicated internal structure than described by a single density–size scaling relation for the substructures and gas density PDF as we used for illustration above. For instance, smaller substructures might be preferentially embedded in bigger ones, and hence being subject to higher absorption and potentially to a certain degree of clustering. On the other hand, compact optically thick cores can ‘cast a shadow’ on all the gas behind them, both from the point of view of the illuminating source and the observer. We shall check the impact of all these effects on the relation between the statistics of the X-ray reflection emission and the gas density field using outputs of numerical simulations of molecular clouds as described next.
4 RESULTS
4.1 Isothermal supersonic turbulence
Let us start considering statistical properties of X-ray reflection on a molecular cloud (or some part of it) represented by a box of simulated supersonic isothermal turbulence by Federrath et al. (2008). As these simulations are scale free by design, we could adjust the scales so that resulting configurations would resemble clouds of various sizes and, most importantly, opacities. We set the size of the box equal to L0 = 4 pc and gas mean density equal to either ρ0 = 103 or 104 cm−3. This results in the mean column density at level NH ∼ ρ0L0 ∼ 1022 and ∼1023 cm−2 for the first case and the second case, respectively. The corresponding masses are |$M \sim m_{\mathrm{ p}}\rho _0 L_0^3\sim 2\times 10^{3}$| and ∼2 × 10⁴ M⊙. This choice of the scales results in rough consistency between the resulting physical properties of the simulation boxes and real molecular clouds for the main simulation parameter, namely a Mach number of ∼5 (and resulting velocity dispersion of ∼1 km s−1) (e.g. Larson 1981; Solomon et al. 1987; Falgarone, Puget & Perault 1992; Roman-Duval et al. 2010).
Given a 3D distribution of the molecular gas, X-ray reflection is modelled in the following (simplified) way: illumination proceeds in the plane-parallel manner along the x-axis of the cube from right to left, and is then observed by a distant observer located at −∞ of the z-axis (as illustrated by Fig. 2). The attenuation of the incident and outgoing X-ray radiation is applied with an effective cross-section of σph = 6σT that mimics photoelectric absorption by neutral gas with a solar metallicity in the 4–8 keV energy band. Having set the front propagation velocity |${\upsilon} _z=0.7c$|, the thickness of the illuminated layer is then determined by the duration of the flare, while its age defines the position of this layer inside the box. In order to minimize distortions due to boundaries of the box, we will consider a situation when the illumination front passes through the middle of the box (see Fig. 2).
The X-ray reflection signal is calculated according to equation (4) for each simulation voxel that falls inside the illumination region, with the incident X-ray flux being correspondingly attenuated by all the gas located between the voxel and the primary source (located at +∞ of the x-axis; see Fig. 2). Further attenuation is applied due to the gas between the voxel and the observer (located at −∞ of the z-axis; see Fig. 2). After integration along each line of sight, one gets a surface brightness map of the X-ray reflection, which is then linearly converted into a corresponding average gas density map inside the layer.
4.1.1 Solenoidal versus compressive forcing
The left-hand panels in Figs 4 and 5 show the result of this procedure for boxes of solenoidally forced (Fig. 4) and compressively forced (Fig. 5) turbulence with ρ0 = 103 cm−3 and flare duration Δt = 1 yr. For a comparison, the middle panels of these figures show maps of the average density found by volume-weighted integration along the line of sight across the whole box (which is an equivalent of the column density map of the molecular gas inside the box). Clearly, line-of-sight averaging smears the sharp substructures exemplified by the density map derived from X-ray reflection. A drastic difference in the dynamic range of these two maps is clearly visible.
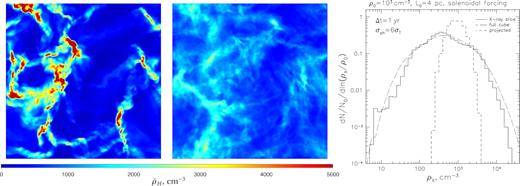
Comparison of the gas density statistics as probed by X-ray reflection and column density techniques for a 4 pc box of simulated isothermal turbulence (solenoidal driving) with a mean gas density of ρ0 = 103 cm−3. Left-hand panel: A map of the gas density (cm−3) that would be revealed by an X-ray flare with a duration of Δt = 1 yr passing through the middle of the cloud (see Fig. 2). Middle panel: A map of the gas density (cm−3) averaged by volume-weighted integration over the whole line-of-sight axis of the simulation box. Right-hand panel: Gas density PDF as derived from the illuminated slice (solid line) compared to the PDF of the line-of-sight-averaged (i.e. projected) density (short-dashed line). The long-dashed curve shows gas density PDF extracted from the whole box. Cross-section for X-ray attenuation was set equal to σph = 6σT.
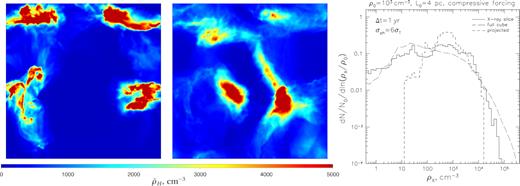
This point can be even better visualized by comparing gas density PDF that would be derived from the X-ray reflection and from a column density image. The right-hand panels in Figs 4 and 5 demonstrate that the gas density PDF derived from X-ray reflection matches well the original gas density distribution of the whole box, even taken into account applied attenuation (important mostly in the high-density end of the distribution) and sampling variance due to relatively small volume of the illuminated layer. The characteristic dynamic range of these PDFs is naturally much broader than that for the integrated density map, which is quite narrowly centred on the mean gas density. As a result, the diagnostic power of the gas density PDF recovered from X-rays should be significantly enhanced compared to the common column density studies.
Indeed, as is exemplified in Fig. 6, one can readily use the gas density PDF recovered from X-ray surface brightness to distinguish solenoidal and compressive forcing of the turbulence with the same average Mach number. Supersonic turbulence with compressive forcing is characterized by ≈3 times larger width of the gas density PDF compared to the case of solenoidal forcing (Federrath et al. 2008), and X-ray mapping in principle allows us to observe corresponding differences both at the low-density and high-density ends of the distribution function (see Fig. 6).
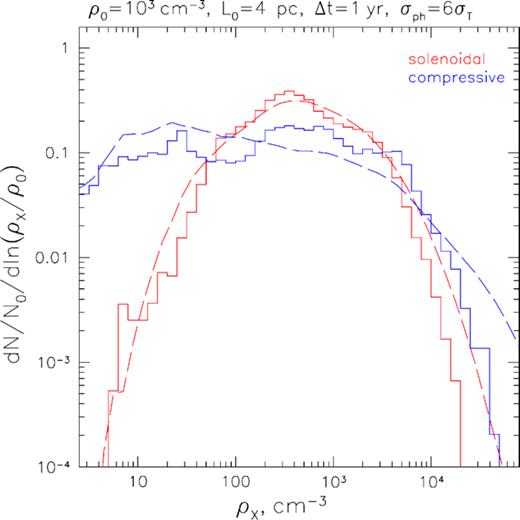
Illustration of the possibility to distinguish solenoidal (red) versus compressive forcing (blue). The solid lines show the density PDFs of the slice with thickness corresponding to Δt = 1 yr with effects of attenuation applied, and the long-dashed lines show the original density PDFs of the whole cube.
However, the low-density end corresponds to low surface brightness of the reflected X-ray emission, so for real observations it might be affected by contaminating emission and statistical biases introduced by low-count statistics (see Section 5.1). These problems can be tackled by increasing the sensitivity of the available data and invoking additional information regarding sources of contamination, and we will discuss this more in Section 5.1.
On the other hand, the high-density end corresponds to compact dense substructures, which are embedded in bigger ones, resulting in a steady increase in the characteristic attenuation optical depth τ for these regions (namely, in the case of the power-law scaling relation between density and size with the slope α = 1, a roughly logarithmic increase of τ with density might be expected). As a result, reflected X-ray emission from denser substructures should get suppressed compared to the optically thin prediction. Additionally, dense and compact substructures can ‘cast a shadow’ on other regions that fall either behind them when seen from the primary source, or in front of them when seen from the observer.
4.1.2 Impact of attenuation
For the simulation boxes considered above and normalized to average density ρ0 = 103 cm−3, the impact of attenuation effects on the shape of the density PDF, however, stays negligible down to the smallest scales (for the effective X-ray attenuation cross-section in the 4–8 keV band σph ≈ 6σT, fiducial for neutral gas with solar metallicity). Taking the average density equal to ρ0 = 104 cm−3 makes the suppression effect clearly distinguishable via a steeper PDF decline at the high-density end (see Fig. 7). Indeed, the column density at the largest scale is ∼1023 cm−2 and it increases by at least a factor of several for scales with ρ ≳ 10ρ0, surpassing the threshold column density for the optically thin limit, viz. NH ≃ 3 × 1023 cm−2. As a result, the reconstructed shape of the gas density PDF at such densities is significantly distorted, both in terms of the high-end suppression and flattening at the pivot scale due to ‘horizontal migration’ of the dense regions to lower reconstructed densities. Clearly, for these high-density regions the information on the original shape of the true gas density PDF is lost.
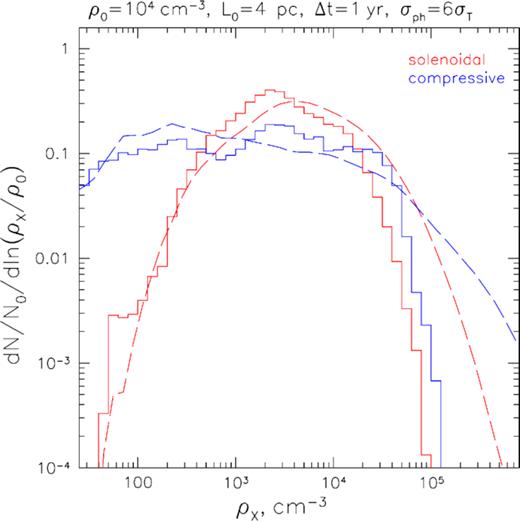
Same as Fig. 6 but for a box with a mean gas density of ρ0 = 104 cm−3. Notice prominent suppression of the high-density tail due to strong attenuation of the densest regions of the box.
4.1.3 Sampling variance
Additional complication inherent to the high-density end of the PDF is associated with sampling variance, arising due to statistical variation in the number of the rarest dense substructures falling inside the thin slice of the illuminated gas. We illustrate this effect in Fig. 8, where the variance of the PDF measured in five different slices (separated by approximately 0.5 pc) across the cloud is shown by the shaded regions. Clearly, the combined impact of absorption and sampling variance hinders using of the high-density end for turbulence diagnostic even for clouds with a mean column density of ∼1023 cm−2.
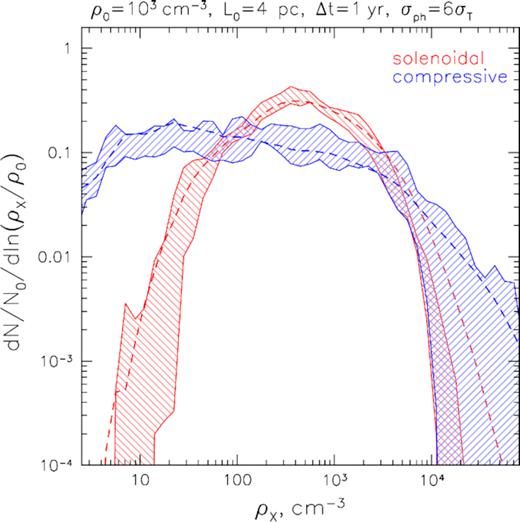
Increasing magnitude of the sampling variance at the high-density end for the X-ray-recovered gas density PDF in a box with solenoidal (red) and compressive (blue) supersonic turbulence. The boundaries of the hatched regions correspond to the spread of the PDF values constructed from individual 1-yr-thick slices, separated by 2 yr each, and the dashed lines show the original full-cube PDFs.
It is easy to see from Fig. 8 that the reconstructed PDF shapes for solenoidal and compressive turbulence are markedly different for densities below ∼5ρ0, even after taking into account absorption and sampling variance. Thus, one should focus on the PDF shape approximately an order of magnitude around the mean density, where the much more narrow distribution associated with solenoidal forcing should clearly reveal itself. This is also particularly true for the low-density end, where turbulence with compressive forcing possesses prominent underdense regions, or voids, constituting a very significant fraction of the cloud’s volume while contributing very little to its total mass. In principle, the presence of such voids can be used as a unique diagnostic, which is accessible only in X-rays, since their detection in molecular species might be strongly hindered by effects of projection and changes in molecular excitation in such relatively low-density environments. Of course, in the real molecular clouds, similar voids might appear as a result of the star formation-related feedback (e.g. in the form of supernova explosions), so the practical application of this diagnostic is likely very problematic.
4.2 Global ISM simulations
Real molecular clouds are far from being comprehensively represented by isolated boxes with isothermal turbulence, especially at the low-density end, where boundary conditions set by their parent environment must be taken into account, and at the high-density end, where the effects of self-gravity and stellar feedback cannot be neglected.
Indeed, molecular clouds are not isolated objects, but rather strongly overdense regions of the interstellar medium, and there exists a relatively smooth transition between the average low-density ISM, n ≲ 1 cm−3, to denser envelopes of molecular clouds with n ∼ 10–100 cm−3, and finally to the densest regions constituting molecular clouds themselves, n ≳ 103 cm−3.
We take advantage of the output from the SILCC-Zoom simulation for molecular cloud MC2 (Seifried et al. 2017), focusing on a cubic (6 pc)3 cut-out from it, centred on the cloud-like structure itself. The mean gas density in this cube is ρ0 ≈ 230 cm−3, reaching up to several 106 cm−3 in its central parts, and even more in embedded compact cores.
The geometry of illumination is identical to the one we adopted for outputs of ideal supersonic turbulence simulations before. Namely, the z-axis is directed along the line of sight away from the observer, while the x- and y-axes form the plane of the sky with the x-direction coinciding with the direction of the illumination (cf. Fig. 2). The top view of the average gas density (i.e. integrated with volume weighting over the y-axis) is shown in the left-hand panel of Fig. 9.
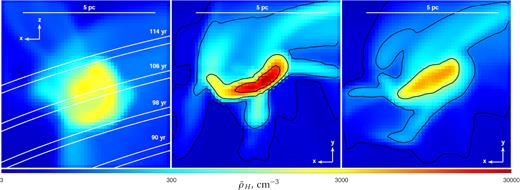
Illumination of the (6pc)3 cubic cut-out from the SILCC-Zoom simulation for molecular cloud MC2 (Seifried et al. 2017) by a short flare. The geometry of illumination is identical to the one illustrated in Fig. 2. Left: The average gas density map (cm−3) as viewed from the top of the box along the y-axis. Locations of the illumination front at different times are depicted and labelled accordingly. Centre: X-ray reconstruction of the density (cm−3) field in the picture (viz. xy) plane from the slice at t = 106 yr. Right: Map of the gas density (cm−3) averaged by volume-weighted integration along the line of sight (viz. z-axis), which essentially corresponds to commonly observed column density map of the region. The colour coding is identical for the three panels and ranges from 3 to 3 × 104 cm−3 on logarithmic scale.
The densest part of the cube, i.e. the molecular cloud itself, is located right in its central few parsec, so it gets illuminated only during certain period of time, viz. for t in between ≈100 and ≈115 yr for the illuminating source located at (−10 pc, 0 pc, −15 pc) with respect to the centre of the cube. Projections of the 1-yr-thick illumination front for t ranging from 90 to 114 yr are depicted in the left-hand panel of Fig. 9. Such disposition (and corresponding age of the flare) is very similar to the one inferred for the currently brightest illuminated molecular complex in the Galactic Center region (see e.g. Churazov et al. 2017a).
The central panel of Fig. 9 shows the X-ray reconstruction of the gas density for a slice illuminated at t = 106 yr, i.e. when the front is passing directly through the centre of the cloud. For a comparison, the right-hand panel shows the gas density averaged by volume-weighted integration along the line of sight. Naturally, the density map reconstructed from a thin slice allows us to reveal the densest compact central region with ρ in excess of 104 cm−3 (cf. the black contours marking levels of 10, 100, 103, and 104 cm−3 in the central and right-hand panels of Fig. 9).
The gas density PDF derived from six 1-yr-thick slices separated by 2 yr with t ranging from 100 to 110 yr is shown as blue shaded region in Fig. 10. The spread of this region shows the amplitude of the sampling variance, i.e. the difference between PDFs extracted from individual slices. The original gas density PDF of the whole cube is shown as solid black histogram.
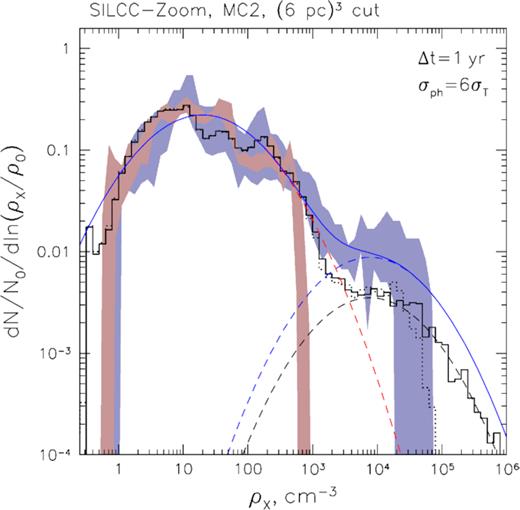
Gas density PDF reconstructed for the (6pc)3 cubic cut-out from the SILCC-Zoom simulation for molecular cloud MC2 (Seifried et al. 2017). The original full-cube PDF is shown as black solid histogram, while the dotted histogram shows impact of attenuation (with the cross-section σph = 6σT) on the high-density end of this PDF. The blue shaded region corresponds to PDF reconstructed from six 1-yr-thick X-ray slices (separated by 2 yr each) of the central densest region of the box, and the red shaded region corresponds to the same but for a region lying in front of the central densest part (which is illuminated ∼10 yr earlier). The dashed curves show lognormal approximations for the low-density and high-density parts of the PDF. The solid blue line shows the combined model for the density PDF of the central slices.
Clearly, the gas density PDF extracted from X-ray slices of the densest part of the box matches well the full-box PDF for ρ ≲ 103 cm−3, but differs increasingly at higher densities. This difference, however, is simply a result of the statistical averaging taking place in the case of the full-cube PDF. Indeed, the gas density PDF extracted from four slices that lie in front of the densest central region of the box (corresponding to t from 90 to 96 yr with 2 yr spacing; see Fig. 9) demonstrates that the ρ < 103 cm−3 part of the density PDF corresponds to the relatively lower density envelope of the cloud, while the dense part corresponds to the cloud itself.
It can be seen that the overall density statistics derived from X-ray illuminated slices does reproduce the actual gas density PDF very well over a broad range, spanning 3–5 orders of magnitude. Clearly, the low-density end, representing the envelope of the cloud, is robustly probed both with slices containing the cloud itself and those lying in front of it. Gas with such density constitutes the bulk of the volume and its PDF shape can be vaguely described as lognormal (see also Körtgen, Federrath & Banerjee 2019) with a mean ρ0 ≃ 100 cm −3 and σs ≃ 1.7 (see the red dashed line in Fig. 10).
In the high-density part, one can see a dramatic change in the gas density PDF as the X-ray illumination front enters the cloud. Namely, an additional quasi-lognormal tail appears with the mean density ρ ∼ few × 104 cm−3 and σs ≃ 1.7 as well (see the black dashed curve for the whole cube PDF and the blue dashed curve for slices passing through the central region in Fig. 10). The combined model constructed of the two lognormal distributions is shown in Fig. 10 as the solid blue line. Clearly, having PDFs measured over a time span of ≳15 yr, one can readily separate the gas density PDF of the molecular cloud itself from the contribution of the surrounding ISM.
The gas densities of around ∼few|$\, 10^3\, {\rm cm}^{-3}$|, where the two lognormal parts overlap (see Fig. 10), correspond to the intermediate gas phase transitioning from the atomic to molecular state. The actual shape of the density PDF in this region is sensitive to details of the gas thermal stability and the strength of the large-scale turbulent driving and dissipation (Walch et al. 2011). The X-ray reflection indeed allows this part of the PDF to be well reconstructed and used for more advanced diagnostics.
An important difference between the full-cube PDF and the one probed with X-ray reflection is obvious at densities ≳104 cm−3, where X-ray attenuation suppresses the reflection signal from the densest parts. Indeed, although the intervening column density is relatively low, ∼ρ0L ≲ 1022 cm−2 for the bulk of the volume, it steadily increases for regions with high densities due to the hierarchical structure of the cloud, such that the regions with ρ ≳ 105 cm−3 get fully attenuated (see the black dotted line in Fig. 10 that shows the impact of attenuation on the full-cube PDF). This effect, of course, strongly affects the PDF of individual X-ray slices; in this case the exact value of the density at which the attenuation cut-off takes place is not so well defined due to strong impact of the sampling variance at the high-density end.
In principle, the impact of the attenuation can be somewhat weakened by selecting another spectral energy band where the effective attenuation cross-section is smaller than that in the fiducial 4–8 keV energy band. The PDF that can be reconstructed with σph ≈ 3σT is shown in Fig. 11. One might expect such effective cross-section for instance for a narrower band from 6 to 7 keV (which still contains the Fe i fluorescent line, the most distinctive feature of the X-ray reflection) or at energies ≳10 keV.
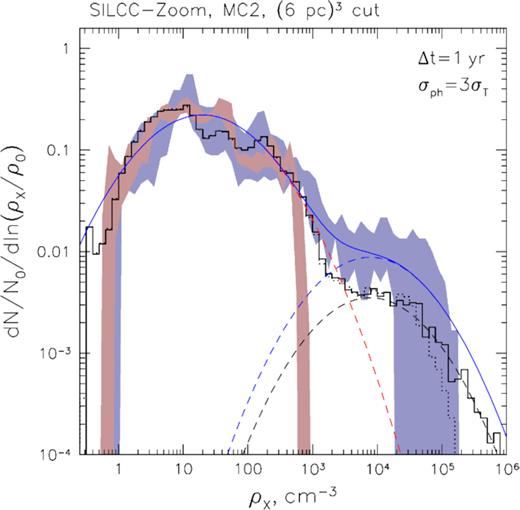
Same as Fig. 10 but with σph = 3σT. Notice substantial extension of the probed density range in the high-density tail.
Unfortunately, in practice one has to deal with a number of observational limitations, set by accessible sensitivity, angular and spectral resolution of the data. Currently, these limitations prohibit using a narrow spectral window or harder X-ray range, but the next generation of X-ray observatories will allow such analysis to be performed. In the next section, we discuss all the relevant observation-related issues in full detail.
5 DISCUSSION
Above we considered inevitable distortions inherent to X-ray probing of the gas density statistics arising due to finite duration of the flare and obscuration of the densest regions even for highly penetrative X-ray emission. The real data are always prone to a certain level of noise and information loss, which potentially leads to biases in the measured quantities. Another important complication is that one always has to deal with contamination of the detected signal by X-ray emissions of different nature. This is particularly the case for the very crowded region of the Galactic Center, hosting both an abundant population of point sources and plenty of extended structures (e.g. Muno et al. 2004, 2009; Heard & Warwick 2013a, b; Ponti et al. 2015).
In order to minimize the possible impact of all these issues, one has to ensure that the quality of the data is sufficiently high to allow robust measurements to be performed. Next we thoroughly discuss all these complications and the ways to handle them given the currently available and the foreseen quality of data.
5.1 Implications of limited sensitivity and angular resolution
Angular resolution of modern X-ray telescopes does not allow resolving structures smaller than ∼1 arcsec, viz. 0.04 pc at the distance to the Galactic Center, with Chandra, and ∼5 arcsec, viz. 0.2 pc, with XMM–Newton. As a result, the X-ray flux produced by the substructure of size l is smeared over a region of the point spread function size, δx. If l < δx, the resulting surface brightness gets suppressed by a factor of (δx/l)2. Once again, assuming a power-law relation between ρH, l = ρH(l) ∝ l−α, one can expect a break in the IX(ρH) relation due to ρH(l)−2/α suppression at densities corresponding to l < δx. This effect is illustrated in Fig. 12 (for the case of the power-law size–density scaling relation with α = 1 and ρ0 = 104 cm−3 at L0 = 10 pc).
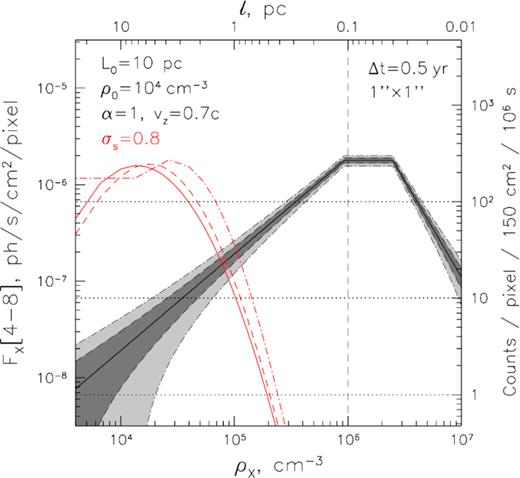
Similar to Fig. 3 but showing the relation between gas density and photon flux per 1 arcsec × 1 arcsec pixel for the reflected emission of a 0.5 yr-long flare taking into account the impact of finite angular resolution. Smearing with the instruments’ resolution leads to a strong suppression of the density–surface brightness relation at the high-density end, introducing the second break in this relation. The right axis shows the corresponding expected number of 4–8 keV counts to be detected by an instrument with 150 cm2 of effective area in this band after a 106 s exposure. The shaded regions show the expected Poisson uncertainty in the surface brightness measurement after such (dark grey, dashed boundary) and 4 times shorter (light grey, dash–dotted boundary) observation. The corresponding Eddington bias distortions of the original lognormal distribution (solid red curve, ρ0 = 104 cm−3, σs = 0.8) are shown as dash–dotted and dashed red curves, respectively, in a way identical to Fig. 3.
Clearly, as long as the characteristic scale that is set by the duration of the flare, δz = vzΔt, is larger than the scale set by the angular resolution of the data, this suppression is not of primary importance. For the brightest clouds in the vicinity of Sgr A* and the angular resolution available with Chandra, this is the case for Δt ≳ 0.15 yr. For XMM–Newton, however, this suppression becomes dominant already for Δt ∼ 0.75 yr, effectively prohibiting unambiguous probing of structures below few× 0.1 pc with this instrument.
The low count number statistics results in a high uncertainty of the measured fluxes and hence strong statistical deviations from the linear IX–ρ relation. This gives rise to the so-called Eddington bias, a characteristic distortion of the measured distribution function due to ‘horizontal migration’ of individual data points. A similar situation takes place for instance for steeply declining ends of luminosity functions, where upward statistical fluctuations of fainter sources can easily dominate over the number of much rarer intrinsically bright sources.
The problem at hand can be approximately treated as the case of a lognormal parent distribution with flux measurement subject to Poisson noise of the photon counting statistics. The resulting distorted distribution function can then be formulated in integral form and evaluated numerically, as has been done in numerous papers in bio-statistics, where Poisson-lognormal convolution is relevant on many occasions (e.g. Bulmer 1974). In fact, numerical integration can be avoided, since the approximation provided by the saddle point integration turns out to be sufficient in many cases (Izsák 2008). We briefly describe this method in Appendix B, so it can be easily implemented in practice in future studies. The resulting distortion of the measured PDF function is illustrated in Fig. 12. One can see that for texp ∼ 106 s (i.e. 1 Ms) the overall amplitude of the PDF distortion is small, but for |$t_{\rm exp}\, \sim 4\!-\!5$| times smaller (i.e. 200–250 ks, which is comparable to the deepest currently available data), the PDF measurement is strongly affected for the major part of the volume. Next we discuss the implications of this distortion for the estimation of parameters characterizing the PDF shape.
It is worth mentioning here that the uncertainty of the surface brightness measurement can be higher than purely Poisson uncertainty if spectral separation of the reflected X-ray emission from the contaminating background and foreground emission is needed. In the case of (apparently) diffuse contaminating emission, the linear component separation method can be used that takes into account different spectral shapes of various components. Robust operation of this method typically requires a few tens of total counts to be detected in the 4–8 keV band in order to properly sample relevant spectral features of the characteristic spectral models (see Appendix A).
Thanks to temporally and spatially smooth (and in principle predictable) behaviour of the most important contaminating diffuse component, one can significantly diminish biases of the component separation technique even for a very low number of counts in each individual pixel. For instance, the spatial distribution of mid-infrared light is believed to trace the distribution of the old stellar population, allowing one to predict the intensity of the corresponding Galactic X-ray Ridge emission with an accuracy of few 10 per cent (e.g. Revnivtsev et al. 2009). Our tests show that the overall boost of uncertainty in the measured reflection signal intensity typically amounts to a factor of several. Possible impacts of additional sources of contamination, namely point sources, second scatterings, and X-ray reflection due to intervening structures along the line of sight in a multiflare scenario, are thoroughly discussed in Appendix A.
5.2 Accuracy of PDF reconstruction with current and future data
Having in mind the limitations and distortions inherent to an X-ray measurement of the gas density PDF described above, we can quantify the accuracy of the PDF parameter estimation accessible with such data. Since it is of primary importance to probe the gas density PDF down to ∼0.1 pc scales, the angular resolution of the data needs to be kept ≲2 arcsec. The question is then how large is the dynamic range of scales that is accessible to robust X-ray probing with such binning of the data. Clearly, the largest scale corresponds to the size of the cloud, so the maximal dynamic range spans 1–2 orders of magnitude for the cloud’s size ranging from 1 to 10 pc. This also means that the whole cloud typically contains N0 ∼few× 102 to few× 104 2 arcsec × 2 arcsec pixels.
The surface brightness of the reflected emission at the largest scales is plausibly too low for robust measurement in individual pixels. None the less, the mean gas density in the cloud can be robustly inferred from the total measured reflection flux, given that this quantity characterizes the cloud as a whole, so averaging across the biggest available scale does not introduce any bias. As a result, one can then readily calculate the expected number of counts C0 to be detected for a pixel containing gas of the mean density with very high accuracy.3
Reliable reconstruction of the PDF shape is possible only if sufficient number of pixels with detected number of counts Cth ≳ 10, i.e. at densities ρX ≳ Cth/C0ρ0, are present. The fraction of such pixels is |$\text{$\sim$} Q(x)=0.5~{\rm erfc}\left(\frac{\ln (C_{\rm th}/C_{0})}{\sqrt{2}\sigma _s}\right)$| in the case of a lognormal distribution with dispersion σs, x = ln (ρX/ρ0)/σs. This fraction equals 10−2 for x = 2.3 (and 10−3 for x = 3), so that for the number of such pixels to be sufficient for PDF reconstruction one needs to have at least |$C_0\gtrsim \frac{C_{\rm th}}{\exp (2.3\sigma _s)}\approx 1$| for Cth = 10 and σs = 1. As can be seen from equation (9), this means that exposures of at least a few hundred kiloseconds with a Chandra-like instrument (Aeff ∼ 150 cm2 at 4–8 keV) are needed for reconstruction of a lognormal PDF with 2 arcsec spatial binning.
The PDF shape is typically more complicated than purely lognormal even in the case of isothermal supersonic turbulence, especially in the high-density part where sampling variance, effects of opacity, and angular smearing all might become pronounced. Due to this, it is very valuable not only to measure the characteristic width of the distribution in the form of σs but also to reconstruct its actual shape to be able to correct it for the possible impact of these effects.
We took advantage of the results presented in Section 4 for the boxes of supersonic isothermal turbulence to check this possibility. Namely, we performed Monte Carlo simulations of observed distribution functions taking into account discrete sampling of the original PDF function with superimposed Poisson noise in the measured number of counts. Naturally, such simulations allow us to reproduce the Eddington bias at the low-density end and the shot noise at the high-density end in a fully self-consistent manner.
Results of such simulations for a Chandra-like instrument (Aeff ∼ 150 cm2 at 4–8 keV), 2 arcsec spatial binning, and 250 ks and 1 Ms exposure times are shown in Figs 13 and 14, respectively. While the former roughly corresponds to the quality of the best currently available data (Churazov et al. 2017c), the latter demonstrates what might be achieved with a deep Chandra exposure or with a very modest exposure with X-ray observatories of the next generation, i.e. ATHENA and Lynx (see Churazov et al. 2019, for a dedicated discussion).
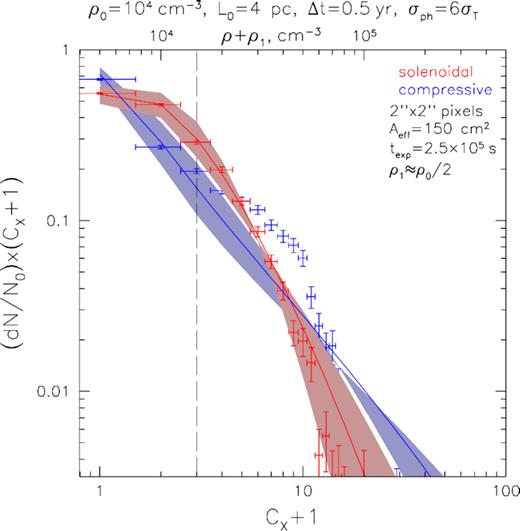
Simulated distributions of the detected number of counts per 2 arcsec × 2 arcsec pixel (4–8 keV band, CX + 1 is used for the x-axis instead of CX for better visibility on logarithmic scale) after a 250 ks-long observation of the reflected emission from boxes of isothermal supersonic turbulence with size L0 = 4 pc and mean density ρ0 = 104 cm−3 (red points for solenoidal forcing, and blue points for compressive forcing; see Section 2) with a Chandra-like instrument (Aeff ∼ 150 cm2 at 4–8 keV). Parameters of the flare (Δt ∼ 0.5 yr and LX, 4–8Δt ∼ 3 × 1046 erg) and cloud’s disposition (Dsc ≈ 30 pc, vz = 0.7c) are similar to the ones inferred for the Sgr A molecular complex that is currently the brightest one in reflected emission (Churazov et al. 2017c). Horizontal ‘error bars’ of the points equal 1 (i.e. simply depicting size of the bin), while vertical error bars correspond to 1σ variance due to shot noise in the number of pixels per each CX bin. Lognormal approximations (taking into account Eddington bias at the low-surface brightness end) with expected values of the width (σs = 1.15 and 1.8 for solenoidal and compressive forcing, respectively) are shown with solid lines, while the shaded regions correspond to |$\pm 20{{\ \rm per\ cent}}$| variation in σs (with a fixed average density and overall normalization). The top axis shows the corresponding gas number density with addition of the reference density ρ1 = 5 × 103 cm−3 giving 1 count per pixel over full exposure time. The vertical dashed line marks the position of the mean density.
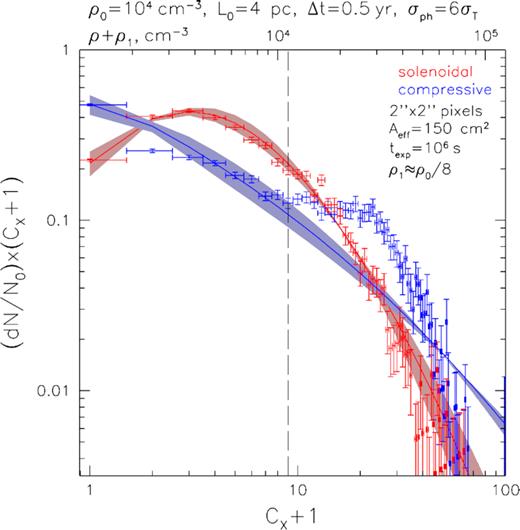
Same as Fig. 13 but for a 1 Ms-long observation. The shaded regions correspond now to |$\pm 10{{\ \rm per\ cent}}$| variation in σs. The reference gas density ρ1 equals 1.25 × 103 cm−3 in this case.
It useful to define a reference density ρ1 corresponding to the expectation value of 1 count per pixel to be detected over the whole exposure time. From the equation (9), one can see that ρ1 ∼ 4 × 10³ and 1 × 103 cm−3 for texp = 250 ks and 1 Ms, respectively. Only densities a factor of 10 larger than this are not strongly affected by the statistical noise in the data.
As can be seen from Fig. 13, currently available data (texp ∼ few 100 ks) allow for robust probing only for the high-density part of the PDF, i.e. at ρx ≳ 3ρ0. However, including theoretical prescription for the Poisson-lognormal distortion (described in Appendix B) results in |$\text{$\sim$} 20{{\ \rm per\ cent}}$| accuracy of the σs measurement (see the shaded areas in Fig. 13). Since expected values of σs are ≈1.15 for solenoidal forcing and ≈1.8 for compressive forcing (given that |$\mathcal {M}\sim 5$| in both cases, cf. equation 3), the current data (cf. the analysis performed in Churazov et al. 2017c) provide only marginal possibility to distinguish between these two scenarios. Moreover, the additional noise introduced by necessity of spectral filtering of the contaminating emission should make the purely Poisson-lognormal model not applicable, especially at the low-surface brightness end of the distribution.
The situation changes significantly in the case of 4 times longer (i.e. ∼1 Ms level) exposure (see Fig. 14). Indeed, here the bulk of the volume is expected to produce a non-zero number of counts, and the overall PDF shape can be well reconstructed over the dynamic range of a few tens. The resulting uncertainty of the σs measurement would not exceed |$10{{\ \rm per\ cent}}$|, allowing firm conclusions on the dominant forcing mechanism to be done.
As has been shown in Section 2.2, the high-density part of the PDF extracted from the realistic zoom-in simulations of the molecular clouds can be well approximated as lognormal with σs ≈ 1.7. Clearly, |$\text{$\sim$} 10{{\ \rm per\ cent}}$| accuracy in measuring σs should be feasible with such data as well, given that opacity and flare’s duration do not prohibit probing the scales down to ∼0.2 pc. As mentioned earlier, at these scales a power-law tail might appear in the density PDF as a result of self-gravity taking over the turbulent motions. We do not expect that this tail will affect parameter estimation for the bulk PDF, but it is of great interest to study this transition by itself, of course.
Once again, contamination of the reflected signal by diffuse emission of other nature as well as foreground and background point sources needs to be fully taken into account in the analysis of the real data. A discussion of the resulting complications and the ways to overcome them is given in Appendix A. In general, some of these issues might be treated by increasing the lower threshold for the minimum number of the detected counts per pixel in addition to exploiting information on temporal variations and spatial distribution of the contaminating signals. Fortunately, X-ray observatories of the next generation will benefit not only from ∼10 times higher sensitivity, but also from excellent spectral resolution (∼few eV at 6.4 keV in the case of cryogenic bolometers) making possible more robust component separation (see Appendix A) and usage of narrower spectral bands (e.g. centred on the iron fluorescent line at 6.4 keV).
An even more ambitious opportunity would be to use a harder X-ray energy band, namely above 10 keV, where the impact of opacity is minimized. Indeed, σph falls below 2σT for E > 15 keV, allowing to probe a factor of several higher densities. An additional advantage of this band is also decreased sensitivity of both X-ray albedo and attenuation on the gas metallicity. The most important limitation is, of course, set by angular resolution of the instruments operating in this energy band. Since component separation based on spectral decomposition is unlikely to be feasible in the hard X-ray band alone, a promising approach would be to combine the information obtained in different bands in order to single out effects of opacity (assuming a uniform metallicity across the cloud).
5.3 Probing the gas velocity field
Above we considered intensity mapping of the reflected X-ray emission as a way to probe statistics of the gas density field. The next generation of X-ray observatories featuring both high collecting area and exquisite spectral resolution, FWHM ∼few eV at 6.4 keV, will allow a natural step forward to be made, namely spectral mapping, and, in particular, measurement of the fluorescent line centroid, width, and amplitude of the line’s ‘Compton shoulder’ (see a dedicated discussion of the prospects of future X-ray observatories in Churazov et al. 2019).
In fact, the fluorescent line is a close doublet of the Kα, 1 and Kα, 2 components, separated by ∼12 eV (as can be seen in Fig. A3). The estimated natural width of each component is (FWHM ≈ 1.6 eV, e.g. Krause & Oliver 1979). However, the actual shape of the Kα complex is more than a combination of two Lorenzians (see e.g. Mendoza et al. 2004; Ito et al. 2016). This complexity may preclude accurate line broadening diagnostic for cases when Doppler broadening is intrinsically small. The line shift can also be affected, albeit to a lesser degree, and one might hope measuring the centroid energy with ∼FWHM/10 ∼ few 0.1 eV accuracy at least for the brightest clumps in reflected emission.
Typical turbulent velocities are not very high, though for gas with a temperature of T ≲ 100 K, the sound speed amounts to |$c_{\mathrm{ s}}=\sqrt{\gamma T/\mu m_{\mathrm{ p}}}\lesssim 0.6$| km/s (for γ = 1 and the mean molecular weight μ = 2.3), so one might expect turbulent velocities of |$\upsilon \sim 3\!-\!6$| km s−1 for Mach number ranging from 5 to 10. The resulting variations in the centroid energy of the iron fluorescent line are ∼0.07–0.15 eV on the largest scales (assuming that the turbulent cascade is forced at scales comparable to the size of the cloud). Since the line broadening is associated with velocity dispersion (along the line of sight) at scales comparable to the width of the illumination front, it is expected to be even smaller and hardly measurable using X-ray reflection.
Actually, superimposed shearing distortions of the velocity field might reach higher values, especially in the very extreme and dynamic environment of the CMZ. Such a situation apparently takes place for the massive and compact Brick cloud (Federrath et al. 2016). The observed gradient of its projected velocity field amounts to few tens of km s−1 that can in principle be mapped with the next generation of X-ray observatories (e.g. ATHENA and Lynx; see corresponding discussion and an expected map of the fluorescent line’s centroid offset for the Brick cloud in Churazov et al. 2019).
This picture is very well reproduced using the outputs of global ISM simulations we discussed earlier. Fig. 15 shows the projected velocity field that might be inferred from a slice of X-ray illuminated gas (left-hand panel) and from the full central (6 pc)3 cut-out of the SILCC-Zoom MC2 simulation box centred on the molecular cloud (see Section 2.2 for the discussion of the corresponding density fields). One can see an ∼10 km s−1 velocity gradient in the central part (∼2 pc) of the box, which is partially smeared out by line-of-sight averaging in the case of the full-cube projection. Naturally, this part of the volume is characterized by the highest gas density, and hence it might be expected to be bright enough in reflected emission for the intricate line centroid diagnostics. In addition to this, measuring variation of the line centroid with time, i.e. as the illumination front passes through the cloud, one can also estimate the line-of-sight gradient of the velocity. This would allow getting an idea about the full 3D gradient in the line-of-sight component of the velocity field and possibly shedding more light on the primary driving mechanism.
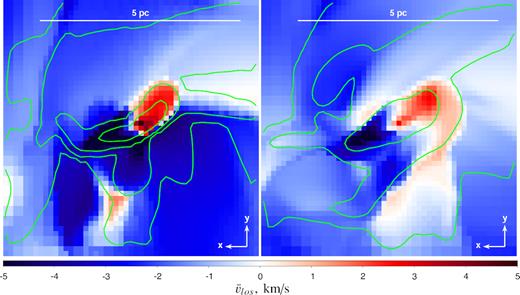
Line-of-sight velocity field (km s−1) for an X-ray illuminated central slice (left) and full projected (6pc)3 cubic cut-out (right) from the molecular cloud MC2 of the SILCC-Zoom simulation. The green contours correspond to the same levels of the average gas density as in the central and right-hand panels of Fig. 9. As the reflection front passes through the cloud, a number of such snapshots can be obtained allowing one to estimate also gradient of this velocity component along the line of sight.
Another complication in the line centroid measurement might arise due to partial ionization of iron in the probed molecular gas (this could be particularly relevant for clouds in the CMZ). For neutral iron, energies of the lines are known with high precision. For weakly ionized iron (Fe+–Fe+9), calculations of Palmeri et al. (2003) and Mendoza et al. (2004) suggest a very small change of the line centroid energy, consistent with the accuracy of their calculation of |$\text{$\sim$} 7\, {\rm eV}$| at 6.4 keV (see also earlier calculations of Kaastra & Mewe 1993, which predict a larger wavelength shift). However, this uncertainty translates into a velocity shift of ∼300 km s−1, implying that a higher level of accuracy will be needed to keep the possible impact of partial ionization under control.
A promising opportunity would be to use much higher spectral resolution accessible with radio observations of line emission from various molecular species by cross-correlating these data with the X-ray data collected over a time span comparable to the light-crossing time of the whole cloud. Clearly, this requires an extensive campaign of regular (separated by approximately duration of the flare) sufficiently deep X-ray observations to be performed over ∼10 yr. Given that the Galactic Center region harbours our Galaxy’s SMBH Sgr A* and a rich variety of point sources and thermal and non-thermal diffuse emission (e.g. Ponti et al. 2015; Koyama 2018), it is very likely to be extensively observed in the future as well, providing the necessary X-ray coverage for one of the illuminated clouds as a by-product.
Another possibility is related with establishing association between the brightest X-ray clumps and sources of maser emission, plenty of which are detected in the Galactic Center region (e.g. Cotton & Yusef-Zadeh 2016). Observations of masers can provide not only high precision line-of-sight velocity measurement, but also measurement of the proper motion in the plane of sky. In this synergy, X-ray density reconstruction would allow accurate location and environment characterization of the maser region, while the maser itself would allow inferring the 3D velocity vector. A systematic campaign of sensitive regularly spaced X-ray observations is again a key requirement for such kind of studies.
6 CONCLUSIONS
Taking advantage of the numerical simulations aimed at reproducing the inner structure of molecular clouds (both in the framework of ideal isothermal supersonic turbulence and in zoom-in extractions from global ISM simulations), we have demonstrated that reflected emission of a short X-ray flare is indeed a powerful tool for recovering the statistics of the gas density field. The dynamic range of scales accessible for this technique is indeed sufficient to judge on characteristics of the underlying generic physical processes, e.g. the type of turbulence forcing.
For nearly lognormal gas density PDFs with a typical value of the width σs ∼ 1–2, the statistical uncertainty in the measurement amounts to at least |$\text{$\sim$} 20{{\ \rm per\ cent}}$| with the currently available data if only Poisson noise is included. Taking into account systematic uncertainties connected with the necessity of filtering contaminating diffuse signals, solenoidally and compressively driven turbulence can be distinguished only at marginal significance. Data collected over a factor of ∼4 longer exposure time are needed in order to measure σs down to |$\text{$\sim$} 10{{\ \rm per\ cent}}$| accuracy and start conclusive probing of the PDF shape.
Future generation of X-ray observatories will not only benefit from a factor of ∼10 higher sensitivity, but also from excellent angular and spectral resolution allowing minimization of the systematic uncertainties due to contaminating signals. Even a modest exposure of ∼100 ks with these instruments will be sufficient to probe the dynamic range of scales spanning ∼1.5 orders of magnitude, i.e. from few pc down to 0.1 pc. Further increase of this range will be challenging due to the effects of opacity and, possibly, finite duration of the flare (for which only an upper limit can currently be set).
Reconstruction of the PDF shape across this range of scales in a uniform and unbiased manner will shed light on such key ingredients of the massive star formation paradigm as supersonic turbulence cascading and decay, transition to self-gravitating regions, seeding of star-forming cores, and their feedback on the surrounding medium. In this regard, molecular clouds in the CMZ are of particular importance given their extreme and highly dynamical environment as well as low star formation efficiency inferred for them from observations. Extension of the confidently reconstructed gas density PDF to lower densities should also allow probing the connection of molecular clouds to the surrounding ISM, potentially including diagnostics of thermal stability and atomic-to-molecular transition of the dense gas in the CMZ environment (see Section 4.2).
A natural step forward will be spectral mapping of the reflected emission, in particular measurement of the fluorescent line centroid with very high (sub eV) accuracy. Although being very challenging, this might be feasible for the brightest clumps of the reflected emission, allowing direct measurement of the velocity field and its variation in the line-of-sight direction. X-ray data collected through sensitive and regular observations spread over ∼10 yr should open a possibility for cross-correlation with velocity-resolved data on line emission from various molecular species and 3D velocity measurements provided by masers emission.
ACKNOWLEDGEMENTS
IK, EC, and RS acknowledge partial support by the Russian Science Foundation grant 19-12-00369. CF acknowledges funding provided by the Australian Research Council (Discovery Project DP170100603, and Future Fellowship FT180100495), and the Australia–Germany Joint Research Cooperation Scheme (UA-DAAD). DS and SW acknowledge support by the German Science Foundation via CRC 956, subprojects C5 and C6. SW further acknowledges support by the ERC Starting Grant RADFEEDBACK (grant no. 679852). We further acknowledge high-performance computing resources provided by the Leibniz Rechenzentrum and the Gauss Centre for Supercomputing (grants pr32lo and pr94du) and by the Australian National Computational Infrastructure (grant ek9).
Footnotes
Hereafter by ‘illumination front’ we mean the region contributing to the reflected emission as viewed by a distant observer, not the physical illumination front, which, of course, has a spherical shape centred on the primary source and propagates at the speed of light.
Available at http://starformat.obspm.fr/starformat/project/TURB_BOX.
This does not mean that the absolute value of mean density can be measured with such high accuracy due to a number of uncertainties inherent to the X-ray probing technique. Although being of no direct importance for the PDF shape reconstruction, such absolute measurement would be of great value by itself, especially taking into account very weak dependence of X-ray reflection on chemical and thermodynamical properties of the gas.
REFERENCES
APPENDIX A: IMPACT OF CONTAMINATING SOURCES OF X-RAY EMISSION
Thanks to shortness of the illuminating flare and rich internal structure of the molecular gas, the observed reflected X-ray emission is characterized by prominent spatial and temporal variations (Clavel et al. 2013; Churazov et al. 2017a). In combination with its very distinct spectral shape, this allows one to confidently single out the reflected emission from various contaminating signals (e.g. Churazov et al. 2017b).
The contaminating signals can be broadly divided into two groups: diffuse (including apparently diffuse emission of unresolved faint point sources) and point-like, viz. resolved foreground and background (both Galactic and extragalactic) point sources. While the former affects mostly the low-surface brightness end of the distribution function, the contribution of the latter might be an issue for the statistics in the high-surface brightness tail. Below we describe corresponding filtering techniques and the expected level of residual distortions inherent to data.
There is also inevitable contamination of the primary reflection signal by the secondary emission arising due to scattering of the primary emission in the same cloud. We discuss impact of this contamination and possibilities of its filtering (and even the usage for more intricate density diagnostics). Finally, we comment on the implications of the multiflare scenario, when emission from several illumination fronts might contribute to the reflection signal integrated over line of sight.
A1 Diffuse emission
In addition to well-localized regions of thermal and non-thermal genuinely diffuse X-ray emission (e.g. from shock-heated ISM due to young supernova remnants and, possibly, recent episodes of Sgr A* Myr-long activity; Muno et al. 2004; Heard & Warwick 2013b; Ponti et al. 2015; Hong et al. 2016; Koyama 2018; Ponti et al. 2019), bulk of apparently diffuse X-ray emission comes from the unresolved population of compact sources, mostly accreting white dwarfs (Muno et al. 2009; Revnivtsev et al. 2009).
This emission is not only spatially smooth and non-variable, but it is also characterized by a distinct spectral shape, 4–8 keV part of which is well approximated by emission model for hot optically thin plasma featuring prominent lines of highly ionized iron at 6.7 and 6.96 keV (see the blue line in Fig. A1). On average, the surface brightness of this component is comparable to the mean surface brightness of the reflected emission, so its contribution has to be taken into account for the major part of the observed region (excluding the brightest knots of the reflected emission where it can be safely neglected).
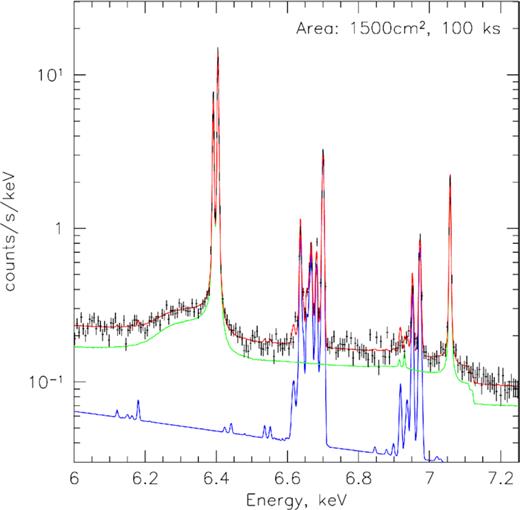
Simulation of the high-resolution 6–7.3 keV spectrum (black crosses) that will be obtained with future X-ray observatories having ∼1500 cm2 effective area and ∼3 eV energy resolution after a 100 ks-long observation of a typical bright clump of reflected emission. The green line shows the model of the reflected emission, the blue curve corresponds to the hot thermal plasma emission (schematically illustrating the contribution of unresolved compact sources), and the red line shows their sum.
In order to do that, we use the linear spectral decomposition method that relies on evaluating the ‘scalar product’ between the characteristic spectral templates of the emission components and the spectrum detected inside each individual pixel, and then solving for best-fitting weights for each component. Since the spectral templates for X-ray reflection and hot plasma emission are not fully ‘orthogonal’ (i.e. their ‘scalar product’ is non-zero), the resulting distribution is broader than that of the total flux combined, especially when the number of detected counts is small.
Our tests of this procedure performed on data simulated with spectral response functions of Chandra and XMM–Newton X-ray observatories show that ∼20 counts detected in the 4–8 keV energy band are needed for unbiased estimation of the component amplitudes (as illustrated in Fig. A2 for the case of even components mixture). Given that the equivalent width of the 6.4 keV line is ∼1 keV, this number simply guarantees that at least a few line counts get always detected.
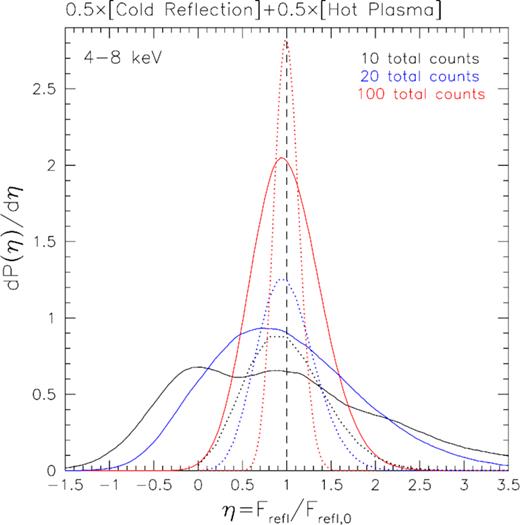
Simulated distribution of the ratio of the recovered reflected component amplitude Frefl to the actual amplitude Frefl, 0 (solid curves) after spectral decomposition technique applied on an even mixture of the X-reflection and hot (T∼6 keV) optically thin plasma emission in the 4–8 keV energy band (given the spectral response function of Chandra X-ray observatory). The black, blue, and red curves correspond to 10, 20, and 100 total detected counts in this band, respectively. The dotted curves demonstrate distributions that would result from purely Poisson noise in the reflection component.
In fact, the situation can be significantly improved by invoking additional information regarding expected amplitude for one of the components, e.g. based on its smooth (and even potentially predictable) spatial distribution.
Filtering of the diffuse contamination by the linear decomposition technique leads to a boost in statistical uncertainty of the flux estimation. Our tests show that this boost typically amounts to a factor of several compared to the pure Poisson uncertainty in one component (for an even component mixture and less than a few tens of total detected counts, as illustrated in Fig. A2). This should increase the impact of the Eddington bias on the PDF reconstruction above the purely Poissonian expectation (see Appendix B). The resulting distortion can be readily modelled given the actually measured amplitude of the contaminating signal in any particular region and kept under control.
Of course, usage of two fixed spectral templates introduces some systematic uncertainty as well, which should be controlled by keeping the level of model complexity adequate to the available quality of the data (in order to avoid overfitting and resulting bias in the results and dramatic underestimation of the uncertainties). Future generations of X-ray observatories, featuring high sensitivity and high spectral resolution at energies around 6 keV, will allow us to minimize the impact of these systematic biases thanks to the possibility of using narrower spectral bands, e.g. centred on the iron fluorescence line at 6.4 keV (see Fig. A1 for the illustration), to improve quality of the component separation.
A2 Point sources
Individual point sources that have spectral shape not too dissimilar from the spectral shape of X-ray reflection (like Galactic X-ray binaries or background active galactic nuclei) can potentially mimic the brightest knots of molecular gas. Contamination by bright persistent compact sources can be suppressed by identifying persistent sources based on data of archival observations of the same region. Indeed, a compact gaseous clump (smaller than the available data resolution) cannot be bright in the reflected emission longer than the duration of the flare, i.e. less than a few years (see a short discussion of the multiflare scenario below).
For few transient sources that happened to be bright only in a particular observation, one can use a ‘difference’ spectrum, by subtracting an archival spectrum from the same region. This approach removes all steady components and simplifies the classification of the variable emission based on the spectral shape. This approach has already been used to prove that the variable emission is indeed due to reflection (see Churazov et al. 2017b).
Finally, the expected number of background sources can be estimated based on the well-measured source count statistics in deep Galactic and extragalactic fields (e.g. Revnivtsev et al. 2009). This should provide a statistical handle on possible number of unaccounted pointed sources and allow one to constrain their impact on the high-density tail of the reconstructed density PDF.
A3 Second scatterings
Scattering of the reflected emission in the same gas gives rise to the secondary emission, which is, however, typically much fainter due to small Thomson scattering depth of the cloud τc ≪ 1. Indeed, for a compact gas clump entirely illuminated by the flare, the total reflected emission should be similar to the one shown in Fig. A3 with the flux in the secondary component approximately a factor τc smaller than the primary component. In particular, this is the case for the flux in the Compton ‘shoulder’ Fs compared to the flux in its parent narrow fluorescent line Fl (see Fig. A3).

Reflection spectrum from a slab of cold gas with the Thomson optical depth τT = 0.2 illuminated by a power-law X-ray continuum. The black line shows the total emission, and the blue line shows contribution of the doubly scattered component. The main spectral features (i.e. fluorescent lines with corresponding Compton ‘shoulders’ and absorption edges) are highlighted. The doubly scattered emission can be observed even after the primary photons have already left the cloud.
For a larger cloud, whose light-crossing time is longer than the duration of the flare, the strength of the secondary component should grow steadily with time as the flare front propagates across it. Fs reaches the maximum value of τc × Fl by the time when the front is about to leave the cloud. Once the front leaves the cloud, the ratio Fs/Fl jumps to a level of order unity – an unambiguous spectral signature of the secondary emission (Churazov et al. 1993; Sunyaev & Churazov 1998; Molaro et al. 2016). Now, the iron 6.4 keV line complex is composed of the newly generated fluorescent line photons as well as the scattered line and line shoulder photons generated prior to the second scattering (see Fig. A3). This process repeats with every next scattering and leads to a N-fold increase of the line complex equivalent width after N scatterings. However, despite the increase of the equivalent width, the intensity of the multiply scattered emission goes down, being proportional to |$\tau _\mathrm{ c}^N$| for small τc and strongly diminished by photoelectric absorption during every scattering cycle for larger τc.
The lifetime of the secondary component is set by the longest of two time-scales – the light-crossing time of the cloud and the light-crossing time of the scattering environment on larger scales. Therefore, the doubly scattered (or multiply scattered) emission probes the mean gas density of the entire region and, possibly, low-density extended envelopes of molecular clouds connecting them with the ambient ISM. In this case, the flux of the doubly scattered emission will be proportional to τcτe, where τe is the characteristic optical depth of the already illuminated extended region. Given the specific signatures of the second scattering, discussed above (see also fig. 9 in Sunyaev & Churazov 1998), it should be possible to distinguish the doubly scattered component from, e.g. the scattered emission from the gas having increased abundance of iron, especially with the anticipated high spectral resolution of future X-ray missions. Monitoring light curves of selected compact substructures and detecting variations of the 6.4 keV complex shape are therefore a very promising route towards characterization of the gas distribution in a much larger volume. Observations of the long-living secondary emission from the clouds that are bright at the moment or were bright in the recent past (e.g. the giant molecular complex Sgr B2) with future X-ray missions will be particularly valuable in this regard.
A4 Impact of multiple illuminating flares
Finally, we comment on implications of a possible scenario in which echoes of multiple flaring events are currently observed in X-ray reflection on the clouds in the CMZ (Clavel et al. 2013; Chuard et al. 2018; Terrier et al. 2018). In this scenario, the reflected X-ray emission from a thin slice of illuminated molecular gas might be contaminated by reflected emission of a different slice illuminated by another flare.
The observed strong variability of the brightest knots of X-ray emission and consistency of its statistical properties with statistical properties of the spatial variations (Churazov et al. 2017a) imply that there is likely no substantial projection overlap of multiple illuminated slices, at least for some of the illuminated clouds. If the illuminated slices actually belong to the same cloud, then this scenario is simply similar to a scenario with a single flare of longer duration, at least for the scales probing of which is not strongly affected by de-correlation due to spatial separation of the slices (very roughly all scales below the slice separation length).
APPENDIX B: EDDINGTON BIAS FOR POISSON LOGNORMAL DISTRIBUTION
The situation of lognormal parent distribution measured with superimposed Poisson noise takes place on many occasions in bio-statistical studies, so it has been well explored (e.g. Bulmer 1974). The possibility of using the saddle point approximation for evaluating the convolution integral has been proposed in that context by Izsák (2008). We outline the method and present the resulting concise analytic expression below.


