


This is an erratum for Eyres et al. (2018). In fig. 3(d) the direction of the offset axis was reversed. The corrected Fig. 1 included in this erratum corrects this. No other changes are necessary, and the direction of the position–velocity plot is not a factor in any of the conclusions of the paper.
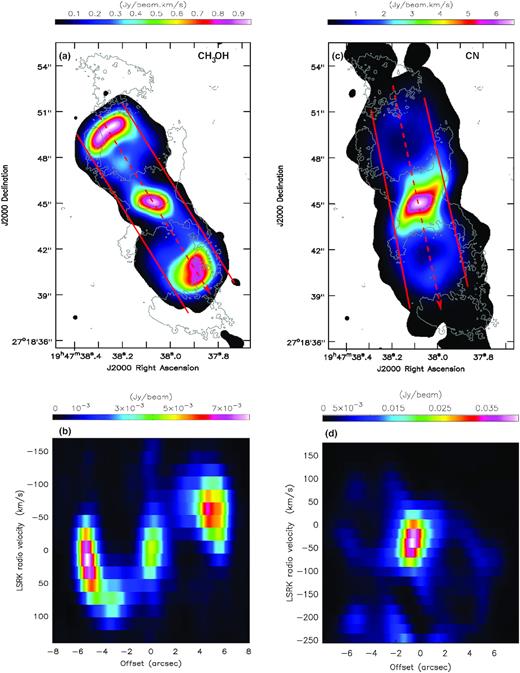
(a) Intensity map of CH3OH (colour scale, line 7 in table 1 in the original paper); contours of dust continuum at 0.12 and 0.48 mJy beam−1 for reference; (b) position–velocity plot along the dashed–line with arrow in (a); (c) intensity map of CN (colour scale, line 5 in table 1 in the original paper), contours as (a); (d) position–velocity plot along the dashed–line with arrow in (b) from north to south. For the intensity maps in (a) and (c) the spatial resolution is represented by the small black circle to the bottom left in each image, where both the spectral line and continuum resolutions are over–plotted, but are indistinguishable at this scale.
