


ABSTRACT
Characterizing the long-term variability of active galactic nuclei (AGNs) is a key legacy of the Rossi X-ray Timing Explorer (RXTE). We carry out a spectral analysis on a sample of 20 Seyfert 1 galaxies, which had been observed by the RXTE for at least 100 times. All 18 335 spectra are fitted in a uniform way using a power-law component plus an additional Gaussian line when necessary. For any source in our sample, we confirm that the spectrum softens or the photon index, Γ, increases with increasing the 2–10 keV luminosity, LX. However, different source holds distinct Γ–LX/LEdd relation, rather than a common one. We also fit the correlation with a function of Γ = C + β × log (flux), where C is a constant and parameter β is the slope of the correlation. In this way, the increase speed of the Γ–LX/LEdd relation can be depicted with the parameter β. Since our sample contains a large sample of long-term monitored sources, it allows us to explore the second-order effect of spectral evolution. We find that there is an anticorrelation between β and the X-ray Eddington ratio, LX/LEdd. That is, the increasing tendency of Γ with increasing X-ray luminosity becomes slower when the source has a larger X-ray Eddington ratio. Our results may indicate changes in the geometry and/or the viscosity parameter of the accretion disc at different Eddington ratios.
1 INTRODUCTION
In this work, we focus on the X-ray emission of radio-quite active galactic nuclei (AGNs), in particular, Seyfert 1 galaxies. At energies above 2 keV, the primary X-ray continuum is dominated by the inverse Compton scattering from the hot corona close to the central supermassive black hole, complemented with a reflection component from the accretion disc illuminated by the primary X-ray continuum. Thanks to the remarkable characteristic of X-ray variability, we can achieve a wealth of information about the geometry of the accretion flow and physical processes inside by investigating the X-ray variable properties of AGNs.
The main portion of X-ray spectrum can be described as a cut-off power-law profile, parametrized with a cut-off energy and a photon index (Γ). The cut-off energy is determined by the electron temperature, while the photon index is the result of the competition between seed photons from the accretion disc and hot plasma in the corona. Thus, the evolution of photon index (Γ) traces the spectral state, and is essential to constrain different accretion models. The correlation between Γ and the (X-ray) Eddington ratio in AGNs has been extensively studied (e.g. Shemmer et al. 2008; Gu & Cao 2009; Younes et al. 2011; Brightman et al. 2013; Kawamuro et al. 2016; Liu et al. 2016a; Trakhtenbrot et al. 2017; She et al. 2018). An anticorrelation between Γ and the Eddington ratio was reported in low-luminosity AGNs (e.g. Gu & Cao 2009; Younes et al. 2011; Qiao et al. 2013; Kawamuro et al. 2016). Meanwhile, a positive relationship was revealed in the sources with large Eddington ratios (Lbol/LEdd > 0.01; e.g. Shemmer et al. 2008; Brightman et al. 2013), and it was interpreted as that more seed photons are scattered in the corona with increasing the accretion rate. It is worth to note that most of these works used a single observation for each source and indirectly constructed the framework of the accretion state evolution by a sample of sources.
Investigating the multiple observations of an individual source would provide more direct information on the spectral evolution. By analysing 24 bright AGNs observed by Swift, Connolly et al. (2016) refound the negative and positive correlations at the low and high Eddington ratio branches, respectively. However, none of the individual source followed this global relation (cf. their fig. 8). When observations are dense, we could see that the photon index increases with the X-ray flux and tends to saturate at constant at the high flux level in some sources (e.g. NGC 4051 and NGC 7469; Sobolewska & Papadakis 2009; Seifina, Chekhtman & Titarchuk 2018a; Seifina, Titarchuk & Ugolkova 2018b). That is, the growth of Γ decelerates at high X-ray luminosity. More interesting, Sarma et al. (2015) carried out a flux-resolved spectral analysis on Mrk 335 and Ark 564, confirmed the positive relation between Γ and the Eddington ratio, but found that different sources (or even for Mrk 335 alone) could draw different tracks in the Γ–LX/LEdd diagram. All these results indicate that the geometry of accretion disc or corona might change with luminosity (see also Titarchuk & Zannias 1998; Laurent & Titarchuk 1999), and there was no universal relationship between Γ and luminosity for different AGNs.
The Rossi X-ray Timing Explorer (RXTE) consists of three instruments, i.e. the Proportional Counter Array (PCA), the High Energy X-ray Timing Experiment (HEXTE), and the All-Sky Monitor. Thanks to the scheduling flexibility of RXTE, dozens of bright AGNs were continuously monitored by RXTE for several years. These data allow us to investigate the long-term behaviour of AGNs in detail (e.g. Markowitz & Edelson 2004; Sobolewska & Papadakis 2009; Rivers, Markowitz & Rothschild 2013). Note that such works cannot be accomplished with any other X-ray telescopes, e.g. the Chandra, XMM–Newton, and NuSTAR, despite their superior energy resolutions and high sensitivities. Before our paper, the Γ–LX/LEdd correlation was studied by using either multiple observations of individual sources, or a sample of AGNs with sparse data points for each source. Here, we collect a large sample of sources that had been long-term monitored by RXTE, revisit the Γ–LX/LEdd relation, and explore the second-order effect of spectral evolution. We describe the sample and data analysis in Section 2. Results are presented in Section 3. Discussion and Conclusion follow in Sections 4 and 5, respectively.
2 SAMPLE AND DATA ANALYSIS
2.1 Sample extraction
The production of X-rays in flat-spectrum radio quasars and blazars is mainly associated with jets rather than corona, then we do not consider these two types of sources in our work. Seyfert 2 galaxies are also excluded because their X-ray radiations are heavily absorbed, resulting in low fluxes and large uncertainties in spectral fitting. Here, we collect Seyfert 1 galaxies that were observed with RXTE for at least 100 times, but exclude the radio-loud/intermediate Seyfert 1 galaxies (i.e. 3C 111, 3C 120, 3C 390.3, and NGC 7213), because their X-ray emissions are partially from jets. The X-ray spectrum of NGC 4151 is affected by the complex and variable absorption, and cannot be fitted with a simple model (e.g. Beuchert et al. 2017; Miller et al. 2018). Therefore, we do not take this source into account. The final sample contains 13 typical broad-line Seyfert 1 (BLS1) galaxies and seven narrow-line Seyfert 1 (NLS1) galaxies (Table 1). Compared to Sobolewska & Papadakis (2009), not only the source number is doubled, the number of observations for some objects (e.g. NGC 4051 and NGC 5548) is also significantly increased.


We fit all the X-ray spectra by the power-law model (see text for more details). For each source, an example of best-fitting spectrum and the residual are plotted, and the fitted parameter values are listed in Table A1.


The 2–10 keV light curves of 20 Seyfert 1 galaxies.


The evolution of photon index derived from the power-law model fitting versus time.
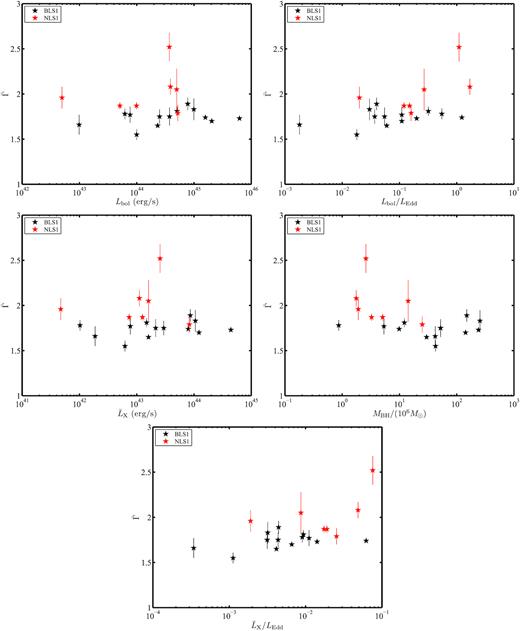
The mean photon indices |$\bar{\Gamma }$| versus other parameters. Broad-line Seyfert 1’s and narrow-line Seyfert 1’s are marked with the black and red points, respectively.


The photon index, Γ, as a function of the 2–10 keV flux for the 20 RXTE Seyfert 1 galaxies. The blue solid lines correspond to the power-law fitting.
Target list. BLS1 – broad-line Seyfert 1, NLS1 – narrow-line Seyfert 1; redshift (z) and luminosity distance (D) are taken from the NED data base. MBH: black hole mass in units of 106 M⊙. N: number of RXTE/PCA observations. Expo.: total exposure time in units of Ms. Lbol: bolometric luminosity. Ref.: references used for MBH and Lbol/LEdd. The Eddington luminosity is defined as LEdd = 1.3 × 1038 MBH/M⊙ erg s−1. P04: Peterson et al. (2004); R13: Ricci et al. (2013); and W02: Woo & Urry (2002).
| Source | Type | z | D (Mpc) | MBH | Lbol/LEdd | N | Expo. | Ref. |
|---|---|---|---|---|---|---|---|---|
| Ark 120 | BLS1 | 0.03271 | 138 | 150 | 0.04 | 204 | 0.3 | P04, W02 |
| Fairall 9 | BLS1 | 0.04702 | 198 | 255 | 0.03 | 716 | 0.8 | P04, R13 |
| NGC 3783 | BLS1 | 0.00973 | 44.7 | 29.8 | 0.06 | 1726 | 1.6 | P04, R13 |
| NGC 4593 | BLS1 | 0.0090 | 42.0 | 5.36 | 0.11 | 1336 | 1.4 | P04, R13 |
| IC 4329A | BLS1 | 0.01605 | 70.5 | 9.90 | 1.23 | 596 | 0.6 | P04, R13 |
| Mrk 79 | BLS1 | 0.02219 | 94.3 | 52.4 | 0.055 | 1639 | 0.5 | P04, W02 |
| Mrk 509 | BLS1 | 0.0344 | 141 | 143 | 0.11 | 365 | 0.8 | P04, R13 |
| NGC 7469 | BLS1 | 0.01632 | 62.7 | 12.2 | 0.32 | 820 | 1.1 | P04, R13 |
| MR 2251−178 | BLS1 | 0.06398 | 271 | 240 | 0.20 | 639 | 0.6 | Dunn et al. (2008), Nardini et al. (2014) |
| NGC 3227 | BLS1 | 0.00386 | 20.4 | 42.2 | 0.0018 | 1049 | 1.1 | P04, R13 |
| NGC 3516 | BLS1 | 0.00884 | 37.5 | 42.7 | 0.018 | 638 | 1.1 | P04, R13 |
| NGC 5548 | BLS1 | 0.01717 | 74.5 | 52.2 | 0.037 | 1049 | 1.1 | Bentz & Katz (2015), R13 |
| NGC 7314 | BLS1 | 0.00476 | 15.4 | 0.87 | 0.55 | 137 | 0.2 | Elvis et al. (1994), Gu et al. (2006) |
| Ark 564 | NLS1 | 0.02468 | 98.5 | 2.6 | 1.1 | 598 | 0.6 | Botte et al. (2004), Romano et al. (2004) |
| MCG-6-30-15 | NLS1 | 0.00775 | 35.8 | 3.26 | 0.12 | 1730 | 2.2 | Hu et al. (2016) |
| Mrk 110 | NLS1 | 0.03529 | 151 | 25.1 | 0.16 | 1437 | 1.4 | P04, W02 |
| Mrk 335 | NLS1 | 0.02578 | 103 | 14.2 | 0.27 | 158 | 0.2 | P04, W02 |
| Mrk 766 | NLS1 | 0.01293 | 57.6 | 1.76 | 1.7 | 772 | 0.8 | Bentz et al. (2009), R13 |
| NGC 4051 | NLS1 | 0.00234 | 12.7 | 1.91 | 0.02 | 2077 | 2.3 | P04, R13 |
| NGC 5506 | NLS1 | 0.00618 | 29.1 | 5.1 | 0.15 | 649 | 0.6 | Nikołajuk, Czerny & Gurynowicz (2009), R13 |
Since the HEXTE has a small collecting area and a low sensitivity, it cannot obtain sufficient detection during a short individual observation, but only provides the averaged spectra for bright AGNs (Rivers et al. 2013). Thus, we do not consider the HEXTE data in our paper. All RXTE/PCA data are reduced with heasoft version 6.25. We filter the Standard 2 mode data from the PCU2 with the standard criteria and create the background files by using the latest faint background model. The recommended systematic error of 0.5 per cent is added to the spectra, which are fitted in 3–20 keV with xspec (Arnaud 1996). Since the PCA data have lack of sensitivity below 3 keV and most of sources (except NGC 5506) have low absorption, no interstellar absorption is included in the fitting models. For NGC 5506, the equivalent hydrogen column density is fixed to 3.7 × 1022 cm−2 (Perola et al. 2002).
2.2 Spectral analysis
Because the RXTE/PCA data have a low spectral resolution, short exposure for an individual observation (∼103–104 s), and low signal-to-noise ratio, they cannot put tight constraints on parameters in more complicated models. Additionally, the power-law model is widely used to fit the spectra of AGNs in literature, it is convenient to communicate with other works by adopting the same model. We begin by fitting a single power-law model to all individual spectra, and estimate the global goodness in the statistical way as described in Sobolewska & Papadakis (2009) for each source. The single power-law component cannot provide acceptable fits to the spectra of IC 4329A, MCG-6-30-15, NGC 3516, NGC 3783, and NGC 5506, with large residuals shown around 6–7 keV. In these cases, we add a Gaussian emission component with the width fixed to 0.1 keV to account for the iron line feature. We caution that the spectral resolution of RXTE/PCA data is not good enough to resolve the reflection and the non-thermal components accurately. We discuss the influence of the reflection component in Section 4. It could be due to the improvement of the background file and the PCA calibration with pcarmf (v11.7),1 the spectra are adequately described by the simpler models. Nevertheless, the obtained parameters of the power-law component are similar to those reported by Sobolewska & Papadakis (2009).
To demonstrate the quality of the fit, Fig. A1 shows the best-fitting spectrum and the residual for an epoch of each source with a long exposure and a flux around the mean one. The 2–10 keV fluxes are measured using the convolution model cflux, and the X-ray luminosities, LX, are calculated with the luminosity distances tabulated in Table 1. In order to achieve reliable results, the data with the flux less than 5 × 10⁻¹² erg cm−2 s−1 or the relative error of Γ larger than 0.5 are discarded in the following analysis. In this way, no more than 3 per cent of data are excluded for each source except Mrk 335 (|${\sim} 19{{\ \rm per\ cent}}$|). The light curves and the evolution of photon indices for our sample are shown in Figs A2 and A3, respectively. Note that the Comptonization process that thermal X-rays from the accretion disc illuminate the energetic plasma predicts a positive spectral index. In contrast, negative spectral indices may indicate synchrotron radiation, which characterizes jet radiation distant from the nucleus. Here, we find that only less than 0.2 per cent of total spectra (33 in 18 335, from NGC 3227, Mrk 79, NGC 3516, NGC 4051, Fig. A3) have negative spectral indices (or Γ < 1). That is, the jet contribution can be neglected for all the sources in our sample.
It is worth to note that sophisticated Comptonization (e.g. nthcomp and comptt in xspec; Titarchuk 1994; Titarchuk, Mastichiadis & Kylafis 1997; Życki, Done & Smith 1999) and reflection models (e.g. relxill in xspec; García et al. 2014) have been developed and employed to fit the high-quality, broad-band spectra of AGNs collected by Suzaku, XMM–Newton, Chandra, NuSTAR, etc. Generally, the Comptonized model predicts that the middle part of the spectrum (1 < E < 50 keV) can be mimicked by a power law, while there are cut-offs both at the low energy due to the energy of seed photon (≪1 keV for AGNs) and at the high energy because of the energy of plasma (∼100 keV). The power-law model cannot provide objective fitting to the broad-band spectrum of AGNs. But the RXTE/PCA spectra only cover the middle part of the Comptonized spectrum (3–20 keV); therefore, the power-law model and the physical Comptonization models can provide equally fits.
For instance, we replace the power-law model by the bulk motion Comptonization (BMC) model (Titarchuk et al. 1997) in which the normalization (NormBMC) is proportion to the mass accretion rate. Since the RXTE/PCA spectra are truncated at 3 keV, we fix the temperature of thermal photon to a typical value ∼0.1 keV (e.g. NGC 4051, NGC 7469; Seifina et al. 2018a,b), which does not affect the spectral fitting. The fitting results are summarized as follows. (i) The derived photon indices (ΓBMC) are almost the same as those yielded by the power-law fitting (Fig. B1). (ii) Meanwhile, the BMC normalization increases linearly with the X-ray flux (Fig. B2). But due to the low single-to-noise ratio, the RXTE/PCA spectra cannot put meaningful constraints on the Comptonized parameter and the NormBMC, and the huge error bars can be seen in Figs B2 and B3. (iii) The positive relations between ΓBMC and NormBMC (sometimes with a hint of saturation) are refound for all sources (Fig. B3). In sum, fitting the RXTE/PCA spectra with the BMC model does not provide additional information on the Comptonization process. As shown in Figs 1 and 2, we obtain consistent results with the power-law model and the BMC model. Alternatively, Qiao & Liu (2018) calculated the spectral energy distribution (SED) of AGNs in the framework of corona condensation, and fit the middle part of SED (2–10 keV) with the power-law model. In this way, the model can be checked with the observational data, e.g. the RXTE data shown in our paper.
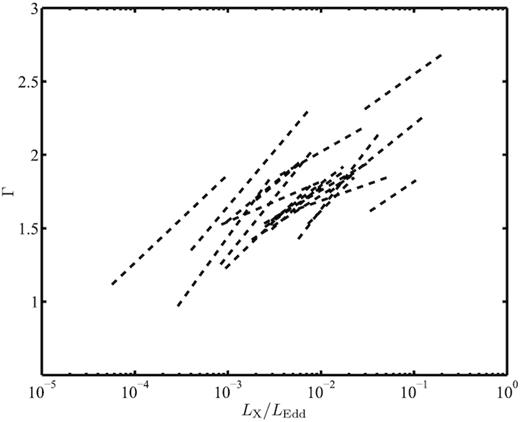
Positive correlations between Γ and LX/LEdd fitted by a power-law function for all Seyfert 1 galaxies. Only the fitting results are shown here while the original data are presented in Appendix A (Fig. A5).
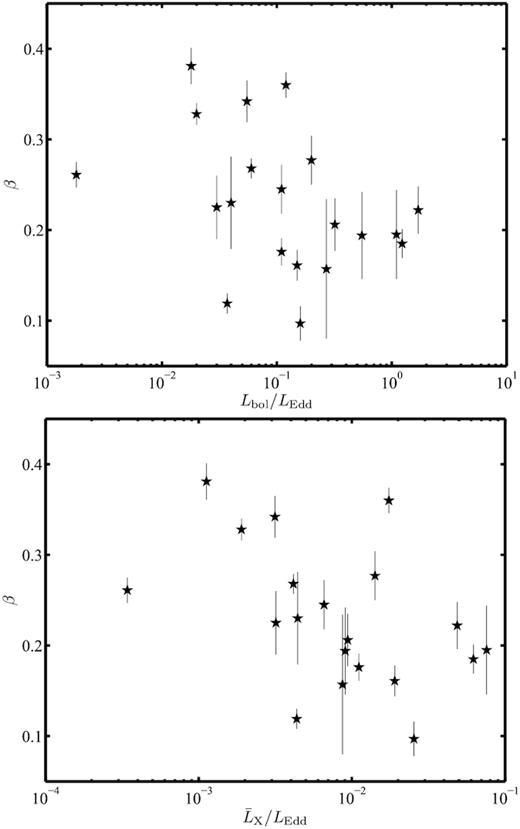
The slope of the correlation β decreases with increasing the (X-ray) Eddington ratio.
3 RESULTS
The large data base collected by the RXTE is suitable for us to explore the long-term variability of AGNs. Here, we analyse 18 335 observations for a sample of 20 Seyfert 1 galaxies to investigate the long-term evolution of the spectral index, in particular, the growth of Γ versus the X-ray Eddington ratio. We calculate the weighted mean values of the photon index (|$\bar{\Gamma }$|) and the X-ray luminosity (|$\bar{L}_{\rm X}$|), but do not find any significant correlation among the mean photon index, the mean luminosity, the (X-ray) Eddington ratio, and the black hole mass (Fig. A4). The mean value of Γ clusters around 1.6–1.8 for the typical BLS1 galaxies, and the NLS1 galaxies generally have softer spectra and higher Eddington ratios (Fig. A4). These results are consistent with those reported in literature (e.g. Rivers et al. 2013).
As shown in Fig. A5, all sources show a positive correlation between Γ and the 2–10 keV flux. Employing the Spearman’s rank correlation, we estimate that the probability of obtaining the correlation from a random data set is less than 10−8 for all sources except Mrk 335 (∼0.008). We then fit the correlation with the power-law function: Γ = C + β × log (flux), where C is a constant and parameter β is the slope of the correlation. The fitting results for all sources are plotted together in Fig. 1, where the X-ray fluxes have been transformed to the corresponding X-ray luminosities normalized by the Eddington luminosities.
In Fig. 2, we further find that the slope of the correlation is evidently anticorrelated with the Eddington ratio, in particular, the X-ray Eddington ratio. We derive a Spearman’s rank correlation coefficient of ρ = −0.511, and the associated probability value of P = 0.022. That is, the Γ increases slower with the X-ray luminosity when the source has a larger (X-ray) Eddington ratio.
Before our work, Titarchuk’s group analysed the spectral evolution of some individual sources (including different types of objects), which displayed a flux variation by less than 1–2 orders of magnitude. They argued that the photon index increased with the X-ray flux and saturated at constant at high luminosity (e.g. Shaposhnikov & Titarchuk 2009; Seifina & Titarchuk 2010; Titarchuk & Seifina 2017; Seifina et al. 2018b). These results indicated that the speed of Γ with increasing X-ray luminosity became slower at high luminosity. Here, we investigate a large sample of AGNs and obtain some different results. (1) A few sources exhibit a hint of saturation at high flux levels, but about half of the sources do not show a clear evidence of saturation in our data (e.g. Ark 120, Mrk 110, Figs A5 and B3). (2) Different sources follow different tracks (i.e. different slopes of the correlation) in the Γ–LX/LEdd diagram rather than a common relation (i.e. a single slope of the correlation). (3) Using the sample of AGNs instead of individual source, we can explore the spectral evolution in a much larger X-ray Eddington ratio range (∼4 orders of magnitude, Fig. 1). (4) We introduce the slope of the correlation β to parametrize the increase speed of Γ as a function of flux, and find for an anticorrelation between β and the X-ray Eddington ratio. Globally, the increasing tendency of Γ with increasing X-ray luminosity becomes slower, but there is no saturation effect observed even when the X-ray Eddington ratio increases by four orders of magnitude (Fig. 1).
4 DISCUSSION
It is well known that the observed Γ is governed by the absorption, the reflection effects, and the Comptonization process itself. The X-ray flux can change significantly within a time-scale as short as ∼103–104 s; however, neither the column density nor the covering factor is expected to vary so fast. On the other hand, the variation of X-ray flux can affect the ionization state and the opacity of absorber, resulting in variable absorption. In this way, the observed Γ increases with increasing the X-ray flux, but the derived relation is much shallower than the data of most sources (Sobolewska & Papadakis 2009). Moreover, such absorption effect should be prominent at high luminosity, that is in conflict with the anticorrelation between β and the X-ray Eddington ratio shown in Fig. 2.
The reflection component could offer a significant fraction of X-ray emissions, and tend to flatten the spectrum below 10 keV, reducing the observed Γ. However, the reflection is unimportant in the power-law fitting with the RXTE/PCA data due to their low energy resolution. Investigating the RXTE data of 10 AGNs (all in our sample), Sobolewska & Papadakis (2009) argued that a constant reflection component plus a power-law component, which is variable in flux but constant in profile, failed to account for the spectral evolution. It is unclear whether the spectral softening behaviour can be interpreted as the decreasing of the relative contribution of the reflection component with increasing the X-ray flux. Recently, observations with XMM–Newton and NuSTAR have been made on several objects in our sample (e.g. MCG-6-30-15 and Ark 120; Parker et al. 2014; Porquet et al. 2018), and these data have sufficient statistics and spectral resolution to separate out the intrinsic power-law and reflection components. A quantitative estimation on the influence of the reflection effect at different flux levels could be accomplished with next generation of X-ray missions in the future (e.g. ATHENA and eXTP; Barret et al. 2016; Zhang et al. 2016). Nevertheless, the variation of the reflection component would indicate a change in the accretion disc/corona geometry. It is likely that the variation of Γ derived from the spectral fitting corresponds to the variation of the intrinsic spectral index.
It is commonly suggested that the hard X-ray emissions of AGNs are generated by the inverse Compton scattering of the soft photons from the accretion disc in the hot corona (e.g. Haardt & Maraschi 1991, 1993; Svensson & Zdziarski 1994; Stern et al. 1995; Malzac, Beloborodov & Poutanen 2001; Liu, Mineshige & Shibata 2002; Liu, Mineshige & Ohsuga 2003). The intrinsic spectral index of the X-ray spectrum is determined by the Compton amplification factor A, which is generally defined as A = Lcor/Ldisc + 1, where Lcor and Ldisc are the luminosity dissipated in the corona and the luminosity of the soft photons from the accretion disc, respectively. In such a disc–corona model, the relative strength of the disc and the corona is determined by the mass accretion rate. For a relatively lower mass accretion rate, the Compton amplification factor A is relatively larger, which can produce a relatively harder X-ray spectrum. For a relatively higher mass accretion rate, a fraction of the coronal matter will collapse on to the accretion disc due to the strong Compton cooling, which results in a smaller Compton amplification factor A, consequently predicting a relatively softer X-ray spectrum (e.g. Liu, Qiao & Liu 2016b). Specifically, the disc–corona model can roughly reproduce the positive correlation between Γ and LX/LEdd in AGNs by changing the mass accretion rate (e.g. Liu et al. 2016b; Qiao & Liu 2018).
In Fig. 1, the different tracks (i.e. different slopes of the correlation) in the Γ–LX/LEdd diagram indicate that the spectral state is not solely determined by the accretion rate. Recently, Qiao & Liu (2018) explained the positive Γ–Lbol/LEdd correlation in luminous AGNs within the framework of the corona condensation, which can explain both the anticorrelation between Γ and Lbol/LEdd at Lbol/LEdd < 0.01 and the positive correlation between Γ and Lbol/LEdd at Lbol/LEdd > 0.01 in black hole X-ray binaries (Qiao & Liu 2013). Meanwhile, they found that theoretically the slope of the Γ–Lbol/LEdd correlation is related to the viscosity parameter α. Specifically, a smaller/larger α predicts a steeper/flatter Γ–Lbol/LEdd correlation (cf. fig. 5 in Qiao & Liu 2018). The finding in this paper, i.e. the anticorrelation between β for the slope of the Γ–Lbol/LEdd correlation and the Eddington radio (cf. Fig. 2), may suggest that the viscosity parameter α for sources with higher Eddington ratios is relatively larger. Currently, the theoretical relation between the viscosity and the Eddington ratio is unclear and needs to be clarified by future numerical simulations.
On the other hand, a similar Γ–LX/LEdd evolution pattern had been revealed in different types of objects, e.g. BL Lacertae (Titarchuk & Seifina 2017), tidal disruption events (Seifina, Titarchuk & Virgilli 2017), and X-ray binaries (Seifina & Titarchuk 2010; Seifina, Titarchuk & Shaposhnikov 2014). Assuming that the non-thermal component results from the bulk motion Comptonization, they argued that the saturation effect of photon index was a signature of the presence of a converging flow surrounding black hole (e.g. Vignarca et al. 2003; Kalemci et al. 2006; Shaposhnikov & Titarchuk 2009), and can be further implemented to estimate the black hole mass (e.g. Seifina et al. 2017; Titarchuk & Seifina 2017; Jang et al. 2018). The tight correlation between the low-frequency quasi-periodic oscillation and the photon index revealed in the X-ray binaries would also support the restructuring of geometry of the disc/corona during state transitions (e.g. Shaposhnikov & Titarchuk 2006, 2007). However, the fast variabilities displayed in the dense RXTE observations of AGNs may pose a challenge against the models where the spectral evolution is driven by the variation of accretion rate, if the X-ray flux is representative of the accretion rate and varies at the viscous time-scale.
5 CONCLUSION
Thanks to the large data base collected by RXTE, we can explore the second-order effect of spectral evolution of AGNs. In this paper, we perform the spectral analysis on a sample of long-term monitored Seyfert 1 galaxies. For all 20 sources, the photon index Γ increases with the X-ray flux, and exhibits a hint of saturation at high flux in some sources. This behaviour is commonly interpreted as the Compton amplification A becomes smaller at higher accretion rate. However, different sources follow distinct tracks in Γ–LX/LEdd diagram rather than a common relation. Using the parameter β to depict the growth of Γ, we find an anticorrelation between β and the X-ray Eddington ratio in AGNs. These results may indicate changes in the geometry and/or the viscosity parameter of the accretion disc during state evolutions.
ACKNOWLEDGEMENTS
This work is supported by the National Natural Science Foundation of China (under grants 11673013, 11703014, 11873045, 11773037, 11703093, and 11573023), the Gravitational Wave Pilot B (grant no.XDB23040100), the Strategic Pioneer Program on Space Science, Chinese Academy of Sciences (grant no. XDA15052100), and the Natural Science Foundation from Jiangsu Province of China (grant no. BK20171028).
Footnotes
REFERENCES
APPENDIX A: RXTE SPECTRAL DATA BASE
Best-fitting spectral parameters. For each source, we apply the power-law model to fit an example spectrum with a long exposure and a flux around the mean 1. Flux2–10 keV: 2–10 keV flux in units of 10−11 erg cm−2 s−1.
| Source | ObsID | MJD | Γ | Flux2–10 keV | χ2/dof |
|---|---|---|---|---|---|
| Ark 120 | 30232-01-96-00 | 51248 | |$1.73^{+0.17}_{-0.17}$| | |$3.33^{+0.26}_{-0.26}$| | 19.1/43 |
| Fairall 9 | 20313-01-80-00 | 50690 | |$1.84^{+0.18}_{-0.19}$| | |$2.15^{+0.19}_{-0.19}$| | 19.0/43 |
| NGC 3783 | 40152-04-91-00 | 51564 | |$1.68^{+0.08}_{-0.08}$| | |$7.08^{+0.30}_{-0.30}$| | 14.8/35 |
| NGC 4593 | 91140-04-05-00 | 53703 | |$1.79^{+0.14}_{-0.13}$| | |$3.75^{+0.24}_{-0.24}$| | 17.2/38 |
| IC 4329A | 70148-01-01-15 | 52872 | |$1.76^{+0.03}_{-0.03}$| | |$13.36^{+0.22}_{-0.22}$| | 22.7/36 |
| Mrk 79 | 96127-02-78-00 | 55715 | |$1.71^{+0.21}_{-0.20}$| | |$2.06^{+0.20}_{-0.21}$| | 16.4/38 |
| Mrk 509 | 80157-01-11-10 | 53653 | |$1.72^{+0.08}_{-0.07}$| | |$5.11^{+0.19}_{-0.19}$| | 15.6/38 |
| NGC 7469 | 10315-01-55-30 | 50273 | |$1.84^{+0.10}_{-0.10}$| | |$3.12^{+0.14}_{-0.14}$| | 18.0/43 |
| MR 2251−178 | 92114-01-43-00 | 54003 | |$1.75^{+0.107}_{-0.10}$| | |$5.29^{+0.27}_{-0.27}$| | 17.8/38 |
| NGC 3227 | 50153-07-43-00 | 51647 | |$1.65^{+0.12}_{-0.12}$| | |$3.82^{+0.22}_{-0.22}$| | 18.3/37 |
| NGC 3516 | 40223-01-76-00 | 51499 | |$1.63^{+0.12}_{-0.12}$| | |$3.73^{+0.24}_{-0.24}$| | 16.1/35 |
| NGC 5548 | 96390-03-04-00 | 55573 | |$1.69^{+0.12}_{-0.11}$| | |$4.39^{+0.25}_{-0.25}$| | 13.8/38 |
| NGC 7314 | 40151-02-61-00 | 51741 | |$1.80^{+0.15}_{-0.15}$| | |$3.64^{+0.26}_{-0.26}$| | 17.3/37 |
| Ark 564 | 10291-02-01-01 | 50440 | |$2.51^{+0.09}_{-0.09}$| | |$2.41^{+0.09}_{-0.09}$| | 26.4/43 |
| MCG-6-30-15 | 40155-01-01-06 | 51380 | |$1.76^{+0.09}_{-0.09}$| | |$5.08^{+0.24}_{-0.24}$| | 15.9/35 |
| Mrk 110 | 96127-10-05-10 | 55765 | |$1.81^{+0.16}_{-0.15}$| | |$3.18^{+0.24}_{-0.23}$| | 17.0/38 |
| Mrk 335 | 95382-01-10-00 | 55215 | |$1.97^{+0.51}_{-0.45}$| | |$0.98^{+0.21}_{-0.20}$| | 18.7/38 |
| Mrk 766 | 92108-02-07-00 | 53824 | |$2.02^{+0.20}_{-0.19}$| | |$2.90^{+0.26}_{-0.25}$| | 18.5/38 |
| NGC 4051 | 70141-01-01-02 | 52539 | |$1.90^{+0.10}_{-0.10}$| | |$2.57^{+0.11}_{-0.11}$| | 17.0/37 |
| NGC 5506 | 60133-02-85-00 | 52138 | |$1.85^{+0.06}_{-0.06}$| | |$12.73^{+0.48}_{-0.48}$| | 14.7/35 |
APPENDIX B: FITTING SPECTRA WITH THE BMC MODEL


The photon indices yielded by the spectral fittings with the BMC model (ΓBMC) and the power-law model (Γ) are almost the same.


The BMC normalization (NormBMC) versus the X-ray flux.


Photon indices ΓBMC derived from the BMC model fitting increase with the normalization.
