


ABSTRACT
We perform analysis of the 3D kinematics of Milky Way disc stars in mono-age populations. We focus on stars between Galactocentric distances of R = 6 and 14 kpc, selected from the combined LAMOST Data Release 4 (DR4) red clump giant stars and Gaia DR2 proper motion catalogue. We confirm the 3D asymmetrical motions of recent works and provide time tagging of the Galactic outer disc asymmetrical motions near the anticentre direction out to Galactocentric distances of 14 kpc. Radial Galactocentric motions reach values up to 10 km s−1, depending on the age of the population, and present a north–south asymmetry in the region corresponding to density and velocity substructures that were sensitive to the perturbations in the early 6 Gyr. After that time, the disc stars in this asymmetrical structure have become kinematically hotter, and are thus not sensitive to perturbations, and we find the structure is a relatively younger population. With quantitative analysis, we find stars both above and below the plane at R ≳ 9 kpc that exhibit bending mode motions of which the sensitive duration is around 8 Gyr. We speculate that the in-plane asymmetries might not be mainly caused by a fast rotating bar, intrinsically elliptical outer disc, secular expansion of the disc, or streams. Spiral arm dynamics, out-of-equilibrium models, minor mergers or others are important contributors. Vertical motions might be dominated by bending and breathing modes induced by complicated inner or external perturbers. It is likely that many of these mechanisms are coupled together.
1 INTRODUCTION
With modern large-scale Galactic surveys, Galactoseismology is starting to become reality, in which we can unravel the chemodynamical history of the disc, and in turn infer its history of accretion and the characteristics of the satellite galaxies (e.g. Antoja et al. 2018). Antoja et al. (2018) discovered the Milky Way is full of substructures such as arches, boxy shapes, spirals, snail shells, and ridges, and suggested that these substructures are from phase mixing. Many follow-up studies of disc structure(s) have appeared recently (Tian et al. 2018; Wang et al. 2019c; Li et al. 2019). For example, Tian et al. (2018) used stars in common between LAMOST and Gaia to find that phase-space spirals exist in all the spatial bins, and that the vertical perturbation probably started no later than 0.5 Gyr ago and will disappear in ∼6 Gyr. This demonstrates that stellar ages can help us to disentangle similar asymmetric structures in the Galactic disc.
The Milky Way’s non-axisymmetric kinematics have also been mapped with data from Gaia DR2 (Katz et al. 2018; López-Corredoira & Sylos Labini 2019; Wang et al. 2019a,b). Gaia DR2 provides unprecedentedly accurate measurements of proper motions, positions, parallaxes, and line-of-sight velocities for 7.2 million stars brighter than GRVS = 12 mag (Lindegren et al. 2018). With this, Katz et al. (2018) obtained detailed 3D kinematics and asymmetries for Galactocentric distances R < 13 kpc. Some similar results are also presented by Wang et al. (2018a), who found that Galactic outer disc stars in the range of Galactocentric distance between R = 8 and 13 kpc and vertical position between Z = −2 and 2 kpc exhibit asymmetrical motions in the Galactocentric radial, azimuthal, and vertical directions. Carrillo et al. (2019), assuming priors about the stellar distribution, extended Gaia-DR2 kinematic maps up to R = 14–16 kpc. In López-Corredoira & Sylos Labini (2019), using a statistical deconvolution of the parallax errors, the kinematics maps of Gaia-DR2 data were extended up to R = 20 kpc.
In-plane non-axisymmetries in the Milky Way disc kinematics have been shown in many works (e.g. Siebert et al. 2011; Antoja et al. 2012; Siebert et al. 2012; López-Corredoira et al. 2014; Xia et al. 2015; Liu et al. 2017a; López-Corredoira & González-Fernández 2016; Tian et al. 2017). For example, Siebert et al. (2011) found a radial velocity gradient in the direction of the Galactic centre by using Radial velocity Experiment (RAVE) (Kunder et al. 2017) red clump stars. Many diagonal ridge features were found in the R − Vrot map, the locations of which were compared with the locations of the spiral arms and the expected outer Lindblad resonance of the Galactic bar (Kawata et al. 2018). Some possible mechanisms such as the Galactic bar’s outer Lindblad resonance, perturbations due to the bar or spiral arms (Dehnen 2000; Fux 2001; Quillen & Minchev 2005), by external minor mergers such as the Sagittarius dwarf galaxy passing by, or by interaction with the Magellanic Clouds (Minchev et al. 2009, 2010; Gómez, Minchev & Villalobos 2012a; Gómez et al. 2012b) are proposed for these in-plane non-axisymmetries.
Vertical non-axisymmetries and wave-like density patterns are found in the solar neighbourhood (Widrow et al. 2012; Williams et al. 2013) and in the outer disc (Xu et al. 2015; Wang et al. 2018b). One example is the clear asymmetrical overdensity structure around Z ≈ 0.5 kpc, R ≈ 10–11 kpc, and b ≈ 15°, which is called the north near structure in Xu et al. (2015). This structure is located around 2 kpc from the Sun. Xiang et al. (2018) also revealed the density asymmetries in mono-age populations with main-sequence turn-off stars. Besides these density asymmetries, many velocity asymmetries have been identified in the Milky Way disc (Carlin et al. 2013; Sun et al. 2015; Carrillo et al. 2018; Pearl et al. 2017; Wang et al. 2018a). Scenarios for producing these structures include minor mergers or interactions with nearby dwarfs or satellites (Gómez et al. 2013; D’Onghia et al. 2016; Laporte et al. 2018). The effects of even lower mass dark matter subhaloes have also been invoked as a possible explanation (Widrow et al. 2014). The Galactic outer disc warp can also excite vertical bulk motions (Roškar et al. 2010; López-Corredoira et al. 2014). The warp may be generated by the interaction with the Magellanic Clouds (Burke et al. 1957; Weinberg & Blitz 2006), interaction with Sagittarius (Bailin 2003), disc bending instabilities (Revaz & Pfenniger 2004), misaligned gas infall (Ostriker & Binney 1989; Quinn & Binney 1992; Bailin & Steinmetz 2003), intergalactic magnetic fields (Battaner & Jiménez-Vicente 1998), or accretion of the intergalactic medium directly on to the disc (López-Corredoira, Betancort-Rijo & Beckman 2002a). The kinematical signature of vertical bulk motions can also be used to constrain the warp’s properties.
Recently, we have found many outer disc density asymmetries (Wang et al. 2018b) and investigated the velocity asymmetrical motions as far away as 5 kpc from the solar location at low Galactic latitudes in Wang et al. (2018a). Apart from this, much progress has been made in Galacto-seismology with the help of ground-based proper motions (e.g. Siebert et al. 2011; Widrow et al. 2012; Williams et al. 2013). The proper motion accuracies provided by Gaia have brought us into the golden era of disc kinematics studies. However, stellar ages and abundances from large spectroscopic surveys are needed for us to assess which mechanisms may have created these asymmetries and how they evolved. The LAMOST spectroscopic survey (Cui et al. 2012; Zhao et al. 2012; Deng 2012; Liu et al. 2014) has now provided a vast sample of red clump giant stars (RCG) with line-of-sight velocities, metallicities, abundances, and ages. For this paper, we use RCGs with estimated ages and distances, combined with the Gaia DR2 proper motion catalogue, to decipher the outer disc 3D kinematical structure and asymmetries in more detail, focusing especially on patterns in radial and vertical velocities with age.
The paper is organized as follows. Section 2 describes the sample and coordinate transformations. Section 3 shows the reconstruction of recent Gaia work. The radial and vertical velocity distribution projected on to 2D maps in the different mono-age populations, and the distributions of 3D velocities along the radial directions are shown in Section 4. We also introduce the vertical asymmetrical motions including some quantitative analysis. In Section 5, we discuss the asymmetrical mechanisms and some validations qualitatively. A summary is given in Section 6.
2 DATA
2.1 Sample selection and distance
The Large Aperture Multi-Object Fiber Spectroscopic Telescope (LAMOST, also called the Guo Shou Jing Telescope), is a quasi-meridian reflecting Schmidt telescope with an effective aperture of about 4 m. A total of 4000 fibers, capable of obtaining low-resolution spectra (R ∼ 1800) covering the range from 380 to 900 nm simultaneously, are installed on its 5° focal plane (Cui et al. 2012; Zhao et al. 2012; Deng et al. 2012; Liu et al. 2014). The LAMOST Data Release 4 (DR4) red clump catalogue contains more than 0.15 million spectra, with most of them being primary red clump stars, and a few per cent secondary RCGs and red giant branch (RGB) stars. LAMOST catalogues contain reliable stellar parameters, radial velocity, and [α/Fe], and derived quantities including distances and ages using the Kernel Principal Component Analysis method (Huang et al. 2019). The sample is mainly distributed in the Galactic anticentre direction due to special conditions at the site (Yao et al. 2012). We select red clump stars for this analysis because they are reliable standard candles in the disc (Huang et al. 2019) and the method for the determination of stellar parameters, metallicity, abundance, and age has been tested extensively (Xiang et al. 2017a,b,c; Wu et al. 2018, 2019).
Interstellar extinction was derived using the star pairs method (Yuan et al. 2015); with the help of large sky area spectroscopic surveys, observations of stars of essentially identical stellar atmospheric parameters in different environments can be easily paired and compared in different regions, and intrinsic colours/colour excess of individual stars estimated with accuracies of 1–4 per cent. The technique is able to determine E(B − V) to an accuracy of 0.01 mag. Red clump stars are standard candles, with distance uncertainties around 5–10 per cent (Huang et al. 2019). In this work, we only have primary red clump stars of which details can also be found in Huang et al. (2015). Fig. 1 shows spatial distribution of the RCG stars used in this work. The top panel is looking down on the Galactic plane at Galactic X and Y coordinates, and shows that our sample is mainly distributed in the anticentre direction. The bottom panel of Fig. 1 is the distribution in R and Z Galactic cylindrical coordinates, colour coded by star counts on a log scale. The majority of stars in our sample are outside the Solar radius in the direction of the low latitude Galactic anticentre, with higher sampling rates in the North Galactic Cap. The coordinates used throughout this work have X increasing outward from the Galactic centre, Y in the direction of rotation, and Z positive towards the North Galactic Pole (NGP) (Williams et al. 2013).
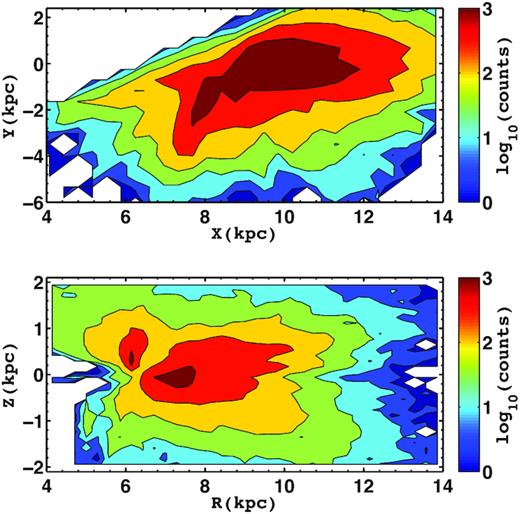
Spatial distribution of the RCG stars used in this work. The top panel is the X and Y in Galactic coordinates, and the bottom panel shows R and Z in cylindrical coordinates separately, colour coded by star counts on a log scale. The Sun is at (X, Y) = (8.34, 0) kpc and (R, Z) = (8.34, 0.027) kpc in these panels.
2.2 3D velocities derivation
The Gaia DR2 catalogue contains high-precision positions, parallaxes, and proper motions for 1.3 billion sources as well as line-of-sight velocities for 7.2 million stars. For stars of G < 14 mag, the median uncertainty is 0.03 mas for the parallax and 0.07 mas yr−1 for the proper motions. For the stars with available heliocentric radial velocities (7 224 631 sources), the parallax error is less than 100|${{\ \rm per\ cent}}$| for 7 103 123 of them. The Radial Velocity Spectrometer collects medium-resolution spectra with R ≳ 11700 which cover the wavelength range 845–872 nm centred on the calcium triplet region (Gaia Collaboration 2018; Katz et al. 2018; López-Corredoira & Sylos Labini 2019). The sources with radial velocities are nominally brighter than 12 mag in the GRVS photometric band. As described in Wang et al. (2018a), we derive the 3D velocities assuming the location of Sun is R⊙ = 8.34 kpc (Reid et al. 2014) and Z⊙ = 27 pc (Chen et al. 2001). The heliocentric rectangular components of the Galactic space velocity U, V, and W are determined by the right-handed coordinate system based on Johnson & Soderblom (1987), with U positive towards the Galactic centre, V positive in the direction of Galactic rotation, and W positive towards the NGP.
For the solar motion, we use the Tian et al. (2015) values: [U⊙, V⊙, W⊙] = [9.58, 10.52, 7.01] km s−1. We also ran our analysis with other solar motions (e.g. Huang et al. 2015), and found that the results are still robust. The circular speed of the local standard of rest is adopted as 238 km s−1 (Schönrich 2012). We also correct the radial velocities of the samples by adding 3.1 km s−1 in this work to place them on the APO Galatic Evolution Experiment (APOGEE) velocity scale (Blanton et al. 2017).
The behaviour of alpha abundance ([α/Fe]), metallicity ([Fe/H]), and age measurements for RCG stars within the range of Z = [ −2, 2] kpc is shown in Fig. 2, showing a colour-coded map of the median age (top panel) and its associated error distribution (bottom) in the R (radial distance from the Galactic centre), Z (vertical distance from the mid-plane) plane. The median number of stars per pixel in both figures is larger than 50. The top panel shows that the age has a clear gradient from thin to thick disc population from the chemical distribution, in agreement with the classifications of Martig et al. (2016). There is a young [α/Fe] enriched population in the top right corner. This intriguing population will be discussed in Sun et al. (2019). Errors in age and [α/Fe] could contribute to this region, as suggested by the one red strip of old α-enhanced stars that appears to be superimposed on an extended (light blue) background. The typical error of [α/Fe] is around 0.05, the age error is around 30 per cent. Even after accounting for these errors, many stars are still strange for the current chemical evolution models; we assume that most of the stars with relatively young age but high [α/Fe] are real for the current work. More tests and details about this extended background will be detailed in Sun et al. (2019). The bottom panel of Fig. 2 shows the age distribution in the R, Z plane. There are clear disc flaring features around |Z| = 0.8 kpc. Some discussions of disc flaring mechanisms can be found in Quinn, Hernquist & Fullagar (1993), Solway, Sellwood & Schönrich (2012), Bovy et al. (2016), Minchev et al. (2015, 2016, 2018), and Xiang et al. (2018). The bottom panel of this figure shows a clear negative age gradient in the morphological thick disc, as predicted by Minchev et al. (2015) and later shown in APOGEE (Martig et al. 2016).
![The top panel shows the age distribution of RCG stars on the [Fe/H] and [α/Fe] plane. The colour coding corresponds to the age for each bin. The bottom panel shows the median age of stars in the R, Z plane in the range of Z = [ −2, 2] kpc, R = [6, 14] kpc. There is a clear thin, thick, and flaring disc population according to chemistry and age definitions of Martig et al. (2016).](https://oup.silverchair-cdn.com/oup/backfile/Content_public/Journal/mnras/491/2/10.1093_mnras_stz3113/1/m_stz3113fig2.jpeg?Expires=1750360951&Signature=332U6N2YNZmdF4evfYoNN92Zihc3QY6-PjRpwX93T8y6f~nbhziqWVENvRxr-uJp6yLGZSoZAiCHhTf3CCecYPQvg8YL2z5yTSAUYuNm4SuKvF1671~mSbLE2VGf~qHfPHaD2gtwMH8HDR7wBNWZ3qEJK8zl63LtxZHlkJRgCe4tczqdBMCGHK~YiggkPF2A-~uiT509BQCA4ArHNeTy-pHCz2pbHehSZNc7jvy5Cy-1M12rFhy6CgTDIvSEfiD0DB8~FVUiCmfxA-vxOFhMoCxjia43t-Gc4ZDm6Ab7msWSezMO69gUfDOqzuVA0nEtTBLVsvzkbIoLod~IQWISYw__&Key-Pair-Id=APKAIE5G5CRDK6RD3PGA)
The top panel shows the age distribution of RCG stars on the [Fe/H] and [α/Fe] plane. The colour coding corresponds to the age for each bin. The bottom panel shows the median age of stars in the R, Z plane in the range of Z = [ −2, 2] kpc, R = [6, 14] kpc. There is a clear thin, thick, and flaring disc population according to chemistry and age definitions of Martig et al. (2016).
For our sample during this paper, the stars located inside |Z| < 3 kpc and 4 < R < 14 kpc are selected to map the lower disc kinematics, and we mainly focus on the region within Z = [ − 2, 2], R = [6, 14] kpc, where we have small random and systematic errors. The stars with LAMOST spectroscopic S/N < 20 and derived age larger than 15 Gyr are not included. A few hundred stars, distributed randomly, exhibit relative errors on their ages larger than 50 |${{\ \rm per\ cent}}$|. In this work, we do not use relative errors to exclude stars to reduce Poisson error. In order to reduce the contamination of halo stars, we only use stars with [Fe/H] greater than −1.0 dex, so we can focus on Galactic disc populations. We also set some criteria in velocity to remove fast-moving halo stars: VR = [−150, 150] km s−1, Vθ = [−50, 350] km s−1, and VZ = [−150, 150] km s−1; this removes a small fraction of stars.
3 RECONSTRUCTING GAIA DR2 WORK
We reconstruct recent work by Katz et al. (2018) using stars in common between LAMOST and Gaia in Fig. 3. The top panel shows some oscillations in the northern (0 < Z < 2 kpc) stars, a well-known nearby northern structure in the velocity field around R∼10–12 and Z ∼ 0.5 kpc at a Galactic latitude of around 15°. The middle panel shows an outward flaring or displacement of the contours away from Z = 0. This structure can be contributed by an increase in asymmetric drift, or we can say it is attributed by stars on more energetic orbits reaching the higher-Z region, which will necessarily have lower angular momentum. The latter description comes to the same thing dynamically but would be more direct. In Wang et al. (2018a), we call it asymmetrical structure with the contribution of asymmetric drift. The bottom panel shows stars in the north and south sides of the plane at R > 9 kpc exhibit net upward vertical motions larger than 2 km s−1 if we check the colour in the range of −5 to 5 km s−1. This is similar to results shown by Wang et al. (2018a); it is a bending mode (Widrow et al. 2012, 2014; Chequers, Widrow & Darling 2018) or vertical upward bulk motions. Comparing to Katz et al. (2018) in more detail, we note that in Fig. 9, the bending pattern seen as redder coloured bins is clear and stronger. Fig. 4 shows the error analysis for Fig. 3 results, corresponding to bootstrap errors on VR, Vθ, VZ (in km s−1). Bootstrap errors are determined by resampling (with replacement) 100 times for each bin, and the uncertainties of the estimates are determined using 15th and 85thpercentiles of the bootstrap samples. In this figure, the line-of-sight velocity is from LAMOST and the proper motion is from Gaia. We can see there are small errors around a few km s−1 in each panel.
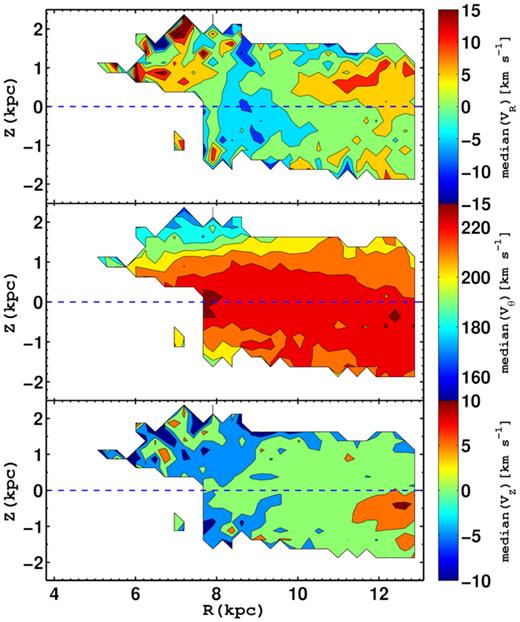
Edge-on views of the kinematics of the disc with similar range of Katz et al. (2018), derived using the giant sample: from top to bottom, median velocity maps of VR, Vθ, VZ(in km s−1). Each bin in the maps contains at least 50 stars.

As we can see, we can reconstruct the Gaia recent work and we can see clear asymmetrical features in the 3D velocity distributions. Apart from contributions to the rotational velocity by asymmetric drift, we also see the clear north near asymmetric structure and vertical asymmetrical motions. In the next section, we will give the time tagging on the radial and vertical asymmetries by using red clump ages.
4 TIME TAGGING THE ASYMMETRICAL STRUCTURE IN MONO−AGE POPULATIONS
4.1 Time tagging the north near structure using mono-age populations
In this section, we give time stamps for describing 2D asymmetrical radial motions in the Galactic disc. Fig. 5 shows the variation of Galactocentric radial velocity VR with age in the R, Z plane, with the numbers of stars used to produce the maps are given in each panel. We can see the large prominent velocity structure on the northern (0 < Z < 2 kpc) side from 9 < R ≲ 12 kpc in the first three panels with velocity clearly larger than 10 km s−1, in which VR has a positive gradient and becomes stronger. We also note that there is a north–south asymmetry at the location of R ∼ 9–12 kpc, Z ∼ 0.5 kpc with redder bins named and confirmed as the north near substructure in Wang et al. (2018a). From this figure, we can see that this feature disappears around 6–8 Gyr, which implies that the time when the north near substructure was sensitive to the perturbers is around 6 Gyr. According to the error analysis with bootstrap method shown in Fig. 6, we can see that most of the error values are around 1–2 km s−1 for the first four panels, when the age is larger than 8 Gyr. The error of the last two panels is significantly larger, but it cannot change our final conclusion of being sensitive to time, which is mainly based on the first four figures of Fig. 6. We also think it is a relatively younger or medium age structure according to the age distribution of corresponding regions in Fig. 2. The north near structure region’s age is less than 6 Gyr and most of stars are around 2 Gyr. Meanwhile, [α/Fe] and [Fe/H] is also showing that this structure is a low α and metal-rich population of stars as shown in Fig. 7, in which there also is a clear gradient for thin and thick discs. Fig. 7 (lower panel) shows the high-α population extending only to about R = 9 k̇pc at Z = 1–2 kpc. This important effect was reported by Hayden et al. (2015). We present a full map of the north near structure with age information thanks the larger sky LAMOST spectroscopic survey.
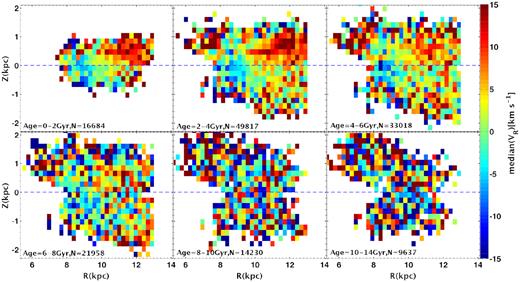
The radial asymmetrical structures in the R, Z plane of the LAMOST–Gaia stars in different age populations. Each panel is coloured as median velocity in different age bins. The top panel has clear asymmetries from 0 to 6 Gyr. Each pixel plotted in this figure has at least 10 stars.

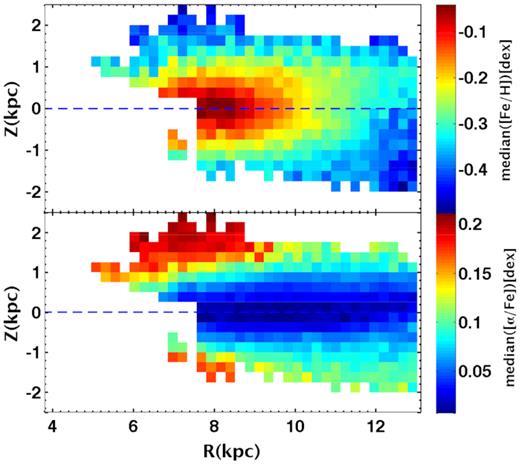
This figure shows the metallicity distribution function and abundance distribution function; there are clear gradients for thin and thick disc stars in the R, Z plane. This figure’s axes correspond to Fig. 3.
In order to reduce the influence of projection effects on our results, we show in Fig. 8 edge-on maps of the median radial velocity VR of the red clump sample. Each map corresponds to a slice of 15° in azimuth: [−30, −15] (top left), [−15, 0] (top right), [0, +15] (bottom left), and [+15, +30] deg (bottom right). The Sun is around X = 8.34 kpc and Y = 0 kpc. We can see the north near asymmetry is stable in the first three panels at Z∼ 0.5 kpc with red colour. At θ > 15°, the sampling rates for LAMOST is low so that we cannot see clear patterns.
![Edge-on maps of the median radial velocity VR of the red clump sample. Each map corresponds to a slice of 15° in azimuth: [−30, −15] (top left), [−15, 0] (top right), [0, +15] (bottom left), and [+15, + 30] deg (bottom right). The Sun is at X = 8.34 kpc and Y = 0 kpc. The Galactic centre is located on the left-hand side (at R = 0 kpc).](https://oup.silverchair-cdn.com/oup/backfile/Content_public/Journal/mnras/491/2/10.1093_mnras_stz3113/1/m_stz3113fig8.jpeg?Expires=1750360951&Signature=x7~qzQqkrnl4CXHyCTFrEeiY3VqvpJdYOZLN3AcaZw5UEHenUYFt3KZxg2oSbST7WOdwYV4wKwxXDd9CVwU~s2hgDDK9MT9xBT9MDF2Rv3hipJo9kq28jvGGyrLrIZhAU7Hcd8uqn-kw3CAMADvAr4zxajtdz9siTBvmWDf1TcejmUm0e9V5oDQ9Z2zbshFx3LugftaKCJQ58mS-tm~~cmBNJRheEOSpJ~x-z6amG6jk6WRFm5INJ1W4q8indnZYPlj0~jgGjycY2EhYx961Wu868HDT7ake57OMEe0Tqmaju9GOXVy57HCgRrI3YHkG9Vj2bdP8Pl~9~8uou2XCYQ__&Key-Pair-Id=APKAIE5G5CRDK6RD3PGA)
Edge-on maps of the median radial velocity VR of the red clump sample. Each map corresponds to a slice of 15° in azimuth: [−30, −15] (top left), [−15, 0] (top right), [0, +15] (bottom left), and [+15, + 30] deg (bottom right). The Sun is at X = 8.34 kpc and Y = 0 kpc. The Galactic centre is located on the left-hand side (at R = 0 kpc).
Similarly, we also tested the robustness of rotational asymmetrical velocity distribution, which is still stable. However, as we mentioned in Section 3, asymmetric drift is contributing to the rotational feature so that we do not make more detailed analysis in this work.
4.2 Time tagging the vertical motions of mono-age populations
Fig. 9 shows the average VZ with position in the R, Z plane in different age populations. There is clear evidence of a vertical bulk motion outside the solar radius or 9 kpc for age in the range of 2–6 Gyr: above the mid-plane, the overall trend shows stars are moving upward, and below the plane, stars are also moving upward. This is very similar to the substructure found by Wang et al. (2018a). This illustrates what is often called a ‘bending’ mode. For 0–2 or 6–8 Gyr, there is also a bulk motion or bending mode features with many bins larger than 6 km s−1 , but not as strong and clear as in the 4–6 Gyr population. This bending mode disappears when the age is older than 8 Gyr, so we speculate these bulk motions might be sensitive only in the earliest 8 Gyr. After that time, the disc stars for this region become older and kinematically hotter and not sensitive to the possible perturbations. The error analysis in the R, Z plane is given in Fig. 10. As is shown with colours, most of the errors in the first four figures are around 1 km s−1, with larger errors in the last two figures due to the contributions of age, Poisson, and velocity errors. However, most of the error value of the fifth figure is around 1–5 km s−1. We do not think it will change our current conclusion of time sensitivity by comparing the values of Fig. 9 carefully.
![Similar to Fig. 5, but for vertical velocity, VZ. In the [2–4] Gyr population, there are significant bulk motions at almost all radii and heights outside the Sun’s radius, extending until R ∼ 13 kpc. For 8–10 Gyr, there are no clear bulk motion or bending mode features.](https://oup.silverchair-cdn.com/oup/backfile/Content_public/Journal/mnras/491/2/10.1093_mnras_stz3113/1/m_stz3113fig9.jpeg?Expires=1750360951&Signature=xiFFDpwFGdm0uJuu6uSaLr1plx1~rZr9~6iGKTO6EKgQBiEtdt3d9QDPTSocZ3OHHnntSXnn4fRW2rdzpnvouLnDbCjKW75DSY~tuM7qqP2TON-aO3SbEZiMbKyQbVelhscOF7BSTVHZz9pBbhj-o9YXt4C7svigQFXeTwZiYPm5YljVeDXBZOy9WvazT55CYgDuGyG4A3psLavQ~lWpuqQ6cWVIgh-tQacChBpsa1R~dWz24s-z5TC6z1Sf06U2iFtfqBG6Djro1U0ia7Y-M4VeGZQznbmlY~p~cgPJEmrCa6mKbkOKFHs7V8W0x0kuWTMluvT84PzLhELZZ4KZ4A__&Key-Pair-Id=APKAIE5G5CRDK6RD3PGA)
Similar to Fig. 5, but for vertical velocity, VZ. In the [2–4] Gyr population, there are significant bulk motions at almost all radii and heights outside the Sun’s radius, extending until R ∼ 13 kpc. For 8–10 Gyr, there are no clear bulk motion or bending mode features.

Similarly, we also consider the projections of vertical velocity. In Fig. 11, we can see very clear features of the bending mode or vertical bulk upward motions in the range [−15, 15] deg, this range has high sampling in the LAMOST survey. The stars show significant upward motions from VZ ∼ 1 to 15 km s−1, especially between −1 < Z < 1 kpc. Some possible mechanisms to excite these motions are discussed in the next section.
![Edge-on maps of the median vertical velocity VZ of the red clump sample. Each map corresponds to a slice of 15° in azimuth: [−30, −15] (top left), [−15, 0] (top right), [0, +15] (bottom left), and [+15, + 30] deg (bottom right). The Sun is at X = 8.34 kpc and Y = 0 kpc.](https://oup.silverchair-cdn.com/oup/backfile/Content_public/Journal/mnras/491/2/10.1093_mnras_stz3113/1/m_stz3113fig11.jpeg?Expires=1750360951&Signature=iF3rR9jUnEXUZlTBz~uSw~IoJXdZJvORI6XgjZyVHx3m-67YbM~FAGdfwKomZcJN6c0VA8pGRhqZplWXG3Vi0NDZ5A2DbJ5bxUvNMtjCHWmKbgAeom7X455R3Iqz4ScZXOyI82DaQzIb1slpz~pItgbfhXdNBzLth0OCWuXEl6AmPiteXQvQ7iF5lOfqza4GwnC0JYU-6juNf2QxSxXgq3v0tUyVY7VmfjTPNEyq9sUY3wuurgx5Z7tsdqzeUQngvlb6f8WBvKs-tWmdMEDGiIPXhbWcHwmmtP5SLylwUONiqK0pH9pen5~y4udyEq53zYOgErtDekYNU~16qt8TKQ__&Key-Pair-Id=APKAIE5G5CRDK6RD3PGA)
Edge-on maps of the median vertical velocity VZ of the red clump sample. Each map corresponds to a slice of 15° in azimuth: [−30, −15] (top left), [−15, 0] (top right), [0, +15] (bottom left), and [+15, + 30] deg (bottom right). The Sun is at X = 8.34 kpc and Y = 0 kpc.
![The figure shows the bending mode’s contribution to bulk velocities. Here, the disc has been divided into four groups of symmetric layers according to the Katz et al. (2018) formula. The distance to the Galactic mid-plane increases from top to bottom: [−0.5, 0] and [0, 0.5] k̇pc (top left), [0.5, 1.0] and [−1, −0.5] kpc (top right), [−1.5, −1.0] and [1, 1.5] kpc (bottom left), and [1.5, 2.0] and [−2.0, −1.5] kpc (bottom right). The general trend of the bending mode is increasing with radius. The blue bold solid lines and slim lines are spiral arms from Reid et al. (2014).](https://oup.silverchair-cdn.com/oup/backfile/Content_public/Journal/mnras/491/2/10.1093_mnras_stz3113/1/m_stz3113fig12.jpeg?Expires=1750360951&Signature=IDLmoZ2ESRFTfcyvHI9rVU~E~8NqLfjwXkM3v0wToon5wb0R7c7gI2q4Y~r5rNLjgBP34TaXtAK0aieiuJ2XJIkRm2POILxUBA2UerIdMI8GuA9z7SfvvEyYFIqawzsqLDdpV0qWQqUThNXpn8UmfvX2qLUh1xb2UtLxsaKWMESyxm1N~W9livpQac~wWra6QOJIfwPvWG-qOTMZQn3vqw0SaFtKBcUOHvVZj6h7byq5bmqMvNOmIaeqMXCE7BWaJjJz95iDzyQjrz47kwC9tFA6ShIgOZqx35r0BU-9ScqWm0uVJ2NjYqxhBPWr3QlGuTlr27mOWGbhIwQu7ugCAg__&Key-Pair-Id=APKAIE5G5CRDK6RD3PGA)
The figure shows the bending mode’s contribution to bulk velocities. Here, the disc has been divided into four groups of symmetric layers according to the Katz et al. (2018) formula. The distance to the Galactic mid-plane increases from top to bottom: [−0.5, 0] and [0, 0.5] k̇pc (top left), [0.5, 1.0] and [−1, −0.5] kpc (top right), [−1.5, −1.0] and [1, 1.5] kpc (bottom left), and [1.5, 2.0] and [−2.0, −1.5] kpc (bottom right). The general trend of the bending mode is increasing with radius. The blue bold solid lines and slim lines are spiral arms from Reid et al. (2014).
![The figure shows the breathing mode’s contribution to bulk velocities. Here, the disc has been divided into four groups of symmetric layers according to the Katz et al. (2018) formula. The distance to the Galactic mid-plane increases from top to bottom: [−0.5, 0] and [0, 0.5] k̇pc (top left), [0.5, 1.0] and [−1, −0.5] kpc (top right), [−1.5, −1.0] and [1, 1.5] kpc (bottom left), and [1.5, 2.0] and [−2.0, −1.5] kpc (bottom right). The general trend of the breathing mode is decreasing with radius.](https://oup.silverchair-cdn.com/oup/backfile/Content_public/Journal/mnras/491/2/10.1093_mnras_stz3113/1/m_stz3113fig13.jpeg?Expires=1750360951&Signature=tthkKK7TWY1~wXe39SdRW2ciPDdj~40D7uxn2~QWeQ91XM-CHWwuz1m0giJwlWCCiKqTaujrn30JQK9GDbJaz-6TZTuBH69dY~cmzDfPNXt-5ldcyfz8aCjvFBTyNXzx6oA4NwR~ZFKraw2IaVTcFgu~o1xNSycOacoii0z86hNzwwkqHpp69yMBeAqXdAS6LXHgMuniLFbTHWZzIc2e-jm~YAGRIn3jMGNcVCsOOa4cMcjWt~o9vxgBPaafYrFxcvhk8jTS0MDPZADd86naTEhSQCBaWNcdTtOgPOK3mkNy9aY5ks1JBDSylrA061o4EEiSQ5P2uwzXJ2JKLYa~fA__&Key-Pair-Id=APKAIE5G5CRDK6RD3PGA)
The figure shows the breathing mode’s contribution to bulk velocities. Here, the disc has been divided into four groups of symmetric layers according to the Katz et al. (2018) formula. The distance to the Galactic mid-plane increases from top to bottom: [−0.5, 0] and [0, 0.5] k̇pc (top left), [0.5, 1.0] and [−1, −0.5] kpc (top right), [−1.5, −1.0] and [1, 1.5] kpc (bottom left), and [1.5, 2.0] and [−2.0, −1.5] kpc (bottom right). The general trend of the breathing mode is decreasing with radius.
4.3 1D velocity asymmetric structure along the radial direction
The top panel of Fig. 14 shows the median radial velocity, VR, as a function of Galactocentric radius R in different age populations; different colours represent different ages from [0–2], [2–4], [4–6], [8–10], [10–14] Gyr. In this figure, the median radial velocity has a negative slope in the inner regions, and a positive trend in outer parts, with the turning point around R = 8.5 kpc. This is similar to the U-shape found by Katz et al. (2018), with the negative trend meaning that more stars move inwards than outwards. Beyond 9 kpc, the median radial velocity becomes positive, meaning that more stars move outwards than inwards, in agreement with López-Corredoira & Sylos Labini (2019) and López-Corredoira et al. (2019a). There is a dip around the Sun’s location, which is similar to the results by Wang et al. (2018a). It is not very likely to be a artificial feature due to the systematic errors for the precise red clump star distances and proper motions. Solid lines with error bars represent the median radial velocity of stars between Z = [−1, 1] kpc, because we do not want to consider more thick disc population and most of our red clump stars are in this range. Apart from this, we also want to avoid the influence of moving groups or streams on our discussion. The U-shape feature has a different pattern in different age bins. We can see the velocity of younger populations (0–4 Gyr) is larger than that for older populations. The radial velocity values are from around −5 to 10 km s−1 for this panel. For reference, the red vertical solid and dashed lines in all panels mark the locations of spiral arms (Reid et al. 2014).
![Median velocity of stars between Z = [−1, 1] kpc, toward the Galactic anticentre. The top panel shows the median Galactocentric radial velocities, VR, of the RCG sample as a function of Galactic radius in different ages: [0,2] Gyr (cyan) to [10–14] Gyr (black). The error bars or uncertainties on the median radial velocities are from a bootstrap method. The middle panel shows the variation of median Vθ, which ranges from 200 km s−1 increasing to 235 km s−1. The younger stars exhibit larger median Vθ than older ones with radius at least less than 12 kpc. The bottom panel shows the vertical velocity VZ, along R. There is a trend from negative to positive with upward bulk motions at all radii R > 9 kpc for all populations, with no prominent difference for each populations in the general trends. The red vertical solid and dashed lines in all panels mark the locations of spiral arms (Reid et al. 2014).](https://oup.silverchair-cdn.com/oup/backfile/Content_public/Journal/mnras/491/2/10.1093_mnras_stz3113/1/m_stz3113fig14.jpeg?Expires=1750360951&Signature=EfDLTROnYYVoh4HtswbMJ8QhKmUZoSmzEP-~lr~UDHkVC0iN-QTyqsr3O25JZSeHzjCtKcULOq06N2QPyO56~5PH89~~Dvco0RGJy8MBGAn2XjJj3qX7EA38E~YNstSDg0aIpfuSa-UfrSS5-tKLPTEicwtDG5P3toiyG3ooQ9YJEzdyxy1j-6L0IA5UTDiLZEQ3YXACnZO21Bfh-w287aBsI09VgUZ5ha~RjV7oTYaFe7DWP4QXPuLKP35jaRCWIgMTzinHSpw3aMRrrKRHqgWpKw2nzHcjSMK7Dl2uiMZUKq~EcrexsNX2K2qMDqPVjcI7USuuQOGp8VbK4-irnQ__&Key-Pair-Id=APKAIE5G5CRDK6RD3PGA)
Median velocity of stars between Z = [−1, 1] kpc, toward the Galactic anticentre. The top panel shows the median Galactocentric radial velocities, VR, of the RCG sample as a function of Galactic radius in different ages: [0,2] Gyr (cyan) to [10–14] Gyr (black). The error bars or uncertainties on the median radial velocities are from a bootstrap method. The middle panel shows the variation of median Vθ, which ranges from 200 km s−1 increasing to 235 km s−1. The younger stars exhibit larger median Vθ than older ones with radius at least less than 12 kpc. The bottom panel shows the vertical velocity VZ, along R. There is a trend from negative to positive with upward bulk motions at all radii R > 9 kpc for all populations, with no prominent difference for each populations in the general trends. The red vertical solid and dashed lines in all panels mark the locations of spiral arms (Reid et al. 2014).
The middle panel displays the variation of median Vθ with R. The value ranges are from ∼200 to 230 km s−1 for stars of different ages. There are clear differences between the younger and older ones, showing that the younger stars have higher velocities than old stars, some of which roughly corresponds to the results in Wang et al. (2018a). This reflects the rotational velocity gradient with height from the mid-plane; older stars have larger velocity dispersion and larger asymmetric drift, so the younger stars show a larger mean rotational velocity than older ones. At distances larger than 12 kpc, these trends mix together because the region is far away from the bar and spiral arms, and stars of the outer disc are generally relatively younger compared with inner disc so that the velocity difference is not so large.
The bottom panel shows the vertical velocity VZ along R. There is a clear trend with radius from negative (downward) to positive (upward) bulk motions. Furthermore, the vertical velocities of the younger stars do not show much difference with older populations due to the possible age accuracy, except that the youngest population (0–2) Gyr has a decreasing trend around 13 kpc. Some possible scenarios to explain the trends noted here are discussed in the next section. Please notice that we only concentrate on stars less than around 13–14 kpc.
5 DISCUSSION: POSSIBLE IMPLICATIONS AND COMPARISONS
5.1 Discussion of radial motions
5.1.1 Northern structure in radial motions
Xu et al. (2015) revealed there is a northern overdensity around 2–4 kpc outside of the Sun. Wang et al. (2018b) and Wang, Liu & Deng (2018c) confirmed this substructure by using LAMOST RGB stars. Results found by Tian et al. (2017) showed that there are positive radial motions beyond 9 kpc. This gradient might be caused by the northern substructure, but Tian et al. (2017) detected the 1D asymmetrical radial motions in roughly two age populations by integrating stars on both sides. In Wang et al. (2018a), we also see 2D asymmetrical motions including the north near velocity substructure and 1D radial motions with a positive gradient similar to Tian et al. (2017). Moreover, in Wang et al. (2018a) we can also see clearly the northern velocity contributing to these positive increases. However, in this work, we present a full map and give time stamps on this structure for the first time.
In order to see more chemo-kinematical details of this northern structure, we can see in Fig. 15 (top left panel) the age distribution for RCG stars on the [Fe/H] and [α/Fe] plane. The colour-coded map shows the age distribution for a sample with age less than 15 Gyr, Z = [0.2 0.8] kpc and R = [10–13] kpc. The top right panel is the radial velocity distribution for RCG stars on the [Fe/H] and [α/Fe] plane. Similarly, the bottom two panels correspond to rotational and vertical velocity distributions for the rough north near region in this work separately. As we can see, the overall trend for this structure’s population is present in stars younger than 6 Gyr, more metal rich than 0.7 dex, and with [α/Fe] lower than 0.2 dex (top left). This population of stars moves outward on average with radial velocity larger than zero (Fig. 15, top right panel) and has large rotational velocity. It is worth mentioning that Fig. 15 (lower left panel) shows the more metal-poor stars of the thin disc have higher angular momentum. This has been attributed to these more metal-poor stars migrating inwards from the more metal-poor outer disc where the angular momentum is higher; this effect was also found by Lee et al. (2011). It is interesting to see that the effect is still present at R = 10–13 kpc.
![The top left panel shows the age distribution for RCG stars on the [Fe/H] and [α/Fe] plane. The colour-coded map shows the age distribution for the sample less than 15 Gyr, Z = [0.2 0.8] kpc and R = [10-13] kpc. The top right panel is the radial velocity distribution for RCG stars on the [Fe/H] and [α/Fe] plane. Similarly, the bottom left one is rotational velocity, and the bottom right one is the vertical velocity distribution for the rough north near region in this work.](https://oup.silverchair-cdn.com/oup/backfile/Content_public/Journal/mnras/491/2/10.1093_mnras_stz3113/1/m_stz3113fig15.jpeg?Expires=1750360951&Signature=bYudhQfxhFODjAYAWUOszIzzGmay645fkz9YcNjPBz5u0FLHLfWThfgFx-do4KqKGOEiNZCjjge86HZCLzltlUUP2rPLX~IjnVkC-WbpQrT6QkCSAuRiqsASv7ObECAYezQeu75uz9T-jxkTEvKlQjuMCdUCfIhh~sxLBihL4GP4V8M7SYRQDJeuDoUZYNHLTlKZQnXZSvqZHOzhk0nrkaI1b1SQqOXz8RJB7uoFkfAGVpxuRS02F15YH8zcpvqzOd6LCUVJN0iFbHk~9UXXG~yhiVpvUgWUsYNRYmNG5oYgDct3t7FJwbKoVH4egfHjJuleJIu1RF3k4Cu7BZT7Qg__&Key-Pair-Id=APKAIE5G5CRDK6RD3PGA)
The top left panel shows the age distribution for RCG stars on the [Fe/H] and [α/Fe] plane. The colour-coded map shows the age distribution for the sample less than 15 Gyr, Z = [0.2 0.8] kpc and R = [10-13] kpc. The top right panel is the radial velocity distribution for RCG stars on the [Fe/H] and [α/Fe] plane. Similarly, the bottom left one is rotational velocity, and the bottom right one is the vertical velocity distribution for the rough north near region in this work.
5.1.2 Some possible scenarios for radial motions
For in-plane asymmetries, large-scale non-circular streaming motions would clearly be due to a non-axisymmetric component of the Galactic potential, which could be caused by the Galactic bar, spiral arms, inclined orbits due to a warp or its motion, a triaxial dark matter halo (Siebert et al. 2011, 2012), or intrinsically elliptical or a net secular expansion of the disc (López-Corredoira & González-Fernández 2016). It is likely contributed by a combination of some or all of these components (Wang et al. 2018a). From the top panel in Fig. 14, we can also see that these possible effects have larger dynamical effects on the younger populations than older ones. We can also see the effects might strongly affect the populations with ages between 0–6 Gyr.
5.1.3 Spiral arms
Kawata et al. (2018) found many diagonal ridge features and proposed some of these are likely related to the perturbations from the bar’s outer Lindblad resonance and spiral arm dynamics. We can see there is a dip in Fig. 14 (top panel), around 8.5 kpc: it corresponds to the local spiral arm location. We speculate that in-plane asymmetries might also be contributed by spiral arms in the solar neighbourhood. For the outer disc, radial velocity asymmetries might be produced by the spiral structures that are always spatially correlated with spiral arms (Siebert et al. 2012; Faure, Siebert & Famaey 2014; Grand et al. 2015). The analysis of the 3D response of the disc distribution function to a spiral arm perturbation can also be found in Monari, Famaey & Siebert (2016).
If we investigate in more detail, we can see the radial velocity is from around −5 to 10 km s−1 for the populations younger than 4–6 Gyr, with a gradient of about 3 km s−1 kpc −1. For the populations older than 4 Gyr, the value is generally from around −5 to 5 km s−1 corresponding to a gradient of around 2 km s−1 kpc −1. Recently, López-Corredoira et al. (2019a) have analysed the radial velocity from 8 to 28 kpc with APOGEE (Majewski et al. 2017) data. We find our results are very similar to their fig. 2 results. López-Corredoira et al. (2019a) think factors such as the effect of the Galactic bar, streams, or mergers do not seem appropriate to explain their observations. A possible explanation proposed by them might be the gravitational attraction of overdensities in a spiral arm, with compression where the stars enter the spiral arm and expansion where they exit, corresponding to negative and positive values. We find for our results, if we choose the mean value of different populations of radial velocity, it is about 6 km s−1. According to López-Corredoira et al. (2019a), the mass in spiral arms necessary to produce these velocities would be around 3 per cent of the mass of the disc, consistent with current knowledge of the spiral arms. Therefore, we think that the spiral arms may explain our kinematical data.
5.1.4 A simple class of out-of-equilibrium systems
Another possible scenario that López-Corredoira et al. (2019a) explore is a simple class of systems in which radial motions are generally created by the monolithic collapse of isolated self-gravitating overdensities. In this simple out-of-equilibrium system, a quasi-planar spiral structure surrounding a virialized core will be produced by rotating and asymmetrical mass distributions that evolve under their own gravity. This model predicts non-circular orbits in the outer disc. Mean orbits in the very outer disc are out of equilibrium, so they have not reached circularity yet. A galaxy in equilibrium does not need orbits to be circular and indeed orbits of individual stars in galaxies are generally not circular in equilibrium axisymmetric configurations; but it is the ‘mean orbit’ that is circular in the axisymmetric potential. However, in a non-equilibrium regime there is a net average non-zero radial velocity. Under some initial conditions, they are able to reproduce the observed features. See more details in Benhaiem et al. (2017) and López-Corredoira et al. (2019a, b). We also think the out of equilibrium model might be a possible scenario to explain our data.
5.1.5 Minor mergers
Minor mergers mainly contribute to vertical waves. These perturbations were thought not to affect the in-plane radial velocity (Gómez et al. 2013; Tian et al. 2017). However, Carrillo et al. (2019) have more recently shown that a major perturbation, such as the impact of Sagittarius, could reproduce a radial asymmetrical velocity field in their observations too. In fact, from the most recent simulations, the bending mode induced has a strong radial velocity counterpart, as can be seen for example in fig. 4 of Laporte et al. (2019). Therefore, a minor merger might also be contributing to these asymmetries according to the newest simulations and data.
5.1.6 Bars, intrinsically elliptical outer disc, secular expansion of the disc, streams
The outer disc asymmetric radial motions are likely mainly contributed by the bar dynamics with a given pattern speed (Grand et al. 2015; Monari, Famaey & Siebert 2015; Tian et al. 2017; Liu et al. 2017b). Tian et al. (2017) find that the mean radial velocity is negative within R ∼ 9 kpc and positive beyond, which might imply a perturbation induced by the rotating bar with pattern speed of 45 km s−1. A simulation by Liu et al. (2017b) showed that the bar pattern speed of 60 km s−1 can be matched with their data, although other recent works give lower values around 40 km s−1 (Portail et al. 2017; Bovy et al. 2019; Sanders, Smith & Evans 2019). With the help of Schwarzschild’s orbit-superposition technique, Wang et al. (2012) constructed self-consistent models of the Galactic bar and found that the best-fitting Galactic bar model has a pattern speed ωp = 60 km s−1, which also implies that the bar might be in the plane and have angle on the X–Y plane. However, the asymmetrical variation with age on the R–Z plane seen in Fig. 5 mainly happens on the northern side, and we do not understand how a bar might produce this asymmetry. Moreover, Monari et al. (2014) showed that no gradient in the radial velocity is expected from a bar effect for the observed distances. For the current understanding, we suppose that the bar might not be the main contributor.
López-Corredoira & González-Fernández (2016) and López-Corredoira et al. (2019a) propose that in plane asymmetries might be explained by the mean orbits of disc stars being intrinsically elliptical, or a perturbation due to net secular expansion of the disc. In the case of elliptical orbits, radial motions would indicate an eccentricity, e, different from zero, but similar distributions in their works’ calculations find small e, not significantly different from zero. If we were in the case of secular expansion, the lifetime of the Galaxy would be much longer than their calculation and the size of the Galaxy cannot change so fast. We think these two scenarios are not likely.
A local stream cannot be the explanation for radial velocities along a wide range of a few kpc. Moreover, a large-scale stream associated with the Galaxy in the Sun-Galactic centre line should have some additional clear evidence of it embedded in our Galaxy. We do not detect any signatures, so we think this is not very likely. According to López-Corredoira et al. (2019a), who used a similar analysis but divided their sample into the north and south sides, they found that there is a relatively small asymmetry between the northern and southern Galactic hemispheres. For the same region, we calculate the difference for both sides, and find that the difference is around 0.5–5 km s−1. We suggest that it is unlikely that the same stream contributed by an infalling galaxy would be so symmetric with respect to the mid-plane.
In summary, we think the in-plane asymmetries are not likely mainly contributed by the bar, an intrinsically elliptical outer disc, secular expansion of the disc, or streams. We propose that spiral arms dynamics, out-of-equilibrium models, minor mergers are the important contributors. Dark matter subhaloes, warp dynamics or other mechanisms might also be possible which is needed to be investigated in the future.
5.2 Discussion for vertical motions
The overall trends for vertical motions in different populations of this work are similar to recent work by López-Corredoira & Sylos Labini (2019). We see that different populations have similar patterns with radius in Fig. 14, and we can see the bending mode exists from 0 to 8 Gyr in Fig. 9. The scenarios to excite vertical bulk motions must be more complex, including scenarios such as perturbations due to the passing of the Sagittarius dwarf galaxy proposed by Gómez et al. (2013) or the Large Magellanic Cloud (Laporte et al. 2018), or the disc response to bombardment by merging lower mass satellites (D’Onghia et al. 2016). The effects of even lower mass dark matter subhaloes have also been invoked as a possible explanation (Widrow et al. 2014).
Equation (5) indicates that our warp might not be stationary (|$\dot{\gamma } = 0$|) if we assume the model is right. Our results are different from the 0.23 ± 0.16 of γ and |$\dot{\gamma }/\gamma = -34\pm 17\, {\rm Gyr}^{-1}$| in López-Corredoira et al. (2014); the reason might be that the contribution to |$\dot{\gamma }$| comes from the southern warp and is negligible in the north in their work, but for LAMOST, we can only be sensitive to the northern warp due to low sampling and coverage in the southern sky. Moreover, López-Corredoira et al. (2014) used data from ppmxl (Röeser, Demleitner & Schilbach 2010) that had much larger error bars in proper motions than Gaia DR2, so that their fit was of poorer quality. The fitting result is shown in Fig. 16.
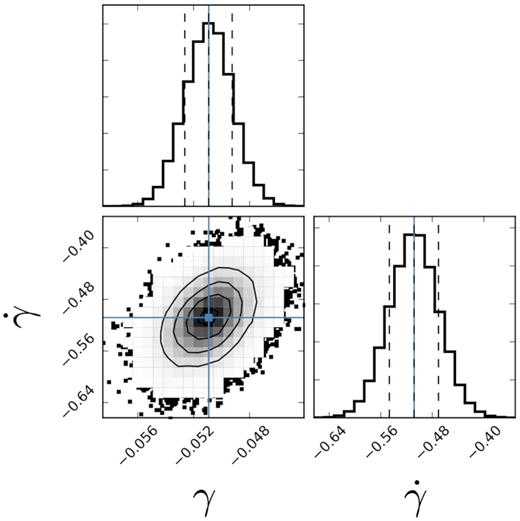
The likelihood distribution of the parameters (γ and |$\dot{\gamma }$|) drawn from the MCMC simulation, The solid lines in the histogram panels indicate the maximum-likelihood values of the parameters. The dashed lines indicate the 1σ regions defined by the covariance matrix.
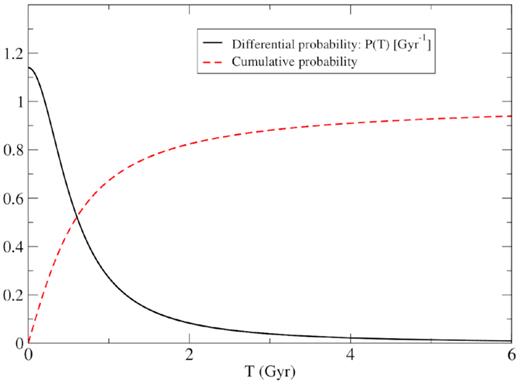
Distribution of probability of the period for the motion of γ(t) = γmaxsin (ωt) given by equation (5).
Our results are equivalent to a rotation of the rings around the line of nodes with an angular velocity of |$-0.56\left(1-\frac{R_\odot }{R}\right)$| km s−1 kpc−1, which is less than 0.2 km s−1 kpc−1 in the range of R between 8 and 13 kpc.
As we can see in Figs 12 and 13, our general trends are consistent with the simple ‘bending’ and ‘breathing’ model, so we speculate that the vertical bulk motions are dominated by these modes. The Galactic bar and spiral arms can induce breathing modes, and external perturbations can induce bending modes (Faure et al. 2014; Monari et al. 2015, 2016). Chequers et al. (2018) found that bending waves could also arise without excitation by a satellite/merging event. Widrow et al. (2014) used a toy-model simulation of disc–satellite interactions to show that a passing satellite galaxy could produce bending or breathing modes depending on the vertical velocity of the satellite as it passes through the Galactic disc. The picture can actually be rather complex; Carrillo et al. (2018) mentioned that the external perturbations also generate internal spiral perturbations which can in turn excite breathing modes. There is a possibility that the bars, spiral arms, minor mergers, warps, bending and breathing modes are coupled together (Widrow et al. 2019).
Minor merger simulations carried out by Gómez et al. (2013) implied that variations of vertical motions less than ∼10 km s−1 and radial and azimuthal variations of the mean vertical velocity will correlate with the spatial structure if vertical motions are caused by spiral arms, as is shown in the bottom panel of Fig. 14. There is no clear spatial correlation, so the vertical motions in the outer disc are not likely mainly contributed by spiral arms. The Galactic bar is unlikely to induce mean vertical motions greater than ∼0.5 km s−1 in the outer disc (Monari et al. 2015). Our measured bulk motions are larger than 0.5 km s−1, so we do not favour a bar/spiral arm as main contributors for the vertical asymmetric motions, although they might be possible factors.
In summary, according to current analysis, the complex bending and breathing modes produced by the internal perturbation or minor merger or other external perturbation is the most possible scenario. Warp contributions or other mechanisms might also be a reasonable possible explanation. Possibly they are coupled together to cause the vertical asymmetry with bending and breathing modes accompanied with mean non zero radial motions for the regions studied in this work.
6 CONCLUSIONS
In this work, we investigate the kinematics of mono-age populations of RCG stars in the Galactic disc between R = 6 and 14 kpc, and Z = −2 to 2 kpc with the recent LAMOST-DR4 and Gaia proper motion catalogue. From time stamps on the asymmetrical variations of the velocities, especially for Galactocentric radial velocity and vertical velocity, not only do we confirm Gaia and LAMOST results, but we also find that:
The median radial velocity substructure located at Z ∼ 0.5 kpc and R ∼ 9–12 kpc corresponds to the northern overdensity (north near structure), which is sensitive to the perturbations in the early 6 Gyr. The radial velocity for younger populations is larger than older ones.
The stars beyond R ≳ 9 kpc are moving upward on average in different age populations. We investigate the temporal evolution of this structure. It appears that the bending mode vertical motions sensitive duration is around 8 Gyr. We also simply show that if the vertical motions are contributed by the warp, then it implies the warp is a not stationary structure.
With the help of previous works, we discuss that in-plane asymmetries are not likely mainly contributed by the bar, intrinsically elliptical outer disc, secular expansion of the disc, or streams. The gravitational attraction of overdensities in a spiral arm or arm dynamics, the simple class of out-of-equilibrium systems, or minor mergers might be important factors, although we cannot exclude other scenarios such as dark matter subhaloes, warps, etc. For the vertical asymmetries, we can rule out that they might be mainly caused by spiral arms or simply by the bar. Other mechanisms such as minor mergers, warp line of nodes, dark matter subhaloes, or satellite accretion might also contribute, leaving an imprint in the bending and breathing modes that we observe. The most possible scenario is that all these mechanisms are coupled together to cause in-plane and vertical asymmetric features simultaneously.
ACKNOWLEDGEMENTS
We would like to thank the anonymous referee for his/her helpful comments. We also thank Lawrence M. Widrow, Heidi J. Newberg, Ivan Minchev, and Wang Y.G. for helpful discussions and comments. HFW is supported by the LAMOST Fellow project, National Key Basic Research Program of China via SQ2019YFA040021 and funded by China Postdoctoral Science Foundation via grant 2019M653504 and Yunnan province postdoctoral Directed culture fundation. MLC was supported by grant PGC-2018-102249-B-100 of the Spanish Ministry of Economy and Competitiveness (MINECO). JLC acknowledges support from the U.S. National Science Foundation via grant AST-1816196. YH acknowledges the National Natural Science Foundation of China U1531244, 11833006, 11811530289, U1731108, 11803029, and 11903027 and the Yunnan University grant nos C176220100006 and C176220100007. Guoshoujing Telescope (LAMOST) is a National Major Scientific Project built by the Chinese Academy of Sciences. Funding for the project has been provided by the National Development and Reform Commission. LAMOST is operated and managed by the National Astronomical Observatories, Chinese Academy of Sciences. The LAMOST FELLOWSHIP is supported by Special Funding for Advanced Users, budgeted and administrated by Center for Astronomical Mega-Science, Chinese Academy of Sciences (CAMS). This work has also made use of data from the European Space Agency (ESA) missionGaia (https://www.cosmos.esa.int/gaia), processed by the Gaia Data Processing and Analysis Consortium (DPAC, https://www.cosmos.esa.int/web/gaia/dpac/consortium). Funding for the DPAC has been provided by National Institutions, in particular the institutions participating in the Gaia Multilateral Agreement. HFW is also supported by the Cultivation Project for LAMOST Scientific Payoff and Research Achievement of CAMS-CAS.
REFERENCES
Author notes
LAMOST Fellow.
