


ABSTRACT
We present predictions for the evolution of the galaxy dust-to-gas ratio (DGR) and dust-to-metal ratio (DTM) from z = 0 → 6, using a model for the production, growth, and destruction of dust grains implemented into the simba cosmological hydrodynamic galaxy formation simulation. In our model, dust forms in stellar ejecta, grows by the accretion of metals, and is destroyed by thermal sputtering and supernovae. Our simulation reproduces the observed dust mass function at z = 0, but modestly underpredicts the mass function by ∼×3 at z ∼ 1–2. The z = 0 DGR versus metallicity relationship shows a tight positive correlation for star-forming galaxies, while it is uncorrelated for quenched systems. There is little evolution in the DGR–metallicity relationship between z = 0 and 6. We use machine learning techniques to search for the galaxy physical properties that best correlate with the DGR and DTM. We find that the DGR is primarily correlated with the gas-phase metallicity, though correlations with the depletion time-scale, stellar mass, and gas fraction are non-negligible. We provide a crude fitting relationship for DGR and DTM versus the gas-phase metallicity, along with a public code package that estimates the DGR and DTM given a set of galaxy physical properties.
1 INTRODUCTION
Dust plays a critical role in the physics of the interstellar medium (ISM) and galaxy evolution. The surfaces of dust grains catalyze a range of chemical reactions that influence the structure of ISM and star formation (Hollenbach & Salpeter 1971; Mathis 1990; Weingartner & Draine 2001; Draine 2003; Wolfire et al. 2008; Hollenbach et al. 2012; Gong, Ostriker & Wolfire 2017), including the formation of molecular hydrogen and grain-catalyzed recombinations of H+ and C+. The ejection of dust from galaxies can contribute to metal abundances in the intergalactic medium and offers an additional cooling channel (Ostriker & Silk 1973; Bouché et al. 2007; Ménard, Kilbinger & Scranton 2010; Peeples et al. 2014; Peek, Ménard & Corrales 2015; Vogelsberger et al. 2019), while dust absorption of far-ultraviolet and optical photons can shape the temperature structure of the neutral ISM (Goldsmith 2001; Krumholz, Leroy & McKee 2011; Narayanan et al. 2011, 2012; Narayanan & Davé 2012).
A complex set of physical processes contributes to the evolving dust content of the Universe. It can be produced via condensation of dust grains from the gas-phase metals in the ejecta of asymptotic giant branch (AGB) stars and supernovae (SNe; Gehrz 1989; Todini & Ferrara 2001; Nozawa et al. 2003; Ferrarotti & Gail 2006; Nozawa et al. 2007; Zhukovska, Gail & Trieloff 2008; Nanni et al. 2013; Schneider et al. 2014), after which it can grow in the ISM via accretion of gas-phase metals (Dominik & Tielens 1997; Dwek 1998; Hirashita & Kuo 2011; Zhukovska 2014). It can be destroyed via enhanced non-thermal sputtering in SN blast waves, thermal sputtering, and via grain–grain collisions (Draine & Salpeter 1979a, b; Seab & Shull 1983; McKee et al. 1987; Jones, Tielens & Hollenbach 1996; Bianchi & Ferrara 2005; Nozawa et al. 2007).
Dust properties in galaxies have been intensively studied through statistics and scaling relations, of which three particularly interesting are dust mass functions (DMFs; Dunne, Eales & Edmunds 2003; Vlahakis, Dunne & Eales 2005; Eales et al. 2009; Dunne et al. 2011; Clemens et al. 2013; Beeston et al. 2018), dust-to-gas ratios (DGRs) and dust-to-metal ratios (DTMs) as a function of galaxy metallicity or stellar mass (Issa, MacLaren & Wolfendale 1990; Lisenfeld & Ferrara 1998; Hirashita, Tajiri & Kamaya 2002; Draine et al. 2007; Galametz et al. 2011; De Cia et al. 2013, 2016; Zafar & Watson 2013; Rémy-Ruyer et al. 2014; Sparre et al. 2014; Giannetti et al. 2017; Wiseman et al. 2017; Chiang et al. 2018; Kahre et al. 2018; De Vis et al. 2019). These relationships provide a convenient method for determining gas masses in galaxies, as well as providing constraints on the baryon cycle that governs galaxy evolution at low and high redshifts (e.g. Magdis et al. 2012).
Theorists have commonly used an assumed constant dust-to-metal ratio in galaxies in order to model the evolving dust content in hydrodynamic or semi-analytic models of galaxy formation (e.g. Silva et al. 1998; Granato et al. 2000; Baugh et al. 2005; Lacey et al. 2010; Narayanan et al. 2010; Fontanot & Somerville 2011; Niemi et al. 2012; Somerville et al. 2012; Hayward et al. 2013; Narayanan et al. 2015, 2018a, b; Cowley et al. 2017; Katz et al. 2019; Ma et al. 2019). However, there is growing evidence from both integrated and resolved far-infrared studies of galaxies at both low and high redshifts that the DGR and DTM in galaxies are not constant, and may not even be straightforwardly modelled by a simple linear relationship with a galaxy physical property (such as metallicity). For example, while the gas-to-dust ratio appears to scale with the metallicity of galaxies in the local Universe (Dwek 1998; Draine et al. 2007; Bendo et al. 2010), there may be deviations from this trend at the lowest metallicities (e.g. Galliano et al. 2005; Galametz et al. 2011; Rémy-Ruyer et al. 2014; De Vis et al. 2019). Similarly, the DTG measured by damped Ly-alpha (DLA) and gamma-ray burst (GRB) absorbers (e.g. De Cia et al. 2013, 2016; Wiseman et al. 2017) from z = 0.1 to z = 6.3 are similar to those in the Local group, though drop at metallicities lower than 0.05 Z⊙. Hence, more sophisticated theoretical modelling of galaxy dust content and its evolution is needed.
In recent years, galaxy evolution models have progressed from treating dust as a simple scale factor of the metal mass (see Somerville et al. 2012 and references therein) to including the physics of dust formation, growth and destruction in galaxies as they evolve. The first generation of these sorts of simulations treated galaxies as one-zone models (e.g. Issa et al. 1990; Dwek 1998; Inoue 2003; Morgan & Edmunds 2003; Calura, Pipino & Matteucci 2007; Zhukovska et al. 2008; Hirashita & Yan 2009; Asano et al. 2013; Calura et al. 2014; Rowlands et al. 2014; Zhukovska 2014; Feldmann 2015; De Vis et al. 2017), though more recently a number of groups have begun to incorporate self-consistent dust physics on-the-fly into bona fide hydrodynamic models of galaxy formation and evolution. Bekki (2015), McKinnon, Torrey & Vogelsberger (2016), and Aoyama et al. (2017) established some of the initial frameworks for including dust in hydrodynamic galaxy formation simulations to study the evolution of dust properties in individual galaxies. Building on this, McKinnon et al. (2017) performed full-volume cosmological simulations using moving mesh code arepo to study dust properties across galaxies over cosmic time, but were unable to successfully reproduce the DGR–metallicity relation. Vogelsberger et al. (2019) extended this framework by implementing high temperature dust cooling channels to study dust in galaxy clusters and its impact on the intergalactic medium. Aoyama et al. (2017, 2018) developed a two-grain size model into an SPH (smoothed particle hydrodynamic) cosmological simulation, where they studied overall dust properties in a whole cosmological volume and IGM, while Hou et al. (2019) built on this to add a phenomenological active galactic nuclei (AGNs) feedback model. Finally, Popping, Somerville & Galametz (2017) and Vijayan et al. (2019) have implemented the physics of dust formation, growth and destruction into semi-analytic galaxy formation models. The growing interest in modelling dust evolution highlights its importance in more accurately modelling the observed properties of galaxies.
What has been missing thus far is a predictive self-consistent model for the DGR and DTM in galaxies across cosmic time in a large-volume cosmological galaxy formation simulation. In this paper, we aim to develop this model. To do this, we incorporate into state-of-the-art cosmological hydrodynamic simulation simba (Davé et al. 2019) a model to track on-the-fly dust formation and evolution, broadly following the McKinnon et al. (2017) passive scalar dust algorithm. Here, passive refers to the dust being advected with the gas, and scalar refers to the dust having a fixed grain-size distribution.
We include dust production from Type-II SN and AGB stars, and further growth via accretion of metals, while destruction can occur from sputtering, consumption by star formation, or SN shocks. We explore the evolution of the galaxy DMF and the scaling relations of the DGR and DTM with metallicity over cosmic time. We then build on this, and investigate the physical drivers of the DGR and DTM using a machine-learning framework trained by our simulated data set to understand the scatter in the DGR/DTM–metallicity relation. We use these tools to develop an algorithm (that we release publicly) for the dust mass from galaxies without the assumption of an overly simplistic DGR or DTM. We additionally provide a simple scaling relation for the DGRs in galaxies.
This paper is organized as follows. In Section 2, we summarize the simba simulation suite, with a particular focus on the model for dust formation and evolution. We present the DMFs and scaling relations between the DGR/DTM and gas phase metallicities in Section 3. In Section 3.4, we model the underlying physical drivers of the DGR and DTM, and establish a connection between the DGR/DTM and various physical properties of galaxies. We then discuss our results, compare them to other theoretical work, and discuss potential caveats in Section 4, and conclude in Section 5.
2 METHODOLOGY
2.1 Cosmological simulations
This work utilizes the simba cosmological hydrodynamic simulation. We refer the reader to Davé et al. (2019) for full details, and we summarize the salient points here.
The primary simba simulation we use here has 10243 dark matter particles and 10243 gas elements in a cube of |$100h^{-1}\, {\rm Mpc}$| side length, and is run from z = 249 down to z = 0. We assume a Planck16 (Planck Collaboration et al. 2016) concordant cosmology of Ωm = 0.3, |$\Omega _\Lambda =0.7$|, Ωb = 0.048, |$H_0=68\,\,{\rm km}\, {\rm s}^{-1}\,\,{\rm Mpc}^{-1}$|, σ8 = 0.82, and ns = 0.97. Our simba run has a minimum gravitational softening length |$\epsilon _{\rm min} = 0.5 h^{-1}\, {\rm kpc}$|, mass resolution 9.6 × 10⁷ M⊙ for dark matter particles and 1.82 × 10⁷ M⊙ for gas elements. The system is evolved using a forked version of the gizmo cosmological gravity plus hydrodynamic solver (Hopkins 2015), in its Meshless Finite Mass (MFM) version. This code, modified from gadget-3 (Springel 2005), evolves dark matter and gas elements together including gravity and pressure forces, handling shocks via a Riemann solver with no artificial viscosity.
Radiative cooling and photoionization heating are modelled using the grackle-3.1 library (Smith et al. 2017), including metal cooling and non-equilibrium evolution of primordial elements. An H2-based star formation rate is used, where the H2 fraction is computed based on the sub-grid model of Krumholz, McKee & Tumlinson (2009) based on the metallicity and local column density, with minor modifications as described in Davé, Thompson & Hopkins (2016) to account for variations in numerical resolution. The star formation rate is given by the H2 density divided by the dynamical time: SFR=ϵ*ρH2/tdyn, where we use ϵ* = 0.02 (Kennicutt 1998). These stars drive winds in the ISM. This form of feedback is modelled as a two-phase decoupled wind, with 30 per cent of wind particles ejected hot, i.e. with a temperature set by the supernova energy minus the wind kinetic energy. The modelled winds have an ejection probability that scales with the galaxy circular velocity and stellar mass (calculated on the fly via fast friends-of-friends galaxy identification). The nature of these scaling relations follow the results from higher resolution studies in the Feedback in Realistic Environments zoom simulation campaign (e.g. Muratov et al. 2015; Anglés-Alcázar et al. 2017b; Hopkins et al. 2014, 2018).
The chemical enrichment model tracks eleven elements (H, He, C, N, O, Ne, Mg, Si, S, Ca, Fe) during the simulation, with enrichment tracked from Type-II SNe, Type-Ia SNe, and AGB stars. The yield tables employed are Nomoto et al. (2006) for SNII yields, Iwamoto et al. (1999) for SNIa yields, and AGB star enrichment following Oppenheimer & Davé (2006). Type-Ia SNe and AGB wind heating are also included, along with ISM pressurization at a minimum level as required to resolve the Jeans mass in star-forming gas as described in Davé et al. (2016).
simba incorporates black hole physics. Black holes are seeded and grown during the simulation via two-mode accretion. The first mode closely follows the torque-limited accretion model presented in Anglés-Alcázar et al. (2017a), and the second mode uses Bondi accretion, but solely from the hot gas component. The accretion energy is used to drive feedback that serves to quench galaxies, including a kinetic subgrid model for black hole feedback, along with X-ray energy feedback. simba additionally includes a dust physics module to track the life cycle of cosmic dust, which we describe in the following section.
2.2 Modelling the dust life cycle
In our implementation, dust is fully coupled with gas flows. This treatment is essentially accurate, as the drift caused by the gas–dust drag force and the radiative pressure is under-resolved in our simulations. Additionally, dust grains are assumed to have the same physical properties with a constant radius a = 0.1 μm and density σ = 2.4 g cm−3 (Draine 2003). We ignore dust cooling channels that will be implemented in future work.
Dust is produced by condensation of a fraction of metals from SNe and AGB ejecta. We follow the prescription described by equations (4)–(7) in Popping et al. (2017) that updates the work of Dwek (1998). In the following, |$m_{i,{\rm d}}^j$| refers to the dust mass of the ith element (C, O, Mg, Si, S, Ca, Fe) produced by the jth stellar process (SNII or AGB stars), whereas |$m_{i,{\rm ej}}^j$| refers to the mass of ejecta from the jth process.
We choose a fixed dust condensation efficiency |$\delta ^{\rm AGB}_{i,\rm dust}=0.2$| based on the computation of Ferrarotti & Gail (2006), and |$\delta ^{\rm SN II}_{i,\rm dust}=0.15$| guided by Bianchi & Schneider (2007) to match the low-metallicity end of the observed z = 0 relation between the DGR and gas-phase metallicities (Rémy-Ruyer et al. 2014).1 We omit the condensation of Type-Ia SN ejecta, as recent work suggests that Type-Ia SNe are not significant sources of dust production (see Nozawa et al. 2011; Dwek 2016; Gioannini et al. 2017). This is different from McKinnon et al. (2016) and Popping et al. (2017), where Type-Ia SNe are assumed to have the same condensation efficiency as Type-II SNe.
We additionally destroy dust completely in hot winds and during star formation and AGN X-ray heating (Section 2.1). The parameters adopted in this simulation is listed in Table 1.
Simulation free parameters.
| Parameter | Description | Value | Range accepted by literature |
|---|---|---|---|
| Thermal sputtering | |||
| a | Grain radius (μm) | 0.1 | – |
| σ | Density of solid matters within grains (g cm−3) | 2.4 | 2.2(graphite), 3.3(silicate)a |
| Production | |||
| |$\delta ^{\rm AGB,C/O\gt 1}_{i,\rm dust}$| | Condensation efficiency | 0.2 for i = C | 0.2–1.0b |
| 0 otherwise | 0 | ||
| |$\delta ^{\rm AGB,C/O\lt 1}_{i,\rm dust}$| | 0 for i = O | 0 | |
| 0.2 otherwise | 0.2–0.8b | ||
| |$\delta ^{\rm SNII}_{i,\rm dust}$| | 0.15 for i = C | 0.15–1.0b | |
| 0.15 otherwise | 0.15–0.8b | ||
| Growth | |||
| ρref | Reference density (g cm−3) | 2.3 × 10⁻²² | – |
| Tref | Reference temperature (K) | 20 | – |
| |$\tau _{\rm g}^{\rm ref}$| | Growth time-scale with T = Tref and ρ = ρref (Myr) | 10 | 2–500c |
| Destruction (SNe Shock) | |||
| ESN,51 | Energy per SN (1051 erg) | 1.0 | – |
| ϵ | The efficiency of destruction by SN shocks | 0.3 | 0.1–0.5d |
Finally, we note that for the star formation and grain growth models, we need to provide a total metallicity in solar units. For this, we assume a solar abundance (Z⊙ = 0.0134) taken from Asplund et al. (2009).
2.3 Data analysis – a machine-learning framework
We seek to accurately quantify how galaxy dust properties, particularly the DGR, trace other global galaxy properties. This represents a regression problem, where from a set of input variables, the prediction for the DGR is desired that most closely follows what is predicted directly by the simulation.
We employ machine learning for this regressor, as is now becoming common for a wide variety of astrophysical applications (e.g. Ball et al. 2007; Fiorentin et al. 2007; Gerdes et al. 2010; Carrasco Kind & Brunner 2013; Ness et al. 2015; Kamdar, Turk & Brunner 2016; Agarwal, Davé & Bassett 2018; Rafieferantsoa, Davé & Naab 2019). Taking advantage of the large training set offered by simba simulation of tens of thousands of galaxies, we use machine learning to relate the galaxy DGR to a set of galaxy properties, i.e. an N-dimensional vector |$\boldsymbol X$|, the components of which are the global galaxy properties as detailed in Section 3.4.
The primary algorithm used in this work is extremely randomized trees (ERTs; Geurts, Ernst & Wehenkel 2006). ERTs build a large ensemble of regression trees, each of which splits the training set – here, an (N + 1)-dimensional space comprising of data points (|$\boldsymbol X$|, DGR) from 70 per cent of the simulated galaxies – recursively among one randomly selected subset of the galaxy properties. Each splitting divides the (N + 1)-dimensional space into two (N + 1)-dimensional subspaces, and it stops once the resulting subspace only contains one (|$\boldsymbol X$|, DGR) point or the user-defined maximum tree depth is reached, in which case a relation between |$\boldsymbol X$| and DGR is established. The estimates produced by all the regression trees in the ERT ensemble are averaged to build a final map from |$\boldsymbol X$| to DGR. We refer readers interested in further details to Geurts et al. (2006) for the details of splitting and randomization in ERTs. For this work, we used the implementation of ERTs in the python package, scikit-learn (Pedregosa et al. 2011).
3 DUST PROPERTIES OVER COSMIC TIME
3.1 Dust mass functions
Fig. 1 shows the redshift evolution of DMF, comparing against the observational result of Dunne et al. (2003) at z = 2; Eales et al. (2009) at z = 1; and Dunne et al. (2011), Clemens et al. (2013), and Beeston et al. (2018) at z = 0. Unlike the comparison presented in Davé et al. (2019); here, we standardized their results to our cosmological parameters (cf. Section 2.1) and our assumed dust mass absorption coefficient κ(850 |$\mu\rm m$|) = 0.77 cm2 g−1.
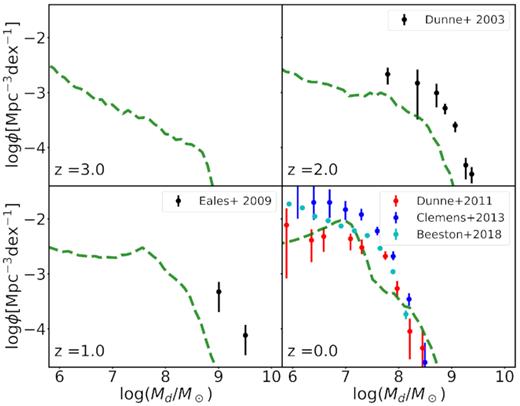
Model DMFs from our cosmological galaxy formation simulations at redshifts z = 0–3 for the full cosmological box, compared against observed data. When comparing to observational data sets, we select galaxies within particular redshift bins as follows. For Eales et al. (2009), we plot data from 0.6 < z < 1.0. For Dunne et al. (2011) and Beeston et al. (2018), we plot data from 0.0 < z < 0.1. We standardized their results to our cosmological parameters (cf. Section 2.1) and the dust mass absorption coefficient κ(850 |$\mu\rm m$|) = 0.77 cm2 g−1.
At z = 0, simba agrees well with observed data. Our simulation underproduces the DMF at the low-mass end, due to our mass resolution and the minimum mass of identified galaxies (24 baryonic particles ≈4.37 × 10⁸ M⊙ baryonic mass). The z = 2 model DMF underpredicts the observational one by a modest factor of ∼3. This is still much better than early attempts in this area, where galaxies with Md ≳ 108M⊙ are hardly produced (e.g. McKinnon et al. 2017). We note that the observational mass function by Dunne et al. (2003) and Dunne et al. (2011) are from surveys of sub-mm sources with large beam sizes, which could result in multiple objects being blended within one beam therefore overestimating their dust masses (e.g. Narayanan et al. 2010; Hayward et al. 2013; Narayanan et al. 2015). Beyond this, once we fold in the uncertainties in deriving dust masses from sub-mm photometry, it is probably premature to use the high-redshift DMF as a strong constraint on models. Overall, the DMF predicted by simba broadly agrees with currently observed determinations, with very good agreement in the overall DMF shape. This indicates that simba viably models dust evolution over cosmic time in galaxies, and sets the stage for examining more detailed dust-related properties.
Fig. 2 shows the ratio of the comoving cosmic dust mass density ρd and the comoving cosmic stellar mass density ρ* as a function of redshift. The cosmic dust (or stellar) mass density is computed by summing the dust masses Md (or stellar masses M*) of all gas cells and dividing by the total comoving volume. We get ρ* = 310ρd at z = 0. For the convenience of comparison, ρ* is normalized such that ρ* = ρd at z = 0.

The comoving cosmic dust mass density ρd (blue), the comoving dust mass density excluding dust ejected out of galaxies via galactic winds (cyan), and the comoving cosmic stellar mass density (red) ρ* as a function of redshift. ρ* = 310ρd at z = 0. For the convenience of comparison, ρ* is normalized such that ρ* = ρd at z = 0.
The cosmic dust mass density rapidly increases from z = 6 by over 1.5 dex. At late times, the dust density flattens as the global star formation rate falls, the amount of metals available to be accreted drops, and a quasi-balance is reached among dust production, growth, destruction, and astration. The evolution of the dust mass density only slightly lags behind the stellar mass density at early epochs and catches up with rapid grain growth.
The comoving dust mass density excluding dust ejected out of galaxies via galactic winds is shown as the cyan line. It increases monotonically at high redshifts, following the total dust mass density. At z ∼ 2, it starts declining as star formation rates decline on average with the onset of quenching massive galaxies, which slows down the metal enrichment and thus limits the grain growth. Meanwhile the destructive processes remain strong, and are even enhanced in massive galaxies that harbour little cold gas. Comparing this trend to the evolution of total dust mass density, we infer that the destruction of dust ejected to haloes, dominated by thermal sputtering, is not strong enough to quickly eliminate dust grains owing to the low-gas density. The wind model may need to be modified so that dust can be efficiently destroyed during the decoupled wind phase from galaxies into circumgalactic gas.
3.2 The dust-to-gas ratio
The agreement of our predicted DMFs with observations suggests that simba represents a plausible dust evolution model. We now turn to examining the main target relations of our paper, the DGR and DTM in simba galaxies, in comparison to data.
Fig. 3 shows the hexbin plot of the DGR as a function of gas-phase metallicity (Zgas) between z = 0 and 6, compared against the data points as observed by Rémy-Ruyer et al. (2014) and De Vis et al. (2019). Hexbins are colour-coded with specific star formation rates (sSFR) = SFR/M*.
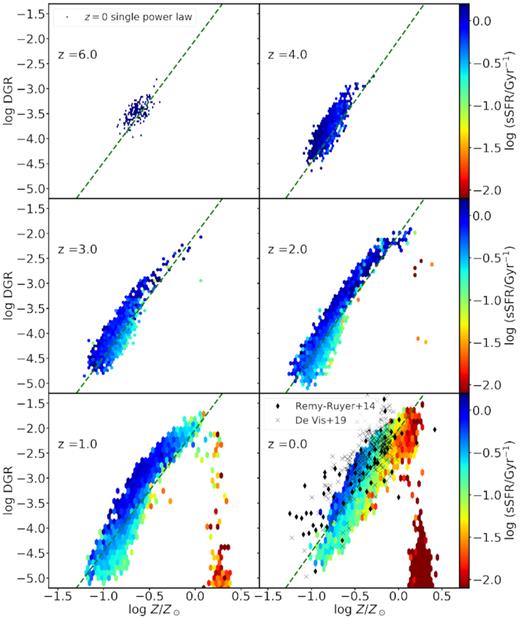
The relation between DGR and gas-phase metallicity at z =0–6. For z =1–6, the theoretical data is shown with hexbins colour-coded with specific star formation rates, while the best fit of z = 0 theoretical relation with a power law (equation 9) is shown in each panel (for reference) with green dashed lines. The black dots and crosses in each panel are the z = 0 observational data by Rémy-Ruyer et al. (2014) and De Vis et al. (2019), respectively. For De Vis et al. (2019), we use metallicities derived from ‘S’ calibration of Pilyugin & Grebel (2016).
At z = 0, simba shows a DGR that is in good agreement with observations. However, we emphasize that our dust model was tuned to do so via our choice of the dust condensation efficiencies. These quantities mostly change the Z < 0.2Z⊙ part of the DGR, without changing the slope much. Hence, the slope of the DGR versus Zgas is a robust prediction, as is our predictions for the redshift evolution.
There are two main regimes in the DGR−Zgas plane. The first regime corresponds to star-forming galaxies, where the DGR increases with Zgas. Our models predict a weak evolution of the DGR–Zgas relation between z = 0 and 6, as is also predicted by Popping et al. (2017) using a semi-analytic model. The evolution of this relation in the DGR–Zgas plane is mainly driven by the metal enrichment of galaxies as more galaxies just move along the sequence to slightly higher Zgas at lower redshifts. The second regime corresponds primarily to quenched galaxies and shows low-DGR values and no correlation with Zgas. This is driven by AGN feedback that builds up the quenched galaxy population, in which dust production is stopped but dust destruction is enhanced by sputtering in surrounding hot gas. Even though there are no observed galaxies in this regime, this is likely due to an observational selection effects rather than an actual lack of galaxies (De Vis et al. 2019). Finally, we note that the predicted DGR ratios in low-Zgas galaxies generally lie below the observations. These objects are typically very gas-rich dwarfs. It is unclear whether they are overly gas-rich in simba, or else they have too little dust production (or both). There may also be observational selection effects that bias in favour of higher dust masses in such small, faint systems.
This is quite close to the best-fitting power law to the De Vis et al. (2019)’s data |$\log \text{DGR} = (2.45 \pm 0.12) \log \left(\frac{Z}{\mathrm{Z}_\odot } \right) - (2.0 \pm 1.4)$|, quantitatively confirming the good agreement of the predicted and observed slopes. Still, the scatter of the best fit is large (σ = 0.31 dex), even though the correlation is clear. Better estimates of the DGR might be obtained by incorporating secondary physical parameters in addition to Zgas; we explore this in Section 3.4 using machine learning.
3.3 The dust-to-metal ratio
In Fig. 4, we apply a similar analysis to the DTM, plotting the DTM ratio as a function of Zgas between z = 0 and 6. This relation is equivalent to the relation between the DGR and Zgas. As discussed above, our simulation shows only a weak evolution of the DTM ratio from z = 6 to 0 and approximately reproduces the result of Rémy-Ruyer et al. (2014) and De Vis et al. (2019). The DTM ratio increases rapidly as Zgas increases at the low-metallicity regime until it is capped at a roughly constant value ∼0.8 when |${\it Z}_{\rm gas} \gt 0.5 \, \mathrm{Z}_{\odot }$|. For the quenched galaxies, the DTM ratio drops off quickly for the same reasons as in the DGR case.
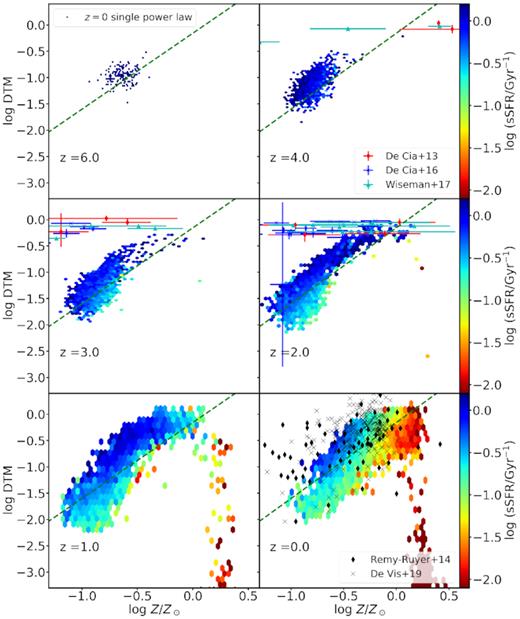
The relation between dust-to-metal ratio (DTM) and gas-phase metallicity at z = 0–6. Observational data from high-redshift observations of DLA and GRB absorbers (De Cia et al. 2013, 2016; Wiseman et al. 2017) are overplotted. The black dots and crosses in each panel are the z = 0 observational data by Rémy-Ruyer et al. (2014) and De Vis et al. (2019), respectively.
Overplotting the z ∼ 2–4 data from high redshift observations of damped lyman alpha (DLA) and gamma-ray burst (GRB) absorbers (De Cia et al. 2013, 2016; Wiseman et al. 2017) against the simulated data; however, we find a systematic discrepancy at |$Z_{\rm gas} \lt 0.5 \, \mathrm{Z}_{\odot }$|, where the predicted DTM ratios show a much steeper dependence with metallicity than the observations. The source of this discrepancy is unclear. We note that the nature of these absorbers can be significantly different from the physical conditions in galaxy discs. DLAs are thought to arise from the outskirts of gas discs in galaxies and perhaps even from metal-poor gas in the circumgalactic medium (Berry et al. 2014). Moreover, these studies measure metallicities and DTM via abundances acquired from optical/UV absorption-line spectroscopy, which is different from methods typically used for galaxies observed in the local Universe (i.e. strong-line calibrations for metallicities and infrared emission for the dust mass). This discrepancy thus may reflect a difference in the dust production versus destruction in different environments or scales, combined with the selection effect and methodologies of observations. We defer a more careful comparison of the DGR in these particular types of objects to future work, but note that there is potentially a discrepancy at low Z. This also may be responsible for the too-low DGR at low Z. We note, however, that significantly larger amounts of dust in low-mass galaxies would steepen the DMF, which may put our currently viable predictions into conflict with observations.
3.4 Better DGR and DTM prediction via machine learning
We now investigate the physical drivers of the DGR and DTM ratios in galaxies, as well as their scatter. While equation (9) provides a rough fit, it is clear that there is correlated scatter, and hence fitting with more variables should give a tighter relation. To approach this agnostically in terms of the form and input variables, we employ a machine learning approach using extremely randomized trees (ERTs).
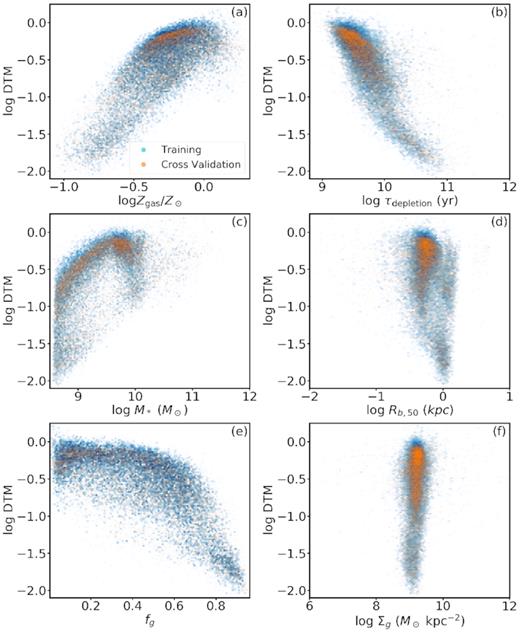
We seek to establish a map between a range of physical properties – namely gas-phase metallicity (Zgas), gas depletion time-scale (τdepletion ≡ Mg/SFR), stellar mass (M*), half-baryonic mass radius (Rb,50), gas mass fraction [fg ≡ Mg/(Mg + M*)], and gas surface density (Σg) – on to the galaxy DGR and DTM ratios. We limit our analyses to z = 0 and concentrate our efforts on fitting the star-forming sequence of galaxies, since quenched galaxies show little dust and no obvious trend with any physical property and our relations show little evolution with redshift. It would be straightforward to apply this methodology to other redshift outputs.
The ERT is set-up using |$70{{\ \rm per\ cent}}$| of the selected simba galaxy sample as a training set, with a maximum depth of 20 levels. We then use the remaining 30 per cent for validation. The algorithm then generates a mapping between the inputs and the two desired outputs (DGR and DTM). By using ERT, we also have access to importance levels, which are determined as the relative depth of a given input parameter was used for branching the tree.
Fig. 5 shows the fitted relation between the DGR and various galaxy physical properties. Cyan points show the training set, and orange points denote the validation set; taken together, they represent all simulation star-forming galaxies. Observations are shown from De Vis et al. (2019) as black points.
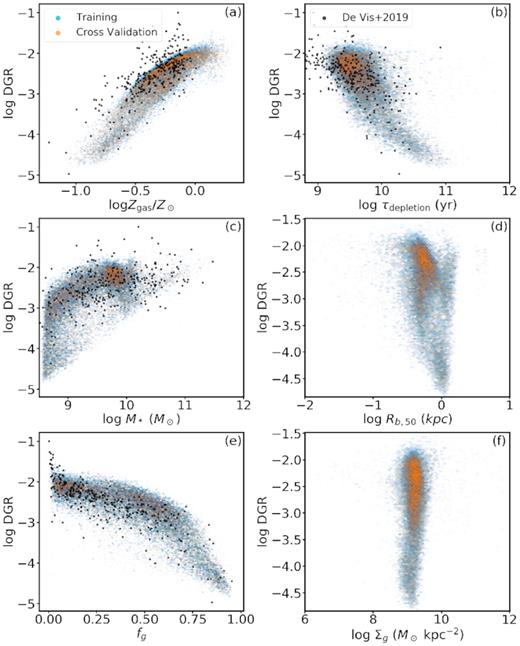
The result our best-fitting map from galaxy properties (gas-phase metallicity Zgas, gas depletion time-scale τdepletion , stellar mass M*, half-baryonic mass radius Rb,50, gas mass fraction fg, and gas surface density Σg) to the DGR at z = 0, using extreme randomized trees (ERT). The ERT is trained with the training set, denoted by cyan points, which consists of 70 per cent randomly selected star-forming galaxies from simba. Orange points denote the prediction using galaxy properties of the cross-validation set that consists of the remaining 30 per cent of the galaxies. The black dots represent the z ∼ 0 observational data by De Vis et al. (2019) for reference.
Comparing to observations, simba reproduces the observed z = 0 DGR values as a function of various galaxy physical quantities reasonably well. The DGR increases with metallicity and stellar mass, though less tightly so with the latter. The DGR also drops with the gas fraction and depletion time, probably reflecting underlying trends from the stellar mass dependence. The DGR shows no clear dependence on Rb,50 or Σg. For Zgas, τdepletion, M*, and fg, the Spearman’s rank correlation coefficients are r = 0.87, −0.63, 0.64, 0.81, respectively, compared to 0.33 for Rb,50 and 0.14 for Σg.
Fig. 6 shows the analogous plot for the DTM ratio. The trends are broadly similar, with DTM increasing with Zgas and M*, and decreasing with fg and τdepletion. This suggests that M*, fg, and τdepletion may provide additional information that will enable tighter prediction of both the DGR and the DTM. Rank correlation coefficients are similar to the DGR case.
Analogous to Fig. 5 but for DTM instead of DGR.
Since we know the true values for the 30 per cent validation set, we can examine how well the ERT is able to reproduce these true values. The quality of fitting is shown in the left-hand panels of Fig. 7, for the DGR (top panels) and DTM (bottom). We find a very tight relation with a ∼0.15 dex scatter estimated by the mean squared error (MSE) between the predicted DGR and true (simulated) DGR of the cross-validation set. This scatter is significantly reduced from ∼0.28 dex when only Zgas is used, showing that the machine learning is effective at generating better predictions for the DGR. Similarly, for the DTM, the scatter is reduced from 0.27 dex when only Zgas is used, to 0.14 using the full ERT mapping.
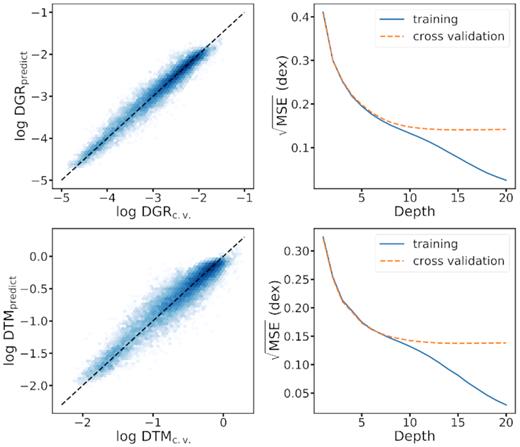
Top left: a hexbin plot of the predicted DGR derived from physical properties of galaxies in the cross-validation set DGRpredict and their ‘real’ DGRcv from the simulation at z = 0. Top right: Mean squared error (MSE) of the predicted DGR compared to the ‘real’ DGR as a function of maximum depths of ERT for both the training set (blue line) and the cross-validation set (orange dashed line). Bottom panels: Analogous to the top panels but for DTM. We use an MSE of the training set to measure the bias of the model (i.e. to what degree can the model fit the real data) and MSE of the cross-validation set to measure the variance (i.e. how sensitive the model is to noises). We choose the optimal depth 20 by trading off biases and variances.
To examine the sensitivity to the ERT tree depth, we show in the right-hand panel of Fig. 7 the MSE as a function of tree depth. We see that increasing the tree depth initially greatly improves predictions, but beyond a depth of |$\gtrsim9$| levels, there is essentially no improvement. This is true for both the DGR and the DTM ratio. At this point, given the sample size and the number of parameters, there is no more information contained in additional tree levels. Hence, we find an optimal maximum ERT tree depth of nine levels for this sample.
Finally, we examine importance levels of the input physical parameters, as returned by the ERT algorithm, shown in Fig. 8. At the optimal depth of 9 levels, the left-hand panel shows that the DGR appears to be most directly correlated with the metallicity, followed by the gas fraction. The depletion time and stellar mass also assist with the fitting at a lower level. As expected, the half-mass radius and the gas surface density do not contribute significant information.
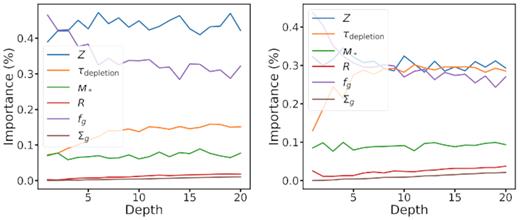
Left: The relative importance of different galaxy properties in predicting DGR. Right: The relative importance of different galaxy properties in predicting DTM. For both DGR and DTM, four most important properties are Zgas, τdepletion, fg, and M*.
The trends are broadly similar for the DTM, as shown in the right-hand panel of Fig. 8. However, it now appears that the metallicity, depletion time, and gas fractions all show similar levels of importance. The stellar mass still shows lower importance, and Rb,50 and Σg are again irrelevant.
In summary, our ERT-based machine learning framework is able to significantly improve the predictive power for the DGR and DTM relations. Using only Zgas results in scatters of ∼0.3 dex, while using the ERT-generated mapping reduces the scatter to ∼0.15 dex. The key quantities driving this are the metallicity, gas fraction, depletion time, and (to a lesser extent) stellar mass, while in simba the dependencies on the baryonic half-mass radius and gas surface density are negligible. The map determined via ERT using simba can be applied by modelers who usually have no information about dust or do not track dust evolution in a self-consistent way, which will provide a more accurate estimation of dust mass than that based on a simple assumption of DGR (or DTM). Alternatively, observers with information about these global galaxy quantities can utilize these algorithms to estimate the DGR or DTM in their galaxies.
4 DISCUSSION
4.1 Physical underpinnings
We now take a deeper dive in to the details of the trends of the DGR with various physical properties, by examining the correlations of the DGR versus various galaxy physical quantities as shown in Fig. 5. We focus our discussion on the DGR, as the trends and interpretations for the DTM ratio are analogous.
In Fig. 5(a), we show the DGR–Zgas relation. At |${\it Z}\, \lt\, 0.2 \, \mathrm{Z}_\odot$|, the relation is roughly linear, corresponding to an approximately constant but low DTM (cf. Fig. 6a). While there is a steep increase from |${\it Z}\sim 0.2 \, \mathrm{Z}_\odot$| to |${\it Z} \sim 0.5 \, \mathrm{Z}_\odot$|, the relation is again roughly linear at |${\it Z} \,\gt 0.5 \, \mathrm{Z}_\odot$|, corresponding to an approximately constant DTM ∼ 0.8 (see Fig. 6a). These three different trends shows three different regimes of dust enrichment. At lower Zgas, the galaxies are underevolved and the dust enrichment is dominated by dust production via condensation of ejecta from late-stage stars. In the intermediate Zgas regime, dust growth via accreting gas-phase metals gradually take over the enrichment process. At higher Zgas, the growth is extremely strong and the dust mass is mainly determined by the gas-phase metals available for accretion.
In Fig. 5(c), we show the DGR–M* relation. The relation flattens after |$M_*\gtrsim10^{9.5} {\rm M}_\odot$|. This transition follows the flattening of the metal–metallicity relations above a comparable M* (Tremonti et al. 2004; see fig. 9 in Davé et al. 2019) plus the fact that the DGR primarily traces the galaxy metallicity as Fig. 5(a) shows. At higher masses, most galaxies are quenched, so the DGR actually drops and has a large scatter owing to dust destruction.
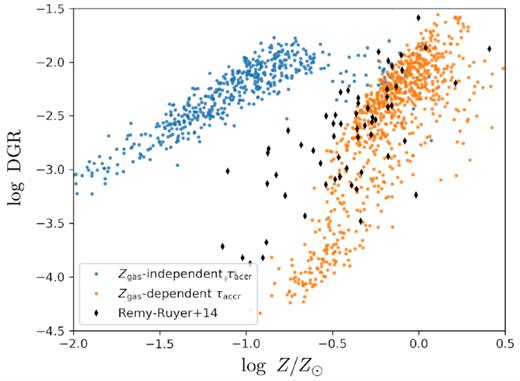
A comparison of DGR–Zgas relations from two test runs where accretion time-scales τaccr (cf. equation 5) are dependent (as adopted by Popping et al. 2017; Hou et al. 2019; and our work) or independent (as adopted by McKinnon et al. 2017) of Zgas. These test runs have the same mass resolution as the primary simba run, but have 2563 dark matter particles and 2563 gas elements in a cube of |$25h^{-1}\, {\rm Mpc}$|. It shows Zgas-dependent τaccr is essential to reproduce the observed relation.
In Figs 5(b) and (e), we show the DGR–τdepletion and DGR–fg relation, respectively. Galaxies with lower fg and τdepletion, which implies that they are quiescent and highly evolved, tend to have a higher DGR. The relations are flatter at low fg and τdepletion, because the rapid grain growth due to abundant metals is countered by enhanced destructive processes, i.e. shock waves from supernovae, thermal sputtering, and astration. These trends shows the correlation between DGR and galaxy evolutionary stages that proceeds as star formation deplete gas and build up metals. We note, that there are high-M* (usually high-Zgas) galaxies, whose fg is still relatively high and whose star formation rates are not highly suppressed, having a relatively low DGR. A similar situation applies to some low-M* galaxies. This contributes to the scatter in the DGR–Zgas plane.
We conclude that the DGR (and DTM) can be determined by Zgas along with M* that reflects the chemical enrichment history and τSF along with fg that indicates the evolutionary stage of galaxies. Physically, this suggests that metal enrichment history reflected by Zgas and M*, and evolutionary stages quantified by τdepletion (see also Asano et al. 2013; Zhukovska 2014; Feldmann 2015) and fg (see also De Vis et al. 2019) are the main drivers of the scatter in the DGR−Zgas plane. Meanwhile, galaxy compactness as quantified by Rb,50 and Σg does not seem to impact the DGR or DTM, showing that at least in simba dust content is insensitive to galactic structure – with the caveat that given simba’s ∼1 kpc resolution, galactic structure may not be faithfully modelled in detail.
4.2 Comparison with other models
The DMF and the DGR–Zgas relation have been studied by cosmological hydrodynamic simulations (McKinnon et al. 2017; Hou et al. 2019) and semi-analytic models (Popping et al. 2017). Like McKinnon et al. (2017) and Popping et al. (2017), our work predicts that the DMF increases monotonically from z = 2 to 0 at the high-mass end (Md ≳ 108M⊙), and is unable to simultaneously match the z = 0–2 DMF. Nevertheless, our result appears to have the closest match to observations to date, underpredicting the z = 2 DMF by a factor of ∼3, which is significantly better than McKinnon et al. (2017) where galaxies with Md ≳ 108 M⊙ are hardly produced. On the other hand, Hou et al. (2019) tracks two types of grains (small/large) and grain–grain shattering and coagulation. They also implement a subgrid-model to boost the density of unresolved dense gas, which is not adopted by our model (therefore we use a short τref) and a simple AGN feedback model to suppress star-forming activity of massive galaxies. They are able to reproduce the non-monotonic trend of the high-mass-end DMF evolution from z = 2 to 0, which was observed by Dunne et al. (2011). However, they fail to match the observed DMF at z = 0 (where they overproduce high Md galaxies) to z = 2 (where they underproduce high Md galaxies).
What steps forwards are necessary for simulations to match the observed z = 2 DMF? Some possible solutions include (1) implementing dust yields in stellar ejecta as a function of a star’s mass and metallicity (Ferrarotti & Gail 2006; Bianchi & Schneider 2007; Zhukovska et al. 2008; Nanni et al. 2013; Schneider et al. 2014), or the local ISM density or temperature, as pointed out by McKinnon et al. (2017); (2) tracking the evolution of grains with different sizes (see e.g. Hou et al. 2019 for two-size grains and McKinnon et al. 2018; Aoyama, Hirashita & Nagamine 2019 for a continuous distribution of grain sizes). Solution #2 will be implemented in an upcoming paper. We expect that a non-monotonic evolution of high-mass-end DMF would result from the intensified grain–grain collisions at lower redshift that will generally lead to an increasing abundance of smaller grains that experience faster destruction.
Turning to the DGR–Zgas relation: The simulations by McKinnon et al. (2017) obtain a rather flat relation between the DGR and gas-phase metallicity from low Zgas to high Zgas, mainly because their accretion time-scale for dust growth (see equation 5 of McKinnon et al. 2016) does not vary with the local ISM Zgas. We find that the dependence of the accretion time-scale on metallicity is essential to reproduce the observed DGR–Zgas relation as is shown in Popping et al. (2017), Hou et al. (2019), and our work, in our case by the results of two test runs in Fig. 9. If we assume a metallicity-independent accretion time-scale, then we get a flatter and higher relation (blue points) compared to the Rémy-Ruyer et al. (2014) observations. The actual observations are slightly shallower than the predictions from the metallicity-dependent model, suggesting that perhaps our metallicity dependence should be softened somewhat.
Similar to Popping et al. (2017), our results show a weak evolution of the DGR–Zgas relation from z = 0 to 6, especially for high-metallicity galaxies. This is encouraging given that the underlying galaxy formation models (SAM versus hydrodynamic) are rather different from one another. Beyond this, the treatment of dust growth in both models is different: grain growth by accretion in our work does not use the information of any detailed subgrid ISM model, whereas in the Popping et al. (2017) SAM, the accretion time-scale is calculated by inferring the gas density in molecular clouds from SFR laws. The fact that these two very different models arrive at the same conclusion for a relatively modest evolution in the DGR-Z relation likely underscores its robustness. On the other hand, Hou et al. (2019) shows that the DGR at a fixed Zgas builds up significantly a factor of ∼5 from z = 5 to 0. This discrepancy mainly comes from the different treatment of grain growth and feedback. Grain growth in our simulation is overall stronger; therefore, our simulated galaxies are able to reach the quasi-static states within a shorter period of time. Moreover, simba has a more sophisticated feedback mechanisms that suppress further metal enrichment at lower redshifts, particularly in massive galaxies.
Hou et al. (2019) explores the scaling relations with a variety of galaxy properties other than Zgas. Comparing Figs 5(c) and (e) against their figs 4(b) and (d), we find that the trend predicted by both simulations are similar but there are big discrepancies at the high M* (M* > 109.5M⊙, the turning point of mass–metallicity relation) and low-fg end, where Hou et al. (2019)’s model overproduces the DGR compared against observational constraints. In this regime, our DGR–M* and DGR–fg relations flatten. The sophisticated black hole feedback model in simba compared to the simple phenomenological AGN feedback model used in their work that may underestimate the suppressing power can explain the difference. A similar analysis applies to the low fg regime, where most of the galaxies are highly evolved and massive, and black hole feedback mechanisms are influential.
4.3 Caveats
Here, we point out some caveats of our simulation. First, we note that the choice of free parameters for dust production, grain growth, and grain destruction via SNe shocks are not well constrained (cf. Table 1) and most likely degenerate. Though grain growth dominates the evolution of dust content, a combination of free parameters different from what is chosen in this work could potentially lead to an equally good (or even slightly better) match to observations, e.g. one with stronger production, weaker grain growth and stronger destruction, or one with stronger grain growth and much stronger destruction. On the other hand, the observed metallicities depend strongly on which strong-line calibration is used. The match to De Vis et al. (2019) would be worse if e.g. calibrations of Pettini & Pagel (2004) are used instead of Pilyugin & Grebel (2016).
Besides, dust plays an important role in cooling and shielding gas, catalyzing important chemical reactions (e.g. formation of molecular hydrogen) and recombination processes, and alternating the interstellar radiation fields. However, dust in our simulation only affects the ISM by depleting gas-phase metals thus reducing the efficiency of gas cooling channels. Work to implement the dust physics in a fully self-consistent manner is under way.
Beyond this, in our current model implementation, dust grains are fully coupled to gas flows. In reality, dust grains can be decoupled from gas due to radiative forces and lack of pressure and experience/apply drag forces from/to gas (Squire & Hopkins 2018; Hopkins & Squire 2018a, b). Dust grains in this work are assumed to have the same grain size to capture the major processes that evolve the dust mass. In the future, we will implement ‘active’ dust particles that are not strictly coupled to gas to track the evolution of grain-size distributions and take grain–grain collisions into account. As mentioned in Section 4.2, we expect the evolution of the grain–size distribution would alter the evolution of the cosmic dust content. The use of dust superparticles to sample the spatial distribution of dust would also save the memory usage, making it computationally feasible to track multiple-size grains in a large volume cosmological simulation, even though we expect the effect on dynamics would be negligible because of the lack of spatial resolution of our large-volume cosmological simulations and strong radiative fields.
Finally, the 100|$h^{-1}\, {\rm Mpc}$|simba volume lacks the resolution to resolve a multiphase ISM, which is a common issue for large-volume cosmological simulations. As a result, parameters such as the reference accretion time-scale τref have to be tuned such that the effective gas density is boosted. We also assume fixed dust destruction and condensation efficiencies, which may actually be functions of local ISM properties (Seab & Shull 1983; McKee et al. 1987; Ferrarotti & Gail 2006; Bianchi & Schneider 2007; Zhukovska et al. 2008; Yamasawa et al. 2011; Nanni et al. 2013; Schneider et al. 2014; Temim et al. 2015). Calibrating parameters we have used against numerical simulations of resolved ISM is one potential approach to make improvement.
5 SUMMARY
We have developed a self-consistent model for the formation, growth and destruction of dust in the simba cosmological galaxy formation simulation, and used these to compare to predictions to observed predictions, as well as study the physical drivers of the DGR and DTM in galaxies. We also develop a machine learning framework to relate the DGR and DTM to various input global galaxy properties. Our main results are as follows:
Our main results follow:
simba broadly reproduces the observed DMFs across the measured redshifts of z = 0–2, albeit with modest underprediction at high-z. The low-mass end steepens at high redshift.
We find a relationship between the DGR of star-forming galaxies and their gas-phase metallicity such that lower metallicity galaxies have lower DGRs. This is broadly in accord with observations. There is little evolution with redshift in this relationship. Meanwhile, quenched galaxies show lower DGR and essentially no relationship in this space (Fig. 3). This non-constant dust-to-metals ratio with metallicity (equation 9) has implications for galaxy formation models that historically have assumed a constant dust-to-metals ratio (see e.g. Silva et al. 1998; Granato et al. 2000; Baugh et al. 2005; Lacey et al. 2010; Narayanan et al. 2010; Fontanot & Somerville 2011; Niemi et al. 2012; Somerville et al. 2012; Hayward et al. 2013; Narayanan et al. 2015, 2018a, b; Cowley et al. 2017; Katz et al. 2019; Ma et al. 2019).
The DTM ratio versus metallicity relation drops at low metallicity, akin to the DGR relationship (Fig. 4). This is consistent with low-redshift result, yet may be in tension with observational constraints at low metallicities at high redshifts from GRBs and DLAs. Other trends are qualitatively similar to those of the DGR.
In order to help both modelers and observers estimate more accurate DGR and DTM ratios, we have developed a publicly available machine learning framework that generates a mapping between the DGR and DTM ratio and a set of galaxy physical properties, showing that it depends significantly on various galaxy properties. The machine learning framework reduces the scatter in the prediction from ∼0.3 dex in the DTM and DGR using a simple fit to Zgas alone, down to ∼0.15 dex using the machine learning framework. This code is available at https://bitbucket.org/lq3552/dust_galaxy_analyzer.
While the DGR and DTM ratios depend most sensitively on the gas-phase metallicity in galaxies, we demonstrate that there are important secondary relationships between these ratios and the depletion time-scale, stellar mass, and gas fraction of galaxies (Fig. 5). The DGR and DTM ratio both drop to lower M*, and rise to lower fgas and gas depletion times. There is no dependence on gas surface density and baryonic half-mass radius. Hence, dust content is governed by both long-term evolutionary processes such as metal content and stellar mass, as well as short-term variations such as varying gas content and (commensurately) depletion times.
Overall, the simba dust model is at least as successful compared with other current dust models implemented in cosmological simulations. However, there remain various caveats and potential directions for improvement. These include having active dust (not tied to the gas), multiple dust grain sizes, and implementing more sophisticated dust cooling. Furthermore, there are various free parameters that are constrained indirectly by observations, which might be better constrained using high-resolution ISM simulation. By using such a multiscale approach to combine high-resolution simulations and observational constraints into a cosmological galaxy formation model, we are moving towards more comprehensively studying the evolution of galaxy dust on cosmological scales.
ACKNOWLEDGEMENTS
The authors acknowledge helpful discussions with Ryan McKinnon, Gergo Popping, and Paul Torrey, and thank the anonymous referee for constructive comments. QL acknowledges support from the University of Florida Informatics Institute. QL and DN acknowledge support from the NSF via grant no. AST-1715206, and the Space Telescope Science Institute via HST AR-15043.0001. RD acknowledges support from the Wolfson Research Merit Award programme of the UK Royal Society. This work used the DiRAC@Durham facility managed by the Institute for Computational Cosmology on behalf of the STFC DiRAC HPC Facility. The equipment was funded by BEIS capital funding via STFC capital grants ST/P002293/1, ST/R002371/1 and ST/S002502/1, Durham University, and STFC operations grant no. ST/R000832/1. DiRAC is part of the National e-Infrastructure. Some of the simulations presented here were performed on the University of Florida HiPerGator2.0 supercomputing facility, and the authors are grateful to the staff that supports the software and hardware on HiPerGator.
Footnotes
Note – because our condensation efficiency for Type-II SNe is tuned to match the low-Z end of the local DGR–metallicity relation, the z = 0 version of this relationship in the remainder of this paper should be treated as matching observations by construction, and not as a bona fide prediction.
