


ABSTRACT
We present Very Large Telescope/X-shooter and Chandra X-ray observatory/ACIS observations of the ULX [SST2011] J110545.62 + 000016.2 in the galaxy NGC 3521. The source identified as a candidate near-infrared counterpart to the ULX in our previous study shows an emission line spectrum of numerous recombination and forbidden lines in the visible and near-infrared spectral regime. The emission from the candidate counterpart is spatially extended (∼34 pc) and appears to be connected with an adjacent H ii region, located ∼138 pc to the NE. The measured velocities of the emission lines confirm that both the candidate counterpart and H ii region reside in NGC 3521. The intensity ratios of the emission lines from the ULX counterpart show that the line emission originates from the combined effect of shock and photoionization of low metallicity (12 + log (O/H) = 8.19 ± 0.11) gas. Unfortunately, there is no identifiable spectral signature directly related to the photosphere of the mass-donor star in our spectrum. From the archival Chandra data, we derive the X-ray luminosity of the source in the 0.3–7 keV range to be (1.9 ± 0.8) × 1040 er g cm−2 s−1, almost a factor of four higher than what is previously reported.
1 INTRODUCTION
An ultraluminous X-ray source (ULX) is defined as a point-like, off-nuclear source with an X-ray luminosity LX larger than the Eddington luminosity for a 10 M|$\odot$| black hole, i.e. LX > 1039 erg s−1 (Kaaret, Feng & Roberts 2017). To explain these high luminosities, different possibilities on the nature of the accretors powering the ULX are considered. The first possibility is the ULX being powered by a stellar mass compact object either emitting anisotropically (King et al. 2001), or accreting at super-Eddington rates (Begelman 2002; Moon, Eikenberry & Wasserman 2003; Gladstone, Roberts & Done 2009). Though a bona-fide black hole (BH) ULX is yet to be confirmed, several neutron star ULXs have been discovered in the past years (e.g. Bachetti et al. 2014; Fürst et al. 2016; Israel et al. 2016, 2017; Carpano et al. 2018), in line with the proposed super-Eddington accretion.
The second possibility is that the accretor is a BH more massive than 10 M|$\odot$| (e.g. Zampieri & Roberts 2009), i.e. with masses similar to the BHs whose merger produced gravitational waves (e.g. Abbott et al. 2016). The third possiblity is that the ULX harbours a BH much more massive than the systems in the first two scenarios, but less massive than the BHs in the centre of most galaxies. These type of BHs would accrete at sub-Eddington rates, have masses between 102 and 105 M|$\odot$| and are called intermediate mass black holes (IMBHs) (e.g. Farrell et al. 2011; Mezcua et al. 2013; Earnshaw 2016).
A reliable way to identify which accretor powers the ULXs is by dynamical mass measurements. To date, a mass constraint is available for the neutron star ULX M82-X2 (Bachetti et al. 2014), estimated through the detection of pulsations in the source. That technique can only be used for ULXs powered by neutron stars, so in the absence of pulsations, astronomers have focused on detecting the donor star (e.g. Patruno & Zampieri 2008; Heida et al. 2016; Vinokurov, Fabrika & Atapin 2018; Qiu et al. 2019). If detected, spectroscopic observations can be used to constrain the radial velocity amplitude, and hence, provided the orbital period is determined as well from those data, the black hole mass function (e.g. Motch et al. 2011).
On the other hand, other studies have focused on the analysis of the environment in which a ULX is embedded. Thanks to their high luminosities, ULXs can have a strong effect on their surroundings, i.e. ionizing the gas around them. This is done either by photoionization due to the high X-ray and UV luminosity of the ULX, or by shock ionization caused by jets, or outflows or disc winds. Examples of ULXs photoionizing the nebula surrounding them are Holmberg II X-1 (Pakull & Mirioni 2002; Kaaret, Ward & Zezas 2004; Moon et al. 2011) and NGC 5408 X-1 (Soria et al. 2006); while ULXs responsible for shock ionizing the material around them are IC 342 X-1 (Grisé, Pakull & Motch 2006b; Cseh et al. 2012), Holmberg IX X-1 (Miller 1995; Grisé, Pakull & Motch 2006a; Moon et al. 2011), and M51 ULX-1 (Urquhart et al. 2018).
To distinguish whether a nebula surrounding the ULX is photoionized or shock ionized, one should look at the spectra. A high [S ii]/H α line ratio, i.e. >0.4, is a sign of shock ionization (Dodorico, Dopita & Benvenuti 1980). The electron temperature Te in a shock ionized region is higher than in a photoionized region (Urquhart et al. 2018). The shock ionization models from Allen et al. (2008) show that a high Balmer decrement can be caused by ionizing shocks with velocities >100 km s−1. Furthermore, the diagnostic diagrams from Dopita et al. (1984) that use the [O ii] λ3727/Hβ, [O iii] λ5007/Hβ, [N ii] λ6584/Hβ, and [S ii] λ6731/Hβ ratios, could shed some light on the shock velocities of the ionized gas. There is, sometimes, the presence of collimated jets (e.g. Pakull, Soria & Motch 2010; Soria et al. 2010, 2014) in shock ionized nebulae, evident in the elongated morphology of the nebula with symmetrical lobes. Nonetheless, in a large number of cases the nebula has both photoionized and shock ionized gas present (e.g. Roberts et al. 2003; Abolmasov et al. 2007a,b; Urquhart et al. 2018).
We performed a systematic search in the NIR to identify possible counterparts to nearby ULXs (López et al. 2017), where we detected several red supergiant candidates, some of which we followed-up spectroscopically. In this work, we present the results for one of these sources in particular, [SST2011] J110545.62 + 000016.2 (hereafter J1105) in the galaxy NGC 3521, which turned out to be a nebula. We describe the target in Section 2 and the observations and data reduction of the spectra in Section 3. Our results are presented in Section 4 and discussed in detail in Section 5. We conclude in Section 6.
2 TARGET
We present the analysis of VLT/X-Shooter spectra of the NIR counterpart to J1105 in NGC 3521. López et al. (2017) detected the NIR counterpart for J1105, with an absolute magnitude H = −10.93 ± 0.93 (consistent with it being a red supergiant candidate), assuming a distance to NGC 3521 of 14.19 ± 2.84 Mpc (Walter et al. 2008) (see Table 1). J1105 is located on the northern side of the spiral arms of NGC 3521, approximately 10.9 kpc (152 arcsec) from its nucleus. According to Coccato et al. (2018), the radial velocity of NGC 3521 at 30 arcsec (2.1 kpc) from its centre is 175 ± 50 km s−1. Bagetakos et al. (2011) estimated that at 23.8 kpc (459 arcsec) the radial velocity of H i is 220 ± 10 km s−1. It is worth noting that Bagetakos et al. (2011) assumed a distance to NGC 3521 of 10.7 Mpc. If we assume a distance of 14.19 ± 2.84 Mpc, 459 arcsec corresponds to 31.6 kpc. Since we do not have any more information about the radial velocity of NGC 3521 at other positions, only the two mentioned before, we adopt the galactic radial velocity at the location of J1105 as 200 ± 25 km s−1.
Selected properties of the host galaxy of the observed ULX counterpart.
| Galaxy | Morphological | Distance | Axis ratio | Inclination | ULX distance to |
|---|---|---|---|---|---|
| type | (Mpc) | (deg) | galaxy nucleus (kpc) | ||
| NGC 3521 | SAB(rs)bca | 14.19 ± 2.84b | 0.51c | 73d | 10.46 ± 2.09 |
| Galaxy | Morphological | Distance | Axis ratio | Inclination | ULX distance to |
|---|---|---|---|---|---|
| type | (Mpc) | (deg) | galaxy nucleus (kpc) | ||
| NGC 3521 | SAB(rs)bca | 14.19 ± 2.84b | 0.51c | 73d | 10.46 ± 2.09 |
3 OBSERVATIONS AND DATA REDUCTION
3.1 X-Shooter data
We obtained spectra of the counterpart to J1105 with X-Shooter (Vernet et al. 2011) on the Very Large Telescope (VLT) UT3 at Cerro Paranal under programme ID 0100.D-0660(B) on 2018 March 31. The spectra were taken in service mode.
X-Shooter has three spectroscopic arms that together provide spectral coverage from the near-UV to the near-IR. We used a slit width of 0.8 arcsec in the UVB arm, 0.7 arcsec in the VIS arm and 0.6 arcsec in the NIR arm, resulting in resolutions of ∼6200, ∼11400, and ∼8100, respectively. Five ABBA nodding sequences with a 5 arcsec nodding throw were used. The integration times for individual exposures for the UVB, VIS, and NIR arms were 260, 210, and 285 s, respectively. The total exposure times were 5200 s for the UVB arm, 4200 s for the VIS arm, and 5700 s for the NIR arm. The airmass during our observations was ∼1.1, and the seeing at the start and end of our observations was 0.39 and 0.4 arcsec, respectively. The slit was aligned to the parallactic angle, which at the beginning of the observation was 206° and at the end of the observation, 180°. During our observations, the night was between clear and photometric.
We reduce the data with the reflex environment (Freudling et al. 2013), processing the observations of J1105 and a standard star observed at similar airmass and close in time to the target. In the reflex environment, the workflow designed for X-Shooter data produces flat-fielded, sky-subtracted, wavelength- and flux-calibrated 1D and 2D spectra. The flux calibration is done using the instrument response curve, derived from the observation of the standard star (see Moehler et al. 2014). The rms of the wavelength correction is 0.03 Å for the UVB and VIS regions, and 0.1 Å for the NIR region. Since the spectrum for J1105 is an emission line spectrum (see below), we do not perform telluric corrections. We estimate the slit-losses assuming the slit transmission factor used by ESO1 and a constant seeing, which yields losses of 8 |${{\ \rm per\ cent}}$|, 4 |${{\ \rm per\ cent}}$|, and 2 |${{\ \rm per\ cent}}$|, in the UVB, VIS, and NIR regions, respectively (see e.g. Spanò et al. 2006).
To calculate the flux, the full width half-maximum (FWHM), velocity dispersion σ, and radial velocity of the emission lines in the three X-Shooter spectral regions, we fit Gaussian curves to them. To estimate the uncertainties of these fits, we perform a Monte Carlo simulation. We assume that the noise of the spectrum is Gaussian with a mean equal to zero and a standard deviation equal to the value of the rms in each spectral region. We then make 1000 copies of the spectrum of the object, where each copy is the result of adding a value of this Gaussian distribution of the noise to every data point. Finally, we fit the emission lines in the resulting spectrum. The standard deviation of each parameter distribution is assumed to be its uncertainty. We add statistical uncertainties in quadrature, i.e. the rms of the wavelength correction plus the fit uncertainty. All values taken from the literature are presented with their published uncertainties.
3.2 Chandra data
We calculate the column of neutral hydrogen NH and the X-ray flux by analysing the Chandra/ACIS archival observation ID 9552 of J1105. This observation was performed on 2008 January 28, with an exposure time of 71.5 ks. We reprocess the event files with the latest calibration files (caldb version 4.8.1) using the CIAO 4.10 software (Fruscione et al. 2006). We extract a source spectrum with the ciao task specextract, using the X-ray position of J1105 (Liu 2011). We then create a source region of 2 arcsec centred on J1105, and a background region with with inner and outer radii of 10 and 30 arcsec, respectively, both centred on J1105. Using the ciao task pileup_map we derive that pile-up is less than 4 per cent at the position of the source. We rebin the extracted source spectrum such that each channel has at least 30 X-ray photons. We fit the extracted spectra using the heasoft xspec tool version 12.10.1 (Arnaud 1996). We exclude photons detected outside the range 0.3–7 keV as this energy interval is the best calibrated and most sensitive range for Chandra. We find that a fit-function consisting of an absorbed power law describes the data well (phabs × pegpwr in xspec; χ2 = 51.45 for 59 degrees of freedom, see Fig. 1). The best-fitting power-law index is 2.58 ± 0.09 for an NH = (0.44 ± 0.04) × 1022 cm−2.
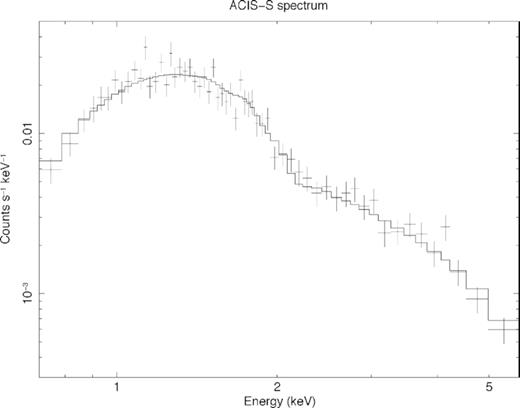
Chandra ACIS-S spectrum of J1105 in the 0.3–7 keV energy region fitted with an absorbed power law. For display purposes, the spectrum has been rebinned by maximally 5 bins up to an SNR = 5. The fit was done on the unbinned spectrum. The best-fitting power-law index is 2.58 ± 0.09.
In order to test potential systematic effects related to the fit-function used to describe the X-ray spectrum, we tried a few other well motivated models such as a phabs × (diskbb + pegpwr) to describe the ULX states and a diskpbb to determine the range of values obtained for NH given these different continuum models. Typically, a value of 0.3 × 1022 cm−2 was obtained using these two fit-functions. Therefore, we conclude that the best-fittingNH of 0.4 × 1022 cm−2 that was obtained from our simple absorbed power-law model might have been on the high-end of possible values found when more complex fit-functions were used to describe the X-ray spectrum, and we add this systematic effect to have a final value of NH = (0.44 ± 0.14) × 1022 cm−2. The unabsorbed source 0.3–7 keV flux is then (8.3 ± 1.0) × 10−13 er g cm−2 s−1, which for the distance of NGC 3521, yields LX = (1.9 ± 0.8) × 1040 erg s−1. In contrast, Liu (2011) reported a flux of 1.92 × 10⁻¹³ er g cm−2 s−1, which for the distance of NGC 3521, translates to LX = 4.6 × 1039 erg s−1, a value almost four times lower than our estimate, using a phabs × pegpwr fit with a power-law index of 1.7. It is worth noting that the analysis from Liu (2011) is based on the Chandra observation ID 4694, with an exposure time of 9.4 ks, executed on 2004 March 11. Since this observation was performed 4 yr earlier than the observation we analyse in this work, we can interpret this difference in X-ray luminosities as variability in the source, which is not uncommon in ULXs (see Liu et al. 2019 and references therein).
4 RESULTS
The finding chart for J1105 is shown in Fig. 2 where it can be seen that, due to the orientation of the slit, there are two sources inside it. The NIR counterpart identified in López et al. (2017) falls near the centre of the slit, whereas a brighter extended source is located 2 arcsec (137.6 pc) away (hereafter source B). We extract the spectra from both these sources and analyse them below. In Figs A1 through A6 we provide plots of the regions around the most prominent emission lines
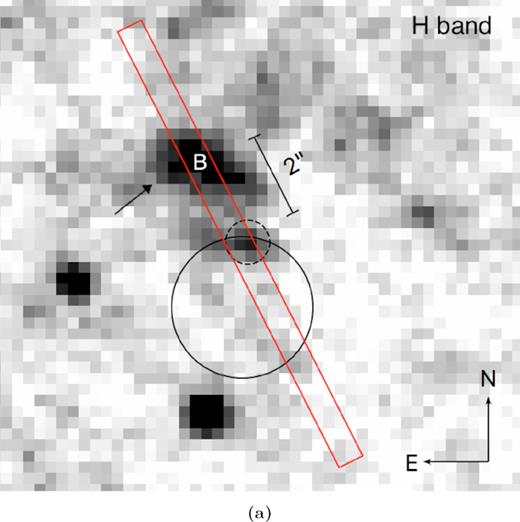
LIRIS H-band image of J1105 (López et al. 2017). The 0.6 arcsec × 11 arcsec X-Shooter slit is indicated in red, the dashed circle indicates the position of J1105 and the solid circle indicates the position of the ULX to a 3–σ confidence level. The extended source B is indicated also with an arrow.
There are several emission lines present in the spectra of both sources (see Table 2). We measure the radial velocity of the emission line region in the three X-Shooter spectral regions separately by fitting Gaussian curves to the lines detected. The average radial velocities found are 238 ± 10 km s−1 for J1105 and 235 ± 4 km s−1 for source B, which are both consistent with the radial velocity of NGC 3521 of 200 ± 25 km s−1, confirming that both objects are not foreground objects.
Theoretical and restframe wavelengths, integrated flux and intrinsic FWHM of the emission lines in the UVB, VIS, and NIR data for both source B and J1105.
| Theoretical | Restframe | Integrated flux | FWHMint | ||||
|---|---|---|---|---|---|---|---|
| Ion | wavelength | wavelength (Å)† | (× 10−17 er g cm−2 s−1) | (Å) | |||
| (Å)* | Source B | J1105 | Source B | J1105 | Source B | J1105 | |
| [O ii] | 3726.032 ± 0.010 | 3726.21 ± 0.04 | 3726.11 ± 0.03 | (1.63 ± 0.01)× 102 | 11.3 ± 0.1 | 0.59 ± 0.03 | 0.84 ± 0.03 |
| [O ii] | 3728.815 ± 0.010 | 3728.88 ± 0.03 | 3728.91 ± 0.03 | (2.29 ± 0.03)× 102 | 16.9 ± 0.1 | 0.63 ± 0.03 | 0.77 ± 0.03 |
| [Fe i] | 3744.10236 ± 0.0002 | – | 3744.22 ± 0.03 | – | 7.81 ± 0.72 | – | 0.65 ± 0.03 |
| [Ne iii] | 3868.76 ± 0.10 | 3868.79 ± 0.01 | 3868.8 ± 0.1 | 4.83 ± 0.01 | 3.1 ± 0.1 | 0.7 ± 0.1 | 0.7 ± 0.1 |
| [He i] | 3888.41607 ± 0.00021 | 3888.54 ± 0.04 | – | 16.2 ± 0.1 | – | 0.86 ± 0.03 | – |
| Hϵ | 3970.0788 ± 0.0022 | 3970.14 ± 0.03 | – | 19.4 ± 0.1 | – | 0.68 ± 0.03 | – |
| Hδ | 4101.7415 ± 0.0024 | 4101.81 ± 0.03 | – | 39.9 ± 0.1 | – | 0.72 ± 0.03 | – |
| Hγ | 4340.471 ± 0.003 | 4340.49 ± 0.03 | 4340.24 ± 0.03 | 77.6 ± 0.3 | 2.59 ± 1.09 | 0.77 ± 0.03 | 1.04 ± 0.03 |
| [Fe ii] | 4436.9204 ± 0.0003 | – | 4436.7 ± 0.1 | – | 0.55 ± 0.04 | – | 0.7 ± 0.1 |
| [Fe ii] | 4452.09585 ± 0.00012 | – | 4452.1 ± 0.1 | – | 1.23 ± 0.01 | – | 0.7 ± 0.1 |
| Hβ | 4861.333 ± 0.003 | 4861.39 ± 0.03 | 4861.54 ± 0.04 | (1.95 ± 0.01)× 102 | 8.86 ± 0.08 | 0.87 ± 0.03 | 0.87 ± 0.03 |
| [O iii] | 4958.911 ± 0.010 | 4959.01 ± 0.03 | 4958.88 ± 0.03 | 60.0 ± 0.2 | 6.71 ± 0.19 | 0.83 ± 0.03 | 1.12 ± 0.03 |
| [O iii] | 5006.843 ± 0.010 | 5006.81 ± 0.03 | 5006.88 ± 0.03 | (1.78 ± 0.02)× 102 | 18.4 ± 0.4 | 0.83 ± 0.03 | 0.83 ± 0.03 |
| [O i] | 6300.304 ± 0.010 | 6300.5 ± 0.2 | 6300.46 ± 0.01 | 7.11 ± 0.40 | 5.83 ± 0.03 | 0.8 ± 0.5 | 0.79 ± 0.04 |
| [S iii] | 6311.21 ± 0.10 | 6311.6 ± 0.1 | – | 1.86 ± 0.64 | – | 1.5 ± 0.5 | – |
| [N ii] | 6548.05 ± 0.10 | 6548.11 ± 0.01 | 6547.87 ± 0.01 | 74.6 ± 1.0 | 7.03 ± 0.07 | 0.76 ± 0.03 | 0.91 ± 0.03 |
| Hα | 6562.819 ± 0.007 | 6562.85 ± 0.01 | 6562.75 ± 0.03 | (7.57 ± 0.07)× 102 | 36.0 ± 0.1 | 0.88 ± 0.03 | 0.96 ± 0.03 |
| [N ii] | 6583.45 ± 0.10 | 6583.48 ± 0.01 | 6583.38 ± 0.03 | (2.22 ± 0.05)× 102 | 24.7 ± 0.1 | 0.85 ± 0.03 | 0.86 ± 0.03 |
| [S ii] | 6716.44 ± 0.01 | 6716.62 ± 0.01 | 6716.63 ± 0.01 | 76.0 ± 0.7 | 15.0 ± 0.3 | 0.79 ± 0.04 | 0.98 ± 0.01 |
| [S ii] | 6730.816 ± 0.010 | 6730.92 ± 0.01 | 6730.83 ± 0.01 | 55.7 ± 0.5 | 8.51 ± 0.04 | 0.81 ± 0.04 | 0.97 ± 0.04 |
| He i | 6678.1517 ± 0.0003 | 6678.11 ± 0.03 | – | 7.4 ± 0.1 | – | 0.81 ± 0.03 | – |
| [Ar iii] | 7135.79 ± 0.04 | 7135.84 ± 0.03 | – | 18.6 ± 0.1 | – | 0.79 ± 0.03 | – |
| [O ii] | 7319.99 | 7320.11 ± 0.01 | – | 4.2 ± 0.1 | – | 0.94 ± 0.03 | – |
| ? | – | 7325.71 ± 0.03 | – | 4.46 ± 0.03 | – | 0.64 ± 0.03 | – |
| [O ii] | 7329.67 ± 0.1 | 7329.59 ± 0.01 | – | 2.25 ± 0.02 | – | 0.65 ± 0.03 | – |
| [O ii] | 7330.73 ± 0.1 | 7330.84 ± 0.03 | – | 2.28 ± 0.01 | – | 0.83 ± 0.03 | – |
| [Ar iii] | 7751.11 ± 0.05 | 7751.14 ± 0.03 | – | 4.31 ± 0.01 | – | 0.82 ± 0.03 | – |
| Pa10 | 9014.910 ± 0.007 | 9015.03 ± 0.03 | – | 6.69 ± 0.65 | – | 1.15 ± 0.04 | – |
| [S iii] | 9069.0 ± 1 | 9068.84 ± 0.02 | 9069.74 ± 0.03 | 46.2 ± 1.3 | 2.38 ± 0.22 | 1.05 ± 0.01 | 2.1 ± 0.1 |
| Pa9 | 9229.014 ± 0.007 | 9229.04 ± 0.01 | – | 7.99 ± 0.96 | – | 1.18 ± 0.01 | – |
| [S iii] | 9530.6 ± 1 | 9530.81 ± 0.02 | 9530.64 ± 0.01 | (1.21 ± 0.25)× 102 | 8.21 ± 0.19 | 1.22 ± 0.03 | 1.69 ± 0.04 |
| Paϵ | 9545.969 ± 0.006 | 9545.47 ± 0.06 | – | 13.7 ± 2.0 | – | 1.3 ± 0.1 | – |
| [Fe i] | 10048.5845 ± 0.0014 | – | 10048.0 ± 0.1 | – | 3.9 ± 2.5 | – | 0.7 ± 0.3 |
| Paδ | 10049.369 ± 0.007 | 10049.9 ± 0.1 | – | 19 ± 2 | – | 1.6 ± 0.1 | – |
| He i | 10830.33977 ± 0.00005 | 10830.4 ± 0.1 | 10830.4 ± 0.1 | 70.3 ± 0.3 | 3.65 ± 0.30 | 1.9 ± 0.1 | 2.1 ± 0.1 |
| Paγ | 10938.086 ± 0.01 | 10938.2 ± 0.1 | – | 34.7 ± 0.1 | – | 1.7 ± 0.1 | – |
| [Fe ii] | 12566.7688 ± 0.0009 | 12567.3 ± 0.4 | – | 8.28 ± 1.94 | – | 2.5 ± 0.6 | – |
| 3He i | 12785.50005 ± 0.00006 | 12785.9 ± 0.5 | 12785.1 ± 0.1 | 2.85 ± 0.01 | 0.75 ± 0.07 | 1.6 ± 1.2 | 1.8 ± 0.1 |
| [N iii] | 12809 ± 1 | 12809.5 ± 0.6 | – | 3.063 ± 0.001 | – | 1.5 ± 1.6 | – |
| Paβ | 12818.07 ± 0.01 | 12818.2 ± 0.1 | 12818.1 ± 0.1 | 70.6 ± 0.1 | 2.22 ± 0.01 | 1.8 ± 0.1 | 2.1 ± 0.1 |
| Br19 | 15260.555 ± 0.009 | 15259.6 ± 0.1 | – | 1.12 ± 0.05 | – | 3.5 ± 0.1 | – |
| Br16 | 15556.466 ± 0.015 | 15556.0 ± 0.1 | – | 1.37 ± 0.07 | – | 3.1 ± 0.1 | – |
| Br13 | 16109.330 ± 0.013 | 16109.3 ± 0.1 | – | 2.39 ± 0.09 | – | 3.4 ± 0.1 | – |
| Br12 | 16407.210 ± 0.016 | 16406.3 ± 0.1 | – | 2.07 ± 0.21 | – | 3.1 ± 0.2 | – |
| [Fe ii]‡ | 16435.5271 ± 0.0019 | 16434.3 ± 0.1 | 16436.3 ± 0.1 | 5.70 ± 0.87 | 0.92 ± 0.10 | 5.7 ± 0.1 | 2.1 ± 0.1 |
| Br11 | 16806.538 ± 0.017 | 16807.0 ± 0.1 | – | 4.09 ± 0.09 | – | 2.3 ± 0.1 | – |
| Br10 | 17362.127 ± 0.018 | 17363.1 ± 0.1 | – | 4.47 ± 0.16 | – | 2.9 ± 0.1 | – |
| Br9 | 18174.141 ± 0.020 | 18173.7 ± 0.1 | – | 5.35 ± 1.64 | – | 2.9 ± 0.1 | – |
| Paα | 18750.976 ± 0.025 | 18751.4 ± 0.1 | 18751.1 ± 0.1 | 91.8 ± 3.1 | 3.99 ± 0.01 | 2.7 ± 0.1 | 2.6 ± 0.1 |
Notes. * Wavelengths are indicated in air, not vacuum, and the reference values are taken from Kramida et al. (2018).
†Corrected for heliocentric motion and peculiar and radial velocity of NGC 3521.
‡The properties of this line are possibly contaminated by the presence of a sky emission line close to the observed wavelength.
We calculate the intrinsic FWHM (FWHMint) of the emission lines. In order to do this, we estimate the instrumental FWHM (FWHMins), i.e. the width that a delta function line would have due to the instrument, given by the resolution of X-Shooter in the respective arms. As indicated in Section 3.1, the resolution R in the UVB, VIS, and NIR arms is 6200, 11 400, and 8100, respectively, and it is defined as R = |$\frac{\lambda }{\Delta \lambda }$|, where Δλ is equivalent to FWHMins. Note that this value is wavelength dependent. We then calculate the FWHMint via the equation FWHMint = (FWHM|$_{\rm obs}^2 -$| FWHM|$_{\rm ins}^2)^{1/2}$|, where FWHMobs is the observed FWHM, i.e. the FWHM we derive by fitting Gaussians to the emission lines. We present the FWHMint in Table 2.
4.1 Nebular source B
4.1.1 UVB spectra
Faint continuum emission is detected in the UVB and VIS regions only of the spectrum from source B. We find the [O ii]λλ3727, 3729 doublet, H β, [Ne iii] λ3868, and [O iii] λλ4956, 5007 lines. We also detect the [Fe i] λ3744 line, although the Gaussian fit to this feature did not converge at the position of source B. So, we deem this a marginal detection for source B.
We also find the [He i] λ3888, Hδ, Hϵ, and Hγ lines. The He ii λ4686 emission line, observed in several ULX nebulae (e.g. Pakull & Mirioni 2002; Kaaret et al. 2004; Gutiérrez & Moon 2014) is not detected with a 2–σ upper limit of 2.26 × 10⁻¹⁹ er g cm−2 s−1.
4.1.2 VIS spectra
We detect [O i] λ6300, [N ii] λ6548, H α, [N ii]λ6583, the [S ii]λλ6716, 6731 doublet, [S iii] λλ9069, 9530, and Paδ emission. Additionally, we detect emission from [He i] λ6678, [Ar iii] λλ7135, 7751, [O ii] λλλ7320, 7329, 7330, Pa10, Pa9, Paϵ, and the temperature sensitive auroral [S iii] λ6312. The latter allows us to calculate the electron temperature Te and density ne, and ion abundances.
Additionally, we detected an emission line only in the spectrum from source B, at the wavelength 7325 Å, which we were not able to identify.
4.1.3 NIR spectra
We detect He i, 3He i, Paβ, Paα, Paγ, [Fe ii] λ12566, [Fe ii] λ16435, [N iii], Br19, Br16, Br13, Br12, Br11, Br10, and Br9 emission.
4.1.4 Emission line analysis
Using the results from the Gaussian fits to the emission lines, we calculate the line flux ratios log ([O iii]/Hβ), log ([N ii]/H α), log ([S ii]/H α), and log ([O i]/H α). As can be seen in Fig. 3, the flux line rations for source B are consistent with those of an H ii region (Kauffmann et al. 2003; Kewley et al. 2006). Moreover, in Fig. 4 we show that the emission lines associated with source B are extended.
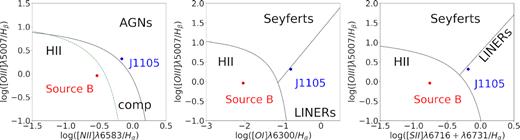
Baldwin–Phillips–Terlevich diagrams for J1105. The green dashed and the black solid lines in the left-hand panel mark the empirical and the theoretical maximum line ratios for H ii regions from Kauffmann et al. (2003) and Kewley et al. (2006), respectively. The red circle represents the line flux ratios at the location of source B, while the blue circle represents the line flux ratios at the location of J1105. The size of error bars is of the order of the size of the symbols. The difference between the dereddened and uncorrected values for the line flux ratios is of the order of the size of the symbols.
![2D image of the VIS part of the X-Shooter spectrum of the NIR counterpart to J1105. Here it can be seen how the [N ii] λ6548, H α, and [N ii]λ6583 emission lines are extended at the position of source B (indicated by the dashed line) along both the spatial and wavelength/velocity axis. The black solid horizontal line indicates the position of the NIR counterpart J1105 on the detector.](https://oup.silverchair-cdn.com/oup/backfile/Content_public/Journal/mnras/489/1/10.1093_mnras_stz2127/1/m_stz2127fig4.jpeg?Expires=1750188156&Signature=Tb~Fy2pofelfv3LO9L5-YRa4Nite0~tVKRC4bQwXEgZvIqEQa3vpPGoTEX9fA4pxN9wo5dpvarGzg~z0HBFVj0oxB0mXpqJY9v2UZgDNjmGfEuMg17NUwoHbO45jezuQ7UpVqDd2D0by3NYIQvySpQCGEesJNW2h7SJr~QyN79U0v8ZbuvCU-GlEVuGoamKF6rPnSfT1N778xq9ErSUx7ZV~OGfXXHmXWKfD~wUDUdlGacb2VAP3G3gg9tdnBALVYB2YhXkpnaAqdWKe5EODnE3jNqaG23Z51xE54e55UoCMZcDS8nKx3H3DaG3WHpDvKT5lWX1EnHtxpXFTCHENkA__&Key-Pair-Id=APKAIE5G5CRDK6RD3PGA)
2D image of the VIS part of the X-Shooter spectrum of the NIR counterpart to J1105. Here it can be seen how the [N ii] λ6548, H α, and [N ii]λ6583 emission lines are extended at the position of source B (indicated by the dashed line) along both the spatial and wavelength/velocity axis. The black solid horizontal line indicates the position of the NIR counterpart J1105 on the detector.
The ne for source B was calculated using both the [O ii] and [S ii] line ratios (Aller, Ufford & van Vleck 1949; Copetti & Writzl 2002; Osterbrock & Ferland 2006) using the temden task from the analysis package in iraf. The calculations give ne[O ii] = 50 ± 15 cm−3 and ne[S ii] = 62 ± 24 cm−3, consistent with each other. These ne values suggest that the H ii region associated with source B is a low-density region (Osterbrock & Ferland 2006). With these values and the [S iii] λ9069, 9530/[S iii] λ6312 intensity ratio (e.g. Osterbrock & Ferland 2006) we calculated a value of Te[S iii] = 8130 ± 1213 K. This method is applicable to densities up to 105 cm−3 (i.e. negligible collisional de-excitations) and assuming an isothermal environment (see Osterbrock & Ferland 2006).
We were also able to calculate the [O ii], [O iii], [S ii], and [S iii] ion abundances, following the equations from Pagel et al. (1992), adequate for low to moderate ne (i.e. up to 103–104 cm−3; Osterbrock & Ferland 2006). Additionally, we determined the empirical oxygen and sulfur abundance indicators, R23 and S23, respectively (Pagel et al. 1979; Vilchez & Esteban 1996), the ionization parameter u (Diaz et al. 1991), and the radiation softness parameter η′ (Vilchez & Pagel 1988). The latter is an indicator on the temperature of the ionizing stars in an H ii region. The derived values are given in Table 3.
Electron temperature and density, and ion abundances for source B and J1105.
| Parameter | Source B | J1105 |
|---|---|---|
| Te | 8130 ± 1213 K | > 5270 K |
| ne[O ii] | 50 ± 15 cm−3 | 5 ± 5 cm−3 |
| ne[S ii] | 62 ± 24 cm−3 | – |
| 12 + log (O ii/H ii) | 7.93 ± 0.14 | – |
| 12 + log (O iii/H ii) | 7.83 ± 0.19 | – |
| 12 + log (O/H) | 8.19 ± 0.11 | – |
| 12 + log (S ii/H ii) | 6.43 ± 0.14 | – |
| 12 + log (S iii/H ii) | 6.69 ± 0.15 | – |
| 12 + log (S/H) | 6.97 ± 0.12 | – |
| log R23 | 0.52 ± 0.03 | – |
| log S23 | 0.182 ± 0.001 | – |
| log U | −2.84 ± 0.08 | – |
| log η′ | 0.30 ± 0.01 | – |
4.2 The ULX counterpart
4.2.1 UVB spectra
We detect the [O ii]λλ3727, 3729 doublet, [Fe i] λ3744, Hβ, [Ne iii] λ3868, and [O iii] λλ4956, 5007 lines. Additionally, we detect emission lines from [Fe ii] λλ4436, 4452. For this source we also do not detect He ii λ4686 emission, with a 2–σ upper limit of 2.12 × 10⁻¹⁹ er g cm−2 s−1.
4.2.2 VIS spectra
We detect [O i] λ6300, [N ii] λ6548, H α, [N ii]λ6583, the [S ii]λλ6716, 6731 doublet, [S iii] λλ9069, 9530, and [Fe i] λ10048 emission. The auroral [S iii] λ6312 line was not detected at the position of J1105 with a 2–σ upper limit of 2.58 × 10⁻¹⁸ er g cm−2 s−1. This implies that we can only place limits on the Te and ne parameters.
4.2.3 NIR spectra
The lines present in the NIR data for J1105 are He i, 3He i, Paβ, [Fe ii] λ16435, and Paα. Faint continuum emission is detected only for J1105. However, the spectrum is too faint to allow us determine if the continuum is stellar.
The total integrated flux of J1105 in the H–band is 1.78 × 10⁻¹⁵ er g cm−2 s−1, which is equivalent to an apparent magnitude of 22.54 ± 2.01, consistent within 2-σ with our reported value of H = 19.83 ± 0.06 mag (López et al. 2017).
4.2.4 Emission line analysis
We also calculate the line flux ratios log ([O iii]/H β), log ([N ii]/H α), log ([S ii]/H α), and log ([O i]/H α) for J1105 and, as can be seen in Fig. 3, they are consistent with those of low-ionization nuclear emission-line regions (LINERs) and active galactic nuclei (AGNs) (Kauffmann et al. 2003; Kewley et al. 2006).
We were not able to calculate ion abundance for J1105, as they are dependent on Te-, ne-, and [S iii] λ6312, and the latter was not detected for J1105. We can, however, obtain a lower limit on the temperature at the location of J1105, assuming that it is a photoionized region, like source B. We follow the same procedure as for source B but we found that the values for the [O ii] and [S ii] line ratios are at the limit of ne → 0. In fact, the [S ii] line ratio is outside the range allowed by photoionization models. We derive a value for ne[O ii] of 5 ± 5 cm−3, that, combined with the upper limit of the [S iii] λ9069, 9530/[S iii] λ6312 intensity ratio, yields Te[S iii] > 5270 K.
5 DISCUSSION
5.1 The ULX counterpart
López et al. (2017) identified a possible counterpart to J1105 as a potential red supergiant based on its photometry. However, using VLT/X-Shooter spectroscopy we find that it has an emission line spectrum, whose line ratios place it in the LINER region of the Baldwin–Phillips–Terlevich (BPT) diagram. These line ratios are different from those of a nearby region called source B (see Fig. 3), and could be interpreted as due to the X-ray emission ionizing the part of the nebular source B that surrounds the ULX. The effects of the bright ULX on its environment has been seen in other H ii regions surrounding (or close to) a ULX (e.g. Mucciarelli et al. 2005; Heida et al. 2015). Since the presence of the ULX seems to affect the line flux ratios of J1105, and its radial velocity is consistent with the radial velocity of NGC 3521 at that position, we deem it likely that the ULX and the nebular source are physically related. Therefore, we refer to J1105 as the counterpart of the ULX although the mass donor star has not been detected so far.
We calculate the extinction at the position of J1105 using the NH we derived by analysing the Chandra archival observations, with observation ID 9552, of the ULX. We obtained NH = (0.44 ± 0.14) × 1022 atoms cm−2, which for a typical value of RV = 3.1, translates to E(B − V) = 0.76 ± 0.24. If we deredden the H α and H β line fluxes with this extinction and then calculate the Balmer decrement, we get unphysical values, i.e. H α/H β < 2 (values only seen in environments with ne > 109 cm−3; Adams & Petrosian 1974). This can be explained if the X-ray emission from the ULX and the emission from the ionized gas comes from different regions, implying that there is more neutral gas in the line of sight towards the X-ray source than towards the gas responsible for the H α and H β emission lines.
In light of this, we decide to calculate the extinction using the Balmer decrement for J1105 (Table 4). Assuming a standard Milky Way gas-to-dust ratio (RV = 3.1; Fitzpatrick 1999b) and an intrinsic Balmer decrement of H α/H β = 3.05 (valid for a typical optically thick nebula in the low density limit, with Te ∼ 5000 K), we derive E(B − V) = 0.27 ± 0.03. The NH corresponding to this extinction is NH = (0.15 ± 0.02) × 1022 atoms cm−2. We then deredden the key fluxes with this two values of extinction and report them in Table 4, where it can be seen that they still place J1105 in the LINER region of the BPT diagram.
Observed and dereddened emission line flux ratios and Balmer decrements for source B and J1105. For the dereddening we used E(B − V) = 0.28 ± 0.01 and E(B − V) = 0.27 ± 0.03 for source B and J1105, respectively (see the text).
| Line | Source B | J1105 | ||
|---|---|---|---|---|
| flux ratio | Observed | Dereddened | Observed | Dereddened |
| log ([O iii] λ5007/Hβ)a | −0.04 ± 0.02 | −0.06 ± 0.02 | 0.32 ± 0.01 | 0.30 ± 0.01 |
| log ([O i] λ6300/Hα)a | −2.03 ± 0.02 | −2.02 ± 0.02 | −0.79 ± 0.01 | −0.78 ± 0.0 |
| log ([N ii] λ6583/Hα)a | −0.53 ± 0.02 | −0.54 ± 0.02 | −0.16 ± 0.01 | −0.17 ± 0.01 |
| log ([S ii] λ6716 + λ6731/Hα)a, b, c | −0.76 ± 0.02 | −0.77 ± 0.02 | −0.185 ± 0.004 | −0.194 ± 0.004 |
| log ([N ii] λ6548 + λ6583/Hα)c | −0.41 ± 0.02 | −0.41 ± 0.02 | −0.055 ± 0.003 | −0.056 ± 0.003 |
| log ([S iii] λ9069 + λ9530/Hα)c | −0.7 ± 0.2 | −0.8 ± 0.2 | −0.53 ± 0.03 | −0.65 ± 0.03 |
| log ([O ii] λ3727/Hβ)d | N/A | N/A | 0.28 ± 0.01 | 0.39 ± 0.01 |
| log ([N ii] λ6583/Hβ)d | N/A | N/A | 0.45 ± 0.01 | 0.31 ± 0.01 |
| log ([S ii] λ6731/Hβ)d | N/A | N/A | −0.02 ± 0.01 | −0.16 ± 0.01 |
| Hα/Hβ | 3.88 ± 0.01 | 2.81 ± 0.01 | 4.06 ± 0.12 | 2.97 ± 0.12 |
| Hγ/Hβ | 0.398 ± 0.003 | 0.452 ± 0.003 | 0.29 ± 0.03 | 0.33 ± 0.03 |
| Hδ/Hβ | 0.205 ± 0.001 | 0.246 ± 0.00 | – | – |
| Hϵ/Hβ | 0.10 ± 0.01 | 0.12 ± 0.01 | – | – |
Notes. aDiagnostic line flux ratios in the BPT diagram, to distinguish AGNs, LINERs, and H ii regions (Kauffmann et al. 2003; Kewley et al. 2006). bLine ratio that distinguishes between shock and photoionized regions (Dodorico et al. 1980). cDiagnostic line flux ratios to distinguish supernova remnants with shocks from H ii regions (Levenson et al. 1995). dLine flux ratios indicative of shock velocities, from the diagrams (Dopita et al. 1984). N/A = not applicable.
From the abundances derived for the extended source B nearby (Table 3), we conclude that J1105 resides in a low-metallicity environment. This is in line with previous findings that ULXs are preferentially found in low-metallicity environments (e.g. Kaaret, Schmitt & Gorski 2011; Walton et al. 2011; Prestwich et al. 2013; Basu-Zych et al. 2016). As stated above, the dereddened line flux ratios of J1105 place it in the LINER region of the BPT diagram. Though the power source behind the emission of a LINER is under debate, several explanations have been considered, e.g. photoionization by hot young stars (Terlevich & Melnick 1985; Shields 1992), low-luminosity AGNs (Ferland & Netzer 1983; Halpern & Steiner 1983), planetary nebulae (Taniguchi, Shioya & Murayama 2000), or exposed cores of evolved stars (Singh et al. 2013; Belfiore et al. 2016), or shock-ionization (Heckman 1980; Dopita et al. 1996). We further investigate whether the latter is the case for J1105. We first analyse the [S ii]/H α ratio, which distinguishes between shock ionized and photoionized regions: shock ionized regions have [S ii]/H α > 0.4 (Dodorico et al. 1980). The dereddened ratio for source B is 0.17, a typical value for H ii regions (Levenson et al. 1995; Payne, White & Filipović 2008), whereas J1105 has a dereddened ratio of 0.64. Moreover, in the line flux ratio diagrams often used to distinguish between supernova remnants with shocks and H ii regions by Levenson et al. (1995), J1105 falls in the supernova remnants region while source B is consistent with being an H ii region (Table 4). Another clue on whether J1105 is shock ionized could come from the [O ii] λ3727/Hβ, [N ii] λ6584/Hβ, and [S ii] λ6731/Hβ ratios. Our dereddened values (Table 4) are consistent with shock velocities between 50 and 80 km s−1 (Dopita et al. 1984). When we compare with the FWHMs from J1105 (see Table 2), we find that the average FWHM for this source is 50 ± 1 km s−1, whereas for source B it is 45 ± 1 km s−1. Hence, our results are consistent with the diagrams from Dopita et al. (1984).
We estimate the mechanical power Pjet of J1105. According to Weaver et al. (1977) and Cseh et al. (2012), for a nebula which is shock ionized, Pjet ∼ 2.85Lrad, where Pjet is the power that inflates the nebula bubble and Lrad is the radiative luminosity of the bubble. Following Dopita & Sutherland (1996), Abolmasov et al. (2007b), Allen et al. (2008), and Cseh et al. (2012) we know that |$L_{{\rm H}\beta } = 6.53 \times 10^{-3} v_{100}^{-0.59}L_{{\rm rad}}$| where LH β is the luminosity from H β emission and v100 is the shock velocity in units of 100 km s−1. This means that |$P_{{\rm jet}} = 437 v_{100}^{0.59}L_{{\rm H}\beta }$|. To calculate LH β, we deredden our H β flux using E(B − V) = 0.27 ± 0.03, which at the distance of NGC 3521, is equivalent to LH β = 5.25 × 1036 erg s−1. Hence, for shock velocities between 50 and 80 km s−1, Pjet is (1.52–2.01) × 1039, i.e. almost one-tenth of our derived X-ray luminosity of the ULX and 0.3–0.4 times the X-ray luminosity derived by Liu (2011). In comparison, for ULX IC 342-X1, |$P_{{\rm jet}} \sim \frac{1}{20}L_X$| (Cseh et al. 2012), for M51 ULX-1, Pjet ∼ LX (Urquhart et al. 2018) and for S26, Pjet ∼ 104LX (Pakull et al. 2010).
As we have seen in other nebulae surrounding ULXs (e.g. Lehmann et al. 2005; Fabrika et al. 2006; Abolmasov et al. 2007a,b), both photoionized and shock ionized gas is present. We consider the possibility that shocks are not the only ionization source and the X-ray emission from J1105 is photoionizing the region as well. To investigate this scenario further, we calculate the Strömgren radius RS (Strömgren 1939), i.e. the radius of the photoionized region, if any, expected to be created by J1105 (see e.g. Roberts et al. 2003). First we need to calculate the hydrogen ionizing flux Q, which correlates with LHβ as LHβ = 4.8 × 10⁻¹³Q erg s−1 (Osterbrock & Ferland 2006). This gives a value of Q = 1.1 × 1049 photons s−1, and assuming a filling factor ϵ between 0.01 and 0.5, a typical range for most H ii regions (Osterbrock & Ferland 2006) and |$T_\mathrm{ e} = 10\, 000$| K, we get 30 <RS < 111 pc. In comparison, assuming spherical symmetry, we estimate a radius of ∼34 pc for J1105 from its appearance in our H-band image. So, for a ϵ < 0.35, it would be possible for J1105 to be photoionizing the entirety of the region. However, we do not need the entirety of the region to be photoionized, since we are inferring that the total ionization is a combination of X-ray photoionization and shock ionization. Alternatively, a wind blown off the accretion disc of the ULX can also cause shock ionization (Abolmasov et al. 2007a; Kaaret et al. 2017). In fact, powerful disc winds have been observed in a few ULXs (e.g. Pinto, Middleton & Fabian 2016; Walton et al. 2016; Pinto et al. 2017; Kosec et al. 2018).
5.2 Nebular source B
The nebular ion abundances for source B are consistent with those seen in other H ii regions (see e.g. Pérez-Montero et al. 2003; Pérez-Montero & Díaz 2005). The ne value is at the low density end, whereas typical ne in H ii regions are of the order of 102 cm−3 (Osterbrock & Ferland 2006). The density that we obtain, within uncertainties, is seen in nebulae like NGC 281 and NGC 7000 (Roger & Pedlar 1981; Osterbrock & Ferland 2006).
Moustakas et al. (2010) studied the metallicity of NGC 3521 in an area enclosing ∼ 49 |${{\ \rm per\ cent}}$| of the integrated light, up to 3.9 kpc from the nucleus. The oxygen abundance they calculated is 12 + log (O/H) = 9.08 ± 0.06, which could be consistent with our value of 8.19 ± 0.11, since metallicity in spiral galaxies decreases with distance to the nucleus (Pagel & Edmunds 1981; Deharveng et al. 2000; Magrini et al. 2016), and source B is located 10.5 kpc from the nucleus. This is further confirmed with the log R23 parameter, i.e. the oxygen versus H β abundance indicator. Moustakas et al. (2010) get log R23 = 0.32 ± 0.20 and we get log R23 = 0.52 ± 0.03, indicative of a decrease in the oxygen abundance (see Pérez-Montero & Díaz 2005). The value we calculate for log S23 (the sulfur versus Hβ abundance indicator) is also consistent with our value for 12 + log (O/H). Coccato et al. (2018) measured the metallicity of NGC 3521 between its nucleus and 30 arcsec from the nucleus. At the latter position, they get a value of [Z/H] = −0.3. In comparison, we calculate values of [O/H] = −0.65 and [S/H] = −0.31,2 consistent with a metallicity decrease.
Moustakas et al. (2010) also calculated the ionization parameter for NGC 3521 (in an area enclosing 49|${{\ \rm per\ cent}}$| of the integrated light), getting a value of log U = −2.89 ± 0.25, consistent with our measurement, since log U was found to maintain a practically constant value with distance to the nucleus in some galaxies (i.e. M33; Vilchez et al. 1988). Additionally, they found a Balmer decrement of H α/H β = 5.78 ± 0.50, whereas we found a value of 3.88, indicative of lower extinction (Mathis 1983; Diaz et al. 1991; Pérez-Montero & Díaz 2005) at the position of source B than at 3.9 kpc from the nucleus and consistent with the extinction decreasing as a function of distance to the nucleus of a galaxy (Cikota, Deustua & Marleau 2016).
With the Balmer decrement we could estimate the extinction at the position of source B, assuming a standard Milky Way gas-to-dust ratio (RV = 3.1; Fitzpatrick 1999b). We assume an intrinsic H α/H β = 2.87, valid for a typical optically thick nebula (recombination case B, low density limit, and Te ∼ 10 000 K; Osterbrock & Ferland 2006) and we obtain E(B − V) = 0.28 ± 0.01. We deredden the emission line fluxes from source B and calculate again the line ratios, finding that they are still consistent with source B being an H ii region (see Table 4).
The Te we find for the H ii region source B is also within the range of observed temperatures in H ii regions, i.e. 7000–10 000 K (e.g. Osterbrock, Tran & Veilleux 1992; Garnett et al. 1997; Esteban et al. 1998; Kennicutt, Bresolin & Garnett 2003). Lastly, our value of the radiation softness parameter η′ along with 12 + log (O/H) correspond to an H ii region ionized by a young hot stellar population, with an effective temperature |$T_{\mathrm{ eff}} = 40\, 000\, \mathrm{K}$| (for log U = −2.6; Bresolin, Kennicutt & Garnett 1999; Viegas, Gruenwald & Steigman 2000). This is in line with previous findings that ULXs often reside close to young OB associations (e.g. Grisé et al. 2008, 2011; Voss et al. 2011; Jonker et al. 2012).
6 CONCLUSIONS
We took X-Shooter spectra of a candidate NIR counterpart to the ULX J1105 in NGC 3521. We obtained spectra of both the counterpart of the ULX and a nearby H II region. We detect several emission lines from these two spectra. The line flux ratios from the extended source B classify it as an H ii region, while the line flux ratios from J1105 place it in the LINER region of the BPT diagram. Source B has the characteristics of a typical low density H ii region, with a Te = 8130 ± 1213 K and ne = 50 ± 15 cm−3. It is a low metallicity region, i.e. 12 + log (O/H) = 8.19 ± 0.11. This is consistent with the fact that several ULXs are found primarily in low metallicity environments and close to young OB associations. J1105 is a different object. The fact that the line ratios at the position of this source are different than source B is interpreted as being caused by the ULX. So we establish that the ULX is located in NGC 3521, although we do not detect the mass donor star. We calculate LX from the Chandra observation of the ULX and derive a value significantly higher than the one reported before by Liu (2011), implying source variability. Additionally, we derive a lower limit of Te ∼ 5270 K for J1105 and its line ratios indicate that this source could be shock ionized. The diagnostic diagrams from Dopita et al. (1984) suggest that the shocks have low velocity, i.e. between 50 and 80 km s−1. This is further confirmed by the average FWHM from J1105 (50 ± 1 km s−1). However, the luminosity of the H β line seems to indicate that the ULX is photoionizing the nebula. Hence, we argue that the nebula is not only shock ionized but also photoionized by the X-ray radiation from the ULX. The shock ionization could be driven by either a disc wind or a jet.
ACKNOWLEDGEMENTS
Based on observations made with ESO Telescopes at the La Silla Paranal Observatory under programme 0100.D-0660(B).
We would like to thank the anonymous referee whose valuable comments helped improve the quality of this work. KML would like to thank Davide Lena for valuable discussions. PGJ and KML acknowledge funding from the European Research Council under ERC Consolidator Grant agreement no. 647208. TPR acknowledges funding from the Science and Technology Facilities Council (STFC) as part of the consolidated grant ST/L00075X/1. MAPT acknowledges support via a Ramón y Cajal Fellowship (RYC-2015-17854). MAPT also acknowledges support by the Spanish Ministry of Economy, Industry and Competitiveness under grant AYA2017-83216-P. DJW acknowledges support from an STFC Ernest Rutherford Fellowship. We have made use of the SIMBAD data base, operated at CDS, Strasbourg, France; of the NASA/IPAC Extragalactic Data base (NED) which is operated by the Jet Propulsion Laboratory, California Institute of Technology, under contract with the National Aeronautics and Space Administration; and of data obtained from the Chandra Data Archive and the Chandra Source Catalogue, and software provided by the Chandra X-ray Center (CXC) in the application packages CIAO, ChIPS, and Sherpa.
Footnotes
Using log O|$\odot$| = 8.83 and log S|$\odot$| = 7.27 (e.g. Bowey 2003).
REFERENCES
APPENDIX: SPECTRA
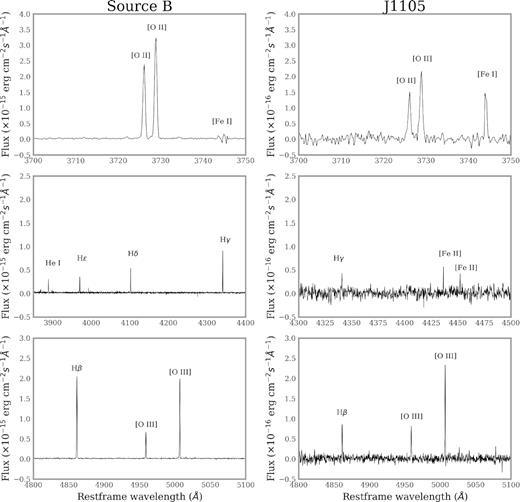
Selected spectra showing strong emission lines from the UVB range of the X-Shooter spectra from Source B (left-hand panel) and J1105 (right-right panel). The line classification is shown in the plot.
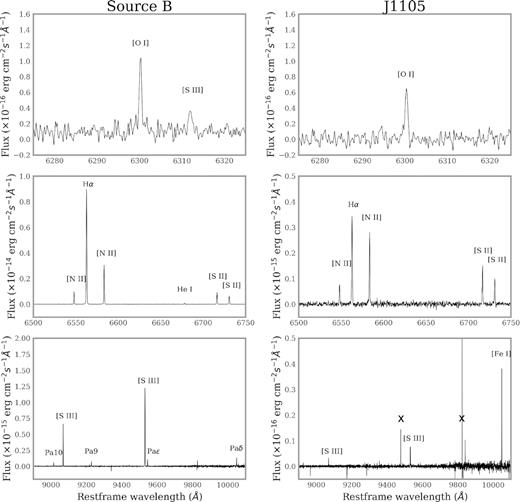
Selected spectra showing strong emission lines from the VIS range of the X-Shooter spectra from Source B (left-hand panel) and J1105 (right-hand panel). The line classification is shown in the plot. Residuals of sky lines subtraction or spurious lines are marked with an x.
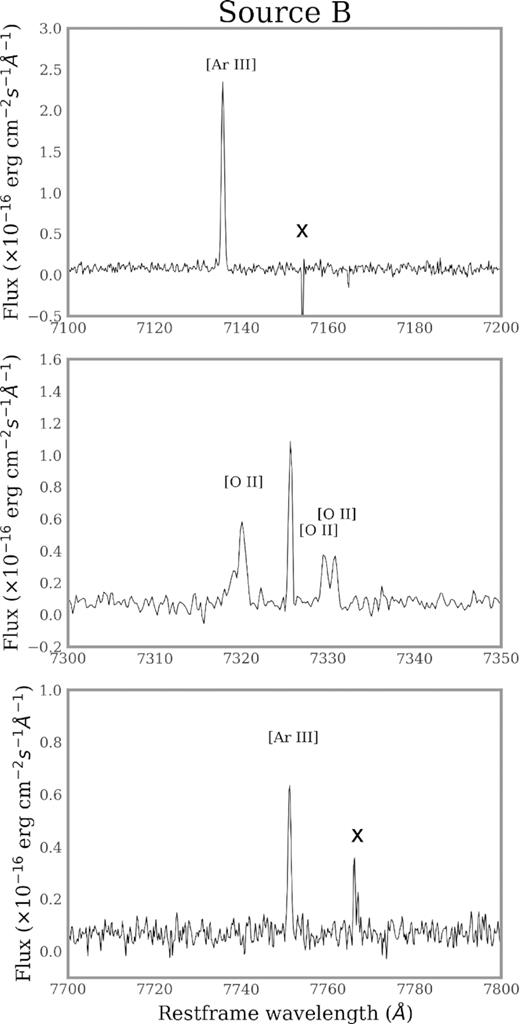
Selected spectra showing strong emission lines from the VIS range of the X-Shooter spectra from Source B. The line classification is shown in the plot. The unlabelled line in the middle panel is the unassociated 7325.71 Å line (see Table 2). Residuals of sky lines subtraction or spurious lines are marked with an x.
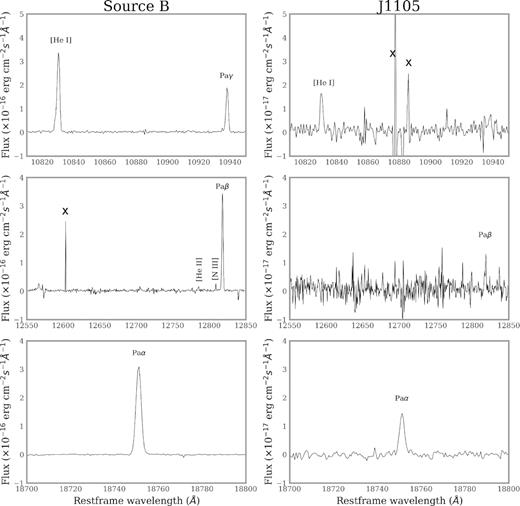
Selected spectra showing strong emission lines from the NIR range of the X-Shooter spectra from Source B (left-hand panel) and J1105 (right-hand panel). The line classification is shown in the plot. Residuals of sky lines subtraction or spurious lines are marked with an x.
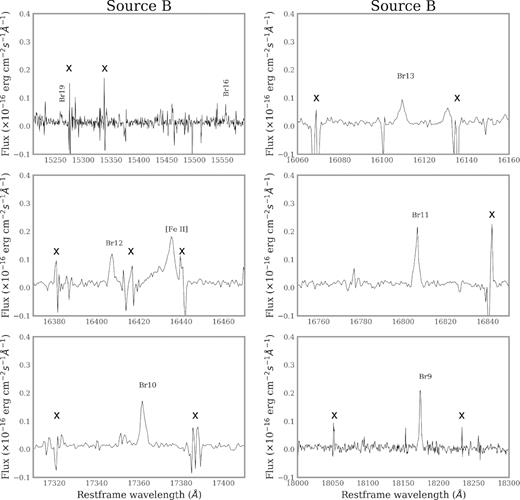
Selected spectra showing strong emission lines from the NIR range of the X-Shooter spectra from Source B. The line classification is shown in the plot. Residuals of sky lines subtraction or spurious lines are marked with an x.
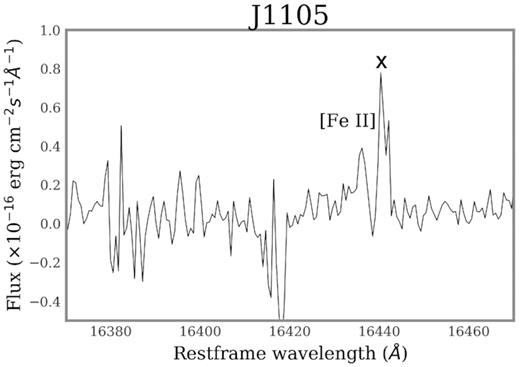
Selected region from the NIR range of the X-Shooter spectra from J1105, showing the weak Fe ii line. Residuals of sky lines subtraction or spurious lines are marked with an x.
