


Abstract
We report the discovery of a radio transient in the spiral galaxy M81. The transient was detected in early 2015 as part of a two-year survey of M81 made up of 12 epochs using the Karl G. Jansky Very Large Array. While undetected on 2014 September 12, the source was first detected on 2015 January 2, from which point it remained visible at an approximately constant luminosity of LR, ν = 1.5 ± 0.1 × 1024 erg s−1 Hz−1 at the observing frequency of 6 GHz for at least 2 months. Assuming this is a synchrotron event with a rise-time between 2.6 and 112 d, the peak luminosity (at equipartition) corresponds to a minimum energy of 1044 ≲ Emin ≲ 1046 erg and jet power of Pmin ∼ 1039 erg s−1, which are higher than most known X-ray binaries. Given its longevity, lack of short-term radio variability, and the absence of any multiwavelength counterpart (X-ray luminosity Lx ≲ 1036 erg s−1), it does not behave like known Galactic or extragalactic X-ray binaries. The M81 transient radio properties more closely resemble the unidentified radio transient 43.78+59.3 discovered in M82, which has been suggested to be a radio nebula associated with an accreting source similar to SS 433. One possibility is that both the new M81 transient and the M82 transient may be the birth of a short-lived radio bubble associated with a discrete accretion event similar to those observed from the ULX Holmberg II X-1. However, it is not possible to rule out other identifications including long-term supernova shockwave interactions with the surrounding medium from a faint supernova or a background active galaxy.
1 INTRODUCTION
As we approach the era of the Square Kilometre Array (SKA), astronomers are investigating how to use the low- and mid-frequency facilities for transient radio astronomy. Such radio observations allow us to directly probe particle acceleration and shock physics from explosive and outbursting astronomical sources, which provides direct insight into the velocity of the ejecta, the associated magnetic fields, the total energy budget, and the density distribution of the circumstellar and intergalactic media (Fender et al. 2015). The majority of radio transient studies have focused on blind searches for transients in both dedicated radio surveys and archival data (e.g. Bower et al. 2007; Bower & Saul 2011; Bannister et al. 2011; Bell et al. 2011, 2015; Ofek et al. 2011; Frail et al. 2012; Jaeger et al. 2012; Carbone et al. 2016; Mooley et al. 2016; Stewart et al. 2016; Murphy et al. 2017; Bhandari et al. 2018). While important steps have been made towards optimizing and automating such searches, these studies have demonstrated that at current radio telescope sensitivities, radio transients are rare and faint. However, recent activities have demonstrated alternative methods for radio transient discovery that can be used to supplement the blind survey approach, and are predicated on performing radio observations of sky regions in which we expect to find radio transients.
For this paper, we will discuss the ‘targeted’ (or monitoring) observational technique, which involves performing targeted radio monitoring of sky regions with a high source density such as face-on galaxies, globular clusters, the Galactic Centre or portions of the Galactic plane, providing many potential transient sources within a single field of view. The Karl G. Jansky Very Large Array (VLA) observations of nearby (within a few Mpc) galaxies are sensitive to the radio emission from binary neutron star mergers detected by the Advanced Laser Interferometer Gravitational Wave Observatory (aLIGO) and the Virgo gravitational wave interferometer (Mooley et al. 2018a), radio-bright core-collapse supernovae (SNe), and transient radio jets from ultraluminous X-ray sources (ULXs; e.g. Middleton et al. 2013), which are XRBs accreting at or above the Eddington rate.
An excellent example of the targeting technique is demonstrated by the discovery of three unidentified radio transients in the starburst galaxy M82 [star formation rate (SFR) of around |$3.6 \, \mathrm{M}_{\odot }$| yr−1; see Grimm, Gilfanov & Sunyaev 2003, and references therein], which were discovered via frequent and ongoing radio monitoring that was running from the 1980s until 2010 (Kronberg & Sramek 1985; Muxlow et al. 1994; McDonald et al. 2002; Fenech et al. 2008; Muxlow et al. 2010; Gendre et al. 2013). These transients were detected between 1981 and 2009, indicating a minimum occurrence rate of 1 every 10 yr (Muxlow et al. 2010). One of these transients, 43.78+59.3 (as named by Muxlow et al. 2010), switched on and rose to its maximum radio luminosity within 8 d, increasing in flux by a factor of 5, where it remained stable in flux for at least 19 months (Gendre et al. 2013). Several classifications were suggested by Muxlow et al. (2010), including a faint SN or a second SMBH from a galaxy that merged with M82 sometime in its past. However, the most likely classification is a stellar mass accreting system (Muxlow et al. 2010; Joseph, Maccarone & Fender 2011). M82 is an unusual galaxy due to its recent interaction history so may have an atypical transient event rate (for example, a study of the compact radio sources within the central kpc of M82 identified 30 SN remnants and 16 H ii regions; McDonald et al. 2002). For comparison, a search for radio transients was also conducted in the spiral galaxy M51, which was made possible by the frequent radio monitoring of SN 1994I with the pre-upgrade VLA (the VLA was commissioned in 1980 and upgraded in 2012; Perley et al. 2011). No radio transients were detected in 31 epochs spanning 5 months, probing day to monthly timescales, down to a flux density of 0.5 mJy. This resulted in a 2σ upper limit on the areal transient density of <17 deg−2 above a radio luminosity limit of LR, ν ≳ 4 × 1025 erg s−1 Hz−1 at the distance of M51 (Alexander, Soderberg & Chomiuk 2015). This suggests that more sensitive radio observations (like those now possible with the upgraded VLA) are required to search for radio transients in nearby and more standard spiral galaxies.
It was, however, the detection of bright radio flaring associated with the X-ray outburst of a transient XRB (microquasar) in M31 (Middleton et al. 2013) that inspired a dedicated monitoring programme of nearby galaxies with the VLA. The aim of this programme was to search for similar accreting systems, which are more powerful than most of those we have studied in the Milky Way. The M31 transient exhibited long-lived radio flaring behaviour for at least ∼30 d, reaching a peak radio luminosity of LR, ν = 3 × 10²³ erg s−1 Hz−1 (νLν = 2 × 1033 erg s−1 at 7.45 GHz), placing it amongst the most radio-luminous of known transient XRBs (Middleton et al. 2013). Radio variability was observed on 10 min to 1 d timescales, corresponding to a minimum brightness temperature of TB ∼ 7 × 10¹⁰ K, which exceeds that of the brightest Galactic black hole XRBs. For a period of ∼40 d, the M31 transient was accreting in the super-Eddington regime as its X-ray luminosity was brighter than the theoretical Eddington luminosity limit for a 10 |$\, \mathrm{M}_{\odot }$| black hole (X-ray luminosities of LX ≳ 1039 erg s−1; Feng & Soria 2011), making it a transient ULX. The observed radio behaviour during this period was very different to what is observed from sub-Eddington Galactic black hole XRBs, where the radio jets are quenched during the soft X-ray spectral state at the peak of the outburst (Fender, Belloni & Gallo 2004). This may indicate that in the super-Eddington regime, accreting objects have a different coupling between the inflow of material and the jetted outflows than in the sub-Eddington regime. This is expected as in the super-Eddington regime it is predicted that the accretion disc gets puffed up by radiation pressure, with excess material being removed in the form of a massive and optically thick, fast-moving radiation-pressure-driven wind (Shakura & Sunyaev 1973; Abramowicz et al. 1988). Additionally, magnetohydrodynamical simulations predict the existence of powerful, collimated jets from supercritically accreting black holes (Ohsuga & Mineshige 2011; McKinney et al. 2014; Narayan, SaÌdowski & Soria 2017) and neutron stars (Parfrey & Tchekhovskoy 2017).
The study of ULXs in nearby galaxies is of particular interest as few such sources reach similar X-ray luminosities in our own Milky Way, and only during outburst (e.g. V404 Cyg; Motta et al. 2017). Many ULXs are persistent X-ray sources, and while partially self-absorbed compact radio jets have never been directly detected from their core, diffuse radio emission is observed around a small number of ULXs as a result of their disc winds and/or (undetected) jets interacting with the surrounding environment. These outflows give rise to radio synchrotron nebulae or ‘bubbles’. Such radio bubbles have luminosities ranging from νLν ∼ 2 × 1034 to 2 × 1035 erg s−1 at 5 GHz and have characteristic lifetimes of ∼104–105 yr (e.g. MF16 in NGC 6946 and M51 ULX1; van Dyk et al. 1994; Urquhart et al. 2018). However, there is at least one ULX, Ho II X-1 (Miller, Mushotzky & Neff 2005; Cseh et al. 2014, 2015b), which produces radio lobes with transient characteristics indicative of multiple and recent (within a few years) ejection events.
A larger sample of transient ULXs is required to understand accretion–jet coupling at the highest accretion rates, and the impact of the jetted outflows’ feedback on their surrounding environments. We therefore embarked on a radio monitoring campaign of the nearby spiral galaxy M81 to search for transients. M81 is one of largest nearby galaxies observable in the Northern Hemisphere, lying at a distance of 3.6 ± 0.2 Mpc (Gerke et al. 2011) in an interactive group that includes M82, with an SFR between 0.3 and |$0.9 \, \mathrm{M}_{\odot }$| yr−1 (depending on the SFR indicator; Gordon et al. 2004). Its large size, and therefore high stellar mass predicts a high number of low-mass X-ray binaries (Grimm, Gilfanov & Sunyaev 2002), while being nearly face-on ensures that we are not viewing through a large absorbing column. These properties, along with its close proximity, make it an ideal galaxy to target for this monitoring survey.
Here, we present the discovery of a radio transient in M81. The programme made use of VLA filler time, collecting data in multiple telescope configurations at 6 GHz, and obtaining 48 epochs between 2013 January and 2015 March. In Section 2, the VLA observations and analysis are described. Section 3 explores the radio properties of the M81 transient, including its position, luminosity, spectral index, variability, minimum energy, jet power, and magnetic field strength (assuming equipartition), along with implications for the radio transient surface density of M81. This is then followed by multiwavelength and archival investigations at the position of the transient, particularly using new and archival Chandra X-ray Observatory observations, and archival Swift X-ray Telescope (XRT) and Hubble Space Telescope (HST) data. Transient databases and catalogues are also searched for potential counterparts and associations. Section 4 explores the possible nature of the M81 transient via comparisons with known radio transient classes and other extragalactic radio transients.
2 VERY LARGE ARRAY RADIO OBSERVATIONS
The VLA monitoring campaign of M81 took place between 2013 January and 2015 March. Making use of VLA filler time, at least two epochs of data, one hour in duration, were obtained in each of the A, B, C, D, and DnC configurations in the C band (4.5–6.5 GHz) during this 2-year period (proposal codes 13A-256, 13B-138, 14A-167, 14B-042, and 15A-060; PI M. Middleton). In order to monitor the full galactic disc of M81, four pointings were performed (one for each quadrant) within 1–23 d of each other for a given configuration. The resulting mosaic of a set of four pointings covered ∼0.08 deg2 and was approximately centred on the central active galactic nucleus (AGN) of M81 (e.g. Fig. 1). For this paper, we concentrated on observations of quadrant 1 (pointing centre at |$\alpha \mathrm{(J2000.0)} = 09^{\mathrm{h}}55^{\mathrm{m}}40\overset{\mathrm{s}}{.}71$| and δ(J2000.0) = +69○07′19|${^{\prime\prime}_{.}}$|45) and quadrant 2 (pointing centre at |$\alpha \mathrm{(J2000.0)} = 09^{\mathrm{h}}54^{\mathrm{m}}58\overset{\mathrm{s}}{.}45$|, and δ(J2000.0) = +69○04′43|${^{\prime\prime}_{.}}$|90). See Wrobel, Miller-Jones & Middleton (2016) for a full description of the quadrant pointings and observational details.

Mosaicked image of the four B configuration observations (one for each quadrant) of M81 obtained during 2015 March. The transient, VTC J095517.5+690813, discussed in Section 3 is indicated by the red arrow. See Fig. 4 for a zoomed view of the transient. The AGN is located at the centre of the mosaic but was peeled out of the visibilities to minimize imaging artefacts.
The flagging, calibration, and imaging of each observation, along with source position and flux density measurements, were conducted using the Common Astronomy Software Application package (casa; McMullin et al. 2007) using standard techniques. The dominant radio source in M81 is its central AGN, with a flux density varying by a factor of ∼2 over the 2 yr of observations. As the AGN is between |$3\overset{^{\prime }}{.}1$| and |$3\overset{^{\prime }}{.}5$| off-centre (at ∼60–67 per cent of the primary beam) for each of the four pointings, this source was difficult to clean, causing artefacts across the image. We therefore peeled out the AGN from each observation by first self-calibrating on the AGN after shifting it to the phase centre to create an accurate model of the source. This model was then subtracted from the measurement set. The amplitude self-calibration was then inverted in the subtracted measurement set to reverse the effects of this off-axis amplitude self-calibration, which is likely dominated by pointing errors (for an in-depth description of this technique, see Deller et al. 2015). No further self-calibration was applied to the resulting measurement set due to the lack of suitably bright sources. The measurement sets were then imaged out to the 10 per cent primary beam response point using a Briggs weighting scheme of Robust = 0.5, with each set of quadrant pointings then being mosaicked in the image plane, taking into account the primary beam response. The position and source flux densities of the transient described in Section 3.1 were measured using the casa tool imfit and assuming Gaussian errors based on Condon et al. (1998).
3 RESULTS: A NEW RADIO TRANSIENT
3.1 Radio properties
3.1.1 Position and luminosity
A preliminary visual inspection of several processed fields revealed a radio transient was detected in the B and C configuration observations of quadrants 1 and 2 conducted in early 2015. The resulting flux densities are listed in Table 1, along with the upper limits provided by observations of quadrants 1 and 2 at earlier epochs. The VLA 6 GHz light curve is shown in Fig. 2. We place an upper limit on the outburst rise-time of 112 d, using the non-detection during the D configuration quadrant 1 observation on 2014 September 12, and the first detection of the transient in the C configuration observation of quadrant 1 on 2015 January 2. The transient is located within the galactic disc at the position of |$\alpha \mathrm{(J2000.0)} = 09^{\mathrm{h}}55^{\mathrm{m}}17\overset{\mathrm{s}}{.}46\,(\pm 0.02\mathrm{s})$| and δ(J2000.0) = +69○08′13|${^{\prime\prime}_{.}}$|02 (± 0|${^{\prime\prime}_{.}}$|03) just |$4\overset{^{\prime }}{.}52$| from the galactic centre of M81 (see Fig. 3). In quadrants 1 and 2, the transient was |${\sim }2\overset{^{\prime }}{.}3$| and |${\sim }3\overset{^{\prime }}{.}9$| from the pointing centres, corresponding to the 82 and 53 per cent response points of the primary beam, respectively. From hereon in, we will refer to this transient as VTC J095517.5+690813, adopting the naming convention proposed by Mooley et al. (2016), where ‘VTC’ stands for ‘VLA transient candidate’. The B configuration observation both before and after the transient detection is shown in Fig. 4.

The VLA 6 GHz light curve of the M81 transient VTC J095517.5+690813. The detections (circles) and 3σ upper limits (triangles) are colour-coded to indicate which M81 quadrant was being observed at the time, with black for quadrant 1 and white for quadrant 2. Error bars are 1σ.

An RGB image of M81 using the Sloan Digital Sky Survey filters i (R), r (G), and g (B) (York et al. 2000; Eisenstein et al. 2011; Ahn et al. 2012). Each band has been normalized to the 99th percentile and is displayed with an arcsinh stretch. The location of the transient VTC J095517.5+690813 is shown with a white circle of radius 10 arcmin (100 × the 1σ error on its position). The green ellipse indicates half the major and minor diameter of the D25 (galaxy size based on the B-band surface brightness) for M81 (de Vaucouleurs et al. 1991).

B configuration mosaic observations of the region surrounding the M81 transient VTC J095517.5+690813. Left: 2014 January mosaic when the transient was not detected. Right: 2015 March mosaic when the transient was detected. The position of the transient is indicated by the black lines. The positions of X-ray sources (signal to noise >5σ) detected in the stacked Chandra data (see Section 3.2.1) are indicated by green circles with a 3 arcsec radius (∼10 times their position error), none of which are coincident with the radio transient.
VLA 6 GHz flux densities and upper limits of the M81 transient VTC J095517.5+690813.
| Date | Date | Config | Quadrant | Flux density |
|---|---|---|---|---|
| (yyyy-mm-dd) | (MJD) | (μJy) | ||
| 2014-01-05 | 56662.11 | B | 1 | <23.4 |
| 2014-01-06 | 56663.15 | B | 2 | <22.0 |
| 2014-04-05 | 56752.03 | A | 1 | <18.3 |
| 2014-09-12 | 56912.57 | D | 1 | <60.0 |
| 2015-01-02 | 57024.28 | C | 1 | 81.0 ± 7.7 |
| 2015-01-03 | 57025.20 | C | 2 | 112 ± 23 |
| 2015-03-03 | 57084.35 | B | 2 | 75 ± 11 |
| 2015-03-07 | 57088.01 | B | 1 | 93.9 ± 7.8 |
Notes. The Modified Julian Date (MJD) corresponds to the mid-point of the observation. All flux density errors are 1σ and upper limits are 3σ.
In order to calculate the radio luminosity (νLν) of the transient, we assumed an isotropically radiating source of |$\nu L_{\nu }=4 \pi d_{L}^{2} \nu S_{\nu }$|, where Sν is the measured flux density and dL is the luminosity distance equal to the Cepheid distance to M81 of 3.6 ± 0.2 Mpc (Gerke et al. 2011). As the flux densities of the transient were consistent between the observations for which it was detected, we used that of the brightest quadrant 1 detection (B configuration observed on 2015 March 7) as the transient was more centrally located within the primary beam compared to quadrant 2, resulting in a lower local root mean square (rms) noise level of 8 μJy in the primary beam corrected image. VTC J095517.5+690813 therefore reached a peak radio spectral luminosity of LR, ν = 1.5 ± 0.1 × 1024 erg s−1 Hz−1 or a luminosity of νLν = 8.7 ± 0.7 × 1033 erg s−1 at the observing frequency of 6 GHz. The rms at the position of the transient in this observation corresponds to a 5σ radio spectral luminosity sensitivity limit of LR, ν ≈ 6.2 × 10²³ erg s−1 Hz−1 (or a luminosity limit of νLν ≈ 3.7 × 1033 erg s−1 at the observing frequency of 6 GHz) at the distance of M81. For the purpose of this paper, we will assume we are sensitive to all radio sources with an equal or higher luminosity.
3.1.2 Spectral index
In order to obtain the best constraints on the spectral index of the transient over the 2 GHz bandwidth, for quadrant 1 we stacked the visibilities from the configuration B and C detections and then imaged by cutting the observing band in half with central frequencies of 5.5 and 6.5 GHz. This resulted in a spectral index of α = −0.5 ± 0.8, for Sν ∝ να. We then mosaicked this image with a stacked image of the quadrant 2, B and C configuration detections, taking into account effects from the primary beam, which resulted in a spectral index of α = −0.1 ± 0.7, indicating the source could be optically thick, optically thin, or have components of both. All options are possible as radio transients can experience a wide variety of spectral shapes due to different contributions of optically thick and thin synchrotron emission and also bremsstrahlung (e.g. core-collapse SNe and XRB radio jets; van der Laan 1966; Hjellming & Johnston 1988; Fender et al. 2000; Weiler et al. 2002).
3.1.3 Variability
VTC J095517.5+690813 was investigated for evidence of short-term variability by splitting the 1 h observations with the most significant detections (the 2015 B and C configuration observations of quadrant 1) into 7 and 10 min time bins. The flux density of the transient was measured in each of the resulting images to create a light curve and we tested for variability by calculating the χ2 probability that the flux density was consistent with a steady source (probability P > 0.01; Gaensler & Hunstead 2000). The above analysis resulted in a minimum probability of P = 0.06 so no significant short-term variability was detected.1
This lack of short-term variability implies that the source size of VTC J095517.5+690813 is greater than the angular scale of interstellar scintillation, which allows us to place a lower limit on its physical source size. If we assume a scattering screen distance of 1.5 kpc, equivalent to half the length of the Galaxy that we view through in the direction of M81, then using a scattering measure software package2 (Hancock et al. 2019), which utilizes H α as a proxy for the electron column (Haffner, Reynolds & Tufte 1998) and scintillation theory by Narayan (1992), then our observations of M81 are in the weak scattering regime. Using formalism summarized in Granot & van der Horst (2014), we calculate a minimum source size of about 3 μas for VTC J095517.5+690813, corresponding to a modulation index of ≲0.42 on a 1 h timescale. As the debiased modulation indices (Barvainis et al. 2005) of the quadrant 1 (B and C) observations of VTC J095517.5+690813 are between ∼0.1–0.2, the source size is likely much bigger than the scintillation angular scale, corresponding to a physical source size of ≫10 au at the beginning of 2015. This gives a lower limit on the outburst expansion velocity of ≳150 km s−1 assuming a maximum rise-time of 112 d (see Section 3.1.1).
The high radio luminosity observed from VTC J095517.5+690813 could be the result of Doppler boosting if the transient emission is from jets pointed along our line of sight (as was the case for the M31 microquasar; Middleton et al. 2013). Minimum source size and variability arguments are often used to probe for Doppler boosting in radio transients (e.g. Middleton et al. 2013). As no significant short-term variability was detected during the 1 h snapshots or between the VLA observations taken one day apart (i.e. 2015-01-02 and 2015-01-03), the most constraining lower limit we can place on the brightness temperature is using the shortest confirmed variability timescale, which is between the upper limit obtained on 2014 September 12, and the first detection of the transient on 2015 January 2. This corresponds to a change in flux of ≥21 μ Jy in 112 d (see Table 1). As we did not resolve the rise in radio luminosity, and we know the source was not variable on timescales less than 1 h, we can place conservative limits on the brightness temperature (Tb) of 8000 ≲ Tb ≲ 1011 K, assuming our VLA observations could resolve a change in flux between 50 and 100 μ Jy on ≥1 h timescales (Readhead 1994). If we assume that this is a jetted radio transient, then a comparison to the typical brightness temperature of Galactic BH XRBs (TB ≲ 1 × 10⁹ K; see arguments in Middleton et al. 2013), implies a range in Lorentz factors of 0.004 ≲ Γ ≲ 5, with the upper limit being typical of radio transients (e.g. Pietka, Fender & Keane 2015).
3.1.4 Preliminary transient surface density for M81
In order to calculate the transient surface density in M81, we first calculated the total field of view surveyed. The transient search was conducted out to 50 per cent of the primary beam for each pointing, resulting in an area of 0.0142 deg2. By summing the areas of independent consecutive images of the same field of view, taking into account the overlap between pointings, the total area surveyed was 0.076 deg2. The detection of one transient implies a transient surface density of |$13.2^{+30.2}_{-10.9}$| deg−2 (1σ Poisson errors; Gehrels 1986) to a 3σ flux density limit of 75 μJy, based on the rms value at |$50{{\ \rm per\ cent}}$| of the primary beam in the C configuration images, which were noisier than the A and B configuration images (the transient surface density calculation follows the procedure described in Carbone et al. 2016). While we quote a D configuration flux density upper limit for the transient in Table 1, this observation was confusion limited and therefore not sensitive enough to be used in this transient surface density calculation. If we consider the 14 months worth of VLA observations studied in this paper (see Table 1), then the radio transient rate is |${\sim }0.9^{+2.0}_{-0.7}$| yr−1 (1σ Poisson errors) per standard L∗ galaxy (which is the case for M81; see definition described by Cooray & Milosavljević 2005).
3.2 Multiwavelength and archival investigations
Archival images and catalogues were searched in order to identify any potential multiwavelength transient counterparts, as well as any potential stellar, nebular or background galaxy associations at the position of VTC J095517.5+690813. Extensive literature and transient database searches (including the Astronomer’s Telegram (ATel)3 and the Gamma-ray Coordinates Network4) have not reported a transient at the position of this source in the radio, optical, or X-ray bands.
3.2.1 X-ray results
Many jetted/outbursting radio transients have an X-ray counterpart so we searched the Swift,5The X-ray Multi-Mirror Mission (XMM–Newton)6 and Chandra7 point source archives at the position of VTC J095517.5+690813 but found no corresponding X-ray source out to tens of arcseconds. If this source is a recurring transient, then the lack of an archival X-ray counterpart may be due to the central source being ‘off’ for the majority of its cycle so that current missions with sporadic coverage have not observed it during periods in outburst.
We searched for X-ray associations in all Chandra data taken with the Advanced CCD Imaging Spectrometer (Garmire et al. 2003) available from the public archive, including the unpublished observations from 2016 and 2017 (PI: Swartz, Proposal Number 17620477). A total of 23 Chandra-ACIS observations covering the location of the transient were individually inspected. The Chandra Interactive Analysis of Observations (ciao) software v4.10 was used for the Chandra data analysis, where the observations were reprocessed using ciao task chandra_repro (Fruscione et al. 2006). Table 2 lists the measured fluxes, luminosities and 90 per cent upper limits at the position of VTC J095517.5+690813, which were calculated using Chandra-PIMMS8 for count-rate conversion, assuming a column density of nH = 8 × 1020 cm−2 (two times the Galactic value to account for the M81 environment) and a power-law index of Γ = 1.8. These include three possible detections with a 90 per cent significance but are likely to be due to fluctuations arising from small-number statistics. However, Table 2 also includes the fluxes and luminosities measured by stacking all Chandra observations, and also those from both before and after the transient ‘outburst’ in 2015, and represent a consistent 2σ excess. For the purposes of this paper, we will assume an upper limit on the unabsorbed X-ray luminosity of Lx ≲ 1036 erg s−1 at the position of VTC J095517.5+690813. The nearby significant (≥5σ) X-ray point sources surrounding VTC J095517.5+690813 are indicated in Fig. 4.
Chandra absorbed flux and unabsorbed luminosity detections or 90% upper limits of the M81 radio transient VTC J095517.5+690813.
| Date | ObsIDa | Fluxb | Luminosityc |
|---|---|---|---|
| (yyyy-mm-dd) | (erg s−1 cm−2) | (erg s−1) | |
| 2000-05-07 | 735 | <6 × 10⁻¹⁵ | <1 × 1037 |
| 2005-05-26 | 5935 | |$3.8_{-3.4}^{+4.7} \times 10^{-15}$| | |$7.0_{-6.3}^{+9.0}\times 10^{36}$| |
| 2005-05-28 | 5936 | <6 × 10⁻¹⁵ | <1 × 1037 |
| 2005-06-01 | 5937 | <3 × 10⁻¹⁵ | <6 × 1036 |
| 2005-06-03 | 5938 | <4 × 10⁻¹⁵ | <8 × 1036 |
| 2005-06-06 | 5939 | <4 × 10⁻¹⁵ | <8 × 1036 |
| 2005-06-09 | 5940 | <4 × 10⁻¹⁵ | <7 × 1036 |
| 2005-06-11 | 5941 | <6 × 10⁻¹⁵ | <1 × 1037 |
| 2005-06-15 | 5942 | <2.7 × 10⁻¹⁵ | <5 × 1036 |
| 2005-06-18 | 5943 | <3.3 × 10⁻¹⁵ | <6 × 1036 |
| 2005-06-21 | 5944 | <5 × 10⁻¹⁵ | <8 × 1036 |
| 2005-06-24 | 5945 | |$5.5_{-5.0}^{+5.5}\times 10^{-15}$| | |$1.0_{-0.9}^{+1.0}\times 10^{37}$| |
| 2005-06-26 | 5946 | <4 × 10⁻¹⁵ | <7 × 1036 |
| 2005-06-29 | 5947 | <5 × 10⁻¹⁵ | <9 × 1036 |
| 2005-07-03 | 5948 | <6 × 10⁻¹⁵ | <1 × 1037 |
| 2005-07-06 | 5949 | <5 × 10⁻¹⁵ | <8 × 1036 |
| 2016-07-04 | 18047 | <8 × 10⁻¹⁵ | <1 × 1037 |
| 2017-01-08 | 18048 | <6 × 10⁻¹⁵ | <1 × 1037 |
| 2017-01-15 | 18053 | <8 × 10⁻¹⁵ | <2 × 1037 |
| 2016-06-21 | 18054 | |$8.8_{-8.3}^{+11.2}\times 10^{-15}$| | |$1.6_{-1.5}^{+2.1}\times 10^{37}$| |
| 2016-06-24 | 18875 | <8 × 10⁻¹⁵ | <2 × 1037 |
| 2017-01-11 | 19981 | <7 × 10⁻¹⁵ | <1 × 1037 |
| 2017-01-12 | 19982 | <8 × 10⁻¹⁵ | <1 × 1037 |
| Before 2015 | 735–5949 | 2.9 ± 1.7 × 10⁻¹⁶ | 5.3 ± 3.1 × 1035 |
| After 2015 | 18047–19982 | 2.8 ± 1.5 × 10⁻¹⁶ | 5.0 ± 2.8 × 1035 |
| 2000–2017 | All | 3.4 ± 1.7 × 10⁻¹⁶ | 6 ± 3 × 1035 |
Notes. The first section of the table lists the detections and 90% upper limits for individual epochs for which the position of VTC J095517.5+690813 falls within the Chandra field of view. All individual epoch detections quote a 1σ error.
The second section of the table gives the detections if stacking the Chandra observations that occurred both before and after the VLA detections of VTC J095517.5+690813 in 2015. These detections quote a 1σ error. The flux and luminosity value derived from combining all Chandra observations of the source are also included and are consistent with those values derived from stacking data before and after 2015.
aThe Chandra observation identification number.
bAbsorbed X-ray flux or 90% upper limit at the position of the M81 transient in the 0.3–10.0 keV energy band.
cUnabsorbed X-ray luminosity or 90% upper limit at the position of the M81 transient in the 0.3–10.0 keV energy band.
3.2.2 Optical and infrared results
We performed a catalogue search in VizieR9 for coincident optical and infrared sources. The closest reported source was detected in the infrared with the Spitzer Space Telescope, lying 0.8 arcsec from VTC J095517.5+690813 at position of |$\alpha \mathrm{(J2000.0)} = 09^{\mathrm{h}}55^{\mathrm{m}}17\overset{\mathrm{s}}{.}6040$| and δ(J2000.0) = +69○08′12|${^{\prime\prime}_{.}}$|804 (Khan et al. 2015). VTC J095517.5+690813 is also located within (or projected on) a star formation region with a radial extent of ∼4 arcsec, lying 1.6 arcsec (∼30 pc at the distance of M81) from its centre at a position of |$\alpha \mathrm{(J2000.0)} = 09^{\mathrm{h}}55^{\mathrm{m}}17\overset{\mathrm{s}}{.}640$| and δ(J2000.0) = +69○08′14|${^{\prime\prime}_{.}}$|28 (Hoversten et al. 2011).
In order to perform a more thorough search for an optical counterpart, we downloaded archival HST data from the Hubble Legacy Archive10 that covered the position of VTC J095517.5+690813. Note that all archival HST observations of M81 predate the radio transient. We obtained images in each of the F435W, F606W, and F814W filters, all of which were taken with the Advanced Camera for Surveys (ACS) Wide Field Camera.11 The F435W and F606W band observations were taken on 2006-03-20 under proposal ID 10584, while the F814W observation was obtained on 2004-09-13 under proposal ID 10250. The astrometry of all three images was corrected to the Two Micron All Sky Survey (2MASS) reference frame, which has an accuracy of 0.1 arcsec (Skrutskie et al. 2006). The resulting three-colour HST image of the region surrounding VTC J095517.5+690813 is shown in Fig. 5 and clearly demonstrates it resides in a crowded field. The radio position of VTC J095517.5+690813 is indicated by the white circle with a radius of 0.3 arcsec (3σ error circle; the positional error on its radio position is dominated by the error in RA of 0.1 arcsec).
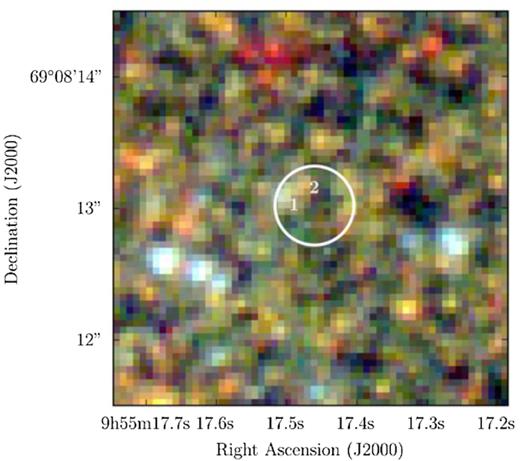
Archival HST image of the region surrounding the M81 transient VTC J095517.5+690813 (red: F814W; green: F606W; blue; F435W). Each band has been normalized to the 99th percentile and is displayed with an arcsinh stretch. The position of the transient is indicated by the white circle with a radius of 0.3 arcmin (three times the positional error in RA, which dominates the error in Dec.). The two optical sources (indicated by numbers) are investigated as possible counterparts in Section 3.2.2.
Two point-like sources lie just within the positional error radius of VTC J095517.5+690813 as labelled in Fig. 5. We carried out aperture photometry of both sources with the Statistical Analysis package within SAOImage DS9.12 Their count-rates were first derived using a source radius of 0.15 arcsec and a background annulus between 0.5 arcsec and 1.0 arcsec (excluding other stars), and then the revised aperture corrections13 from 0.15 arcsec to an infinite aperture were applied. We converted the observed net count rates to Vegamag and AB mag units using the ACS WFC zero-points14 suitable for the observation dates. To estimate the absolute brightness of the two optical sources, first we de-reddened them, assuming Galactic line-of-sight extinction (Schlafly & Finkbeiner 2011); the extinction coefficients for the ACS filters were computed with the York Extinction Calculator (McCall 2004). Finally, we applied a distance modulus of 27.8 mag, corresponding to our assumed distance of 3.6 Mpc, for sources located inside M81. The observed apparent brightness and de-reddened absolute brightness (both in the Vegamag and AB systems) for the two sources are listed in Table 3.
HST apparent and extinction corrected absolute Vega and AB magnitudes of two nearby optical point-sources within 0.3 arcsec of the M81 radio transient VTC J095517.5+690813.
| Source | Filter | mVega | mAB | Aλ | MVega | MAB |
|---|---|---|---|---|---|---|
| (mag) | (mag) | (mag) | (mag) | (mag) | ||
| 1 | F435W | 25.8 ± 0.1 | 25.7 ± 0.1 | 0.29 | −2.3 | −2.4 |
| 1 | F606W | 25.1 ± 0.1 | 25.2 ± 0.1 | 0.20 | −2.9 | −2.8 |
| 1 | F814W | 24.3 ± 0.1 | 24.7 ± 0.1 | 0.12 | −3.6 | −3.2 |
| 2 | F435W | >27.0 | >27.0 | 0.29 | >−1.1 | >−1.1 |
| 2 | F606W | 26.2 ± 0.2 | 26.3 ± 0.2 | 0.20 | −1.8 | −1.7 |
| 2 | F814W | 24.5 ± 0.1 | 24.9 ± 0.1 | 0.12 | −3.4 | −3.0 |
By comparing the brightness and colours with a set of theoretical isochrones from the parsec v1.2 code (Bressan et al. 2012; Marigo et al. 2017), we note that if the two sources are stars inside M81, then they are consistent with red giants; they are too red to be main-sequence OB stars or blue supergiants, and too faint to be red supergiants. Thus, they are consistent with an intermediate-age population.
Given the crowdedness of the field, we also calculated the number of optical sources likely to be randomly aligned with a 0.3 arcsec radius circle within this region of the M81 galaxy. By examining a 5 arcsec × 5 arcsec region centred at the position of VTC J095517.5+690813, we determined there are likely to be ∼0.6 and ∼2.8 point sources that are equal to or brighter than sources 1 and 2, respectively, in the F606W and F814W bands, within the 0.3 arcsec radius positional error circle, with ∼0.3 objects equal or brighter than source 1 in the F435W band. Therefore, we conclude that sources 1 and 2 do not have any special property that distinguishes them from any other source in the field, and there is no evidence to suggest that either of them is associated with the radio transient.
4 DISCUSSION: THE NATURE OF THE RADIO TRANSIENT
In order to determine the nature of VTC J095517.5+690813, we first look at the physical properties of the radio emission. The radio flaring activity observed from slowly evolving transient sources (timescales > 1s) is thought to arise from powerful kinetic outflows interacting with the surrounding medium. This causes the compression of magnetic fields and particle acceleration, usually giving rise to synchrotron radiation. Unfortunately, the derived spectral index of α = −0.1 + / − 0.7 is not constraining enough to provide insight into the nature of the radio emission.
The VLA sampling of M81 did not resolve the initial rise in emission so we cannot adequately constrain its rise-time. However, recent work by Pietka et al. (2015, 2017) has demonstrated that a broad correlation exists between the peak radio luminosity and the variability timescales (rise/decline rates) of a transient. Using this relation, the measured peak radio luminosity of VTC J095517.5+690813 (νLν = 8.7 × 1033 erg s−1) is brighter than most XRB flares, with the correlation suggesting the transient should have had an exponential rise timescale (rise-time or e-folding time) of τ ∼ 2.6 d (see fig. 7 of Pietka et al. 2017, but note the scatter on the rise-time for XRBs, which is 10−2 ≲ τ ≲ 103 d). If we assume a non-relativistic expansion velocity, then for a maximum possible rise-time of 112 d, the source size (ct) could be as large as 1.9 × 10⁴ au by the first detection on 2015 January 2. We therefore limit the size of VTC J095517.5+690813 to be between 10 au (from scintillation; Section 3.1.3) and 1.9 × 10⁴ au.
Further physical properties of the emitting plasma can be derived from the luminosity and rise-time of the radio ejection if we assume it is synchrotron in nature. Using the potential rise-time range from 2.6 to 112 d for VTC J095517.5+690813 and a peak flux of 100 μJy, we calculate the minimum energy of the plasma (assuming the source expands at c) to be 1044 ≲ Emin ≲ 1046 erg, the minimum (jet) power associated with the ejection to be Pmin ∼ 1039 erg s−1, and a corresponding magnetic field at equipartition of 2–50 mG (Fender 2006; Longair 2011). Given the ambiguity in the rise-time, and the diverse nature of radio transient timescales and brightnesses, in the following we discuss possible classifications for VTC J095517.5+690813.
4.1 Foreground or background event
We first explore the possibility that VTC J095517.5+690813 is either a foreground event within the Milky Way or a background event observed through the M81 galactic disc. Table 4 summarizes the surface density rates, timescales, and luminosities of potential contaminating foreground and background radio transient populations in the area of M81 surveyed by the VLA. The surface density rates are scaled to the survey 3σ flux density threshold of Sν ∼ 75 μJy (Section 3.1.4) assuming that it is a Euclidean source population that scales according to |$\rho \propto S_{\nu }^{-1.5}$|. The Galactic rate combines foreground radio transients with similar timescales to VTC J095517.5+690813 (weeks to years), which include XRBs, young stellar objects, pulsar scattering, magnetars, and novae (Mooley et al. 2016). Even taking into account upper limits, the low rates of Galactic transient rates, combined with the lack of an optical association in the HST data, makes it unlikely that VTC J095517.5+690813 is a foreground event located within the Milky Way.
Surface densities, timescales, and luminosities for foreground and background radio transients.
| Type | Ratea | Rateb | Timescalesc | Peak luminosity | Refd |
|---|---|---|---|---|---|
| (deg−2) | (M81) | (erg s−1 Hz−1) | |||
| Galactic | 1.3 | (5−100) × 10−3 | weeks–year | 1015−1021 | 1 |
| AGN | 10.0 | 0.8 | days–years | 1027−1034 | 1 |
| TDE | 0.12 | 0.01 | years | 1030−1031 | 1 |
| GRB | 9 × 10⁻³ | 0.001 | days–months | 1027−1032 | 2,3 |
| Orphan GRB | (5−100) × 10−2 | (5−100) × 10−3 | years | ∼1029 | 4,5,6 |
Notes. The Galactic transients include contributions from XRBs, young stellar objects, pulsar scattering, magnetars, and novae. The AGNs included in this rate are those expected to have variability processes that evolve on similar timescales to VTC J095517.5+690813, including ‘shock-in-jet’ and extreme scattering events. The TDE rates include jetted and off-axis TDEs. The GRB and orphan GRB rates are in deg−2 yr−1. The orphan GRB afterglow luminosity is based on that of the candidate FIRST J141918.9+394036, which was identified by Law et al. (2018, see also Marcote et al. 2019).
aThe surface density rate for the corresponding transient type.
bThe number of transients of this type expected in the 0.076 deg2 area of M81 surveyed in this paper.
cThe full evolutionary timescale of the corresponding transient type.
Individual extragalactic radio transient populations that evolve on similar timescales to VTC J095517.5+690813 (weekly to 1 yr timescales) are also considered in Table 4, including AGN, jetted and off-axis tidal disruption events (TDEs, Mooley et al. 2016), gamma-ray burst (GRB) afterglows (for typical radio timescales and luminosity ranges, see Chandra & Frail 2012; Anderson et al. 2018), and off-axis (orphan) GRBs (Law et al. 2018). A comparison of the extragalactic rates indicates that AGN are the most likely contaminants, with a potential contribution of up to one within the total area surveyed with the VLA. This is reasonable consistent with the surface density calculated by Bell et al. (2015) from a 5.5 GHz survey of the Chandra Deep Field South (ρ < 7.5 deg−2 above 70 μ Jy) on 2.5 month and 2.5 yr timescales, with the 2.5 month cadence being roughly similar to a subset of timescales probed by our VLA epochs. This rate predicts <0.5 background transient events within the 0.076 deg2 area of M81 surveyed by the VLA (again making the same flux density scaling assumption).
While it is not possible to rule out a background variable AGN for VTC J095517.5+690813, its position within the northern spiral arm of M81 (see Fig. 3) strongly hints at an association local to M81. Additionally, given that there is no obvious optical association at the position of VTC J095517.5+690813 (see Fig. 5), it is unlikely that we are observing a background active galaxy through the disc of M81. For the rest of this paper, we will focus on non-nuclear radio transients that are local to M81 as possible explanations for VTC J095517.5+690813.
4.2 A transient local to M81
The types of radio transients that are commonly observed in nearby galaxies include core-collapse SNe and some extreme XRBs. Less common potential classes may include magnetar flares and binary neutron star (BNS) mergers, though few such cases have been studied. We compare the timescale, luminosity, and multiwavelength properties of VTC J095517.5+690813 to these source classes in Table 5. We immediately rule out several potential classifications for VTC J095517.5+690813 based on a comparison with their typical peak radio luminosities. These include the rare radio flares associated with giant γ-ray magnetar flares (e.g. SGR1900+14 and SGRB1806-20; Frail, Kulkarni & Bloom 1999; Gaensler et al. 2005; Gelfand et al. 2005), which are at least 200 times less luminous than VTC J095517.5+690813, making them an unlikely candidate even if they do have similar flare timescales and multiwavelength properties. In addition, the radio emission from the BNS merger GW170817 associated with GRB 170817A (Abbott et al. 2017a,b) also has similar timescales to VTC J095517.5+690813, but with a peak luminosity two orders of magnitude brighter. The radio emission from GW170817 is thought to arise from an off-axis relativistic jet (Mooley et al. 2018b) and is also detected across the entire electromagnetic spectrum, unlike VTC J095517.5+690813, making a BNS merger scenario similarly unlikely (note that due to the small sample size of gravitational-wave-detected BNS mergers, we do not know the full range of their energetics, particularly for more off-axis or choked jet scenarios; see Mooley et al. 2018a, for a summary). We discuss our comparisons to SNe and XRB accreting systems in more detail in the following.
Properties of VTC J095517.5+690813 compared to other transient classes and sources assuming they are located in M81. The tabulated values are based on best-studied sources.
| Source/Type | Radio flare timescalesa | Peak Lum | Radio short-term | X-ray | Optically | Refe | Candidatef | Conflicting | Compatible | |
|---|---|---|---|---|---|---|---|---|---|---|
| (Rise) | (Decay) | (erg s−1 Hz−1) | variabilityb | detectedc | detectedd | propertiesg | propertiesh | |||
| (1) | (2) | (3) | (4) | (5) | (6) | |||||
| VTC J095517.5+690813 | 2.6–112 d | >2 months | 1.5 × 1024 | N | N | N | 1 | |||
| CCSN | days–months | days–yearsi | 1026−1029 | S | S | Y | 2 | N | 3,4,5,6 | 1,2 |
| Peculiar SN (Type IIP) | days | days–yearsi | 4 × 10²³−1026 | S | S | Y | 3–5 | ? | 4,5,6 | 1,2,3 |
| Magnetar giant flare | days | days–months | ≲ 1022 | N | Y | N | 6–8 | N | 3,5 | 1,2,4,6 |
| BNS merger (GW170817) | months | months–years | 2 × 1026 | N | Y | Y | 9–12 | N | 3,5,6 | 1,2,4 |
| LMXB | hours–days | days–months | ≲ 1023 | Y | Y | S | 13–25 | N | 3,4,5,6 | 1,2 |
| HMXB (Cyg X-3) | hours–days | days–months | ≲ 1024 | Y | Y | Y | 26–29 | N | 4,5,6 | 1,2,3 |
| Absorbed HMXB (SS 433) | hours–days | days | ≲ 1023 | Y | N | Y | 30–34 | N | 2,3,4,6 | 1,5 |
| IMBH (HLX-1) | days | days | 6.5 × 1026 | Y | Y | Y | 35–36 | N | 2,3,4,5,6 | 1 |
Notes. Some SNe go undetected in the optical band due to line-of-sight absorption.
The LMXB characteristics are based on those sources that have the brightest radio flares, including GRS 1915+105, GRO J1655-40, XTE J1748-288, H1743-322, and V404 Cyg.
The HMXB characteristics are based on Cyg X-3, which has the brightest radio flares of any accreting system in our Galaxy, and one of the few such systems that would be detectable at the distance of M81 in our VLA data.
The absorbed HMXB characteristics are based on SS 433, which is the only such system in our Galaxy.
The IMBH properties are based on HLX-1, which is the strongest IMBH candidate that also produces radio flares.
aThe typical radio flare timescales for both the rise and decay phases.
bIntrinsic short-term radio variability on timescales shorter than a day where Y = Yes, N = No, and S = Sometimes. Note that radio transients may scintillate when the source size is small.
cX-ray detection refers to an X-ray luminosity of Lx ≳ 1037 erg s−1 where Y = Yes, N = No, and S = Sometimes.
dOptical detection refers to any reported optical counterpart where Y = Yes, N = No, and S = Sometimes.
eReferences – 1: This paper, 2: Perez-Torres et al. (2015), 3: Turtle et al. (1987), 4: Pooley et al. (2002), 5: Beswick et al. (2005), 6: Frail, Kulkarni & Bloom (1999), 7: Gaensler et al. (2005), 8: Gelfand et al. (2005), 9: Hallinan et al. (2017), 10: Mooley et al. (2018a), 11: Mooley et al. (2018b), 12: Dobie et al. (2018), 13: Han & Hjellming (1992), 14: Mirabel et al. (1994), 15: Hjellming & Rupen (1995), 16: Fender et al. (1997), 17: Pooley & Fender (1997), 18: Fender et al. (1999), 19: Hjellming et al. (2000), 20: Fender & Belloni (2004), 21: Brocksopp et al. (2007), 22: McClintock et al. (2009), 23: Jonker et al. (2010), 24: Tetarenko et al. (2017), 25: Tetarenko et al. (2019), 26: Gregory & Kronberg (1972), 27: Waltman et al. (1995), 28: Miller-Jones et al. (2004), 29: Corbel et al. (2012), 30: Fiedler et al. (1987), 31: Trushkin, Goranskij & Kotani (2006), 32: Trushkin, Nizhelskij & Zhekanis (2011), 33: Trushkin, Nizhelskij & Tsybulev (2012), 34: Trushkin et al. (2018), 35: Webb et al. (2012), 36: Cseh et al. (2015a).
fCandidate refers to whether the corresponding source type is a viable classification for VTC J095517.5+690813 where N = No and ? = possible.
gCharacteristics that are not consistent with VTC J095517.5+690813. The listed numbers correspond to the number labelling of the columns.
hCharacteristics that are consistent with VTC J095517.5+690813. The listed numbers correspond to the number labelling of the columns.
iRadio flare decay timescales of years mainly pertain to interacting SNe (see Section 4.2.1).
4.2.1 Radio supernova
M81 is regularly monitored for novae, yielding several detections per year (Hornoch et al. 2008), which are routinely reported as ATels but no optical transient was reported at the position of VTC J095517.5+690813. This does not necessarily rule out an SN identification as an archival search at 1.4 GHz resulted in the discovery of a heavily obscured, presumably Type II (core-collapse) SN in galaxy NGC 4216 (Levinson et al. 2002; Gal-Yam et al. 2006). However, this scenario is unlikely given that low extinction levels are expected along the line of sight when viewing a face-on spiral. Therefore, the lack of any reported optical transient at the position of VTC J095517.5+690813 already discourages an SN association.
A radio luminosity and timescale comparison of VTC J095517.5+690813 to core-collapse (CC) (including peculiar) SNe can be found in Table 5. While CC SNe span a wide range of peak radio spectral luminosities (Perez-Torres et al. 2015),15 the peak luminosity of VTC J095517.5+690813 is at least an order of magnitude fainter than most known events, with the exception of the peculiar (Type IIP) SN 1987A, which peaked at LR, ν = 4 × 10²³ erg s−1 Hz−1 but faded away within days (Turtle et al. 1987). However, SN 1987A is also an interacting SN as it has shown a continuous increase in radio flux for over 25 yr (Zanardo et al. 2010; Cendes et al. 2018) and is now exceeding the initial reported peak luminosity. This late-time radio emission is produced by a collisionless shock that is generated by the deceleration of the SN ejecta by circumstellar material (e.g. Katz, Budnik & Waxman 2010; Murase et al. 2011; Murase, Thompson & Ofek 2014). In fact, many radio SNe can be extremely long-lived (>10 yr, e.g. SN 1988Z; Williams et al. 2002), show late-time light-curve features (e.g. SN 2014C; Anderson et al. 2017), and in some cases sinusoidal modulations due to companion interactions (e.g. SN 1979C, 2001ig; Weiler et al. 1992; Ryder et al. 2004). Given the longevity of VTC J095517.5+690813 (>2 months), we cannot rule out radio emission from late-time shockwave interactions with the circumstellar medium produced by a CC SNe at luminosities similar to SN 1987A.
4.2.2 X-ray binary or IMBH
Table 5 also shows a comparison between the peak radio luminosities and decay timescales of VTC J095517.5+690813 and XRBs. We rule out high-mass X-ray binaries (HMXBs) as they have bright optical counterparts (usually from an OB companion star), whereas VTC J095517.5+690813 does not (see Fig. 5). In addition, the only Galactic HMXB that even reaches similar radio luminosities to VTC J095517.5+690813 is Cyg X-3 but usually over much faster timescales, with the jets displaying short-term variability (Gregory & Kronberg 1972; Waltman et al. 1995; Miller-Jones et al. 2004; Corbel et al. 2012). Unlike VTC J095517.5+690813, Cyg X-3 is also always X-ray bright, with average X-ray luminosities ranging from Lx ∼ 1037 to 1039 erg s−1 (e.g. Watanabe et al. 1994; Hjalmarsdotter et al. 2008; Szostek, Zdziarski & McCollough 2008; Koljonen et al. 2010, and references therein). For similar reasons, we also rule out an intermediate mass black hole (IMBH; ∼102−105|$\, \mathrm{M}_{\odot }$|) accreting system analogous to HLX-1 (Farrell et al. 2009), which is also optically and X-ray luminous, with rapidly flaring radio jets that are ∼400 times more luminous than VTC J095517.5+690813 (Webb et al. 2012; Cseh et al. 2015a).
Galactic low-mass X-ray binaries (LMXBs) are known to emit flaring radio jets as they transition between different X-ray spectral or accretion states, particularly from the hard to soft X-ray state (Fender et al. 2004). Even the most powerful LMXBs in the Milky Way cannot produce radio flares that are detectable out at M81 at the sensitivity of our VLA observations, with the majority of flares only lasting a few days (see Table 5). None the less, there are a few cases of Galactic LMXBs that have experienced radio flares with much longer decay phases (∼100 d, e.g. V404 Cyg, V6461 Sgr, and H1743-322; Han & Hjellming 1992; Hjellming et al. 2000; McClintock et al. 2009) or periods of stable radio flux (GRS 1915+105; Fender & Belloni 2004), which are more consistent with the timescale of VTC J095517.5+690813. However, typical LMXB minimum energies are also at least an order of magnitude lower than our estimate for VTC J095517.5+690813 (see Table 6), with few reaching a similar jet power (Fender et al. 1999; Brocksopp et al. 2007; Dunn et al. 2010; Curran et al. 2014; Pietka et al. 2017; Tetarenko et al. 2017). Another important difference to LMBXs is the lack of short-term radio variability displayed by VTC J095517.5+690813 within the four 1 h epochs at which VTC J095517.5+690813 was detected. The lack of X-ray counterpart and short-term radio variability, combined with the longer decay timescales and high radio luminosity argue against an LMXB scenario for VTC J095517.5+690813.
Comparison of VTC J095517.5+690813 to Galactic LMXBs and extragalactic transients.
| Source name | Radio flare timescalesa | Peak Radio Lum | Radio short-term | T|$_{\mathrm{B,min}}^{{c}}$| | E|$_{\mathrm{min}}^{{d}}$| | P|$_{\mathrm{min}}^{{e}}$| | Bf | Peak X-ray Lumg | Opticallyh | Refi | |
|---|---|---|---|---|---|---|---|---|---|---|---|
| (Rise) | (Decay) | (erg s−1 Hz−1) | variabilityb | (K) | (erg) | (erg s−1) | (G) | (erg s−1) | detected | ||
| VTC J095517.5+690813 | 2.6–112 d | >2 months | 1.5 ± 0.1 × 1024 | N | 8000 − 1011 | ∼1044 − 1046 | ∼1039 | 2 × 10⁻³ − 0.05 | ≲ 6 ± 3 × 1035 | N | 1–2 |
| M31 microquasar | hours – days | days | 2.70 ± 0.06 × 10²³ | Y | 7 × 10¹⁰ | ∼1044 | ∼1038 | ∼7 × 10⁻³ | 1.26 ± 0.2 × 1039 | N | 3 |
| 43.78+59.3 (in M82) | ≲ 4 d | >19 months | ∼1.4 × 1025 | N | 2 × 10⁸ | ∼6 × 1044 | ∼1039 | ∼0.07 | ≲ 2 × 1037 | Yj | 4–7 |
| Ho II X-1 | ? | ≳ 1.5 yr | 4.1 ± 0.2 × 1024 | N | 1.5 × 10⁵ | 2.6 × 1049 | 1039 − 1040 | ∼7.7 × 10⁻⁴ | ∼1040 | Yk | 8–14 |
Notes. The brightness temperature, estimated minimum energy, mean power (jet power) and magnetic field were calculated for the M31 microquasar, 43.78+59.3 and Ho II X-1 based on equations from Middleton et al. (2013) and Fender (2006) if unavailable in the literature. The Ho II X-1 properties relate to the core radio emission (core-lobe morphology) rather than from the large scale radio bubble.
aThe typical radio flare timescales for both the rise and decay phases.
bIntrinsic short-term radio variability on timescales shorter than a day where Y = Yes and N = No.
cThe reported brightness temperature is calculated using the shortest observed radio variability.
dThe estimated minimum energy associated with a finite volume of synchrotron emitting plasma based on the peak radio luminosity and assuming equipartition.
eThe related mean power (jet power) of the radio flare.
fThe corresponding magnetic field strength.
gThe peak X-ray luminosity in the 0.3–10.0 keV energy range.
hOptical detection refers to any reported optical counterpart where Y = Yes and N = No.
iReferences – 1: This paper, 2: Pietka et al. (2017), 3: Middleton et al. (2013), 4: Muxlow et al. (2010), 5: Joseph et al. (2011), 6: Gendre et al. (2013), 7: Mattila et al. (2013), 8: Zezas, Georgantopoulos & Ward (1999), 9: Pakull & Mirioni (2002), 10: Kaaret, Ward & Zezas (2004), 11: Miller et al. (2005), 12: Cseh et al. (2012), 13: Cseh et al. (2014), 14: Cseh et al. (2015a).
jA very faint optical counterpart to 43.78+59.3 was detected in NIR (Mattila et al. 2013).
The other form of accreting system worth comparing to are absorbed Galactic HMXBs such as SS 433, which has radio flares of the order of 1–2 Jy (Fiedler et al. 1987), but a faint X-ray luminosity (Lx ∼ 1035−1036 erg s−1; Marshall et al. 1979; Marshall, Canizares & Schulz 2002), when compared to other HMXBs. Its X-ray faintness is likely due to the central engine being viewed edge-on and thus obscured by material along the line of sight (note that recent observations with the Nuclear Spectroscopic Telescope Array demonstrate that SS 433 is likely accreting in the super-Eddington regime; Middleton et al. 2018). However, the radio flares from SS 433 are shorter lived, less luminous (e.g. Trushkin et al. 2006, 2011, 2012, 2018), and experience a shallower dynamic range between their peak and the quiescent radio luminosity when compared to VTC J095517.5+690813 (Fiedler et al. 1987). None the less, SS 433 also has persistent radio emission produced by its powerful jets impacting the surrounding environment, causing them to inflate an elongated synchrotron nebula (bubble; e.g. Dubner et al. 1998; Broderick et al. 2018).
Overall, the longevity of VTC J095517.5+690813 is still at odds with all the Galactic accreting systems we have discussed thus far and is therefore unusual when compared to what we usually observe from radio jets associated with accretion-powered outbursts. We therefore turn our attention to the more elusive extragalactic radio transients, comparing VTC J095517.5+690813 to those that have been identified as XRBs or at least accretion candidates.
4.3 Comparison to extragalactic accreting transients
A small number of non-nuclear and likely accreting extragalactic radio transients have been reported in the literature. These include the transients detected in the M31 (Middleton et al. 2013), M82 (Muxlow et al. 2010), and Cygnus A (Perley et al. 2017) galaxies. We immediately disregard the Cygnus A transient as it is five orders of magnitude more radio luminous (LR, ν = 3 × 1029 erg s−1 Hz−1) than VTC J095517.5+690813 and is suggested to be a secondary supermassive black hole in orbit around the Cygnus A primary. In Table 6, we compare the flare timescales, peak radio luminosity, short timescale variability, multiwavelength characteristics and properties such as the brightness temperature, minimum energy, jet/minimum power, and magnetic field strength (Fender 2006) of extragalactic radio transients to VTC J095517.5+690813.
Table 6 shows that VTC J095517.5+690813 has quite different characteristics to the M31 microquasar, which was one of the most radio luminous extragalactic XRBs ever detected. This microquasar also showed short-term variability on minute timescales that could be attributed to either intrinsic variations or interstellar scintillation, which demonstrated its unusually high radio luminosity was due to the jet being Doppler boosted (Middleton et al. 2013). While VTC J095517.5+690813 is a factor of ∼5 times more radio luminous than the M31 transient and at least that many times more luminous than the brightest Galactic XRBs, it showed no evidence for short-term variability (and therefore scintillation), indicating the radio source was unlikely to be compact. However, this does not discount variability for VTC J095517.5+690813 if compared to a random sampling of the M31 transient radio detections. If placed at the distance of M81, the M31 transient could look stable over the 30–40 d of radio monitoring (though barely detected at 3σ in our VLA observations). The M31 microquasar was also X-ray bright and briefly accreting in the Eddington regime.
A characteristic that both the M31 and M81 transients do share is a lack of a bright optical counterpart. Middleton et al. (2013) argue that this rules out a high-mass OB-type donor star and that the M31 transient is more likely to be accreting from a low-mass companion. If VTC J095517.5+690813 is an accreting system, it too may have a low-mass donor star. A low donor mass also prevents us from drawing associations with nearby star-forming regions as LMXBs receive a natal kick from the SN of the primary, resulting in peculiar velocities of between tens and a few hundred km s−1 (Miller-Jones 2014).
The M81 radio transient shares more characteristics with 43.78+59.3, the radio transient in M82 that was discovered by Muxlow et al. (2010). Several classifications were suggested but the most likely is a stellar mass accreting system (Muxlow et al. 2010; Joseph et al. 2011). However, 43.78+59.3 would be among the brightest microquasar radio flares detected, being a factor of 10 times more luminous than VTC J095517.5+690813 (as there are only approximate distance estimates for M82, e.g. Dalcanton et al. 2009; Foley et al. 2014, we assume the M81 Cepheid distance to M82 as these two galaxies are interacting). In order to investigate the effect of Doppler boosting on the observed radio luminosity of 43.78+59.3, we used the shortest observed variability, which was between two observations separated by ∼4 d when the source was observed to switch-on (Brunthaler et al. 2009; Muxlow et al. 2009, 2010), with the flux density change corresponding to a brightness temperature of TB ≳ 2 × 10⁸ K, which is not constraining enough to confirm beaming (see arguments in Section 3.1.3). 43.78+59.3 also shows a minimum energy, related mean jet power, and magnetic field strength values consistent with those calculated for VTC J095517.5+690813 (see Table 6).
The potential identification of 43.78+59.3 as a traditional LMXB was challenged by Joseph et al. (2011) as it displayed atypical characteristics, such as its longevity and lack of short-term variability, with a nearly constant optically thin radio spectral index of α ∼ −0.7 over more than 150 d (Muxlow et al. 2010). Combined with no detectable X-ray counterpart, Joseph et al. (2011) suggested that 43.78+59.3 may be an SS 433 analogue due to similarities such as its more consistent radio flux density compared to other microquasar flares, its optically thin (steep) radio spectrum (α ≈ −0.5; Dubner et al. 1998) and its faint X-ray luminosity. An extragalactic analogue of SS 433 is NGC 7793-S26 (Soria et al. 2010), again showing radio emission in the form of lobes and a surrounding cocoon, rather than from the core. Additional evidence for a radio nebular identification for 43.78+59.3 is that it was marginally resolved by very long baseline interferometry (VLBI) observations when it was 250 d old, which indicated an expansion velocity that would not be possible for an SN (Muxlow et al. 2010).
The properties of VTC J095517.5+690813, such as its luminosity, longevity, and lack of short-term variability, argue against a transient jet like those seen from Galactic and extragalactic XRBs (such as the M31 microquasar) but may still indicate the interaction of XRB jets with the surrounding environment. We now investigate the possibility of VTC J095517.5+690813 being an unresolved radio nebula associated with an outbursting accretion event.
4.4 The birth of a ULX radio nebula
The M82 transient 43.78+59.3 and potentially VTC J095517.5+690813 show properties that may be indicative of a newly born synchrotron radio nebula and thus similar to those of ULX radio bubbles and/or lobes. Traditionally, a ULX classification is based on the X-ray luminosity threshold of Lx ≳ 1039 erg s−1. However, there are several sources that have a radiative luminosity below this limit but have a kinetic power inferred from their surrounding nebula (jet power) of Pjet > 1039 erg s−1 (e.g. SS 433, NGC 7793-S26, M83 MQS1, and NGC 300-S10; Marshall et al. 2002; Pakull, Soria & Motch 2010; Soria et al. 2010, 2014; Urquhart et al. 2019). The low levels or lack of X-ray emission could be due to the source being in a low accretion state or our view being obscured by absorbing material along our line of sight (e.g. SS 433). For example, the source may be viewed along the plane of the accretion disc, which is likely puffed up in its outer regions, and additional obscuration could be caused by a circumbinary disc in the same plane (Kaaret, Feng & Roberts 2017). None the less, such a high jet power indicates periods of supercritical accretion regardless of whether the radiative power of the source is observed to be sub-Eddington. As we are interested in jet power for the purposes of this study, we will refer to those microquasars with supercritical jet powers inferred from their surrounding nebulae as ULXs (i.e. those listed above).
Both VTC J095517.5+690813 and 43.78+59.3 are X-ray faint but have radio luminosities consistent with those of ULX radio bubbles (νLν ∼ 2 × 1034 to 2 × 1035 erg s−1 at 5 GHz; van Dyk et al. 1994; Miller et al. 2005; Urquhart et al. 2018) and as previously mentioned, Joseph et al. (2011) have already suggested that 43.78+59.3 is an analogue of SS 433 and NGC 7793-S26.16 Methods for calculating the jet power from the radio luminosity of a microquasar nebula have proven to be very inaccurate so we instead used the peak luminosity, assuming equipartition, to calculate a mean power of ∼1039 erg s−1 for VTC J095517.5+690813 and 43.78+59.3, indicating that both may be consistent with a super-Eddington accreting source (see Table 6).
One big difference between VTC J095517.5+690813, 43.78+59.3 and existing ULX radio bubbles are their lifetimes. ULX bubbles have characteristic lifetimes of ∼104–105 yr) and such radio nebulae are usually assumed to be powered by nearly continuous energy injection for over that period (Soria et al. 2010). However, high spatial resolution radio observations of Ho II X-1 have demonstrated that there is a triple radio structure within its larger radio bubble. This core and lobe morphology is indicative of a collimated jet structure produced by discrete ejecta (Cseh et al. 2014). All three radio components are optically thin, arguing against the direct detection of a self-absorbed compact jet usually associated with the canonical hard state of Galactic XRBs but instead suggesting that the lobes are from a former epoch of activity while the core, which is brighter than the lobes, is associated with the most recent ejection event (Cseh et al. 2014). Follow-up radio observations 1.5 yr later showed that the core was resolvable with VLBI to a size of 16.4 mas and had faded by more than a factor of 7, likely caused by adiabatic expansion losses that dominate over synchrotron cooling. Cseh et al. (2015b) estimated that the core ejecta age is ≥2.1 yr but perhaps between ∼13–46 yr. In contrast, the lobes remained at a more consistent flux density and are now brighter than the core, indicating they likely represent the longer lived outermost interaction of the jetted ejecta with the surrounding medium where their mechanical energy is converted to radiation (Cseh et al. 2015b). The discrete ejection events observed in Ho II X-1 suggest that ULX radio bubbles may be inflated by transient jets on timescales of only a few hundred years (Cseh et al. 2014). Given that VTC J095517.5+690813 and 43.78+59.3 have comparable radio luminosities to the combined core and lobe luminosity of Ho II X-1 as observed in 2012 (νLν ≈ 2 × 1034 erg s−1; Cseh et al. 2014), it is possible these two transients could be younger versions of such a radio core and/or lobe nebula. Compact radio bubbles are also not unusual as one also has been observed around ULX IC 342 X-1. While this radio clump was unresolved with the VLA, it was resolved-out with VLBI observations indicating it is extended and likely nebular in nature (Cseh et al. 2012).
4.4.1 ULX radio bubble rates
We now investigate whether the possibility of both VTC J095517.5+690813 and 43.78+59.3 being newly born ULX radio nebulae is consistent with the rates of known ULXs. If we limit the sample of ULXs to be within 5 Mpc, the Updated Nearby Galaxy Catalog (Karachentsev, Makarov & Kaisina 2013) lists 57 galaxies with reasonably high stellar masses of >108.49 M⊙ (corresponding to the lowest mass galaxy with a known ULX in the Swartz et al. 2011 catalogue) beyond the Local Group (we used the K-band luminosity as the proxy for galaxy stellar mass; see Bell et al. 2003, and references therein). Of these 57 galaxies, at least 14 contain ULXs, totalling at least 20 ULXs, including ULXs catalogued in Swartz et al. (2011), the two ULXs in NGC 1313 (Colbert & Ptak 2002), and the three X-ray faint, extragalactic ULX radio bubbles mentioned above (NGC 7793-S26, M83 MQS1, and NGC 300-S10). This corresponds to ≳0.35 ULXs per galaxy within 5 Mpc. Of the 20 known extragalactic ULXs within 5 Mpc, at least 6 have associated radio nebulae (NGC 5408 X-1, NGC 7793-S26, IC 342 X-1, Ho II X-1, M83 MQS1, and NGC 300-S10; Kaaret et al. 2003; Miller et al. 2005; Soria et al. 2006; Pakull et al. 2010; Soria et al. 2010; Cseh et al. 2012; Soria et al. 2014; Urquhart et al. 2019), corresponding to 30 per cent of the ULX population. This percentage is also consistent with the Pakull & Grisé (2008) estimate for extragalactic ULXs with shock-ionized optical bubbles, which are also tracers of strong ULX outflows (like jets or winds). This corresponds to ≳0.1 ULXs with associated radio nebulae per galaxy within 5 Mpc. If we assume that VTC J095517.5+690813 and 43.78+59.3 are indeed newly born ULX radio lobes, then by also including Ho II X-1, there are at least three known ULXs within 5 Mpc that exhibit evidence of short-lived outflow events, corresponding to 0.05 per galaxy. This is only a factor of 2 lower than the number of persistent ULX radio nebulae within 5 Mpc, which may suggest that some fraction of bubbles are inflated by the short-lived ejecta from sources such as VTC J095517.5+690813, 43.78+59.3, and Ho II X-1.
5 CONCLUSIONS
The radio transient described in the paper is the first to be discovered as part of this VLA survey of M81, resulting in a preliminary surface density of |$13.2^{+30.2}_{-10.9}$| deg−2 to a 3σ flux density limit of 75 μJy for this galaxy. However, the nature of the new radio transient is still unknown. With the available data, it is not possible to rule out a background active galaxy or long-term SN shockwave interactions with a dense circumstellar medium from an unusual SN similar to SN 1987A. The M81 transient VTC J095517.5+690813 is also more luminous than all but the very brightest radio flares observed from Galactic XRBs. However, its longevity and lack of short-term variability are at odds with such characteristics in the same Galactic systems and also the transient ULX in M31. The radio properties of VTC J095517.5+690813, including the minimum energy, jet power, and magnetic field strength, are most closely matched to 43.78+59.3, discovered by Muxlow et al. (2010) in M82, likely associated with an accreting source, perhaps similar in nature to SS 433 and NGC 7793-S26 (Joseph et al. 2011). We go one step further to suggest that perhaps both VTC J095517.5+690813 and 43.78+59.3 are the birth of short-lived ULX radio lobes, similar to that observed near the core of Ho II X-1, implying a total of 0.05 such transients per galaxy within 5 Mpc. Such an identification could potentially be a new class of extragalactic radio transient, where their ejecta may be partly responsible for the inflation of some persistent ULX radio bubbles. In order to test this hypothesis, further radio follow-up is required to first determine if VTC J095517.5+690813 is still detectable and has an optically thin spectral index, demonstrating similar behaviour to 43.78+59.3. If VTC J095517.5+690813 were also still at the same flux density or (preferably) brighter, VLBI observations would determine if the source was also extended, as has been shown for 43.78+59.3 (Muxlow et al. 2010). Continued VLBI monitoring of both transients would allow us to determine if they have expanding radio nebulae similar to Ho II X-1, suggesting their identification as short-lived radio nebulae associated with super-Eddington accretion events.
The detection of a radio transient through the M81 VLA monitoring campaign is a proof of concept for the ‘targeted’ observational technique and could therefore be an important strategy for SKA transient science.
ACKNOWLEDGEMENTS
We thank the referee for their careful reading of the manuscript and their recommendations. GEA is the recipient of an Australian Research Council Discovery Early Career Researcher Award (project number DE180100346) and JCAM-J is the recipient of Australian Research Council Future Fellowship (project number FT140101082) funded by the Australian Government. The scientific results reported in this article are based in part on observations made by the Chandra X-ray Observatory as part of Chandra Award Number GO6-17078A (PI: D. Swartz). RU acknowledges that this research is supported by an Australian Government Research Training Program (RTP) Scholarship. TPR thanks the Science and Technology Facilities Council for funding as part of the consolidated grant ST/P000541/1. The National Radio Astronomy Observatory is a facility of the National Science Foundation operated under cooperative agreement by Associated Universities, Inc. This research has made use of data obtained from the Chandra Data Archive and the Chandra Source Catalog, and software provided by the Chandra X-ray Center (CXC) in the application package ciao. Based on observations made with the NASA/ESA Hubble Space Telescope, and obtained from the Hubble Legacy Archive, which is a collaboration between the Space Telescope Science Institute (STScI/NASA), the Space Telescope European Coordinating Facility (ST-ECF/ESA), and the Canadian Astronomy Data Centre (CADC/NRC/CSA). This research has made use of NASA’s Astrophysics Data System. This research has made use of the SIMBAD database (Wenger et al. 2000) and the VizieR catalogue access tool (Ochsenbein, Bauer & Marcout 2000) operated at CDS, Strasbourg, France. We acknowledge the use of NASA’s SkyView facility http://skyview.gsfc.nasa.gov located at NASA Goddard Space Flight Center (McGlynn, Scollick & White 1998). The following python packages and modules were used for this research, including astropy, a community-developed core python package for Astronomy (The Astropy Collaboration 2013, 2018), APLpy, an open-source plotting package for python (Robitaille & Bressert 2012), matplotlib (Hunter 2007), numpy (van der Walt, Colbert & Varoquaux 2011), and scipy (Jones et al. 2001). This research has made use of SAOImage DS9, developed by Smithsonian Astrophysical Observatory.
Footnotes
Note that other point sources in the field were shown to have consistent flux densities (within 1σ) between the two quadrant 1 epochs, and also showed no evidence for short-term variability.
Note that thermonuclear Type Ia SNe remain undetected in the radio band (LR, ν < 3 × 10²³ erg s−1 Hz−1; Chomiuk et al. 2016).
Note that radio nebulae produced by ULXs and Galactic XRBs are uncommon as their existence is dependent on the density of the surrounding medium, timescales of the energy injection, and the jet power. A low-density environment causes any potential radio lobes to quickly dissipate (Heinz 2002).
