


ABSTRACT
We use the eagle simulations to study the connection between the quenching time-scale, τQ, and the physical mechanisms that transform star-forming galaxies into passive galaxies. By quantifying τQ in two complementary ways – as the time over which (i) galaxies traverse the green valley on the colour–mass diagram, or (ii) leave the main sequence of star formation and subsequently arrive on the passive cloud in specific star formation rate (SSFR)-mass space – we find that the τQ distribution of high-mass centrals, low-mass centrals, and satellites are divergent. In the low stellar mass regime where M⋆ < 109.6 M⊙, centrals exhibit systematically longer quenching time-scales than satellites (≈4 Gyr compared to ≈2 Gyr). Satellites with low stellar mass relative to their halo mass cause this disparity, with ram pressure stripping quenching these galaxies rapidly. Low-mass centrals are quenched as a result of stellar feedback, associated with long τQ ≳ 3 Gyr. At intermediate stellar masses where |$10^{9.7}\lt M_{\star }\lt 10^{10.3}\, \rm M_{\odot }$|, τQ are the longest for both centrals and satellites, particularly for galaxies with higher gas fractions. At |$M_{\star }\gtrsim 10^{10.3}\, \rm M_{\odot }$|, galaxy merger counts and black hole activity increase steeply for all galaxies. Quenching time-scales for centrals and satellites decrease with stellar mass in this regime to τQ ≲ 2 Gyr. In anticipation of new intermediate redshift observational galaxy surveys, we analyse the passive and star-forming fractions of galaxies across redshift, and find that the τQ peak at intermediate stellar masses is responsible for a peak (inflection point) in the fraction of green valley central (satellite) galaxies at z ≈ 0.5–0.7.
1 INTRODUCTION
Large observational galaxy surveys have demonstrated a distinct bimodality in the galaxy colour–magnitude diagram (CMD) (e.g. Strateva et al. 2001; Baldry et al. 2006; Wyder et al. 2007; Taylor et al. 2015). At low redshift, two distinct populations of galaxies emerge separated by their colour, accordingly denoted the red sequence and the blue cloud. The red sequence is tight, and typically home to early-type galaxies with little star formation activity. The blue cloud is comparatively more dispersed, and is normally home to late-type galaxies with higher star formation rates (SFRs; Baldry et al. 2004; Driver et al. 2006; Schiminovich et al. 2007). Between these two populations is a region denoted the green valley, which appears in observations to be sparsely populated (Martin et al. 2007; Salim 2014) [though work by Eales et al. (2018) demonstrates that observational biases could be responsible for the underdensity]. Galaxy bimodality can also be observed in SSFR-stellar mass space (Wyder et al. 2007), where the blue cloud population in colour–mass space is correlated with the MS population in the SSFR-stellar mass plane (Noeske et al. 2007; Davies et al. 2016b).
Since the green valley is nominally found to be sparsely populated, it has been theorized that galaxies evolve from the blue cloud to the red sequence rapidly as their SFRs slow, the colour transformation being indicative of a process broadly referred to as star formation quenching (e.g. Blanton 2006; Borch et al. 2006; Bundy et al. 2006; Fang et al. 2013; Moustakas et al. 2013; Salim 2014; Peng, Maiolino & Cochrane 2015; Bremer et al. 2018). Star formation quenching can be the result of one or a combination of mechanisms which can be classified as internal or external. An internal quenching mechanism stifles star formation due to some galaxy-localized process, while an external quenching mechanism slows star formation in a galaxy by some environmentally driven effect. Internal quenching mechanisms include, but are not limited to: active galactic nuclei (AGN) activity (Di Matteo, Springel & Hernquist 2005; Murray, Quataert & Thompson 2005; Bower et al. 2006; Croton et al. 2006; Hopkins et al. 2006; Lagos, Cora & Padilla 2008), supernovae feedback (Springel, Di Matteo & Hernquist 2005; Cox et al. 2006b; Dalla Vecchia & Schaye 2012; Lagos, Lacey & Baugh 2013), and virial shock heating (Birnboim & Dekel 2003; Kereš et al. 2009). External quenching mechanisms include, but are not limited to: major and minor mergers (Toomre & Toomre 1972; Springel 2005; McNamara et al. 2006; Cox et al. 2006a), ram pressure stripping (Gunn & Gott 1972; Knobel et al. 2013; Brown et al. 2017), and galaxy strangulation (Larson, Tinsley & Caldwell 1980; Balogh, Navarro & Morris 2000; Knobel et al. 2013; Peng et al. 2015). Although we make a clear distinction between these quenching mechanisms, the reader should note that quenching mechanisms can be, and often are, interrelated in a non-linear manner (Hopkins 2008). Most notable is the relationship between AGN activity and galaxy merging events, where angular momentum dissipation acts to funnel matter towards a galaxy’s central supermassive black hole (SMBH) and up-regulate black hole accretion rates (Barnes & Hernquist 1991; Mihos & Hernquist 1996; Hopkins et al. 2008; Kocevski et al. 2012).
Each quenching mechanism, external or internal, could act over different, distinctive time-scales. Any quenching mechanism acts by depleting a galaxy’s cool ISM gas reservoir otherwise available for star formation. Since mechanisms of gas removal or heating could act over different time-scales, the quenching mechanism will determine how long it takes the galaxy to quench (Davé, Finlator & Oppenheimer 2012; Lilly et al. 2013). This idea of a gas reservoir in galaxies acting to regulate star formation is commonly referred to as the ‘bathtub’ model of gas supply in galaxies, which explains how the quantity and properties of gas in a galaxy can change over time through various inflows and outflows.
The primary observational method used to constrain quenching time-scales of galaxies (τQ) – the time it takes for a galaxy to transform from star-forming to passive – draws on an exponentially decaying model of SFR (Wetzel et al. 2013; Schawinski et al. 2014; Hahn, Tinker & Wetzel 2017; Smethurst et al. 2018). Wetzel et al. (2013) found a characteristic e-folding time for star formation in satellite galaxies of τQ < 0.8 Gyr, 2–4 Gyr after infall to a group environment. Schawinski et al. (2014) used SDSS DR7 data to show that there are two distinct pathways that galaxies take in quenching and traversing the green valley, characterized by different quenching time-scales. Early-type galaxies were found to have shorter e-fold quenching time-scales (τQ < 250 Myr), while late-type galaxies would quench more slowly with time-scales τQ ≈ 1 Gyr. Hahn et al. (2017) use SDSS DR7 data to calculate the quenching time-scales of galaxies with stellar masses 109.5 M⊙ < M⋆ < 1011 M⊙. They found characteristic e-folding times of 0.5–1.5 Gyr, implying a total migration time from the star formation MS to quiescence on the order of ≈4 Gyr, with central galaxies typically taking 2 Gyr longer to quench than satellites. Smethurst et al. (2018) also used SDSS DR7 data to investigate the quenching time-scales of slow- and fast-rotators, finding that slow-rotators would quench rapidly (with τQ < 1 Gyr) compared to fast-rotators (which displayed more spread in τQ). Using arguments based on the density of green-valley galaxies in the GAMA survey, Bremer et al. (2018) found a relatively universal crossing time-scale for galaxies with stellar masses 1010.25 M⊙ < M⋆ < 1010.75 M⊙, at z < 0.2 of τQ ≈ 1–2 Gyr. This is in contrast to some of the aforementioned results, which show varying quenching time-scales based on galaxy properties. The recent observational work of Herrera-Camus et al. (2019) used a different method of constraining quenching time-scales in observations. They make physically motivated arguments regarding energy dissipation and gas reservoir depletion time-scales, together with spatially resolved data of a z = 2 galaxy (zC400528) to show that its AGN-driven outflow is capable of expelling central molecular gas in an ‘inside-out’ manner over a time-scale of ≈0.2 Gyr.
Moving away from observational studies, multiple large-scale projects involving the hydrodynamical simulation of galaxy formation have found great success in reproducing several observations of galaxy populations, in recent years becoming state-of-the-art in their capabilities as predictive tools for extragalactic astrophysics. Such simulations include eagle (Crain et al. 2015; Schaye et al. 2015; McAlpine et al. 2016), Illustris-TNG (Pillepich et al. 2018), Horizon-AGN (Dubois et al. 2016), MUFASA (Davé, Thompson & Hopkins 2016), and others.
Some tension exists in the results arising from these new simulations concerning the colour bimodality and quenching time-scales of galaxies. Trayford et al. (2016) used eagle to study the colour evolution of galaxies, concluding that galaxies join the red sequence because either (1) they become satellites in a larger system (the path affecting mostly lower mass galaxies), or (2) because of AGN feedback (the path affecting mostly higher mass galaxies). Using the Horizon-AGN simulation, Dubois et al. (2016) show that star formation quenching, galaxy morphology, and cosmic gas accretion are intricately related, where early-type galaxies require AGN feedback to down-regulate cosmic gas infall and cease star formation to regrow disc structures (see also Sparre & Springel 2017). These different mechanisms act on different stellar mass ranges, and should naturally lead to different quenching time-scales.
In apparent contrast to these conclusions, Nelson et al. (2018) found in the Illustris-TNG simulations that the colour transition time-scale of galaxies (using the colour–mass diagram) was unimodal, on average ≈1.6 Gyr over all stellar mass bins from |$M_{\star }=10^{9}\, $| to |$10^{12.5}\, \rm M_{\odot }$|, with higher mass galaxies typically showing shorter quenching time-scales. The unimodal distribution of quenching time-scales they observed opposes the existence of multiple colour transition pathways with distinct physical time-scales. This said, their work does demonstrate a small peak in quenching time-scales in for |$M_{\star }\approx 10^{10}\, \mathrm{M}_{\odot }$| for the TNG100-1 run for both centrals and satellites. They also found that in general, the behaviour of centrals and satellites in their colour transition was very similar.
The aim of this work is to study the quenching time-scales of galaxies produced by the eagle suite of cosmological simulations using multiple methods, and to connect the distribution of τQ to the physical mechanisms which stifle star formation. In order to maximize the robustness of our approach, we employ two very different methods of quantifying τQ: (i) by analysing the movement of galaxies through colour–mass space (e.g. Trayford et al. 2016; Nelson et al. 2018), and (ii) making use of the movement of galaxies in the SSFR-stellar mass plane. The diverse galaxy population available in eagle makes this simulation (and numerical models of cosmological galaxy formation in general) an ideal test-bed for identifying and quantifying how certain physical mechanisms would produce changes in the distribution of quenching time-scale. In doing so, we add to the developing body of knowledge looking to explain how galaxy colour bimodality in the local Universe has developed, from a mechanistic perspective.
The content we present in this paper is structured as follows. In Section 2 we introduce the eagle simulation suite and sub-grid models that are relevant to this study, as well as how specific physical quantities were extracted from the data base and post-processed. Section 3 isolates the effect of external and internal mechanisms on quenching time-scale distributions. In Section 4 we conclude what these findings tell us about the physical mechanisms acting to quench different galaxies.
2 THE eagle SIMULATIONS
Studying quenching time-scales using a simulation based approach is ideal as it allows for tracking of individual galactic properties over time, without the need for sweeping assumptions regarding galaxy star formation histories which are otherwise necessary to generate observational calculations of τQ. The eagle (Evolution and Assembly of GaLaxies and their Environments) simulation suite (Crain et al. 2015; Schaye et al. 2015) is a collection of cosmological hydrodynamical simulations which follow the evolution of galaxies and cosmological structure from z = 20 to z = 0. In eagle, dark matter (DM) haloes are identified using a field-of-friends (FOF) approach (Davis et al. 1985), and subsequently the subfind algorithm (Springel, Yoshida & White 2001; Dolag et al. 2009) identifies overdensities of particles within these structures, corresponding to galaxies. The ANARCHY (Schaller et al. 2015) set of refinements were implemented on the gadget-3 tree-SPH (smoothed particle hydrodynamics) code (Springel et al. 2005) to perform the eagle simulations over a variety of periodic volumes, at a number of numerical resolutions. eagle adopts the parameters of a ΛCDM universe from Planck Collaboration XVI (2014), with initial conditions outlined in Jenkins (2013). Twenty-nine discrete snapshots of pertinent simulation and post-processed galaxy integrated quantities were taken in each simulation run. For our study, we make use of the Ref-L0100N1504 eagle simulation run, which has a co-moving box size of 100 cMpc, the largest of the suite (Schaye et al. 2015). This run has 15043 DM particles, and the same initial number of gas particles. For more details see Schaye et al. (2015).
Sub-grid physics modules were implemented to treat the physics which are important for galaxy formation and evolution but that happen below the resolution of the simulation. These include: (i) radiative cooling and photoheating, (ii) star formation, (iii) stellar evolution and enrichment, (iv) stellar feedback, and (v) SMBH growth and AGN feedback. In the next section we provide a brief description of how these mechanisms are modelled in eagle.
2.1 Subgrid physics
In an element-by-element approach, photoheating and radiative cooling were applied based on the work of Wiersma et al. (2009). This included the effect of 11 elements which were deemed influential: H, He, C, N, O, Ne, Mg, Si, S, Ca, and Fe (Schaye et al. 2015). The effect of radiation from the UV and X-ray background described by Haardt & Madau (2001) was implemented on each element individually.
Star formation occurs almost exclusively in cold interstellar medium (ISM) gas. Since the eagle simulations do not provide the resolution to model cold, interstellar gas on the required scale, a metallicity dependent density threshold is set, above which, star formation was locally permitted (Schaye et al. 2015). The simulation also imposes a temperature floor of 8000 K, recognizing that the cold gas phase was not modelled effectively (Schaye et al. 2015). Gas particles are converted to star particles stochastically, with the SFR based on tuning a pressure law (Schaye & Dalla Vecchia 2008) to observations of the relationship between gas and SFR surface densities (Kennicutt 1998) at z = 0. Also considered was the energy feedback from star formation in the form of stellar winds, radiation, and supernovae. This involved a purely thermal energy injection in the form of a temperature boost, ΔTSF = 106 K, based on the work of Dalla Vecchia & Schaye (2012), which acts to heat the gas particles sufficiently close to newly formed stars.
Often a distinction is made between quasar-mode and radio-mode galaxies host to AGN (Croton et al. 2006), based on their SMBH accretion efficiency. In eagle, a fixed efficiency was adopted to reduce the number of feedback channels (Schaye et al. 2015). This singular efficiency is closest physically to the more active ‘quasar-mode’ AGN; however, acting as a maintenance mode in the practice (see Bower et al. 2017 for a discussion). SMBHs are seeded in eagle when a DM halo exceeds a virial mass of |$10^{10}\, h^{-1} \, \mathrm{M}_{\odot }$|, with the seed SMBHs having an initial mass of |$10^{5}\, h^{-1} \, \mathrm{M}_{\odot }$|. Subsequently, SMBHs can grow via Eddington-limited-accretion (Schaye et al. 2015), as well as mergers with other SMBHs, according to work by Springel (2005). AGN feedback in eagle involves a purely thermal energy injection into its surroundings. Similar to star formation feedback, this took the form of a purely thermal temperature boost, chosen to be ΔTBH = 108.5 K (Schaye et al. 2015).
2.2 Integrated quantities
At each of the 29 snapshots, each galaxy is post-processed to produce integrated quantities describing its properties. In this work, we make heavy use of galaxy mass, galaxy colour (specifically u∗ − r∗ colour), and SFR measurements. We provide a brief overview of how each of these is calculated below.
We make use of the mass of galaxies calculated in the Aperture, SubHalo, and FOF tables of the eagle data base. In the Aperture table, mass is calculated by summing the mass of the relevant particles within a spherical aperture centred on the minimum of the gravitational potential of a given galaxy. From the Aperture table we used a 30 kpc aperture for stellar mass, gas mass (within 30 kpc), and black hole mass. SFRs are also derived from the Aperture table by summing the instantaneous SFR intrinsic to gas particles within a 30 pkpc spherical radius. We also extracted total gas masses of the galaxy using the SubHalo table, which simply sums the mass of all gas particles belonging to a certain SubHalo. Lastly, we also derive halo mass from the FOF table, which sums the mass of all individual particles belonging a certain FOF group.
Galaxy colour measurements are derived from the Magnitudes table in the database. Magnitudes are calculated in broad-band SDSS (Doi et al. 2010) filters, with methods described in Trayford et al. (2015). Briefly, the spectra produced by the GALAXEV population synthesis model (Bruzual & Charlot 2003) are convolved with the broad-band SDSS filters to produce un-obscured broad-band luminosities, which are then used to calculate the broad-band luminosities of full galaxies. These magnitudes are calculated from a 30 pkpc spherical aperture (which offers the best cutoff between galaxy light and intracluster light), and are not corrected for dust attenuation (i.e. are intrinsic) (Trayford et al. 2015). The magnitudes quoted are rest frame and absolute in the AB system. eagle produces a red sequence and blue cloud of galaxies at z = 0.1 with fractions of galaxies in each that agree well to observations (Trayford et al. 2015). This said, the blue cloud of eagle galaxies stretches to higher luminosities than observations, corresponding to the slight underestimate of the passive fraction of massive galaxies in the simulation.
2.3 Measuring quenching time-scales in EAGLE
We measure the quenching time-scale, τQ, of galaxies in eagle by tracking their u∗ − r∗ (intrinsic) colour, specific star formation rates (SSFR) and stellar mass history through redshift. This is achieved using the information stored in the publicly available eagle data base (McAlpine et al. 2016). We first identify all galaxies that by z = 0 are quenched, based on their position in either the u∗ − r∗ – or SSFR-stellar mass planes. We then compute the difference between the lookback time at which each passive galaxy was last part of the star-forming population, and when they subsequently appeared in the quenched population (based on these two different methodologies, which we describe in more detail below). Note that in either of our definitions we take into account that galaxies in the corresponding planes evolve and thus, the exact definition of star-forming and passive is redshift dependent.
2.3.1 Colour definition of quenching time-scale
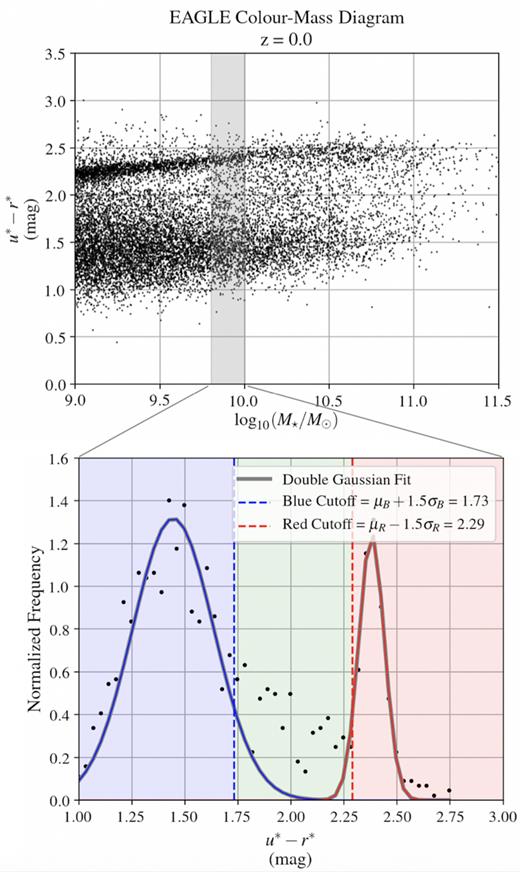
An illustration of the Gaussian fitting criteria to identify the red sequence and blue cloud in binned stellar mass space that we apply to eagle. Each population was defined by its mean ±1.5σ. The region between these two populations defines the green valley (see Section 2.3.1 for details).
2.3.2 SSFR-stellar mass definition of quenching time-scale
The secondary definition (definition 2, referred to as ‘D2’ hereafter) for classifying galaxies as star forming or quenched used their SSFRs directly, instead of using galaxy colour as a proxy of star formation activity. The SSFR-M⋆ plane produces a less well-defined population bimodality, which made producing the cut-off definitions somewhat subjective (Wyder et al. 2007; Ciambur, Kauffmann & Wuyts 2013; Davies et al. 2016a, 2018). We include both D1 and D2 for completeness, and remarkably find our conclusions to be largely consistent between the two definitions.
The method we adopt for D2 is based on the position of the MS star formation, which we quantify with the mean SSFR of galaxies with a star formation cutoff defined in Furlong et al. (2015): log10(SSFRMS/yr−1) > −11 + 0.5z. We took the mean SSFR of the star-forming main sequence (MS), |$\langle \rm SSFR_{\rm MS}(M_{\star })\rangle$|, using 15 bins in stellar mass, spanning from |$M_{\star }=10^9\, \mathrm{M}_{\odot }$| to |$M_{\star }=10^{12}\, \mathrm{M}_{\odot }$|. We then consider ‘transitioning’ galaxies as those which have SSFRs between |$\rm c_{\rm low}\, \rm \langle SSFR(M_{\star })\rangle$| and |$\rm c_{\rm high}\, \rm \langle SSFR(M_{\star })\rangle$|. Star-forming and passive galaxies are consequently defined as those with SSFRs |$\gt \rm c_{\rm high}\, \rm \langle SSFR(M_{\star })\rangle$| and |$\lt \rm c_{\rm low}\, \rm \langle SSFR(M_{\star })\rangle$|, respectively. We adopt values for |$\rm c_{\rm low}$| and |$\rm c_{\rm high}$| such that the number of passive, transitioning, and star-forming galaxies is similar to those obtained with the colour-stellar mass selection of Section 2.3.1, in an attempt to match the subjective thresholds and populations over different definitions. As such, we find the most appropriate multiplicative values to be |$\rm c_{\rm low} = 0.05$| and chigh = 0.5. Using this definition at z = 0, we obtain 3368 quenched galaxies, 2226 quenching galaxies, and 7613 star-forming galaxies. This selection process is illustrated in Fig. 2. Comparing these two definitions, we find that 2990 galaxies are identified as quenched at z = 0 for both D1 and D2 (97.9 per cent of D1 galaxies appear in D2, while 88.8 per cent of D2 galaxies appear in D1). Observational papers have adopted values such as clow = 0.025–0.5 (Béthermin et al. 2015; Davies et al. 2018; Wang et al. 2018), and thus, we consider the values adopted here reasonable compared to those in observations.
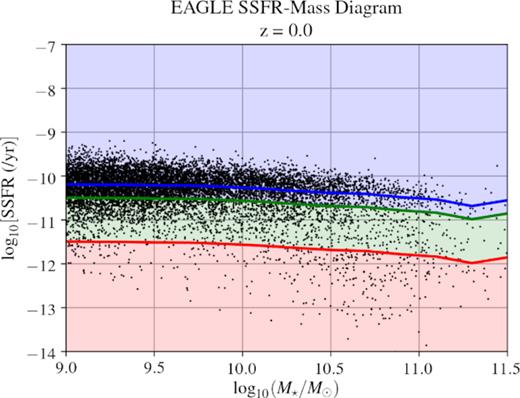
An illustration of the SSFR-M⋆ criteria for the red sequence and blue cloud in binned stellar mass space. Each population was defined by cutoffs in terms of the position of the MS at each stellar mass bin, with values clow = 0.05 (red line) and chigh = 0.5 (green line), below, in between and above these values, galaxies are classified as passive, transitioning, and star-forming, respectively (see Section 2.3.2 for details).
2.4 Reconstructing galaxy formation histories
To reconstruct the formation histories of galaxies, we use the public data base of the eagle simulations, described in McAlpine et al. (2016). Below, we describe the procedure we follow. We limit our study to galaxies with stellar masses |$M_{\star } \gt 10^9 \, \mathrm{M}_{\odot }$|, that are considered as converged (Schaye et al. 2015).
For all galaxies at z = 0, we define their status as a star-forming, quenching, or passive galaxy based on D1 and D2. Quenched galaxies at z = 0 are identified and tracked back through redshift. This yields a sample size of n = 3054 galaxies for D1 and n = 3368 galaxies for D2. The 3054 and 3368 galaxies, respectively, are followed using the merger tree information stored in the data base, described in Qu et al. (2017). If multiple progenitor galaxies exist, the most massive (in stellar mass) progenitor in the previous snapshot is selected as the main progenitor, and we continue tracking this branch. Only redshifts below z = 2 are considered, since at higher redshifts, the passive population is seldom developed, as demonstrated in Fig. 3 for D1 and Fig. 4 for D2. At each snapshot, we record the 30 pkpc stellar mass, 30 pkpc gas mass, 30 pkpc colour, 30 pkpc SFR, 30 pkpc SMBH mass, full subhalo gas mass, FOF group mass, and status of central or satellite of each of the z = 0 quenched galaxies which are being tracked back.
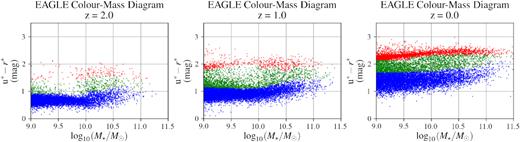
The red sequence developing in eagle from z = 2 to z = 0, as labelled. We see a scarcity of quenched galaxies at intermediate stellar mass, where galaxies are not massive enough to host a large central SMBH, but are also too massive to be greatly influenced by environmental factors, in concurrence with the work of Davies et al. (2019) from GAMA observations, and others. Colours indicate star formation status as per Section 2.3.1: blue symbols show star-forming galaxies, red symbols show quenched galaxies (part of the red sequence), and green symbols show galaxies in the green valley.
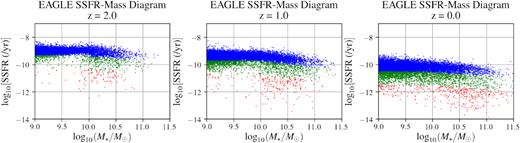
Distribution of galaxies in the SSFR-M⋆ plane, evolving from z = 2 to z = 0, as labelled, in eagle. The MS of star formation decreases in SSFR over time while more galaxies enter the green transition population moving towards the passive population. The passive population develops from both stellar mass ends with a slight underdensity at intermediate stellar mass, similar to Fig. 3, in concurrence with the work of Davies et al. (2019) from GAMA observations, and others. Colours indicate star formation status as per Section 2.3.2: blue symbols show star-forming galaxy (member of MS of star formation), red symbols show quenched galaxies (member of the passive cloud), and green symbols show transitioning galaxies.
To determine whether a galaxy was central or satellite at the time it left the blue cloud, we took the SubGroupNumber of the galaxy at the snapshot it left the blue cloud, and for each snapshot before and after. To be considered a central galaxy, a galaxy was required have SubGroupNumber = 0 at the snapshot before, during and after it left the star-forming population. Those galaxies not classed as central according to this definition were classified as satellites. Using three snapshots as opposed to one to consider for classification avoids some identification issues with the FOF algorithm in EAGLE – those galaxies falling into a larger halo may not yet be considered a satellite of this system, while they are actually being physically affected by the larger group (Trayford et al. 2016). Using three snapshots instead of one for the satellite definition yields 2419 satellites as opposed to 2263 for D1 – meaning 156 galaxies or about 6 per cent of satellites could be potential ‘splashback’ galaxies. Since these galaxies have been processed in a group environment, we believe this classification is physically accurate.
In addition to the quantities above, we also calculate the cumulative number of galaxy mergers, and net SMBH accretion rate. The cumulative number of mergers is calculated by recording the number of times a galaxy had multiple progenitors in the range z = 2 to z = 0, requiring that the secondary-to-primary galaxy stellar mass ratio be no larger than 10. We remind the reader that each progenitor galaxy was required to be above the stellar mass threshold of |$M_{\star }=10^9\, \mathrm{M}_{\odot }$|. The net specific SMBH accretion rate was calculated based on the change in SMBH mass within over four snapshots about the time the galaxy left the blue cloud, divided by relevant lookback time difference between the snapshots concerned and the galaxy’s stellar mass. We included multiple snapshots to calculate the SMBH accretion rate to avoid stochasticity significantly affecting the derived values. We also tested other definitions of SMBH accretion rates, such as the amount of mass the SMBH grew while the galaxy was transitioning the green valley, divided by that time-scale, or the dynamical time-scale of the central 3 kpc stellar overdensity. We found our conclusions to be robust under these different definitions (see Section 3.4).
Once each of the mentioned quantities was calculated, we processed the history of each galaxy to determine which snapshot the galaxy was:
First considered quenched for D1 and D2, and
Last considered star forming for D1 and D2.
The difference between the lookback times of these snapshots was taken as the quenching time-scale of the given galaxy: the time it took for the galaxy to traverse the transition region, for D1 and D2, respectively. Note that because we are using snapshots to define quenching time-scales, our measurements are limited to the cadence of the snapshots in eagle, which prevents us from measuring quenching time-scales much smaller than 1 Gyr (unless quenching occurred at higher redshift). In principle, the quenching could have occurred at any point in the snapshot adjacent (in the appropriate temporal direction) to the one recorded defining the lookback times of when the galaxy joined the red sequence or left the blue cloud. To account for this potential discrepancy, we calculated the quenching time-scale of each galaxy 100 times with red sequence and blue cloud lookback times calculated with added/subtracted random proportions of the appropriate adjacent snapshot cadence. We used all 100 samples of quenching time-scales for each definition to generate error margins for our quenching time-scale distributions.
3 QUENCHING TIME-SCALES OF GALAXIES AND THEIR PHYSICAL ORIGIN
Here we present our analysis of galaxy quenching time-scales in probing the physics behind star formation quenching, and ultimately galaxy bimodality. The results to follow include quenching time-scale distributions, with populations separated based on their condition of central or satellite galaxy, as well as other properties, which we identify with certain mechanisms of quenching. One should note that the exact values of the quenching time-scales are sensitive to the exact definition of green valley/transitioning region. However, we generally find that the trends presented here are robust to these different definitions. All quantities (unless otherwise stated) are taken at the snapshot the given galaxy left the star-forming population, in order to connect to the physical origin of the quenching. In addition, the classification of central or satellite galaxy is taken at the time the galaxy left the star-forming population. This distinction is especially important for passive satellite galaxies at z = 0, as a significant fraction of them were centrals at the time they left the star-forming sequence (see Fig. 5).

The proportion of quenched satellite galaxies at z = 0, which were classed as central around the time they left the blue cloud, as a function of stellar mass. The proportion increases significantly with stellar mass for both D1 (solid line) and D2 (dashed line) definitions, indicating that the physics that quenched the high-mass satellite galaxies is likely the same as that of massive central galaxies.
3.1 Quenching time-scales of central and satellite galaxies
Fig. 6 shows the quenching time-scale distribution produced by eagle galaxies based on the two definitions D1 and D2 outlined in Sections 2.3.1 and 2.3.2, respectively, split further into low-mass centrals, high-mass centrals, and satellite galaxies. The low stellar mass to high stellar mass threshold for central galaxies was set at |$M_{\star }=10^{9.75}\, \mathrm{M}_{\odot }$|, so as to split the stellar mass bimodality for centrals which is illustrated in Fig. 7. We find that the D2 definition gives slightly lower quenching time-scales compared to the results obtained by the D1 definition, which we expect since even in the case of a sudden cessation of star formation, colour transformation would require some non-zero time-scale to complete. None the less, the differences in τQ distributions found between samples are present for both D1 and D2. The main difference is seen for low-mass centrals, where for D1 the τQ peak is observed at 3–4 Gyr, while for D2 there is a distinct knee (as opposed to a peak) in the distribution, a symptom of the systematically reduced quenching time-scales we see for D2. Overall, the median quenching time-scales for all selections shown fall in the 1.4–3.5 Gyr range, which agrees well with the measurements reported by Nelson et al. (2018) using the Illustris-TNG simulations.
![The quenching time-scale (τQ) distribution of z = 0 passive galaxies, separated into whether they were massive centrals (blue, $M_{\star }\gt 10^{10}\, \mathrm{M}_{\odot }$), smaller centrals (cyan, $M_{\star }\lt 10^{10}\, \mathrm{M}_{\odot }$), or satellite galaxies (red) around the time they left the star-forming population, based on D1 [panel (a)] and D2 [panel (b)] definitions of galaxy state. Shaded regions represent 1σ error margins on the frequency in each bin from the 100 τQ samples, each of which have also been jackknifed. In general, satellite galaxies have a higher frequency of τQ ≈ 2–3 Gyr compared to massive centrals for both D1 and D2. The less massive central group exhibits a convincing peak in quenching time-scales at τQ = 3–4 Gyr for D1, and a less prominent but noticeable increase in frequency at τQ = 3–4 Gyr for D2.](https://oup.silverchair-cdn.com/oup/backfile/Content_public/Journal/mnras/487/3/10.1093_mnras_stz1410/1/m_stz1410fig6.jpeg?Expires=1750334595&Signature=cBV6SKlIe~CKJ50x5lPce1weHVX9mebRfbFfU8~Y07ERe6QqkEe50hOeRsTTeFABIP83vG0RnghUtJesmW2KXy2BqSJGU~rti~S2OwpuezsC4diclkaLqDdmh2ggzToLALHDaVLV2121o6UeUHBfDuGjhIfmLwBewSMrYIRO7r10ZBZfbzibklEnvBTaDlj8U6lARi3xhrInH3kr0S5jDqJo4Ah~oz3k4IAsGKFpUHMKpvFpHJNZEo-p2pRQP~46o5hYDJmfbRrcAE0dsCpcbFcC2OOuqMxHyIBuwjKIbZf7mrfn6uUtXBbc3GsyTnZsax4MGViUZEX41pxJKLUI2Q__&Key-Pair-Id=APKAIE5G5CRDK6RD3PGA)
The quenching time-scale (τQ) distribution of z = 0 passive galaxies, separated into whether they were massive centrals (blue, |$M_{\star }\gt 10^{10}\, \mathrm{M}_{\odot }$|), smaller centrals (cyan, |$M_{\star }\lt 10^{10}\, \mathrm{M}_{\odot }$|), or satellite galaxies (red) around the time they left the star-forming population, based on D1 [panel (a)] and D2 [panel (b)] definitions of galaxy state. Shaded regions represent 1σ error margins on the frequency in each bin from the 100 τQ samples, each of which have also been jackknifed. In general, satellite galaxies have a higher frequency of τQ ≈ 2–3 Gyr compared to massive centrals for both D1 and D2. The less massive central group exhibits a convincing peak in quenching time-scales at τQ = 3–4 Gyr for D1, and a less prominent but noticeable increase in frequency at τQ = 3–4 Gyr for D2.
![Median quenching time-scales of passive galaxies at z = 0, separating those that were central (blue) and satellite (red) galaxies around the time they left the star-forming population, as a function of stellar mass, for the D1 [panel (a)] and D2 [panel (b)] definitions of green valley. The shaded regions corresponds to the 16th–84th percentile range for τQ in each stellar mass bin for satellites and centrals, while the dotted margins represent the 1σ error margin on the median in each bin after considering 100 τQ samples and jackknifing each. A peak in quenching time-scale is observed at $M_{\star } \approx 10^{9.7} \, \mathrm{M}_{\odot }$ for all galaxies. A positive correlation between stellar mass and quenching time-scale is observed at lower stellar masses, while a negative correlation is observed at higher stellar masses. This behaviour is seen in both centrals and satellites.](https://oup.silverchair-cdn.com/oup/backfile/Content_public/Journal/mnras/487/3/10.1093_mnras_stz1410/1/m_stz1410fig7.jpeg?Expires=1750334595&Signature=X6n4gN7jCiFP5KF8AmcIjdJCxDO7yuHWI-7oh~9krK7BqXoPABZpww3dHW5C0UaJthYkCXcmGstN0n7O1EfiSCfF5~YpQpKlJVCTqebYqufdYaWipm1bzCjEJ0QxXic4kXR7z1kZ-~TqLQVb3W8E1oqmnEcXI96nTcfqF0-ruzPK5WEuM3l7-mROuVnQeKhkcGf65LQnNDtFlBQmwDeljp93bl0hPqrgOkYvKzoPIufcliScsiUyaZB91kFz1ppTJsYkiSQKr1HoKZP9mEt7-B28Ceftk54o8ECzzs5WcchSksTubo3dsO3YMtmbUEI1WcurH-mzl-ucSzsl1u2LeA__&Key-Pair-Id=APKAIE5G5CRDK6RD3PGA)
Median quenching time-scales of passive galaxies at z = 0, separating those that were central (blue) and satellite (red) galaxies around the time they left the star-forming population, as a function of stellar mass, for the D1 [panel (a)] and D2 [panel (b)] definitions of green valley. The shaded regions corresponds to the 16th–84th percentile range for τQ in each stellar mass bin for satellites and centrals, while the dotted margins represent the 1σ error margin on the median in each bin after considering 100 τQ samples and jackknifing each. A peak in quenching time-scale is observed at |$M_{\star } \approx 10^{9.7} \, \mathrm{M}_{\odot }$| for all galaxies. A positive correlation between stellar mass and quenching time-scale is observed at lower stellar masses, while a negative correlation is observed at higher stellar masses. This behaviour is seen in both centrals and satellites.
We interpret the low-mass central population to represent central galaxies existing in lower mass haloes. For these galaxies, much longer 3–4 Gyr time-scales are commonplace. Since we do not expect environmental effects or AGN activity to be significant for these galaxies (see Sections 3.3 and 3.4), it is clear that the main mode of star formation quenching in these galaxies is stellar feedback, which appears to act over significantly longer time-scales compared to the typical massive central or satellite galaxy. For higher mass central and satellite galaxies (existing in higher mass haloes), we note that multiple factors are expected to be affecting the quenching of these galaxies, and it is therefore more difficult to interpret these histograms without further decoupling. This said, the reader should note that satellites do exhibit a knee in their distribution at the 3 Gyr mark when compared to high-mass central galaxies, for both D1 and D2 definitions of quenching time-scale.
Trayford et al. (2016) studied the pathways in the CMD of galaxies, and found that low-mass satellites and massive centrals quench first, followed by intermediate-mass centrals and satellites. Here, we see that the mechanisms behind those different pathways for centrals and satellites leave a clear imprint in the quenching time-scales of these two populations. Hence, in the following subsections, we explore in more detail what drives the distribution of quenching time-scales, and in which circumstances the quenching time-scales of galaxies can elongate or shorten.
3.2 The dependence of the quenching time-scale on stellar mass
Fig. 7 shows how quenching time-scales depend on stellar mass in eagle, with these time-scales calculated using D1 [panel (a)] and D2 [panel (b)] quenching definitions. D1 and D2 give mostly consistent results in terms of distribution shape. We also split galaxies into satellites and centrals, as per Section 2.4. For both centrals and satellites, we see that there is a peak in quenching time-scales at |$M_{\star }=10^{9.7} \, \mathrm{M}_{\odot }$|, which corresponds well with the underdensity of quenched galaxies at intermediate stellar mass documented in Trayford et al. (2016) and Fig. 3, as well as the observational findings of Davies et al. (2019). As we will discuss in detail, we find that the dearth of galaxies at that mass scale is directly a consequence of their quenching time-scales being on average longer than galaxies at other mass scales, regardless of whether a galaxy is classified central or satellite.
For central galaxies, we see their quenching time-scales to be systematically longer than satellites below |$10^{10} \, \mathrm{M}_{\odot }$|, meaning the peak at intermediate stellar mass is less defined for centrals. This corresponds to the lower mass central population in Fig. 6. The quenching time-scales of satellites and centrals appear to converge above this stellar mass threshold, indicating that the physics occurring to quench high-mass galaxies is not a function of central/satellite classification (and thus less likely to be linked to galaxy environment). The turning point at intermediate stellar mass; however, suggests that there are two possibly mechanisms acting for satellites and centrals at the lower stellar mass end, while there appears to be a different, but unique mechanism responsible for quenching high-mass galaxies. The turning point represents the stellar mass at which gas can accrete and stay in a galaxy most efficiently, where gas content in the host halo is most rich. This is further investigated in Section 3.3, in our discussion of gas fractions.
The bottom panels of Fig. 7 show the histogram of stellar masses of centrals and satellites galaxies. The frequency of satellite galaxies decreases steadily with increasing stellar mass, while centrals display a double-peaked distribution. This double-peaked distribution is connected to the efficiency of baryon collapse and star formation being maximal at stellar masses |${\approx } 10^{10} \, \mathrm{M}_{\odot }$| in both simulations and observations (Behroozi, Wechsler & Conroy 2013; Eckert et al. 2017).
To explain the double-peaked distribution of the central galaxy stellar mass, and also to probe the mechanisms behind quenching time-scales, we explore the connection between the cumulative number of major galaxy mergers in galaxies and the previously mentioned mass transition scale of |${\approx } 10^{10} \, \mathrm{M}_{\odot }$| in Fig. 8. We remind the reader that the mass ratio of each merger was required to be less than 10 for consideration. eagle shows a dramatic increase in the number of mergers experienced by galaxies at |$M_{\star }\gtrsim 10^{10} \, \mathrm{M}_{\odot }$|, which closely corresponds to the turning point in quenching time-scales. This also agrees with observation-based findings, where an increase in the incidence of mergers has been found as stellar mass increases (Robotham et al. 2014). Above this transition mass, the galaxy population in each stellar mass bin moves from satellite- to central-dominated, and we expect from disc- to bulge- dominated: high stellar mass galaxies which have been quenched by z = 0 will typically have undergone multiple merging events. We did not conduct an in-depth investigation on morphology induced changes in quenching time-scales. Correa, Schaye & Trayford (2018) present a detailed analysis of the relationship between morphological and colour transformation of galaxies in eagle, and found that the time-scale for galaxies to change their colour (similar to our τQ in the case of definition D1) were very weakly correlated. They do, however, find a strong correlation for the time at which galaxies join the red sequence and the morphology of galaxies, with early types typically having joined much earlier than disc galaxies. Furthermore, Tacchella et al. (2019) used the Illustris-TNG simulations to demonstrate a similar result: that galaxies do not necessarily change their morphology as they transition through the green valley. Instead, a galaxy’s morphology is largely set while the galaxy is still star forming. Both of these studies align well with the observational work of Cortese et al. (2019), who find using the SAMI Galaxy Survey that the quenching of star formation in satellite galaxies does not necessarily imply that kinematic transformation has occurred. They attribute the discrepancy in spin observed between local satellite and central galaxies to the fact that satellites develop their angular momentum at a slower rate compared to centrals after entering more massive haloes.
![The mean number of galaxy mergers for passive galaxies at z = 0 by stellar mass bin, separated into whether they were central or satellite around the time they left the star-forming population. We show this for definitions D1 [panel (a)] and D2 [panel (b)] as a function of stellar mass, only including mergers with mass ratios below 10. The shaded regions correspond to the 16th–84th percentile of total merger count in each stellar mass bin (not distinguished between satellite and central galaxies). We seldom observe mergers for low stellar mass galaxies; however, at $M_{\star }=10^{10.5} \, \mathrm{M}_{\odot }$ the mean merger count in each bin picks up and increases rapidly with stellar mass.](https://oup.silverchair-cdn.com/oup/backfile/Content_public/Journal/mnras/487/3/10.1093_mnras_stz1410/1/m_stz1410fig8.jpeg?Expires=1750334595&Signature=uFXb1Azj~ORdbAic4idrcjtC~P4tXsguP3ZPkp4f0d-9W7g2C03ZKaZyGW1jHNiEWkXrmv6LdzosKdR8eg-SnUT~2AbjEcw5lDOi9pk33KqO0RDuYBkNXo7eBi8febfktfwO4wUYr7C3~sCHcnr4icwtqXxWEVmaevxCiBl8b7xq4UNOTc~CVm3LM47-0Cpw28iVwKplqqsmqrh4h8GvMpJG1S16zZWAyVVXRkyZa1leYN2XGRMnt-vMnDdCnJUIsAanTV6xLRpukYWkAUy5uE3VG5vEL8pIwZF8ZlEqXA-W~tBOy37XkpRwSUic6K5rzhuk0Wng9DEqR2ifOeR4qg__&Key-Pair-Id=APKAIE5G5CRDK6RD3PGA)
The mean number of galaxy mergers for passive galaxies at z = 0 by stellar mass bin, separated into whether they were central or satellite around the time they left the star-forming population. We show this for definitions D1 [panel (a)] and D2 [panel (b)] as a function of stellar mass, only including mergers with mass ratios below 10. The shaded regions correspond to the 16th–84th percentile of total merger count in each stellar mass bin (not distinguished between satellite and central galaxies). We seldom observe mergers for low stellar mass galaxies; however, at |$M_{\star }=10^{10.5} \, \mathrm{M}_{\odot }$| the mean merger count in each bin picks up and increases rapidly with stellar mass.
For the rest of this paper, we focus on investigating in depth the physical drivers behind the complex τQ–M⋆ relationship we find for central and satellite galaxies.
3.3 External quenching mechanisms and the connection with quenching time-scales
In this section, we explore the effect of environment on the quenching time-scales of both central and satellite passive galaxies. First, we consider the role of the galaxy gas content in star formation quenching, both strongly linked in the ‘bathtub model’ (Davé et al. 2012; Lilly et al. 2013; Schawinski et al. 2014) of galaxy gas inflow and outflow. In this model, any quenching mechanism acts by depleting a galaxy’s ISM gas reservoir in some way. Before considering which specific gas-removal mechanisms may be at work, we first look at how the gas content of galaxies and their host haloes relates to star formation quenching time-scales in eagle. Lagos et al. (2015) and Crain et al. (2017) investigated the numerical convergence of the eagle simulations and corresponding H2 and H i gas results, respectively. Lagos et al. (2015) find that the H2 content of eagle galaxies is unaffected by resolution for galaxies with |${\rm M}_{{\rm H}_{2}}\gt 10^{7.5} \, \mathrm{M}_{\odot }$|, while Crain et al. (2017) find that eagle systematically underestimates the H i column density of galaxies with stellar masses |$\lt 10^{10} \, \mathrm{M}_{\odot }$|. The results we present only depend on the relative gas masses of galaxies meaning this systematic effect is less important for our conclusions.
Fig. 9 shows the quenching time-scale as a function of the gas fraction of galaxies using three different definitions: taking the gas mass within a spherical aperture of 30 kpc (row (i); gas ‘inside’ galaxies); taking the total gas mass of the subhalo (MGas, Total; row (ii)); and taking the gas mass in the subhalo outside the 30 kpc spherical aperture (i.e. subtracting the gas ‘inside’ galaxies from the total, |$M_{\rm Gas, Total}-(M_{\rm Gas,30\, kpc})$|; row(iii)). These are normalized by the stellar mass of the galaxy. One could argue that the demarcation of gas ‘inside’ and ‘outside’ galaxies at 30 kpc is arbitrary; however, when using 50, 70, and 100 kpc apertures as the threshold radii, we find the results to be consistent to those presented below. We show our results for both centrals and satellites that by z = 0 are classified as passive according to Section 2.3 – D1 in column (a), D2 in column (b). We remind the reader that these gas fractions and stellar masses are calculated at the time these galaxies left the star-forming population, so as to connect our results to the physical mechanisms which induced star formation quenching.
![The median quenching time-scale of z = 0 passive galaxies, separated into whether they were centrals (blue) or satellites (red) around the time they left the star-forming population, for the D1 [panel (a)] and D2 [panel (b)] definitions of green valley, as a function of various individual galaxy gas fractions. The gas fractions are normalized by the stellar mass of the galaxy. We define ‘gas mass’ using three different criteria: total gas mass in the subhalo (solid lines), gas within the central 30 kpc (dashed lines), and the outer gas mass (total gas mass subtracting the gas mass within 30 kpc; dash–dot lines). Shaded regions correspond to the 16th–84th percentile range of quenching time-scales fraction in each gas fraction bin, while dotted lines about the medians correspond to the 1σ range on the median quenching time-scale in each bin calculated from the 100 τQ samples, each of which was also jackknifed.](https://oup.silverchair-cdn.com/oup/backfile/Content_public/Journal/mnras/487/3/10.1093_mnras_stz1410/1/m_stz1410fig9.jpeg?Expires=1750334595&Signature=na619czU76MIlxS4I3m0TyAS~XNM2bjhhjKyn38dGAnXbk5zjYrWY4V-WZ6JGqjCvwmooV6DtfSpfRYuS34AiikSqtH~AdG8D-PhejZTbjP-lqJE19r0t6XkzJW4sy0hTZsZjKdQ5Sb9i7GB5GAbdZXtR3BGt4MQu29mPTnLTjkcLg3A0xz~Rajgdq2M6bdIocrS-6~yyyMTMXhlBYFwdgnoDUtDQvIWB69FrA~wgxJwlpChUzJmgyXEKJv1PXAKFRyIUPA5DQOoIDWymwneSEDSuAyCrK2RTmrzXQu-RGK0IiIfEGv-jgHokCpzGQ-I-F3mH1-Veo4KPdk27hjMWg__&Key-Pair-Id=APKAIE5G5CRDK6RD3PGA)
The median quenching time-scale of z = 0 passive galaxies, separated into whether they were centrals (blue) or satellites (red) around the time they left the star-forming population, for the D1 [panel (a)] and D2 [panel (b)] definitions of green valley, as a function of various individual galaxy gas fractions. The gas fractions are normalized by the stellar mass of the galaxy. We define ‘gas mass’ using three different criteria: total gas mass in the subhalo (solid lines), gas within the central 30 kpc (dashed lines), and the outer gas mass (total gas mass subtracting the gas mass within 30 kpc; dash–dot lines). Shaded regions correspond to the 16th–84th percentile range of quenching time-scales fraction in each gas fraction bin, while dotted lines about the medians correspond to the 1σ range on the median quenching time-scale in each bin calculated from the 100 τQ samples, each of which was also jackknifed.
Exclusively considering the gas within a 30 kpc radius of a galaxy (row (i) of Fig. 9) we find that there is a strong positive correlation between quenching time-scales and the 30 kpc gas fraction of central galaxies over the full span of |$M_{\rm Gas, 30\, kpc}/M_{\star }$| values, from 10−1.5 to 100.5 using both D1 and D2 τQ definitions. Central galaxies with |$M_{\rm Gas, 30\, kpc}/M_{\star }\lesssim 0.1$| show quenching time-scales of ≈1 Gyr on average, while the highest 30 kpc gas fractions have quenching time-scales of >4 Gyr on average: very much in the tail of the overall histogram in Fig. 6. This is an indication that the gas ‘inside’ galaxies is more important for up-regulating star formation (or more specifically, elongating the time that it takes to cease) than the gross total gas mass within a SubHalo, which is likely dominated by hot, diffuse halo gas. Lagos et al. (2015) showed that in eagle most of the dense, cool gas is within a 30 kpc aperture, while Mitchell et al. (2018) showed that most of that gas is rotationally supported. Hence, it is safe to assume that the gas within 30 kpc we are analysing here is ISM gas. Comparitively, satellite galaxies show a different trend between τQ and the 30 kpc gas fractions. For D1, τQ increases with gas-fraction similarly to centrals up to |$(M_{\rm Gas, 30\, kpc})/M_{\star }\approx 10^{-0.5}$|; however, above this scale τQ flattens at around 2.5 Gyr. For D2, τQ of satellites increases up to |$(M_{\rm Gas, 30\, kpc})/M_{\star }\approx 10^{-0.5}$|, above which the dependence reverses and quenching time-scales drop. It is possible that the 30 kpc radius encompasses more virialized gas as opposed to ISM gas for satellites when compared to centrals, especially at high-|$M_{\rm Gas, 30\, kpc}$| values. If this hot halo gas has the effect of stripping galaxies rather than feeding star formation, it would offer an explanation to this drop/plateau in quenching time-scales.
For both central and satellite galaxies (and for both definitions of green valley, D1 and D2) we see that the total gas fraction (solid lines) and outer gas fraction (dot–dash lines) are weakly correlated with τQ. This is, again, due to the dual effect of hot halo gas being capable of stripping galaxies of their gas through ram pressure stripping, while cooled ISM gas can concurrently offer a gas reservoir for accretion to galaxies and eventual star formation.
We continue our investigation by probing how the aforementioned gas fractions vary as a function of stellar mass for galaxies in Fig. 10, with the aim of interpreting the peak of quenching time-scales at intermediate masses discussed in Section 3.2. Presented is the gas fraction for those galaxies which were quenched at z = 0 (according to definitions D1 and D2). We note, however, that including the full eagle galaxy population at z = 0 leads to similar results. We find that the total gas fraction and outer gas fraction for centrals to be systematically higher than satellites, indicating that centrals on average have more total and virialized gas assigned to their SubHalo; while for the 30 kpc halo gas fraction, we find that centrals and satellites have fairly similar gas content, with centrals being slightly more gas rich within 30 kpc at higher stellar masses. This is consistent with the observations of Brown et al. (2017), using atomic hydrogen spectral stacking of SDSS galaxies. If we consider the total gas mass fractions and ‘outer’ gas fraction, each stays steady with increasing stellar mass in both D1 and D2 up to |$M_{\star }\approx 10^{10}\, \mathrm{M}_{\odot }$|, where each increase with stellar mass (most steeply for satellites). In the case of the gas ‘inside’ galaxies, we instead find for D1 and D2 that centrals exhibit a noticeable peak in gas content (|$M_{\rm Gas,30\, kpc}/M_{\star }\approx 0.5$|) at intermediate stellar masses, |${\approx } 10^{9.7}\!-\!10^{10.3} \, \mathrm{M}_{\odot }$|, in a stellar mass regime incrementally larger, by up to ≈0.5 dex, than that of the peak of the quenching time-scales at |$M_{\star }=10^{9.7}\, \mathrm{M}_{\odot }$|. Above |$M_{\star }\approx 10^{10.3} \, \mathrm{M}_{\odot }$|, inner gas fractions of centrals start to decrease with increasing stellar mass. For satellites, 30 kpc gas fractions appear to decrease monotonically with stellar mass, starting at approximately the same value as centrals at |$M_{\star }=10^{9}\, \mathrm{M}_{\odot }$|, indicating that their increased stellar mass content does not necessarily bring with it more gas. As we will show in Section 3.4, AGN activity at stellar masses above the group inner gas fraction peak starts to be efficient enough to keep the gas haloes hot and also eject gas from galaxies.
![The median gas fraction (defined as gas mass normalized by stellar mass) of z = 0 passive galaxies as a function of stellar mass, separating them by whether they were centrals (blue) or satellites (red) around the time they left the star-forming population, for the D1 [panel (a)] and D2 [panel (b)] definitions of green valley. We show the same gas fractions as in Fig. 9 as a function of stellar mass. Shaded regions correspond to the 16th–84th percentile range of gas fractions in each stellar mass bin, while dotted lines correspond to the 1σ error on the median gas fractions in each bin from the jackknifed samples.](https://oup.silverchair-cdn.com/oup/backfile/Content_public/Journal/mnras/487/3/10.1093_mnras_stz1410/1/m_stz1410fig10.jpeg?Expires=1750334595&Signature=TL069JxhRVNRiSE8WfEA~QZjaenENyj3iQXvQtctPYjMBaeclhL896LK8a2ocSKNhrluGleXYQyVEnKRGgsoNW4yh08uGCwMxwy3ME51T-C8MOl-j0NQsAd3Kv~ClJjgs7j~dJqm2rF4Trp4aZg-giF4ynZs8DwQtktGuUuzk7rm4QIkwQhBW1csXaNqSW1aoKUb598M1-iV7wTZ29G5kQZQ8584HrRvWnJf2XuoLxhA8bllgApsyHq2lwyPtI9sEKu1XBa1s2cDohC2RO3xG-8UFYcaadq5Jk4~eaGvxS-l4PpvYryt7xSzc9fbLznsQ3~lUVRNCOp6Eczc3RWE6w__&Key-Pair-Id=APKAIE5G5CRDK6RD3PGA)
The median gas fraction (defined as gas mass normalized by stellar mass) of z = 0 passive galaxies as a function of stellar mass, separating them by whether they were centrals (blue) or satellites (red) around the time they left the star-forming population, for the D1 [panel (a)] and D2 [panel (b)] definitions of green valley. We show the same gas fractions as in Fig. 9 as a function of stellar mass. Shaded regions correspond to the 16th–84th percentile range of gas fractions in each stellar mass bin, while dotted lines correspond to the 1σ error on the median gas fractions in each bin from the jackknifed samples.
Now, we investigate how the mass of a galaxy in comparison to its host halo can influence star formation quenching. On average, we would expect relatively small galaxies to be more prone to environmental effects from neighbouring large galaxies in the same host halo (Peng et al. 2012; Davies et al. 2019). This is because low-mass galaxies lack the self-gravity needed to compensate for the pressure of the intrahalo gas medium, and are therefore likely to be stripped of their star-forming gas. Estimates of the quenching time-scales of dwarf satellite galaxies with stellar masses below 109M⋆ indicate longer time-scales as the mass of the satellite increases (Fillingham et al. 2015). Wetzel et al. (2013) find that the quenching time-scales of more massive satellites galaxies (|$M_{\star }\gt 10^{9.5} \, \mathrm{M}_{\odot }$|) tend to decrease with stellar mass due to group pre-processing. To explore the effect of relative galaxy mass on quenching time-scales in eagle, we elect to use the fraction M⋆/MHalo, with M⋆ and MHalo being the stellar mass and group mass of the host halo in which the galaxy resided before leaving the star-forming population, to probe whether satellite galaxies small relative to their halo are quenched over different time-scales compared to more massive satellites. In addition, we extend the investigation to include galaxies that were centrals the time they left the star-forming population.
Fig. 11 clearly shows, for both D1 and D2, that the quenching time-scales of satellite galaxies are positively correlated with the M⋆/MHalo ratio for lower stellar-halo mass ratios below M⋆/MHalo = 10−3. Above this point, quenching time-scales decrease. One should note that there are very few satellite galaxies above this mass ratio, and those that do exist are more likely to behave like centrals (as shown in Section 3.2). For central galaxies, the M⋆/Mhalo ratio spans a much narrower range, as expected from the tight stellar–halo mass relation of central galaxies in eagle (Schaye et al. 2015; Guo et al. 2016). It appears for both D1 and D2 that quenching time-scales increase for central galaxies which are more massive relative to their halo, before decreasing at the highest mass ratio bin for D1, at M⋆/MHalo ≈ 10−2. Short quenching time-scales, ≲1 Gyr dominate the satellite galaxies that are less massive compared to their host halo, while stellar mass-to-halo mass ratios in excess of 10−3.5 tend to be associated with quenching time-scales ≳2 Gyr. We remind the reader that for this investigation we imposed a stellar mass floor of |$10^9 \, \mathrm{M}_{\odot }$|, and as such the range of M⋆/MHalo is likely limited on the lower end.
![The median quenching time-scale of the z = 0 passive galaxies, separating them into whether they were centrals (blue) or satellites (red) around the time they left the star-forming population, for the D1 [panel (a)] and D2 [panel (b)] definitions, as a function of the galaxy-halo mass ratio: M⋆/MHalo. We define this quantity by using the host halo mass and stellar mass of the galaxies at the redshift when the galaxy left the star-forming population. Shaded regions correspond to the 16th–84th percentile of τQ in each stellar-halo mass ratio bin, while dotted lines about the medians correspond to 1σ range of median mass fractions calculated from the jackknifed samples. Galaxies more massive relative to their halo typically exhibit longer quenching time-scales, this trend being especially obvious for satellite galaxies.](https://oup.silverchair-cdn.com/oup/backfile/Content_public/Journal/mnras/487/3/10.1093_mnras_stz1410/1/m_stz1410fig11.jpeg?Expires=1750334595&Signature=ND7glvPuNHQUquVzGYOwoyaDggMaV4NDZ9~~YPd67LdNNswH6heEQYZPxXlwjipQT-vdCeRNwY1eHqdB7fHIcvXhpHeaUpol6DqMfjy-SzVHP1WsOHCu2hjyvoquzu-tUlHayhMMWfT6LsSw2JGEHGjb0hvMg5EoadQhznryEDZLkTCx8fC2FnCxxAHOUhs8bGfpHHhllEWzI5VdEJBmAag3TLpJPOXfehntL36pw1LOxRV-bIr46L5XjFbmsPIbG9KXQ-2UPowMyqB76myB4zYataQns5YeJinD2AqOjSjqIi3qmBUnQLsgSfTymIknPsvU26ZNNvI3XD~Ss50RHw__&Key-Pair-Id=APKAIE5G5CRDK6RD3PGA)
The median quenching time-scale of the z = 0 passive galaxies, separating them into whether they were centrals (blue) or satellites (red) around the time they left the star-forming population, for the D1 [panel (a)] and D2 [panel (b)] definitions, as a function of the galaxy-halo mass ratio: M⋆/MHalo. We define this quantity by using the host halo mass and stellar mass of the galaxies at the redshift when the galaxy left the star-forming population. Shaded regions correspond to the 16th–84th percentile of τQ in each stellar-halo mass ratio bin, while dotted lines about the medians correspond to 1σ range of median mass fractions calculated from the jackknifed samples. Galaxies more massive relative to their halo typically exhibit longer quenching time-scales, this trend being especially obvious for satellite galaxies.
To demonstrate that our conclusions are not influenced by our restricted halo mass sample, we also investigate how the quenching time-scales of central and satellite galaxies vary as a function of stellar-halo mass excess – i.e. the stellar-halo mass ratio relative to the median value of the sample at fixed halo mass. We calculate this excess by computing the median stellar-halo mass ratio for centrals and satellites in bins of halo mass (row (ii) in Fig. 12) and then calculate, for each galaxy and its given host halo, whether it was more massive than average (a separate calculation is performed for centrals and satellites). Our results in row (i) of Fig. 12 show for satellites (which span a large range in stellar-halo mass ratio excess) that their quenching time-scales increase with stellar-halo mass ratio excess to a peak of 3 Gyr up to a ratio excess value of ≈100.5 for both D1 [panel (a)] and D2 [panel (b)], and then decrease with increasing mass ratio excess. In other words, despite a restricted halo mass sample, if a satellite galaxy is less massive relative to its halo than we would expect given its host halo mass, then it is more likely to quench over shorter time-scales. Satellites with a higher stellar-halo mass excess above this turning point correspond to the more massive galaxies which have enough AGN activity as to quench star formation on shorter time-scales, see Section 3.4. In this regime, it appears that they behave similar to central galaxies. In comparison, the quenching time-scales of central galaxies increase with stellar-halo mass ratio excess monotonically over a smaller dynamic range.
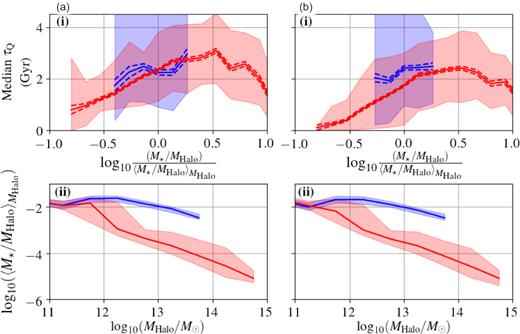
The median quenching time-scale of the z = 0 passive galaxies, separating them into whether they were centrals (blue) or satellites (red) around the time they left the star-forming population, for the D1 (column a) and D2 (column b) definitions, as a function of the galaxy-halo mass ratio excess: |$\frac{M_{{\star }}/M_{\textrm{Halo}}}{\langle M_{{\star }}/M_{\textrm{Halo}}\rangle _{M_{\rm Halo}}}$|. We show the halo mass–stellar-halo mass ratio relation in row (ii). We define this quantity by using the host halo mass and stellar mass of the galaxies at the redshift when the galaxy left the star-forming population. Shaded regions correspond to the 16th–84th percentile of τQ in each stellar-halo mass ratio bin, while dotted lines about the medians correspond to 1σ range of median mass fractions calculated from the jackknifed samples. Galaxies more massive relative to their halo average stellar-halo mass ratio, for a given halo mass, typically exhibit longer quenching time-scales, this trend being especially obvious for satellite galaxies.
To further ensure our conclusions are not driven by our resolution-induced stellar mass cut, we have also checked that the results for satellite galaxies displayed in Figs 11 and 12 are robust when examining only a sub-sample of haloes with a mass |$\ge 10^{13} \, \mathrm{M}_{\odot }$|. In this regime, stellar-to-halo mass ratios ≥10−4 are complete, and we find that the trends discussed for satellite galaxies remain consistent. Based on this evidence, we can conclude that in eagle, smaller satellite galaxies in larger haloes tend to quench more quickly on average than larger galaxies which are more dominant in their halo. Physically, one could argue that this effect is likely due to the stripping of gas in these smaller galaxies from intrahalo gas pressure, acting to quickly reduce SFRs and trigger the colour transformation. These conclusions are consistent against D1 and D2 definitions [panel (a) and panel (b), respectively]. Note that both the increasing gas fraction with stellar mass and the implied larger stellar-to-halo mass ratio with increasing stellar mass for satellites work towards increasing the quenching time-scale with increasing stellar mass in this population. Thus, the trend seen in Fig. 7 at |$M_{\star }\lesssim 10^{10} \, \mathrm{M}_{\odot }$| is well explained by the environmental trends reported here. The stellar mass turning point in satellites occurs directly before the ‘inner’ galaxy gas fraction starts to decrease (Fig. 10).
Despite the small dynamic range in M⋆/MHalo obtained for central galaxies in eagle, we see that there is a tendency for the quenching time-scale to increase with the stellar-to-halo mass ratio, which is more evident for the D2 definition of green valley. This suggests that the scatter of the stellar-halo mass relation is related to how quickly central galaxies quench at fixed halo mass, which in turn correlates with how gas-rich a halo is, and how much SMBH accretion a galaxy has experienced (see discussion in Section 3.4). Future surveys probing the H i content of galaxies and haloes in the local Universe will be able to unveil any systematic effect of the gas fraction of haloes on the halo-stellar mass relation and the frequency of green valley galaxies. Those surveys include those to be carried out by the Australian and South African Square Kilometre Array (Blyth et al. 2015).
Recently, Davies et al. (2019) showed, using the GAMA survey (Driver et al. 2009), that the quenched fraction of satellite galaxies at fixed halo mass increases steeply with the ratio of central-to-satellite stellar mass. They defined quenched galaxies with a method analogous to D2 (using SSFR as the indicator of galaxy transformation). Because the stellar mass of central galaxies is well correlated with the host halo mass, one would expect a similar correlation to exist between the passive fraction and the host halo-to-satellite mass ratio. That result naturally fits with our findings with eagle and our interpretations, where quenching time-scales significantly lengthen for satellites that are massive with respect to their host halo. The latter is expected to have an impact on the overall passive fraction in a way that there are less passive satellites of high stellar-to-host halo mass ratios. The results of Davies et al. (2019) therefore provide observational evidence for our findings here.
3.4 AGN activity and quenching time-scales
AGN are known to be capable of quenching star formation due to both heating and ejection of star-forming gas material (see Fabian 2012 for a review on observational evidence of AGN feedback and Bower et al. 2017 for a detailed analysis of AGN feedback in eagle). The AGN heating effect in eagle depends on how quickly an SMBH can accumulate the necessary energy to heat gas particles to the required temperature (see Section 2.1). Thus, AGN feedback in eagle critically depends on the SMBH accretion rate.
Fig. 13 shows how the net SMBH accretion rate (normalized by galaxy stellar mass) influences the quenching time-scales of central galaxies that at z = 0 are passive, for both definitions D1 and D2. We split the galaxy population into three bins of net accretion rate: one for galaxies showing zero-accretion rate, one for those of low-accretion rate, and one for those of high-accretion rate. We distinguish between the latter two samples with an SMBH accretion rate cutoff at the median of non-zero accretion rate galaxies, |$\frac{{\Delta }(M_{\rm BH}/M_{\star }}{\Delta t})=10^{-3.7}$|. Roughly half of all galaxies would exhibit a non-zero accretion rate, the rest split roughly evenly between the two non-zero accretion rate samples. Zero accretion rates are likely a consequence of the mass resolution of eagle. Physically, we simply consider these galaxies in this category of very low accretion rates. We remind the reader that the net SMBH accretion rate is calculated as the change in SMBH mass the galaxy experienced over four snapshots, around the time the galaxy departed from the star-forming population to the passive population. This change in mass was then divided by its stellar mass and by the lookback time difference between the two relevant snapshots.
![The quenching time-scale distribution for all galaxies in bins of zero SMBH accretion rate (grey) versus low- and high-SMBH accretion rate galaxies (yellow and green, respectively) for both D1 [panel (a)) and D2 (panel (b)]. Shaded regions represent 1σ error margins of frequency in each bin from the 100 τQ samples, each of which have also been jackknifed. We elect to not split the sample for satellites and centrals since we found their behaviour with black hole activity to be identical. For low and high-SMBH accretion rate galaxies (non-zero), the result appear similar. The zero-accretion rate sample and low-accretion rate sample in both D1 and D2 exhibit a more spread τQ distribution, with D1 low-accretion rate galaxies actually exhibiting a peak in quenching time-scale frequency at ≈2 Gyr instead of the lowest bin. The high-accretion rate sample, in contrast, shows a clear peak at the lowest quenching time-scale bin and decreases rapidly at longer quenching time-scales for both D1 and D2. For both definitions, a galaxy with a zero or low-SMBH accretion rate is much more likely to have a quenching time-scale of 3–6 Gyr than a galaxy which does exhibit black hole accretion.](https://oup.silverchair-cdn.com/oup/backfile/Content_public/Journal/mnras/487/3/10.1093_mnras_stz1410/1/m_stz1410fig13.jpeg?Expires=1750334595&Signature=kmfutxYr3spBOIuC~PYw0qKMlIbtHuBmAtsI-vIXI3f7HKduejk-xmUYrv2OGmmuai3cqeu-Sr3ZBrRjOzSB2IzMGp9C60vm935atAYcqU-wI9N4ZNLA6K3l3NpJOEEUJ9F3mLrUcuyPjkDU1lu5YXVN4iMYEGrkWJFIoZBFsfhCglZhuN~C65WrcJFqqnyt6R8qLtbjvhbyXgLs1oOTRJFO6AEy8dECWFWi14TGkW46fK1xi5BbNfLbaWNk~YIuMbb971L1V2VkUTobdg8bhpZf~A9BiP5A8JiPloNCiiIowzp4GrK6hGF1fzsxyrze~wZ4mmYYvw6ZDFN0JHXfxQ__&Key-Pair-Id=APKAIE5G5CRDK6RD3PGA)
The quenching time-scale distribution for all galaxies in bins of zero SMBH accretion rate (grey) versus low- and high-SMBH accretion rate galaxies (yellow and green, respectively) for both D1 [panel (a)) and D2 (panel (b)]. Shaded regions represent 1σ error margins of frequency in each bin from the 100 τQ samples, each of which have also been jackknifed. We elect to not split the sample for satellites and centrals since we found their behaviour with black hole activity to be identical. For low and high-SMBH accretion rate galaxies (non-zero), the result appear similar. The zero-accretion rate sample and low-accretion rate sample in both D1 and D2 exhibit a more spread τQ distribution, with D1 low-accretion rate galaxies actually exhibiting a peak in quenching time-scale frequency at ≈2 Gyr instead of the lowest bin. The high-accretion rate sample, in contrast, shows a clear peak at the lowest quenching time-scale bin and decreases rapidly at longer quenching time-scales for both D1 and D2. For both definitions, a galaxy with a zero or low-SMBH accretion rate is much more likely to have a quenching time-scale of 3–6 Gyr than a galaxy which does exhibit black hole accretion.
For both D1 and D2, we find that the zero- and low-SMBH accretion rate galaxies (grey and green lines, respectively) exhibit a peak in quenching time-scales at τQ ≈ 2 Gyr; while the higher accretion rate galaxies (orange lines) show a much more defined peak at quenching time-scales ≲1 Gyr. This indicates that a higher SMBH accretion rate (and corresponding luminosity) could be acting to shorten quenching time-scales through the efficient heating and ejection of interstellar gas. This is in line with the findings of Trayford et al. (2016) in eagle, which show that central galaxies with overly massive SMBH are more likely to be passive compared to those with less-massive SMBHs. This also aligns well with the observational results of Herrera-Camus et al. (2019), who show that AGN-driven outflows are capable of expelling central molecular gas on characteristic time-scales of ≈0.2 Gyr. According to our results, the galaxies with massive SMBHs would be more likely to quench faster, and consequently become part of the red sequence. We do see, however, a small amount of galaxies with high-SMBH accretion rates which exhibit longer quenching time-scales, up to ≈8 Gyr, indicating that not all galaxies hosting bright AGN will quench rapidly. Rather, it appears that these galaxies with active AGN are less likely than others to quench on time-scales of ≳2–3 Gyr, the time-scale which characterizes the rest of the population.
Recall Fig. 7, where central and satellite galaxies display a peak in quenching time-scales at around |$10^{9.7}\rm \, \, \mathrm{M}_{\odot }$| in eagle. To relate back, we now show how the net SMBH accretion rate depends on stellar mass for central and satellite galaxies in Fig. 14. Zero SMBH accretion rate galaxies were included in this context, and accordingly, below |$M_{\star }=10^{10} \, \mathrm{M}_{\odot }$|, eagle galaxies display a steep drop-off in AGN activity. Our findings agree with the work of Bower et al. (2017), who found that the SMBH accretion rates of galaxies in eagle increase rapidly in haloes of masses above |$10^{12} \, \mathrm{M}_{\odot }$|. In the L100 eagle run on average, satellites in a |$10^{12}\, \mathrm{M}_{\odot }$| halo have a stellar mass of |${\approx } 10^{9.7}\, \mathrm{M}_{\odot }$|, while centrals in a |$10^{12}\, \mathrm{M}_{\odot }$| halo have stellar mass |${\approx } 10^{10.3}\, \mathrm{M}_{\odot }$|. This corresponds to the intermediate stellar mass range where we find the rapid increase in AGN activity. This tells us that AGN activity is only likely to affect quenching time-scales in galaxies which have higher stellar mass, |$M_{\star }\gtrsim 10^{10} \, \mathrm{M}_{\odot }$|. AGN activity picks up rapidly at this stellar mass value, and provides further evidence to the conclusions we make in Section 3.3. Thus, we conclude that the turning point in quenching time-scale dependence with stellar mass is, at least in part, due to AGN activity – which heats the interstellar gas and removes it from the galaxy while keeping the halo gas hot. Some galaxies with significant AGN activity could still be capable of holding on to their cool interstellar gas reservoir (depending on AGN type and accretion rates), illustrated by the tail in the high-accretion rate galaxy sample in Fig. 13, while some show a definite shortening of their quenching time-scale to <1 Gyr.
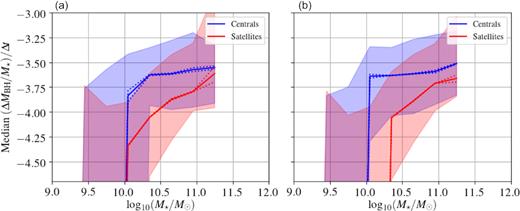
The median SMBH accretion rate in bins of stellar mass for passive galaxies at z = 0, separated into whether they were satellites (red) or centrals (blue) around the time they left the star-forming population. Panel (a) uses D1, while panel (b) uses D2. The shaded regions correspond to the 16th–84th percentile range of SMBH accretion rate in each stellar mass bin, while dotted lines correspond to the 1σ error on calculating the median from a jackknifed sample of the galaxies in each bin. SMBH activity noticeably picks up for both centrals and satellites above |$10^{10} \, \mathrm{M}_{\odot }$|, the stellar mass regime where we expect satellites and centrals to be quenched by a similar mechanism based on Fig. 7.
Interestingly, massive satellite galaxies in eagle that are passive by z = 0 also exhibit an increase in their net SMBH accretion rate at high stellar masses, which indicates that AGN activity is aiding the quenching of massive satellite galaxies. The latter is necessary to make these galaxies passive, since their environment alone is not enough to drive the cessation of star formation in these galaxies. Also note that many central galaxies that quenched due to the effect of AGN feedback end up being satellites by z = 0. This fact was illustrated for D1 and D2 in Fig 5.
3.5 Predictions for the green valley across time
In coming years, highly complete surveys focused on intermediate-redshift galaxies such as DEVILS (Davies et al. 2018c), could offer insight into the properties of transitioning green-valley galaxies as a function of group properties and redshift. We present here in Fig. 15 the proportion of galaxies in eagle that are part of the green valley/ transition region or red sequence/ passive population, based on D1 and D2.
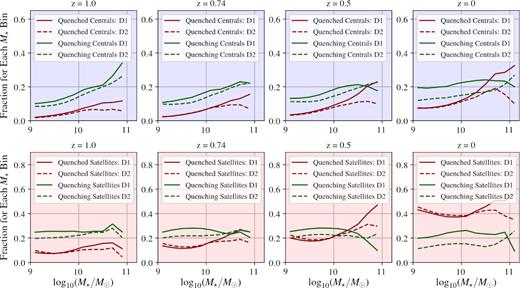
The fraction of galaxies (as a function of stellar mass) that are part of the quenching population or passive population in eagle based on D1 and D2, for redshifts between z = 1 and z = 0. Over time, for all stellar masses, the quenched fraction of the population increases (corresponding to where galaxies leave the quenching population). This first occurs most notably in the higher stellar mass extremity. At z = 1 we see a transition population fraction be highest in the higher stellar mass bins, and over redshift, these galaxies transverse to the quenched population, leaving a lower fraction of transition galaxies at higher stellar mass at z = 0.
As expected, the overall fraction of passive galaxies increases with time (red lines in Fig. 15), but the fraction of green valley galaxies evolves very weakly with time. This is related to the average time-scale for this transitions being rather short. However, some interesting differential behaviour is seen. One of them is that the dependence of the fraction of green valley galaxies with stellar mass for centrals and for definition D1, which at z = 1 is positively correlated, systematically flattens towards z = 0, even displaying an inversion of the relation at stellar masses |${\gtrsim } 10^{10.5} \, \mathrm{M}_{\odot }$| and at z ≲ 0.5. Interestingly, the fraction of central green valley galaxies in the CMD at intermediate redshifts (z ≈ 0.5) peaks at stellar masses of |${\approx } 10^{10.2} \, \mathrm{M}_{\odot }$|, due to the quenching time-scales being longer at this stellar mass. The flattening is also seen for centrals and the D2 definition, but is less significant than that seen for D1.
For satellites, we also see a rapid increase of the fraction of passive galaxies, which is more striking than that seen for centrals. Interestingly, the green valley fraction of satellites in definition D1 is close to constant at 25 per cent at |$M_{\star }\lesssim 10^{10.2} \, \mathrm{M}_{\odot }$|, with the fraction at higher stellar masses decreasing with time. The inflection stellar mass is due to the mass scale above which we see the quenching time-scale quickly decreasing with increasing stellar mass in satellites (see. Fig. 7). Note that this inflection stellar mass also corresponds to when we see a minimum in the fraction of passive satellites, which is clear in both definitions, particularly at intermediate redshifts, z ≈ 0.5–0.75. For definition D2, we see again a rather flat fraction of green valley galaxies that varies from ≈20 per cent at z = 1 to ≈10 per cent at z = 0. We remind the reader that D1 and D2 definitions of τrmQ diverge most noticeably at high stellar masses, where the populations are most difficult to distinguish.
We expect the exact fractions of passive and green-valley galaxies to change depending on our definition D1 and D2. We investigate how much these change due to variations in our parameters outlined in Sections 2.3.1 and 2.3.2 in Appendix A. We include the results in Fig. A1. Although the normalization of these fractions change considerably with different population definitions, we find the shape of the distributions with stellar mass remains consistent. As such, we are confident our conclusions are robust and agnostic to the parameters we use.
4 DISCUSSION AND CONCLUSIONS
In this paper, we have explored the connection between quenching time-scales and several galaxy properties in the eagle simulations, with the aim of connecting to the different physical processes behind the quenching of star formation in galaxies. We do this using two different definitions (D1, and D2) of quenching time-scale. Our study reveals some clear dependencies, which we summarize below.
Regarding the two different definitions of quenching time-scale, we find that D1 leads to systematically longer quenching time-scales than D2, as expected from the time delay between the ceasing of star formation and the reddening of passively evolving stellar populations. However, all of the conclusions below concerning key difference between centrals/satellites and environment/AGN feedback remarkably appear robust against both of these definitions.
Low-mass and high-mass central galaxies exhibit divergent quenching time-scale distributions, where low-mass centrals were most likely to quench with time-scales τQ ≈ 3.5 Gyr in D1, and there being a noticeable knee in the distribution at this τQ value in D2. High-mass centrals have a sharper peak at τQ ≲ 1.
Satellite galaxies have a noticeable knee in their τQ distribution at 1.5–3 Gyr compared to high-mass central galaxies (<1.5 Gyr) in eagle.
We find satellite and central galaxies in eagle (that by z = 0 are passive) have similar dependencies of their quenching time-scales with their stellar mass, except in the lower stellar mass regime. Both populations reveal a quenching time-scale that increases with stellar mass up to |$M_{\star }\lesssim 10^{10} \, \mathrm{M}_{\odot }$|, with the relation reversing at higher stellar masses. This said, at lower stellar mass values, central galaxies have a systematically longer quenching time-scale than satellite galaxies, making the τQ peak less dominant for centrals. The amount of gas in the ISM of galaxies at the time a galaxy leaves either the blue cloud or the SFS is a strong predictor of quenching time-scales, but more so for centrals than for satellites.
For central galaxies, we find at lower stellar masses (|$M_{\star }\lt 10^{9.6}\, \mathrm{M}_{\odot }$|) that quenching time-scales of galaxies are long compared to their satellite counterparts. We attribute the longer quenching time-scales to be characteristic of the secular evolution of the stellar population, induced by stellar feedback. At intermediate stellar mass for centrals (|$10^{9.7}\, \mathrm{M}_{\odot }\lt M_{\star }\lt 10^{10.3}\, \mathrm{M}_{\odot }$|), we find the peak in quenching time-scales to be associated with galaxies which are gas-rich in their innermost (30 kpc) regions, where we see τQ > 3.5 Gyr. This result is expected as the gas can readily be converted into stars. In the higher stellar mass regime |$M_{\star }\gt 10^{10.3}\, \mathrm{M}_{\odot }$|, we observe SMBH accretion rates to increase rapidly along with the cumulative number of galaxy mergers, two likely interrelated factors. Quenching time-scales shorten again in this stellar mass range to τQ < 1.5 Gyr, where AGN-induced quenching appears to dominate.
For satellites in the low-stellar mass regime (|$M_{\star }\lt 10^{9.6} \, \mathrm{M}_{\odot }$|), we find that quenching time-scales are particularly short, <1 Gyr, if their stellar mass is low compared to their host halo mass, while stellar-halo mass ratios in excess of 10−3.5 are linked with lengthened quenching time-scales, up to >2 Gyr. We attribute the shortening of satellite quenching time-scales relative to centrals in this regime to be induced by ram pressure stripping of satellite galaxies, stifling their star formation. More massive satellites begin to behave very similarly to massive central galaxies, and we find their AGN activity and mean major merger count to be significantly higher for |$M_{\star }\gt 10^{10.3} \, \mathrm{M}_{\odot }$| where quenching time-scales shorten again in this stellar mass regime to τQ < 1.5 Gyr.
With the discrete snapshots offered by the eagle data base, it was impossible to resolve sub-Gyr quenching time-scales robustly using the method presented here, and as such, we could not compare the characteristic time-scales of environmental and internal quenching mechanisms below that time cadence. However, we can state that AGN and environmental quenching shift the τQ distribution to sub-Gyr scales, and in gas-rich galaxies without significant AGN activity, longer time-scales of τQ > 4 Gyr are common. These longer time-scales are mostly associated with low-mass central galaxies that quench by the action of stellar feedback alone. Both our work and that of Correa et al. (2019) show that the colour transformation and quenching time-scales can have a complex dependence on galaxy properties.
The predictions we present here will be subject to comparison to future observations. Very high spectral resolution spectroscopy, allowing the construction of accurate star formation histories, will be made possible with the James Webb Space Telescope (JWST – Gardner et al. 2006; see Kalirai 2018 for a recent discussion of the science objectives of JWST). Those histories will be key to confirm the quenching time-scales reported here for the eagle simulations. In addition, highly complete surveys focused on intermediate-redshift galaxies such as DEVILS (Davies et al. 2018c) will also provide valuable insight into the properties of green-valley galaxies as a function of the group properties. Comparisons between gas-rich and gas-poor groups and the corresponding frequency of green valley galaxies would be useful in assessing the validity of our conclusions, which will be possible with the new generation of SKA (Blyth et al. 2015) in coming years.
ACKNOWLEDGEMENTS
We thank Camila Correa for her valuable scientific input and sharing a submitted version of her manuscript. RW is funded by a Postgraduate Research Scholarship from UWA. CL has received funding from a Discovery Early Career Researcher Award (DE150100618) and by the ARC Centre of Excellence for All Sky Astrophysics in 3 Dimensions (ASTRO 3D), through project number CE170100013. We also thanks the Research Collaboration Awards at UWA in its 2018 program, which funded the visit of Dr. James Trayford to ICRAR. We acknowledge the Virgo Consortium for making their simulation data available. The eagle simulations were performed using the DiRAC-2 facility at Durham, managed by the ICC, and the PRACE facility Curie based in France at TGCC, CEA, Bruyeres-le-Chatel.
REFERENCES
APPENDIX A: PREDICTIONS OF THE EVOLUTION OF THE FRACTION OF PASSIVE AND GREEN VALLEY GALAXIES
Here, we test the robustness of the predicted fraction of passive and green valley galaxies and how those evolve in time. We do this by investigating how much these fractions change over stellar mass and redshift due to variations in the parameters outlined in Sections 2.3.1 and 2.3.2. For D1, where we used a double-Gaussian to fit the colour bimodality, we vary the σ multiplier used to define the width of the red sequence to illustrate the effect this would have on quenched/quenching fractions. We changed the multiplier by 50 per cent from 1.5 to 0.75 and 2.25, the resulting fraction ranges shown in the top four panels of Fig. A1, where red and green represent the quenched and quenching fractions, respectively. Although the normalization of these fractions changes slightly as a result of varying σ, we find that the shape of the quenched and quenching fractions over stellar mass remain consistent.
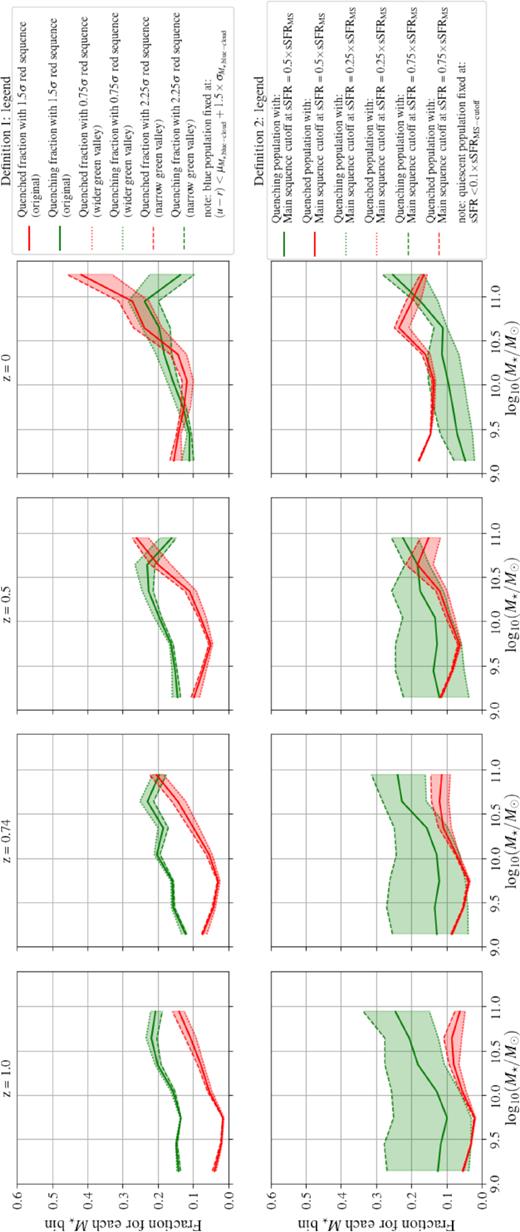
The fraction of galaxies (as a function of stellar mass) that are part of the quenching or passive population in eagle based on D1 (top 4 panels) and D2 (lower 4 panels) with altered versions of the definitions D1 and D2, for redshifts between z = 1 and z = 0. Shaded regions correspond to the range spanned by using different passive and star-forming galaxy definitions. Red lines and regions correspond to quenched fractions, while green lines and regions correspond to quenching/green valley fractions. Although the normalization of these fractions change considerably with changing parameters, we find the shape of the distributions with stellar mass changes little, and hence is robust.
For D2, we defined the star-forming and quiescent populations with appropriate multiplying factors (0.5 and 0.05, respectively) of the star-forming MS, as outlined in Section 2.3.2. We changed these multiplying factors by 50 per cent to 0.75 (and 0.075) and 0.25 (and 0.025) to illustrate the effect this would have on our quenched and quenching fractions over stellar mass and redshift. We again find that the normalization of these fractions can change (especially for the ‘green’ population), however we see that the shape of said fractions remains consistent. Thus, we conclude that the predictions presented in Section 3.5 are robust.
