


ABSTRACT
Dwarf stars with debris discs and planets appear to be excellent laboratories to study the core accretion theory of planets formation. These systems are however, insufficiently studied. In this paper we present the main metallicity and lithium abundance properties of these stars together with stars with only debris discs and stars with only planets. Stars without detected planets or discs are also considered. The analysed sample is formed by main-sequence FGK field single stars. Apart from the basic stellar parameters, we include the use of dusty discs masses. The main results show for the first time that the dust mass of debris disc stars with planets correlate with metallicity. We confirm that these disc dust masses are related to their central stellar masses.
Separately, the masses of stars and those of planets also correlate with metallicity. We conclude that two conditions are necessary to form giant planets: to have a sufficient metallicity and also a sufficient protoplanetary mass of gas and dust. The debris discs masses of stars without giant planets do not correlate with metallicity, because they do not fulfil these two conditions. Concerning lithium, by adopting a stellar model for lithium depletion based on a strong interaction between the star and a protoplanetary disc, we found that in agreement with the model predictions, observations indicate that the main lithium depletion occurs during this initial protoplanetary evolution stage. We show that the ultimately lithium depletion is independent of the presence or absence of planets and appears to be only age dependent.
1 INTRODUCTION
If we consider the Solar system as an example of a debris disc, the planets coexist with different kinds of debris represented by asteroids, comets, minor bodies of the Kuiper Belt and zodiacal dust originated by disintegration of Jupiter family comets in the inner Solar system (Backman & Paresce 1993; Moro-Martín & Malhotra 2002). This example of dust–planets connection has been taken as a representative of what could be eventually found around stars. This has been one of the main leitmotifs of recent research, especially among FGK types of stars (Matthews & Kavelaars 2016). However, debris discs detected around stars are different from the Solar system case and present a large diversity in their properties. Two review papers devoted to stellar debris discs appeared recently, while Hughes, Duchêne & Matthews (2018) discuss mainly their structure, composition, and variability, Wyatt (2018) refers to aspects related to formation of low-mass planets after the protoplanetary stage.
Debris discs are mainly dusty structures that remain after the primordial protoplanetary (hereafter PP) disc has lost a large part of its original gas. A transition disc of short lifetime is established (Wyatt et al. 2015) before a typical dusty debris disc appears. This debris disc is characterized by the presence of an observed second generation of dust grains produced continuously by collisional processes between larger bodies of kilometric sizes (planetesimals). These planetesimals were probably built when a stable and cool PP disc was formed (see the reviews by Testi et al. 2014; Drazkowska & Dullemond 2018). The evolution of PP and debris disc systems are then completely different. Whereas PP discs last from 3 to 10 Myr, the time necessary to be devoid of its main gas component, contrary to this, a debris disc can last practically the stellar lifetime. The PP disc evolution is characterized by constructive processes where planetesimals, dust cores, and gas giant planets are formed. In a debris system (DD), where some constructive processes can exist forming low and very low mass planets, the evolution in a debris disc is mostly characterized by destructive collisional processes (Wyatt 2005; Kenyon & Bromley 2008). The disc opacity, larger in the PP stage, is the main observational discriminator between PP and DD objects (Hughes et al. 2018). Also, recent advances on the detection of gas in DD stars have been reported by these last authors, highlighting that the presence of gas appears specially in AB-type stars and much less in FGK-type stars which are the objects of study of this work.
This paper is devoted to the study of two aspects concerning stars with debris discs; their metallicity and their lithium (Li) evolution. The metallicity properties of DD stars have been only partially tackled, leaving more questions than answers. As far as we know, lithium abundance properties in stars with debris discs have never been studied in detail.
A study with a large important number of only FGK-type DD stars did not find trends with spectral type (Sierchio et al. 2014). As far as the FGK-type stars are concerned, a large survey (Moro-Martín et al. 2015) with 200 single stars with ages larger than 1 Gyr has shown no clear planet–debris disc relations. However, this situation is now superseded by the recent detection of more stars with debris disc and planet (DDP stars) which are now considered in this work. DDP stars contain all kind of planets up to a certain maximum upper limit. Since the year 2012 have appeared some important works related to the possibility that debris discs, due to their dynamical stability during long periods of time, could host low-mass terrestrial planets (Wyatt et al. 2012). The Raymond et al. (2011) simulations found positive correlations between debris discs and terrestrial planets. However, this correlation disappears in the presence of giant planets with eccentric orbits. This indicated positive correlation has been confirmed for low-mass planet by Marshall et al. (2014). As mentioned before, a recent review paper devoted to these aspects of low mass planets formation in debris disc stars, can be found in Wyatt (2018). Maldonado et al. (2012) studied for the first time the most extended collection of these debris discs stars with planets.
As Li properties are concerned, we mean always the 7Li isotope. In this paper we study the mechanism of Li depletion produced by the internal differential stellar rotation as a function of a strong PP disc magnetic interaction with the star during the short lifetime of this disc. Several fundamental stellar parameters apart from the Li abundance (A(Li)) as the stellar mass (M⋆), effective temperatures (Teff), surface stellar rotation, measured here as the projected rotation velocity (|$\mathfrak {v}\sin i$|), ages and metallicity ([Fe/H]) will be taken into account. This ensemble of six parameters is homogeneously derived in our study for a large part of the stellar sample.
This paper is organized as follows: in Section 2 we discuss on our stellar sample, observations, stellar parameters determinations, and comparisons of our data with the literature. Section 3 is devoted to the general metallicity properties of debris discs stars with and without planets. In Section 4 are presented the main lithium depletion properties in debris discs stars. Last, in Section 5 a discussion of the results and conclusions is given.
2 SAMPLE AND OBSERVATIONAL DATA
2.1 The stellar sample
Our sample of solar-like stars, with and without debris discs, is based on the presence or not of infrared (IR) excesses. It was carefully compiled by checking mainly the works of Trilling et al. (2008), Bryden et al. (2006), Hillenbrand et al. (2008), Su et al. (2005), Beichman et al. (2006), Gautier et al. (2008), Hines et al. (2006), Su et al. (2006), Carpenter et al. (2008), Smith et al. (2006), and Matthews, Kalas & Wyatt (2007), which are mainly based in Spitzer data. The stellar sample of stars used in this work (full sample) is formed by a main collection of objects that have been observed and reduced by us (homogeneous sample) using high-resolution echelle spectra (FEROS) to homogeneously determine some of the stellar properties. Also, in order to increase the number of objects in the sample, we have added objects which parameters were taken from the literature, compiling a total list of 140 stars.
Then, using the Extrasolar Planets Encyclopaedia1 (Schneider et al. 2011) we divide the samples considering the presence or not of planets. Finally, we have obtained four different groups of FGK-type stars; (1) a control group formed by 38 stars with apparently no detected debris discs or planets. This group will be called as C in the whole paper, (2) a group of 41 stars containing only debris discs (called DD) and not containing detected planets, (3) a group of 30 stars containing debris disc and planets of any mass, called DDP and finally, (4) a group formed by 31 stars with planets, called CP. All observed and compiled stars in this study belong to spectral types, between F5 and K4 subtypes. In this way, we avoid any hotter object than F4, that belongs to the Li-DIP phenomena (Boesgaard & Tripicco 1986) indicating a different physical Li depletion process from the one considered in this work. Also, our selection of FGK subtypes characterizes better what we can call ‘solar’ low mass stars, where the theory of planet formation is formulated.
In Table 1 we present the whole collection of the stars related to this work with their stellar properties and references of the IR data. The stellar ages and masses were derived using L. Girardi on-line code PARAM 1.3 (http://stev.oapd.inaf.it/cgi-bin/param, see also Da Silva et al. 2006). This tool requires different input parameters, such as: Teff, [Fe/H], V magnitude, and parallax, where the last two parameters were taken from the hipparcos and TYCHO catalogues (1997). For Teff and [Fe/H] we used the values listed in Table 1.
Parameters of the stellar sample.
| Star | Group | Sp. | M⋆ | Age | IR | Teff | [Fe/H] | log g | |$\mathfrak {v}\sin i$| | A(Li) | log(Md) | Ref |
|---|---|---|---|---|---|---|---|---|---|---|---|---|
| HD | type | (M⊙) | (Gyr) | Ref. | (K) | (dex) | (cgs) | (km s−1) | (Mmoon) | |||
| 693 | C | F5V | 1.12 ± 0.03 | 4.7 ± 0.7 | (a) | 6250 | −0.24 ± 0.04 | 4.20 | 6.50 | 2.45 ± 0.11 | – | TW |
| 3795 | C | G3/5V | 1.03 ± 0.02 | 9.3 ± 0.4 | (b) | 5420 | −0.54 ± 0.06 | 3.94 | ≤2 | ≤0.68 | – | TW |
| 3823 | C | G1V | 1.00 ± 0.02 | 7.8 ± 0.8 | (a) | 5980 | −0.23 ± 0.06 | 4.10 | 3.5 | 2.36 ± 0.11 | – | TW |
| 4307 | C | G2V | 1.07 ± 0.02 | 7.1 ± 0.5 | (b) | 5860 | −0.14 ± 0.07 | 4.00 | ≤2 | 2.45 ± 0.11 | – | TW |
| 101501 | C | G8V | 0.93 ± 0.02 | 2.1 ± 1.7 | (a) | 5528 | −0.05 ± 0.06 | 4.53 | – | 0.95 ± 0.02 | – | R12 |
| ... |
Note. Only the first five lines of the C sample and the references are presented here; the full version of the table is available at the CDS. Col. 1: HD star name; Col. 2: Group defined in Section 1: C, CP, DD, and DDP; Col. 3: spectral type; Col. 4 and 5: stellar mass and age, respectively; Col. 6: references of IR data: References: Trilling et al. (2008) (a), Kóspál et al. (2009) (b), Plavchan et al. (2009) (c), Bryden et al. (2006) (d), Bryden et al. (2009) (e), Chen et al. (2014) (f), Maldonado et al. (2012) (g), Beichman et al. (2006) (h), Koerner et al. (2010) (i), Greaves et al. (2004) (j), Hillenbrand et al. (2008) (k), Rhee et al. (2007) (l), Kalas et al. (2006) (m), Carpenter et al. (2008) (n), Eiroa et al. (2013) (o); Col. 7: effective temperature; Col. 8: metallicity; Col. 9: surface gravity; Col. 10: projected rotational velocity; Col. 11: lithium abundance; Col. 12: log of mass of the dusty disc and references, where the number (1) means taken from Chen et al. (2014), and the number (2) means calculated in this work as explained in Section 3; Col. 13: References of stellar parameters and A(li); TW, This work; G10, Ghezzi et al. (2010b); GO10, Gonzalez, Carlson & Tobin (2010); S08, Sousa et al. (2008); L06, Luck & Heiter (2006); R12, Ramírez et al. (2012); M12, Maldonado et al. (2012); S04, Santos et al. (2004); DM14, Delgado Mena et al. (2014); V05, Valenti & Fischer (2005); B91, Boesgaard (1991); C11, Casagrande et al. (2011); E12, Ertel et al. (2012); G16, Gáspár, Rieke & Ballering (2016); S06, Sousa et al. (2006); L17, Luck (2017); A18, Aguilera-Gómez, Ramírez & Chanamé (2018); B15, Bell, Mamajek & Naylor (2015).
Concerning the debris discs studied here, a large part of them are obtained with data of the Spitzer Space Telescope by means of MIPS photometry mainly at 70 |$\mu$|m (Chen et al. 2014). The grains responsible for these radiations are some unities of microns big. Typical values of the ratios of luminosities (LIR/L*) are of the order of 10−6 to 10−4. The sizes of the dust radii involve values from some unities of au up to near 150 au. In this study, we also considered the radiation observed at 850 |$\mu$|m for some stars. In this case, larger grains with sizes of more than 1 mm are responsible for this radiation emitted at even larger distances, of 1–10 times, the Kuiper Belt dust radius.
2.2 Observations and stellar parameters
The high-resolution spectra of the stars analysed in this work (74 stars) were obtained with the FEROS (Fiberfed Extended Range Optical Spectrograph) echelle spectrograph (Kaufer et al. 1999) of the 2.2 m MPIA-ESO telescope at La Silla (Chile). The FEROS spectral resolving power is |$R=48\, 000$|, corresponding to 2.2 pixel of 15 |$\mu$|m, and the wavelength coverage ranges from 3500 to 9200 Å. The nominal signal-to-noise ratio (S/N) was evaluated by measuring the rms-flux fluctuation in selected continuum windows, and the typical values were S/N ∼ 250. The spectra were reduced automatically with the midas pipeline reduction package.
Effective temperature (Teff), surface gravity (log g), microturbulence (ξt), metallicity ([Fe/H]), and Li abundance were derived by means of the standard approach of the local thermodynamic equilibrium using a revised version (2002) of the code moog (Sneden 1973) and a grid of Kurucz (1979) ATLAS9 atmospheres, which include overshooting.
The atmospheric parameters were obtained from the equivalent width of the iron lines (Fe i and Fe ii) by iterating until the correlation coefficients between log ε(Fe i) and lower excitation potential (χl), and between log ε(Fe i) and reduced equivalent width [log (Wλ/λ)] were zero, and the mean abundance given by Fe i and Fe ii lines were similar. The iron lines taken from Lambert et al. (1996) and Santos, Israelian & Mayor (2004) were carefully chosen by verifying that each line was not too strong, and checked for possible blending. The equivalent widths were automatically measured with the ares2 code (Sousa et al. 2007).
We adopted new log gf values for the iron lines. These values were computed from an inverted solar analysis using solar equivalent widths measured from a solar spectrum taken with FEROS and a Kurucz grid model for the Sun (Kurucz 1979 ) having [Teff, log g, ξt, |$\log \varepsilon (\rm Fe)$|] = (5777 K, 4.44 dex, 1.00 kms−1, 7.47 dex). Table 1 of Chavero et al. (2010) contains the line list used.
Final values of the parameters for all stars are presented in Table 1 and the columns are; the HD number, group distinguishing the presence of disc or planet defined in the introduction, V magnitude, spectral type, stellar mass, age in Gyr, reference of the IR excess, effective temperature in K, metallicity [Fe/H],3 stellar surface gravity as log g (g in cgs), the rotational velocity |$\mathfrak {v}\sin i$| in km s−1, the Li abundance A(Li) = log N(Li)/N(H) + 12, where N(Li) and N(H) are the respective numbers of Li and H atoms, log of the mass of the dusty disc which is defined in Section 3, and references of stellar parameters.
Uncertainties in the derived parameters Teff, log g, ξt, |$\log \varepsilon (\rm Fe)$| were estimated as in Gonzalez & Vanture (1998). The internal errors in the adopted effective temperature and microturbulence were determined from the uncertainty in the slope of the Fe i abundance versus excitation potential, and the Fe i abundance versus reduced equivalent width relations, respectively. The uncertainty in log g was inferred by changing this parameter around the adopted solution until the Fe i and Fe ii mean abundances differed by exactly one standard deviation of the mean value of the Fe i abundance. The typical values for the internal errors in this study are ∼70 K in Teff, 0.15 dex in log g, 0.05 km s−1 for ξt, and 0.05–0.07 dex in [Fe/H].
The determination of Li abundances from synthetic spectra requires a line list for the spectral region around the Li i feature at 6707.8 Å. The 2002 version of the code moog (Sneden 1973) was used to compute synthetic spectra in the Li region mentioned. The line list and procedure follow the methodology presented in detail in sections 2 and 3 of Ghezzi et al. (2010b). The formal uncertainties in the derived best-fitting lithium abundances can be calculated by varying A(Li) around its best value and computing, for each lithium abundance tested, the quantity |$\Delta \chi _{\rm r}^{2}$| = |$\chi _{\rm r}^{2}$| - |$\chi _{\rm r,min}^{2}$|. The difference between A(Li) and A(Li)best that gives |$\Delta \chi _{\rm r}^{2}$| = 1 is taken as the 1σ uncertainty.
We estimated rotation velocities, |$\mathfrak {v}\sin i$|, by means of the spectral synthesis technique using determined atmosphere models. A few Fe i lines which fall in the same echelle order as the Li i feature were investigated, we chosen the Fe i at 6703.567 Å, it was identified as a clean line. Synthetic spectra were calculated using a macroturbulent velocity taken from Valenti & Fischer (2005) as first step. Then, a grid of synthetic spectra was computed for combinations of |$\mathfrak {v}\sin i$| until to obtain the best fit. We corroborate that FEROS spectra are not necessarily sensitive to values of |$\mathfrak {v}\sin i$| < 2.5 km s−1 for typical macroturbulent velocities, for this reason, for the most of slow rotating stars, we could only obtain upper limit for this parameter.
From the 140 stars of the whole sample studied in this paper, 74 of them were observed by us, and the stellar parameters, metallicities, and A(Li) were calculated in this work as we describe above; the same parameters of 24 stars were taken from Ghezzi et al. (2010b), which use the same methodology for the lithium abundances determination as we mentioned before. We also considered 12 more stars from Ramírez et al. (2012). For comparison purposes, Fig. 1 shows three panels confronting our values and those obtained by Ramírez et al. (2012) for stars in common: metallicities, stellar mass, and lithium abundances. The correlation coefficients show that there is a very good agreement between the parameters obtained. Taking into account the data taken from Ghezzi et al. (2010b) and Ramírez et al. (2012) and derived in this work we attain the 77 per cent of the sample, for the rest of the stars we used data from literature as is specified in the last column of Table 1.
![Comparison of our derived values of: (a) [Fe/H], (b) stellar mass (in solar mass units), and (c) A(Li), and those extracted from Ramirez et al. (2012). Each panel contains the parameters of the linear fit and the value of the linear correlation coefficient R.](https://oup.silverchair-cdn.com/oup/backfile/Content_public/Journal/mnras/487/3/10.1093_mnras_stz1496/1/m_stz1496fig1.jpeg?Expires=1750285105&Signature=CERUZtvHlpPYwQwCJOhYTmPs6inRhRPSDEJKbksKpmFDWpe6cN7Zed6OIhXq7Y~UPjhfGhqPkoKoCPcpBOfVXKPdniPVrUy~TjQzYzfKxIaHd7RyS2adY~97TyFdu6hEGPiU~KBWnshAf0lf9yGmQhOPvKBy~VNShzuHVoNYQ5srHBWAt~-ugXFKxNZgYQrjkwY5iR99aNMBERBWX7wfaXryjOwjGklkwgep-IJxnrerMDuFNQHbDgyY5ArpGa6jJOP2uQcrOQPhhMgU9Bgb3z6hPo4-LE-UEpzHhaNVVe~Hivbh1aHQKxbYHX3MhEaNcw3nCKdm8aAuZhmcfqlL8g__&Key-Pair-Id=APKAIE5G5CRDK6RD3PGA)
Comparison of our derived values of: (a) [Fe/H], (b) stellar mass (in solar mass units), and (c) A(Li), and those extracted from Ramirez et al. (2012). Each panel contains the parameters of the linear fit and the value of the linear correlation coefficient R.
3 METALLICITY PROPERTIES
In the Core-Accretion model for planetary formation (hereafter CA) it is expected that cores of giant planets will be preferentially formed in a high metallicity medium, where solid elements are abundant.
Stars with only debris discs do not show metal enrichment. As planetesimals are the building blocks of planets, and gas-giant planet hosts show the metal signature, this constitutes an apparent paradox that might be raised as an argument against the CA model (Fletcher & Nayakshin 2016). Furthermore, we can ask why there are plenty of high metal abundant stars hosting debris disc without giant planets?
Greaves, Fischer & Wyatt (2006) consider that the lack of a metallicity correlation of DD stars and also, the known giant planet–metallicity relation are both situations, in agreement with the CA model (see for instance Fischer & Valenti 2005). For Greaves et al. (2006) the effect of higher solid metal abundances, for a given PP disc mass, will speed giant planet formation in a gas rich PP disc, before the gas vanishes in less than around 10 Myr. For these authors, the non-metal behaviour of DD stars, will arise due to a different metallic dependence, in which planetary cores without gas could be formed at later epochs than the short lived PP disc phase. Wyatt, Clarke & Greaves (2007) studied the origin of the metallicity dependence on the PP disc of a star with planets. However, any prediction appears to be made only for A-type stars.
During those years, the discussions on metallicity were made by considering mainly two different stellar cases; those of stars with gaseous giant planets mainly (CP) and those of DD stars, i.e. without giant planets. One important ingredient for a complete discussion on this subject consists to introduce the case of DD stars containing giant gaseous planets (DDP). Few authors as Maldonado et al. (2012, 2015) have considered this case. In this paper we investigate more deeply these aspects on metallicity and also on lithium by means of a tool consisting in using the masses of the dusty debris discs (hereafter Md) in stars with and without planets. For this purpose, we have collected the largest number of DDP stars known in the literature and found around 30 main-sequence objects. This number fixed in a certain way, the numbers of the other three selected groups: 41 DD stars, 31 CP stars and 38 C stars. A relatively similar number of objects will be then considered for each group for better comparison purposes. Moreover, we have not considered very close binary stars and nor any star in the sub-giant evolutionary stage to avoid introducing a bias in our analysis. This is because previous studies indicate that there are differences in both disc frequency and planet frequency between single and binary stars (Rodriguez & Zuckerman 2012), and also a different behaviour in respect with metallicity for planet-hosting giant stars. Regarding the metallicity distribution of evolved stars with planets there are many works showing puzzling results: Pasquini et al. (2007); Sadakane et al. (2005); Schuler et al. (2005); Hekker & Meléndez (2007); Takeda, Sato & Murata (2008); Ghezzi et al. (2010c); Maldonado, Villaver & Eiroa (2013); Mortier et al. (2013); Jofré et al. (2015); Reffert et al. (2015); Maldonado & Villaver (2016).
In this analysis, the values of the disc masses Md were mainly obtained from Chen et al. (2014). This catalogue present two types of discs for a given star. A small and warm disc, and a large and cold disc. For coherence purposes, we select in this work always the largest discs corresponding to the largest Md values for each object. In the case of the Chen et al. (2014) catalogue the value is that of Md2 (second dust mass in the 2T model). For DD or DDP stars not contained in this mentioned catalogue, we estimate the corresponding Md values by using equation number eleven of Chen et al. (2014) work. The use of this equation requires, apart the observed fractional infrared luminosity (LIR/L*) ratios, the appropriate discs radii which have been obtained from the Spanish Virtual Observatory (SVO) catalogue (http://svo2.cab.inta-csic.es/vocats/debris2/). These calculations require specific values of the grains radii for the spectral type of the star in consideration. These values are taken from the table 3 of Chen et al. (2014). As chosen in that work, the mass density is equal to 3.3 g cm−3. These estimated Md values (in lunar mass units) are indicated with the number (2) in Table 1. The main assumptions of the models of debris discs in Chen et al. (2014) are that an important part of the dusty discs can be better described by two, warm and cool, dust components with two temperature blackbody models. Also, no collisional models have been applied by these authors to determine the disc masses. In our case, we warn that we have chosen, for homogeneity comparative purposes, the largest cool discs for all our stars with discs. This means that our selection is independent if real discs have multiple components or not (see also Kennedy & Wyatt 2014).
3.1 Metallicity of debris discs without giant planets (DD)
As pointed out before, we called the DD group to the stars with dusty discs without containing observed planets of any mass. Fig. 2 shows the main result of the behaviour of the masses of the debris disc, Md, in function of metallicities of the DD host stars. The absence of correlation is evident by the low statistical correlation values showed in the figure (Pearson coefficient R2 = 0.02). The linear regressions are performed by applying a bootstrap technique using Monte Carlo (MC) method. First, we generate 1000 bootstrapped samples from the original sample. Each bootstrap is a random draw with replacement from the original sample with a draw size equal to the original sample size. Secondly, we calculate the linear regression of each bootstrapped sample. The goodness of the fittings are shown with the shaded areas (68 per cent confidence bands). The shaded blue area is formed for the 1000 linear regression fits calculated by the boostrap method, in which it is easy to see the slopes taking positive, null, and negative values. Additionally, we applied the Spearman rank correlation test, widely used in astronomy to discern whether a set of two variables are correlated or not (see e.g. Damasso et al. 2015; Koljonen et al. 2015; Patruno et al. 2016, among others). Spearman’s rank correlation coefficient is denoted by the symbol ρ, where ρ = 0 corresponds to no correlation between the variables, while ρ = +1 or ρ = −1 corresponds to a perfect increasing or decreasing monotonic correlation. We implemented the code described in Curran (2014), obtaining ρ = −0.14. Both tests, using Pearson or Spearman coefficient, show null or very low correlation, respectively, between stellar metallicity and the mass of the debris disc for the DD sample. This result is not a surprise and agrees with past investigations on DD on the metallicity, or any other characteristics (e.g. Beichman et al. 2005; Chavero et al. 2006; Greaves et al. 2006; Moro-Martín et al. 2007; Bryden et al. 2009; Kóspál et al. 2009).
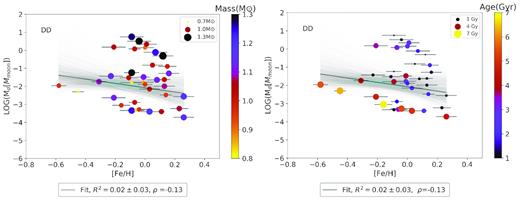
Stellar metallicity as function of the mass of the dusty disc, segregating with stellar mass (left-hand panel) and age (right-hand panel) for the DD stars. The solid black line shows the best linear regression (y = ax + b), calculated using bootstrapping method weighted by the errors of metallicity, the parameter values are shown in the box below the figure. The shaded blue area shows the 68 per cent confidence band of the bootstrapping fit. Note that the slope attains positive and negative values, which is reflected also in the values of R2 = 0.02 and ρ = −0.13, which mean not correlation.
As far as we know, the only investigation using Md values to search for a correlation of DD with [Fe/H] is that of Gáspár et al. (2016). However, they propose to have found a correlation with metallicity, only for the ‘de-aged’ Md values calculated by them from the actual age Md values. These ‘de-aged’ values corresponds to an age of 1 Myr, this is near the initial age of the PP disc. Nevertheless, as seen in their fig. 7 the claimed correlation seems to appear for sub-solar metallicities only. Gaspar et al. used in the search for correlations the totality of DD stars of their catalogue. This totality contains a mixture of upper limit flux values, binaries or multiple objects and also stars in different evolution stage and spectral types. Also, they do not make any distinction between DD and DDP objects.
In addition, Gáspár et al. (2016) show an important absence of highly metal depleted DD objects. However, this deficit of metal poor DD especially in the interval (i.e. −0.50 < [Fe/H] < −0.20) were already discussed in Montesinos et al. (2016) and references therein. This deficit is in a strong contrast with the relative large number of DD objects in the enhanced metal region. In any case, we confirm these mentioned deficit results, by means of the asymmetrical distribution of our DD objects shown in Fig. 2. In principle, this absence of DD stars in very low metal regimes, can be explained by an evolution age effect. In fact, the mean age founded of DD stars is 2.5 Gyr, being the youngest group among the four groups studied. In general, these young DD stars are represented by the large population of metal enriched DD stars. On the contrary, among the most depleted DD stars we found the oldest DD objects. That is the case, for instance, of HD 110897 with [Fe/H] = −0.59 and an age of 5.52 Gyr and HD 158633 with [Fe/H] = −0.45 with an age of 6.3 Gyr, we can then say that there are few DD survivor stars in very low metal regimes, because similar objects as those mentioned, had already remove their dusty debris content.
We can conclude that the amount of dust in DD stars does not depend of the stellar metallicity. It must be remembered that in general, the disc masses presented in this analysis do not represent the real masses of the discs. This is because in all cases, any large km-sized bodies as planetesimals, are not directly observable. We can only measure the masses of the dust (MIR) and of the planets. The real total mass of the disc may be higher.
3.2 Metallicity of debris discs with planets
Stars containing dusty DDP are surely one of the best laboratories to test the CA planetary formation theory (Pollack et al. 1996). However, differently than the other groups considered in this work; DD, CP, and C which are more numerous, the total number of DDP stars known today is around 33 (data taken from SVO catalogue, http://svo2.cab.inta-csic.es/vocats/debris2/). This number has only increased slightly since the 22 DDP objects proposed by Kóspál et al. (2009). We must note that the increasing in the number of stars with discs and planets with respect to the Kóspál et al. (2009) work is mainly due to the discovery of low-mass planets around debris disc stars. In fact, using the exoplanet catalogue (Schneider et al. 2011) we learn that before the year 2010, the mean planetary mass detected for DDP stars was 1.76 Mjup. After, in the period of years 2010–2018, this detected mean planetary mass attained a mean value of 0.03 Mjup.
Eliminating all close binary stars (Raghavan et al. 2006) our final list of main-sequence DDP objects contains 30 stars. From this number only 10 have their discs spatially resolved. The majority of the selected DDP stars contain close-in planets with debris discs at large radial separation. Some details on the planets–disc interaction have been discussed by Hughes et al. (2018) and Wyatt (2018). A recent important direct imaging survey of Spitzer sources, searching for the presence of more massive gaseous planets (>5 Mjup) in debris discs stars, produced no new discoveries (Meshkat et al. 2017).
3.2.1 The stellar case: metallicity versus stellar mass
The metallicity of DDP stars has been studied by Maldonado et al. (2012, 2015) considering the same definition of the four groups as in this work. Even if the number of objects of groups DD, CP, and C are nearly four times larger than ours, their number of DDP stars is similar to our analysis. These authors found by means of K–S statistical distributions, similar metallicity properties for DDP and CP groups. These two being however, different of those of DD and C groups. They claim that the mentioned similarity of DDP and CP groups is due to the presence of planets only and not due to the debris. Differently from Maldonado et al. (2012, 2015), we use approximately the same number of members for the four groups to investigate the metallicity dependence using a different approach based mainly on the use of stellar and dust discs masses. Fig. 3 shows the distribution of stellar masses in function of metallicity for the four groups considered in this work.
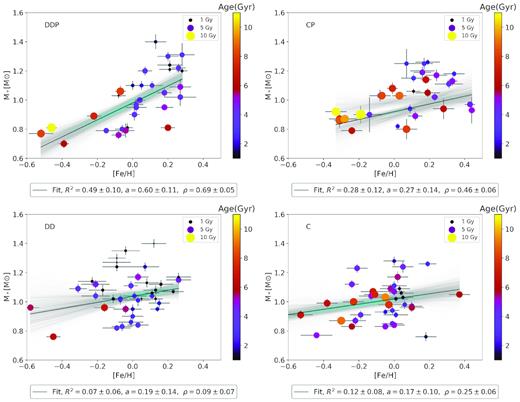
Stellar mass as function of star metallicities for the four samples, segregating with age in the colour scale bar for the four groups. Each panel shows the best linear fit in solid line (y = ax + b) and the values of the parameters, calculated using bootstrapping method weighted by the errors of metallicity. The shaded area shows the 68 per cent confidence interval on the mean from bootstrapping (1σ). The upper panels show a clear increase of the stellar mass with the host star metallicity, being that DDP stars present the steepest slope with the best coefficient of determination R-squared and ρ. In the case of stars without planets, (bottom panels) the slope decreases. Particularly, in the case of DD stars, the very low R-squared coefficient reveals no relation at all.
As in Section 3.1, we have performed a search for correlations, this time between the stellar mass and the metallicity for the four groups, using the classical Pearson and the Spearman correlation tests presented before, but in this case taking into account the errors in both parameters.
DDP and CP stars present the larger rate of increase of the stellar mass with metallicity, being remarkable that DDP stars present a slope value twice of the CP stars. Also, these two groups present good correlate fit values, being R2 = 0.28 ± 0.12 (ρ = 0.46 ± 0.06) for CP stars and R2 = 0.49 ± 0.10 (ρ = 0.69 ± 0.05) for DDP stars. The C group of stars show a poor correlation, whereas DD stars show an absence of correlation, characteristic of their disorder state as discussed before concerning their dusty disc masses. We obtain then an important conclusion for DD stars; both their stellar masses and discs appear to be constructed in complete disorder in respect to metallicity.
We can conclude that it is the presence of planets that determine the increasing orderly steps in function of metallicity. We note, however, that similar positive increases of the stellar mass (not for DD stars) with metallicity have been presented by Gonzalez (2006) (see also Ghezzi et al. 2010a). The common interpretation of this behaviour is due to the Galactic stellar age–metallicity relation, where young stars are more metal rich and at the same time, more massive stars have shorter main-sequence lifetimes.
In respect to the presence of giant planets, Fig. 3 reveals a tendency of higher stellar masses of DDP and CP stars with decreasing age. It is important to note that even the mean stellar masses of the four stellar groups, are practically, all them similar to 1.0 |$\, \mathrm{M}_{\odot }$|, their distributions on a histogram in function of stellar masses are different. Whereas for groups without giant planets as C and DD, their histogram distributions are peaked at ∼1.0 |$\, \mathrm{M}_{\odot }$|, contrary, the groups with planets CP and DDP have a flat distribution between 0.7 and 1.3 |$\, \mathrm{M}_{\odot }$|. These differences of distributions are interesting and reveal, when transformed into metallicities, the different gradients of the groups contained in Fig. 3. These distributions also explain why stars, in their quest to have larger metallicities to form giant planets more efficiently, need masses around 1.2–1.3 |$\, \mathrm{M}_{\odot }$| in CP and specially in DDP stars. As mentioned before, this is due to the fact that higher masses stars are younger and are more metallic. These different behaviours of stars with planets and without planets do not necessarily introduce a bias. On the contrary, it helps to understand more the planetary formation.
Concerning the comparison of the metallicity distributions between groups C and CP, we find that CP stars are more metallic by an approximately factor of 0.15 dex. This already known result in the literature can be found, for instance, in Ghezzi et al. (2010a) where a similar metallicity shift between CP and C stars has been found. This known result represent one of the first pieces of evidence of the stellar-planetary relation (Gonzalez 1997; Santos et al. 2004; Fischer & Valenti 2005). In respect to our present results for DD and DDP objects we must note that the stepper slope for DDP stars respect to CP appears to be a new result.
3.2.2 The debris disc dust case: metallicity versus Md
Now, remains the question of what is the behaviour of the dust component of DDP stars in function of the host star metallicity. For this purpose, we use the masses Md of the respective dust discs in function of the central stellar metallicity. To our knowledge, this approach have never been made before for the DDP systems. Before presenting the Md behaviour as a function of metallicity, we present a result which we found connecting the DDP dust masses with the stellar masses. This is shown in Fig. 4. This kind of Md–M* relation is quite known in very young stars, in general with ages less than 10 Myr (Andrews et al. 2013; Pascucci et al. 2016).
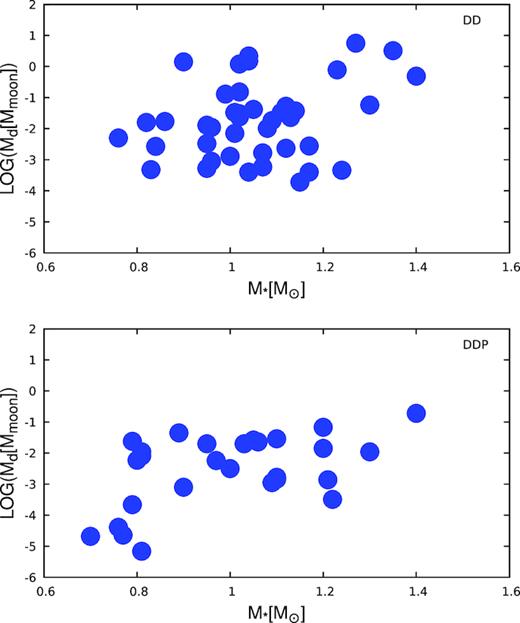
(a) Top panel: log Md versus M* for the DD group, (b) Bottom panel: log Md versus M* for the DDP group. See the text for an interpretation of these distributions.
The relation of Md for DDP stars with metallicity are the ones presented in Fig. 5, indicating for the first time, a clear tendency for a correlation of these dusty discs with metallicity. In this case, we also apply the bootstrap (MC) and Spearman methods presented before. The DDP sample shows a much better positive correlation (R2 = 0.31, ρ = 0.38) than the DD one. Also, the slopes of the linear regression are always positives.
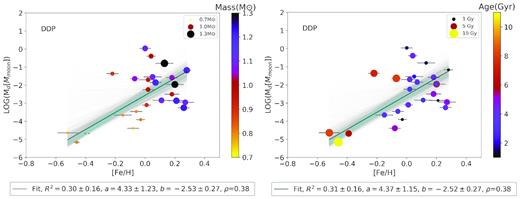
Stellar metallicity as function of the mass of the dusty disc, segregating with stellar mass (left-hand panel) and age (right-hand panel) for DDP stars. The solid black line shows the linear regression (y = ax + b), the parameter values are shown in the box below the figure. The shaded area shows the 68 per cent confidence band of the bootstrapping fit (1σ). Note that the slope attains always positive values (even with 3σ) and with a good of R2 = 0.31 and ρ = 0.38, showing a very good correlation.
This result was possible, not only by the use of debris disc masses (Md) but also by the use of the largest possible list of clean DDP objects, for which we have used objects containing no limit fluxes of IR radiation and as mention before, not including close binary stars and retaining only FGK main sequence stars. Thus, only in DDP stars there is a systematic increase of Md in function of the stellar metallicity. This increase represents several orders of magnitude from the very low metal regime at [Fe/H] = −0.52 to the maximum observable at high metallicity at [Fe/H] = +0.3. In Section 3.1, we presented for DD stars Fig. 2 which is the corresponding one of Fig. 5 for DDP stars. Differently than DDP stars, in the DD group we found no correlation with metallicity.
3.2.3 The planetary case: metallicity versus planetary mass
In the two precedent subsections we saw that both, the stellar masses and disc dust masses correlate. Also, independently, we saw that both masses increase with metallicity. Now, we present a third mass increasing with metallicity. This one concerns the total mass of the planets. One of the first indication of the existence of a gradient of planetary masses and the metallicity of their central stars was claimed by Sousa et al. (2008). The first evidence being that Jupiter mass planets appear to be found around metal rich stars. In contrast, Neptune-mass planets have been found to have a relatively flat metallicity distribution (Udry et al. 2006). Ghezzi et al. (2010a) revised and confirmed these results for typical FGK-type stars avoiding the problematic M-type stars which were included in Sousa et al. (2008) work.
Now, we consider the total mass of the known detected planets around a given star. All planets considered around DDP and CP stars are presented in Tables 2 and 3, respectively. In order to avoid the inclusion of brown dwarfs we limit the planet masses (Mplanet) to a maximum of 13 ± 0.8 Mjup (Spiegel, Burrows & Milsom 2011). The more massive planet of our sample corresponds to HD 33564 b with 9.1 Mjup (CP sample). We present in Fig. 6 the distribution of the total planetary masses for each star in function of the metallicity of the respective stars. Rigorously this is not a direct relation of the total masses of the planets with [Fe/H], but only with the solid cores masses inside the planets. This is because a large part of the planetary masses is due to their H and He gas component and does not depend on metallicity. This relation could then better be called a ‘cores of planets–metallicity relation’ (see Fig. 6).
![Log of the total planetary mass per system (in Jupiter mass unit) versus the metallicity of the star. Panel (a) DDP sample; panel (b) CP sample. The corresponding Spearman correlation coefficients are ρ = 0.36 for CP stars (moderate correlation) and ρ = 0.18 (less than moderate correlation) for DDP stars. Even if the most massive planets indicate an approximate general positive relation between Mplanet and [Fe/H], the normal presence of minor planets indicates that these relations cannot be completely linear. Also, the fact that the correlation coefficient is smaller for DDP stars than the one for CP stars, is compatible with the scenario that the presence of stable dust discs are favourable to the formation of low-mass planets.](https://oup.silverchair-cdn.com/oup/backfile/Content_public/Journal/mnras/487/3/10.1093_mnras_stz1496/1/m_stz1496fig6.jpeg?Expires=1750285105&Signature=1aN1OksKFoCMBKyNogaGufzjYFRl8D3coh8xdvnH7CyMV-~c1kIAyJhVk5eWZ83xc1R2M9HMsD2CdZYXH0gdhzIOR-125XJbXWmJd8SOZ1v6gk7LUoMk1mFMsn5bUxGmQowMhwKhVfNYNHuSf34-4ZVNpOSsjGivbR~58mUhxmYN-rh4x8oKORd35jQ~erwUlbbFn6zGZ4JPyKymTgbczr0lDOPrS1wF5JoonBXY-KayfKSTrt0lFjyFa-g5nCwKa6jTw0zWRrwA~xi7oZxDmboGH8uO-LCuZbHKVVvUlA0IB1JGOMRetyr9EtCfPuJDgqfQozbzPFqnv7EY9Y6rRA__&Key-Pair-Id=APKAIE5G5CRDK6RD3PGA)
Log of the total planetary mass per system (in Jupiter mass unit) versus the metallicity of the star. Panel (a) DDP sample; panel (b) CP sample. The corresponding Spearman correlation coefficients are ρ = 0.36 for CP stars (moderate correlation) and ρ = 0.18 (less than moderate correlation) for DDP stars. Even if the most massive planets indicate an approximate general positive relation between Mplanet and [Fe/H], the normal presence of minor planets indicates that these relations cannot be completely linear. Also, the fact that the correlation coefficient is smaller for DDP stars than the one for CP stars, is compatible with the scenario that the presence of stable dust discs are favourable to the formation of low-mass planets.
Planetary parameters of the DDP sample.
| Planet | No. | Mplanet | |$a$| | [Fe/H] |
|---|---|---|---|---|
| name | planets | (Mjup) | (au) | (dex) |
| HD 1461 c | 2 | 0.017 | 0.1117 | 0.18 |
| HD 1461 b | 0.02 | 0.0634 | ||
| HD 10647 b | 1 | 0.93 | 2.03 | −0.05 |
| HD 10700 f | 2 | 0.012 | 1.3340 | −0.52 |
| HD 10700 e | 0.012 | 0.5380 | ||
| HD 20794 b | 3 | 0.088 | 0.13 | −0.41 |
| HD 20794 d | 0.01 | 0.36 | ||
| HD 20794 e | 0.015 | 0.51 | ||
| HD 22049 b | 1 | 3.09 | 3.39 | −0.15 |
| HD 38858 b | 1 | 0.096 | 1.04 | −0.22 |
| HD 39091 b | 1 | 1.03 | 3.28 | 0.11 |
| HD 40307 c | 6 | 0.020 | 0.08 | −0.36 |
| HD 40307 d | 0.027 | 0.13 | ||
| HD 40307 f | 0.011 | 0.25 | ||
| HD 40307 b | 0.012 | 0.05 | ||
| HD 40307 e | 0.011 | 0.19 | ||
| HD 40307 g | 0.022 | 0.60 | ||
| HD 40979 b | 1 | 4.01 | 0.85 | 0.21 |
| HD 45184 b | 1 | 0.04 | 0.06 | 0.04 |
| HD 50499 b | 1 | 1.71 | 3.86 | 0.22 |
| HD 50554 b | 1 | 5.16 | 2.41 | 0.05 |
| HD 52265 c | 2 | 0.35 | 0.32 | 0.21 |
| HD 52265 b | 1.05 | 0.50 | ||
| HD 69830 d | 3 | 0.253 | 0.63 | 0.02 |
| HD 69830 c | 0.165 | 0.19 | ||
| HD 69830 b | 0.143 | 0.08 | ||
| HD 73526 b | 1 | 2.25 | 0.65 | 0.27 |
| HD 108874 c | 2 | 1.018 | 2.68 | |
| HD 108874 b | 1.36 | 1.05 | ||
| HD 113337 b | 1 | 2.83 | 0.92 | 0.2 |
| HD 115617 b | 3 | 0.016 | 0.05 | 0.13 |
| HD 115617 c | 0.057 | 0.22 | ||
| HD 115617 d | 0.072 | 0.48 | ||
| HD 117176 b | 1 | 6.6 | 0.48 | 0.02 |
| HD 128311 c | 2 | 4.19 | 1.76 | −0.06 |
| HD 128311 b | 2.18 | 1.10 | ||
| HD 130322 b | 1 | 1.05 | 0.09 | 0.01 |
| HD150706 b | 1 | 2.71 | 6.70 | 0.01 |
| HD178911B b | 1 | 6.292 | 0.32 | −0.01 |
| HD187085 b | 1 | 0.75 | 2.05 | 0.27 |
| HD192263 b | 1 | 0.733 | 0.15 | 0.21 |
| HD210277 b | 1 | 1.23 | 1.10 | −0.06 |
| HD215152 e | 4 | 0.010 | 0.15 | 0.18 |
| HD215152 b | 0.006 | 0.06 | ||
| HD215152 d | 0.008 | 0.0879 | ||
| HD215152 c | 0.004 | 0.07 | ||
| HD216435 b | 1 | 1.26 | 2.56 | −0.08 |
| HD222582 b | 1 | 7.75 | 1.35 | 0.2 |
| HD224693 b | 1 | 0.71 | 0.23 | 0.28 |
Note. Source: http://exoplanet.eu/catalog/
Planetary parameters of the CP sample.
| Planet | No. | Mplanet | |$a$| | [Fe/H] |
|---|---|---|---|---|
| name | planets | (Mjup) | (au) | (dex) |
| 1237 b | 1 | 3.37 | 0.49 | 0.09 |
| 3651 b | 2 | 0.231 | 0.29 | 0.12 |
| 3651 c | 0.18 | 0.04 | ||
| 4308 b | 1 | 0.040 | 0.11 | −0.34 |
| 10697 b | 1 | 6.83 | 2.16 | 0.18 |
| 13445 b | 1 | 4.01 | 0.11 | −0.24 |
| 17051 b | 1 | 2.26 | 0.92 | 0.12 |
| 23079 b | 1 | 2.45 | 1.59 | −0.08 |
| 28185 b | 1 | 5.7 | 1.03 | 0.23 |
| 33564 b | 1 | 9.1 | 1.1 | 0.12 |
| 72659 b | 1 | 3.15 | 4.74 | −0.11 |
| 75732 f | 5 | 0.147 | 0.77 | 0.33 |
| 75732 e | 0.025 | 0.01 | ||
| 75732 d | 3.86 | 5.44 | ||
| 75732 c | 0.178 | 0.23 | ||
| 75732 b | 0.84 | 0.11 | ||
| 95128 d | 3 | 1.64 | 11.6 | 0.06 |
| 95128 c | 0.54 | 3.6 | ||
| 95128 b | 2.53 | 2.1 | ||
| 102365 b | 1 | 0.05 | 0.46 | −0.35 |
| 114729 b | 1 | 0.84 | 2.08 | −0.33 |
| 115383 b | 1 | 4.00 | 43.5 | 0.24 |
| 134987 b | 2 | 1.59 | 0.81 | 0.31 |
| 134987 c | 0.82 | 5.8 | ||
| 136352 b | 3 | 0.016 | 0.09 | −0.28 |
| 136352 c | 0.035 | 0.16 | ||
| 136352 d | 0.03 | 0.41 | ||
| 145675 b | 1 | 4.64 | 2.77 | 0.43 |
| 147513 b | 1 | 1.21 | 1.32 | 0.11 |
| 154088 b | 1 | 0.019 | 0.13 | 0.28 |
| 154345 b | 1 | 1.3 | 4.3 | −0.1 |
| 160691 b | 4 | 1.676 | 1.5 | 0.33 |
| 160691 c | 0.03 | 0.09 | ||
| 160691 d | 0.52 | 0.92 | ||
| 160691 e | 1.814 | 5.23 | ||
| 189567 b | 1 | 0.031 | 0.10 | 0.24 |
| 189733 b | 1 | 1.142 | 0.03 | −0.02 |
| 192310 c | 2 | 0.076 | 1.18 | −0.03 |
| 192310 b | 0.053 | 0.32 | ||
| 195019 b | 1 | 3.7 | 0.13 | −0.01 |
| 196050 b | 1 | 2.83 | 2.47 | 0.34 |
| 196885 b | 1 | 2.98 | 2.6 | 0.15 |
| 213240 b | 1 | 4.5 | 2.03 | 0.16 |
| 216437 b | 1 | 1.82 | 2.32 | 0.24 |
| 217014 b | 1 | 0.47 | 0.052 | 0.15 |
Note. Source: http://exoplanet.eu/catalog/
As pointed out before, two main different properties are related to the debris disc masses (Md). On one hand, they increase with the metallicity of the central star and independently, on the other hand, they increase with the mass of the central star. All these properties leave us to make the following considerations: because at least, giant gas planets observed in DDP stars, were formed during the protoplanetary stage, we can propose that two main conditions are necessary to form these giant gaseous planets: (1) a sufficient larger metallicity and (2) a sufficient larger total (gas and dust) mass of the PP disc. Nevertheless, we note that a critical minimum mass must exist in order to form giant planets. If the PP disc mass is always less than this critical mass, no giant planets can be formed and this could be the case of DD stars.
Also, we can consider that both mentioned conditions can be somewhat complementary. For example, in the case of the presence of a giant planet in a metal deficient star, we can infer that the total mass of its protoplanetary disc was exceptionally large in order to create a giant planet in a low metallicity regime (see also Alibert, Mordasini & Benz 2011; Mordasini et al. 2012; Ghezzi, Montet & Johnson 2018).
This reasoning can also be made in the opposite direction. Differently to the disorder (i.e. lack of correlation) appearing in DD stars with respect to metallicity, in the DDP case, an order has been created. Then, each point in the ascending tendency of Fig. 5, represents not only a given larger metallicity, but also a given larger total mass of its dusty disc. Also, by changing the 3D parameter representing the mass in Fig. 5(a) to age in Fig. 5(b), it is noticeable that the most massive systems (stars, dust, and planets) are the younger ones.
It is known that dust disc masses diminish with age. This property can clearly be seen in the right-hand panel of Fig. 5 where we can observe that the most massive dusty discs are the younger ones and the least massive are the oldest ones. This is due to the fact that as age increases, the cold dust (chosen by us) mean temperature in the two belt system decreases. Collecting this property with the similar stellar mass behaviours (Fig. 3) and those of planetary masses (Fig. 6), we can conclude that the three components of a complete planetary system; star, dusty debris disc, and planets, increase all together with metallicity and at the same time the largest massive complete systems are the younger ones. Recently, Ghezzi et al. (2018) also confirmed a similar relation using subgiants stars (‘retired A stars’).
3.3 Comparisons with debris discs containing larger grains
As mentioned above, the Md values used in this work were obtained from mid-infrared (MIR) measurements, and represent discs of dust with radii of some tenths of au from the central star and resulting from the emission of grains of diameters smaller than a millimetre. To detect larger grains of sizes of mm or more, observations must be made in the submillimetre spectral range. In this way, more extended and cooler regions of the discs can then be attained. Recent results of the SONS survey of debris discs in general (Holland et al. 2017) by means of measurements of fluxes made mainly at 850 |$\mu$|m, enable to obtain disc sizes ranges equivalent to 1–10 times the Kuiper Belt radius of our Solar system. Also, small and large grains could have different evolution. That is, their decline in time due to the removal of grains from the discs can be different. The SONS survey (Holland et al. 2017) observed 49 sources from spectral types from B to M and measured their dust disc masses.
Now, we explore the behaviour of the mass of the DD and DDP stars measured at 850 |$\mu$|m and we compare them with those measured at the MIR as presented in this work in the preceding subsections. For this, we selected the FGK stars observed in the SONS survey. There are only 13 objects in common with our work. Then, for the comparison we use the metallicities values presented in Table 1. From these 13 objects, five stars are DDP and eight are DD stars. All the results and comparisons are presented in the two panels of Fig. 7, where the top panel shows the comparison of Md values at the submm of Holland et al. (2017) with the Md values at the MIR collected in this work and contained in Table 1. Red triangles are DDP stars and blue circles represent DD stars. A relative shifted regular correlation is obtained where systematically Md submm-values are larger in general than Md MIR-values. We consider that this could be expected if extended areas are involved in the submm discs. In the bottom panel we present the Md submm-values from Holland et al. (2017) versus the metallicity. Even with few points it is quite notorious that we found for measurements at 850 |$\mu$|m a similar result as those measured at the MIR presented before. We obtain an approximate similar increasing correlated relation for the DDP objects with metallicity and a similar uncorrelated distribution for DD objects. For longer wavelengths as 1.3 mm, even more extended haloes were recently detected around very young DD stars: HD 32297 and HD 61005. These detections indicate that mm sized grains are present in these haloes (MacGregor et al. 2018).
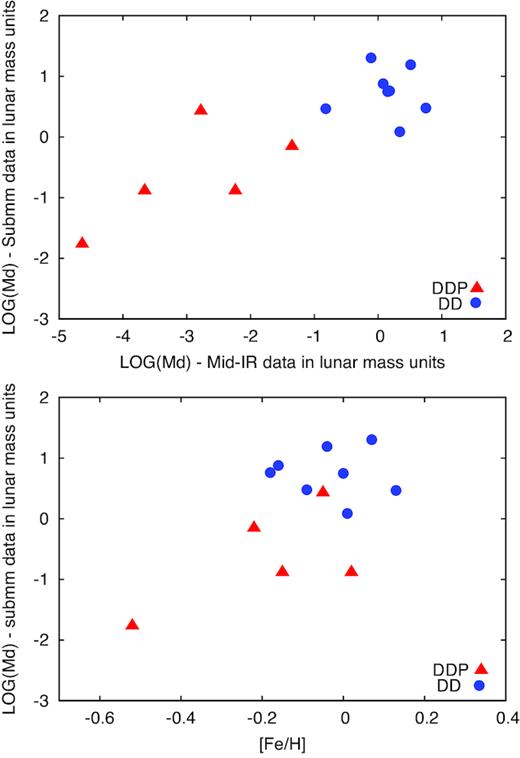
Top panel: comparison of Md values at the submm taken from Holland et al. (2017) with the Md values at the MIR collected in this work (see Table 1). The DDP common stars are: HD10647 HD22049, HD38858, HD115617, and HD10700. The DD common stars are: HD377 HD61005, HD104860, HD107146, HD170773, HD181327, HD191089, and HD207129. Bottom panel: Md submm-values from Holland et al. (2017) versus the stellar metallicity.
4 LITHIUM PROPERTIES IN DEBRIS DISC SYSTEMS
4.1 The lithium depletion
The element lithium is depleted in the stellar atmospheres because the original Li, with which the star was formed, is transported by convection to the base of the convection zone where this element is destroyed. After, the same convection produce an atmospheric Li dilution, by transporting to the surface, internal material poor in Li. Then both mechanisms contribute to the surface Li depletion (Bouvier 2008). The Li depletion mechanism investigated in this work, is based on a strong magnetic disc–star rotation coupling. This coupling induces also strong internal mixing shears (Eggenberger et al. 2012, hereafter E12). The PP disc produces a braking or locking phase that depends only on the lifetime of the disc. By reducing the external stellar rotation, the efficiency of mixing increases in the transition region between the convective and radiative zones. This mixing becomes the main cause for the Li depletion (see Bouvier, 2008 for an initial work on this subject). The E12 model applies for solar-type stars corresponding to the stars selected in this work. One important parameter in the E12 model is what is called ‘the end of the disc locking’, which practically determine the disappearance of the effect of the PP disc. How long does a PP disc live? In general the literature agrees in values up to 10 Myr (Williams & Cieza 2011) however, larger lifetimes could be possible for some stars with stellar masses less than 2 |$\, \mathrm{M}_{\odot }$| (Wyatt 2008; Ribas, Bouy & Merín 2015). In general, measured lifetimes of PP discs depend on the near-IR or far-IR wavelengths considered and on the distances of the radial distribution of the disc mass with respect to the central star.
There is however, a point concerning the end of the magnetic braking mechanism by the disc and for which there is not yet a solution. The PP disc lifetime is constrained by the duration of the gas in the disc (which is not known precisely), given by the minimum gas in the disc necessary to support a magnetic field capable to brake the stellar rotation. Estimation of the duration of the gas component of a PP disc must then be based on other arguments such as: gas accretion onto the star, giant planetary formation, stellar chromospheric evaporating winds. Stellar winds can also be capable to break the star via angular momentum due to the remotion of momentum (Matt et al. 2010, 2012; Romanova & Owocki 2016).
Winds may originate either in a thin region close to the disc or in the outermost parts of the magnetosphere surrounding the star. In any case, models indicate that the power of the wind is given by the accretion. In other words, if there is accretion there will be wind. In this situation, the braking would be more controlled by the wind than by the disc itself. Nevertheless, the accretion exists if there is gas to be accreted. There is then always, a dependence on the existence of gas for the action of both; the direct magnetic or the wind braking, mechanisms. Because one of the purposes of this section consists of exploring the rotation-disc connection of the E12 model, we use here the calculations for the minimum lifetime PP disc of 3 Myr and that of 9 Myr as the maximum considered by this model. We note that these lifetimes, specially that of 3 Myr, are in agreement with the disc lifetimes of young stars with intermediate masses (Hernández et al. 2005; Fairlamb et al. 2015). After any maximum PP disc lifetime, this disc pass by a transition phase (Wyatt et al. 2015) to then became a dusty debris disc containing few or practically no gas at least for FGK stars (Hughes et al. 2018; Wyatt 2018).
4.2 The lithium distributions
4.2.1 Distribution with mass
The studied stars have in general stellar masses mainly between 0.7 and 1.3 |$\, \mathrm{M}_{\odot }$|. Stars with M⋆ > 1.0 |$\, \mathrm{M}_{\odot }$| have different levels of a mild or intermediate Li depletion. This is also the case for some stars of the different groups with M⋆ < 1.0 |$\, \mathrm{M}_{\odot }$|, with the exception of DDP stars. Nevertheless, strong Li depleted stars are only found among stars with masses less than one solar mass in agreement with their larger stellar convection layers. As stellar temperatures mimic well the stellar masses, the Li distributions with temperatures are similar to those with stellar masses.
4.2.2 Distribution with rotation
The stars belonging to the four groups are in general slow rotators with |$\mathfrak {v}\sin i$| < 5 km s−1. Some few relative younger stars have faster rotation velocities only in the C and DD groups. As expected, these fast rotating stars have not been braked sufficiently and their Li abundances have been maintained relatively high as is the case of stars HD 693, HD 133295, HD 181321, and HD 35296.
All panels of Fig. 8 show that there is a concentration of the observed Li abundances around the predicted terminal depleted Li values of model E12 of A(Li) ∼2.2. These concentrations are better represented in the panels of Fig. 9. Model E12 predicts that after the action of the longest disc lifetime of 9 Myr (see fig. 8 in E12) the terminal Li depleted abundances are equal to A(Li) = 2.3. As can be seen in the panels a, c, and d of Fig. 9 there are three clear concentrations of the depleted values of A(Li) at the value of ∼2.2 for the group CP and at ∼2.4 for DD and C groups. Those two values are equidistant to the value corresponding to the mentioned action of disc with a lifetime of 9 Myr. These three final concentrations agree with the E12 model. On the contrary, the behaviour of the Li depletion is different for the DDP group. Fig. 9(b) shows that there is no final accumulation peak of depleted values of A(Li), but an oppositely behaviour showing the absence of a final accumulation peak.
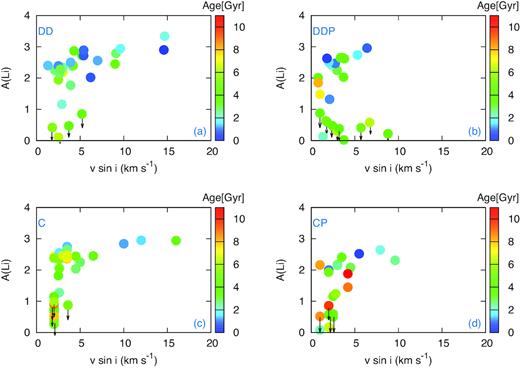
Lithium abundances versus |$\mathfrak {v}\sin i$|, for the four groups, the colour bar indicates the age parameter in Gyr. Note that the most of the values of A(Li) < 1 correspond to upper limit values (see Table 1). In addition, for slow rotating stars, it is only possible to obtain upper limit values for this parameter, this is |$\mathfrak {v}\sin i$| near to 2.5 –3.0 km s−1 for FEROS spectrograph.
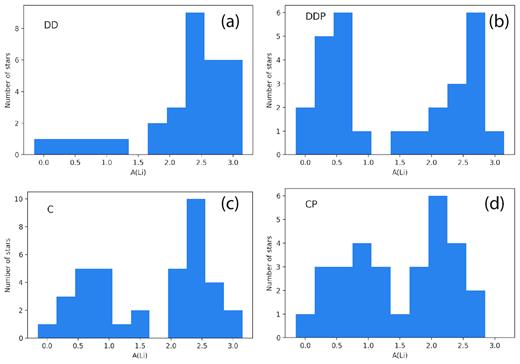
Distribution of lithium abundance for the four groups. These histograms follow the history of the Li depletion in the four groups of stars considered in this work. One part of the stars of each group remained with the Li abundances resulting from the Li depletion during the PP phase up to terminal values of A(Li) ∼2.2. Other stars continued with a very slowly Li depletion during the main-sequence, up to terminal values of A(Li) < 1.0. For all panels a, c, and d representing DD, C, and CP groups, respectively, there exist a maximum PP depletion peak between A(Li) = 2.2 and 2.4 which correspond to the action of a PP disc with a lifetime of 9 Myr satisfying the prediction of model E12. The depletion behaviour for the DDP group is different and have not an easy interpretation with the E12 model (see text).
In any case, by considering all the measured A(Li) values larger than 2.0, we are confirming the E12 model predictions which are valid for stars with masses near the solar mass. However, it is more difficult to explain the values of A(Li) < 2.0 for later ages.
It is expected that a slow Li depleting mechanism would be acting during the whole MS stage, due to an internal mixture mechanism maybe depending to a certain degree, to that generated during the PP disc phase. In this case, the difficulties depend not only on the stellar internal response to the short spin up rotation surface process between ∼10 and ∼40 Myr (Bouvier 2008), but also to the long spin down surface phase provoked by magnetized winds (Johnstone et al. 2015). To our knowledge, there is not yet a quantitative theory that predicts this long-term evolution, which also depends on the transport mechanism in the radiative zone. Maybe an appropriate theory, not existing yet, could explain the observed distribution of the very low Li depleted values shown at the left side of each panel of Fig. 9.
In any case, we observe that the majority of highly depleted Li stars have masses less or equal to one solar mass (see Table 1) with larger convective zones and with ages between 3 and ≃10 Gyr. Even with a large dispersion, the Li abundances decrease with increasing age. This known property in the literature can be seen in all panels of Fig. 8.
4.3 Lithium in debris discs stars with and without planets
In Section 3 we have explored the ensemble of metallicity properties of DD and DDP stars. We can ask now what is the behaviour of the stellar Li abundance in these same objects? In Fig. 10 is presented the distributions of the dusty disc masses Md in function of the Li abundance for DD and DDP stars considering also colour scales for metallicity and age.
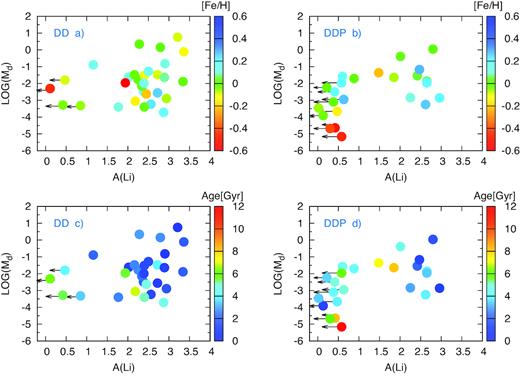
Lithium abundances vs LOG Md for DD and DDP groups, in panels (a) and (b), the colour bar indicates the stellar metallicity, whereas in panel (c) and (d) the colour bar indicates the stellar ages in Gyr. The values corresponding to A(L) < 1.0 are upper limit values. Error bars of the rest of the sample are the size of the symbols except in one point as is in detail in column 11 of Table 1.
In both panels (a) and (c) of Fig. 10 representing DD stars, we can see that a very large dispersion of Md values is present with any correlation with the Li values. However, a relative coherence appears in panel c in respect to ages. In reality, this shows the fact that a large part of DD stars are younger than the other groups (see Section 3.1). Whatever, when metallicity is considered as in panel (a), we can see a complete disorderly distribution. On the contrary, DDP stars distributions of Md versus Li abundances (panels (b) and (d)) appear, in the both cases of metallicity and age, as presenting a certain order. It is specially notorious the large quantity of highly Li depleted objects (A(Li) < 1.0) and the relative orderly distributions of intermediate Li depleted stars (A(Li) > 1.0). In reality, all these Md–Li distributions are a direct reflection of the distributions of Md values in function of the stellar mass as seen in both panels of Fig. 4. In fact, all these distributions of Figs 4 and 10 are similar, showing that the Li abundances follow directly the stellar masses (and indirectly the size of the convective stellar zone) as must be the case. In conclusion, very different distributions of Md values in function of the Li abundances of DDP stars and of DD stars exist. They appear to be the consequence respectively of the fulfil or not of the two conditions to form gaseous planets as discussed in Section 3.2.3.
4.4 Is the presence of giant planets an indication of larger lithium depletion?
The question, if the presence of extrasolar giant planets might produce a larger Li depletion relative to stars with apparently no detected planets, have resulted, since the year 2004 in a quite large number of works presenting opposite results. Those advocating for larger Li depletion in stars with giant planets are: Israelian et al. (2004); Takeda & Kawanomoto (2005); Chen & Zhao (2006); Israelian et al. (2009); Takeda et al. (2010); Sousa et al. (2010); Gonzalez et al. (2010); Gonzalez (2014); Delgado Mena et al. (2014); Figueira et al. (2014). On the contrary, those who found no connection between the presence of planets and the Li abundance, are: Ryan (2000); Luck & Heiter (2006); Baumann et al. (2010); Ghezzi et al. (2010b); Ramírez et al. (2012); Bensby & Lind (2018). If we exam panels a and b, or d and c of Fig. 10 representing the mass of dusty discs versus the stellar Li abundances of DD and DDP stars, we can see that the distribution of the strongly Li depleted (A(Li) < 1.0) stars are very different.
A much larger number of strongly Li deficient objects are present among the DDP stars, than in DD stars. In a first impression this could mean that the presence of planets would produce a stronger Li depletion on DDP stars in respect to DD stars. However, this can only be an age effect and not an effect due to the presence of planets. In fact, the mean age of the stronger Li depleted DDP is 4.6 Gyr and this age is almost the same mean age of 4.1 Gyr of the same strongly Li depleted DD stars. In summary, even if the intermediate Li abundances (A(Li) > 1.0) DD stars, with a mean age of 2.4 Gyr are younger than the corresponding DDP stars, with a mean of 3.2 Gyr, both groups of stars need to attain the same age near 4.6 Gyr to be completely Li depleted by a normal slow main-sequence depletion mechanism. Then, the presence of planets appears not to be the main cause of Li depletion.
The above-mentioned discussions in the literature refers however, to a comparison between CP and C stars. In the absence of Md values for these stars, we can nevertheless, compare directly the mean ages for these stars for which they attain A(Li) values less than 1.0. These mean ages are respectively for CP and C stars equal to 6.1 and 5.8 Gyr. Both ages being relatively similar, we can conclude that also here, an age effect could be the determinant effect to deplete largely the Li abundance and not the presence of planets.
5 RESULTS AND CONCLUSIONS
One of the main purposes of this work consists to deepen the understanding of the metallicity properties of dusty debris discs stars, with and without planets. Moreover, we also studied, for the first time the lithium distributions and properties of these stars. For this study, we have selected four different groups of field solar FGK type stars, avoiding any close binary stars and considering only main-sequence stars. The selected groups of stars have the following properties: the first, containing only debris discs with no detected planets. The second, contains DD and planets (DDP). The third, containing only detected giant planets (CP) and the fourth, stars without detected discs or planets (C). A large part of the objects have been observed and coherently measured by us.
One important tool employed in this study consists to use the dust masses of the discs (Md). We assume that the metallicity of the dusty discs is the same as that of their central stars. Concerning the DD stars, it was already known by several authors, using indicators other than Md, that stellar metallicity and the presence of debris discs does not correlate. Recently, Gáspár et al. (2016) using Md values calculated by them, explored the correlation between dust masses debris discs with the metallicities of their central stars for a very large number of objects .
Nevertheless, their use of a mixed list of objects containing upper limits IR luminosities, binaries and no distinction of those objects having planets or not, impeded to obtain a clear result. In this work, using a clean list of DD stars, we confirm the completely independence of Md values in respect to the metallicity.
In fact, we also confirm that the stellar masses of the DD sample, are also uncorrelated with the metallicity. We then conclude that the whole masses (stellar and disc) of DD stars are uncorrelated to metallicity. On the contrary the masses of stars containing giant planets, as DDP and CP objects, are correlated with metallicity. We present a new result by showing that DDP objects are those presenting the stronger correlation with [Fe/H]. We also found that stars containing giant planets as DDP and CP stars have a different distribution of their stellar masses compared to stars do not showing giant planets. Whereas DDP and CP stars have a flat distribution of stellar masses between ∼0.7 and 1.3 M⊙, DD and C stars present a peak at very approximately one solar mass. This result indicates why in general, stars need to have higher masses, then higher metallicities, to form giant planets.
One aspect discussed in this work concerning DD stars, is their asymmetrical distribution in respect to metallicity. We confirm an important deficit of metallic deficient DD stars. This deficit was already noted by Maldonado et al. (2012), Montesinos et al. (2016) and Gáspár et al. (2016). On the contrary, the population on the metal-rich side of the distribution is quite full. We propose a scenario that could explain this distribution of DD objects. These DD stars, which have a mean age of 2.5 Gyr are very much younger than C stars with a mean age of 4.8 Gyr. We can then suggest that DD stars could be transformed into C stars when they lose their dusty discs. In fact, the very few metal deficient DD stars detected are very old and considered to be the last survivors.
Concerning DDP stars, we found that their dust discs masses are directly related to the corresponding stellar masses. This relation is similar to the same relation found in very young stars systems with ages less or equal to ∼10 Myr. Independently of this, we also found that the three components of the DDP systems; stars, dusty discs, and cores of planets, have each their masses directly dependent on metallicity. That is a relative continuous increase of their masses with an also continuous increase of the metallicity scale. The new result obtained, in which the disc masses of DDP stars appear to be correlated to metallicity is one of the most important results of this work.
The increase of the planetary masses with the metallicity shown in this work was already known in the literature. Collecting all these properties among the DDP stars, we can infer that for each increasing value of the metallicity, the complete stellar system (star, dust, and planets) have successively larger total masses.
Also, we note that these successively larger massive systems, are also successively younger. To understand these properties, we consider that two natural conditions are necessary to be fulfilled for a system to form giant gaseous planets; one, to dispose of a sufficient metallicity and other, to dispose of a sufficient total (gas and dust) massive PP disc. DD stars do not form giant gas planets because, even if they can dispose of a sufficient metallicity, they do not fulfil the second condition of having a PP disc total mass, larger than a critical minimum mass to form a giant gaseous planet.
One aspect that has not been explained in this work concerning the dusty discs masses, is why the Md values of DD stars are somewhat larger in general than those of DDP stars (see Figures 4 and 10). This difference is even present in Fig. 7 representing the submillimetric measurements of extended discs with larger sized particles. We don’t know if we have a possible answer for this, but it appears that it is not related to the size of the involved grains. In fact, in Section 3.3 it is found that DDP and DD stars present the same properties and behaviours, of order and disorder, respectively in the submm regime, as is the case for the smaller grains in the MIR.
We can however, explore others ways to eventually find a different intrinsic nature between DD and DDP stars, in order to try to explain their dusty disc mass differences. We can consider for instance, that the PP discs of DD stars could have an original minor gas-to-dust ratios than those corresponding to DDP stars. In this scenario, dust aggregative collisions will be dominant (Testi et al. 2014, and references therein) and could maybe form an excess of planetesimals. This excess could then produce, by collisions, more dust in the subsequent debris disc stage forming this way, the more massive dusty discs found for DD stars. However, this scenario must contain a mechanism that somehow avoid the formation of large planetary cores in order to explain the absence of giant gaseous planets in DD stars. An alternative scenario could be that eccentric giant planets are efficient in cleaning the disc (see e.g. Raymond et al. 2011; Maldonado et al. 2012).
Similarly, as the proposed evolution in which DD stars turn to be C stars at the end of their evolution during the MS, when their dusty discs have largely vanished (at least part of C stars can have this origin), we can also suggest that DDP stars are transformed into CP stars by the same process of losing their dusty discs. In fact, the determined mean ages for these objects are appropriate for this kind of evolution. The respective mean ages for DD and C stars are 2.5 and 4.8 Gyr whereas those of DDP and CP stars are respectively 4.1 and 5.4 Gyr. We must note however, that the larger age of stars with planets could be somewhat biased towards older stars. This because the first exoplanet surveys tried to avoid very active young stars.
Concerning the Li depletion, we adopted the stellar model (Eggenberger et al. 2012) based on a strong magnetic coupling between the star and the PP disc. We found that the observed Li abundances for C, DD, and CP stars are in agreement with the depletion predicted by the model with a 9 Myr lifetime. The Li depletions for the expected more massive PP discs of DDP stars behaves differently and we do not find a clear interpretation for them using this model.
The study of the distribution of the Li abundances in DDP and DD stars is very instructive. Both distributions are very different. On DDP stars the intermediate Li depleted stars with A(Li) > 1.0 are relatively orderly distributed. Their Li abundances correlate with an increased metallicity and a decreased age.
A direct comparison of the distributions of the dusty debris discs masses Md of DD and DDP stars, in function of the Li abundances and the same in function of the stellar masses, show that they are similar. This indicates that the Li abundances follows well the stellar masses.
Finally, to try to answer the long debated question if the presence of giant planets produces an increase of the Li depletion we found that apparently the age, and not the presence of giant planets, is the main cause of the Li depletion in both cases; DDP stars in respect to DD stars and also in CP stars in respect to C stars.
SUPPORTING INFORMATION
Table 1. Parameters of the stellar sample.
Please note: Oxford University Press is not responsible for the content or functionality of any supporting materials supplied by the authors. Any queries (other than missing material) should be directed to the corresponding author for the article.
ACKNOWLEDGEMENTS
CC and CG acknowledge support from SECYT/UNC and CONICET, LG would like to thank the financial support from the Coordenação de Aperfeiçoamento de Pessoal de Nivel Superior (CAPES), and FLA thanks the support from the Faculty of the European Space Astronomy Centre (ESAC). RR thanks Dr. P. Eggenberger for dialogues on the initial preparation of this work and to Syna Snoek for inspiring conversations. This research has made use of NASA's Astrophysics Data System. We thank the anonymous referees whose comments and suggestions have improved this manuscript. This study is based on observations made with the 2.2 m telescope at the European Southern Observatory (La Silla, Chile), under the agreement ESO-Observatorio Nacional/MCTIC.
Footnotes
Where [Fe/H] = log ϵ(Fe)⋆ − log ϵ(Fe)⊙.
