


Abstract
We have compiled the most complete compact and ultracompact H ii region catalogue to date via multiwavelength inspection of survey data. We utilize data from the recently available SASSy 850 |$\mu$|m survey to identify massive star-forming clumps in the outer Galaxy (RGC > 8.5 kpc) and cross-match with infrared and radio data of known UC H ii regions from the RMS database. For the inner Galaxy sample (RGC < 8.5 kpc), we adopt the compact H ii regions from previous works that used similar methods to cross-match ATLASGAL with either CORNISH or RMS, depending on the location within the Galactic plane. We present a new UC H ii region catalogue that more than doubles the original sample size of previous work, totalling 536 embedded H ii regions and 445 host clumps. We examine the distance independent values of NLy/M and Lbol/M as proxies for massive star formation efficiency and overall star formation efficiency, respectively. We find a significant trend showing that Lbol/M decreases with increasing RGC, suggesting that the overall star formation per unit mass is less in the outer Galaxy.
1 INTRODUCTION
The total observed flux and luminosity of any galaxy is dominated by the massive stars (|$M_{*}\gt 8\, \rm {M_{\odot }}$| and |$L_{*}\gt 10^3\, \rm {L_{\odot }}$|; Martins 1996). These stars have a significant impact on their local environments due to strong outflows, stellar winds, optical/UV-radiation, and eventual supernova explosions, affecting the surrounding supply of molecular gas and potentially triggering or quenching any nearby star formation (see review by Krumholz et al. 2014 and references therein). Galactic evolutionary models that ignore feedback will form stars too early. For this reason, accurate observations of the properties of these massive stars and how they interact with their local environment are needed. The stellar formation process demonstrates the relationship between environment and massive pre-stellar object. The conditions of the local interstellar medium will affect star formation, particularly with regards to metallicity and the gas-to-dust ratio. These factors must be taken into account when deriving and tracing any trends in massive star formation within a host galaxy.
The Milky Way is an ideal landscape for studying the earliest stages of massive star formation. It allows for uniquely high-resolution observations of individual star-forming regions across the Galactic plane which are often difficult to fully resolve in other nearby galaxies and almost impossible for those with higher redshift, even with the capabilities of modern telescopes such as ALMA (Longmore et al. 2014). The high-resolution data from various Galactic based surveys can provide a template for use in calibrating evolutionary models (e.g. Bolatto et al. 2008; Kruijssen & Longmore 2013). For example, Longmore et al. (2015) showed that the high-pressure environments of stars in massive stellar clusters such as those found in the central molecular zone are analogous to those of stars forming in galaxies with redshift of z = 1−3. The key parameters (e.g. gas pressure, surface density, and velocity dispersion) were found to have similar values in both settings. Local conditions will determine the local star formation rates (SFRs) and efficiencies (SFEs) which can later be applied to extragalactic models to better match observations.
The difficulty lies in accurately tracing the locations of massive star-forming sites. The earliest stages of massive star formation occur while the young stellar object (YSO) is still deeply embedded within a dense clump of dust and gas (Garay et al. 2004). These molecular host clumps are typically of the order of a few parsecs across and have masses >1000 M|$\odot$| (Solomon et al. 1987; Csengeri et al. 2014; Urquhart et al. 2014c). High extinction from the dust makes it difficult to penetrate these thick cocoons (Parsons, Thompson & Chrysostomou 2009), but the side effects of star formation are often more readily detectable. For example, methanol masers and compact H ii regions evolve early on (<105 yr; Davies et al. 2011) and are easily seen at radio and submillimetre wavelengths. Methanol masers are found to be almost ubiquitously associated with massive star-forming clumps and are observed by tracing the 6.7 GHz emission of massive and highly luminous clouds (Urquhart et al. 2013a, 2014b). Compact H ii regions show up as bubbles of ionized molecular gas within the clump as a direct result of massive star formation occurring within their depths (Wood & Churchwell 1989). For the purposes of this study, we focus on the compact and ultracompact H ii regions (hereafter, UC H ii regions).
Their strong emission in the radio thermal continuum and far-infrared make H ii regions a valuable tool for tracing Galactic massive star formation (Wood & Churchwell 1989; Walsh et al. 1998; Kurtz, Churchwell & Wood 2016). An UC H ii region is formed when a YSO reaches sufficient temperature to emit UV-radiation, ionising the surrounding gas and producing a small region (diameter, d < 0.1 pc) of photoionized hydrogen within the host molecular cloud. As the YSO evolves, its UV output increases, expanding the boundaries of the H ii region so that it may now be defined as compact (d < 0.5 pc), classical (d ∼ 10 pc), or extended (d > 10 pc) (Kurtz 2005). A Lyman continuum flux may be derived from the free–free emission (bremsstrahlung emission) emitted by the hydrogen that directly correlates with the YSO’s observed luminosity. Early catalogues of H ii regions selected candidates based on their mid- or far-infrared colours (e.g. Wood & Churchwell 1989; Walsh et al. 1998; Kurtz et al. 2016). However, this method also identified other infrared-bright objects such as planetary nebulae and intermediate-mass YSOs, leading to confusion in the catalogues and bias in any derived models (Ramesh & Sridharan 1997). The rise of wide area radio surveys prompted a new wave of attempts to separate the similarly coloured sources through multiwavelength inspection (Becker et al. 1990; Zoonematkermani et al. 1990; Becker et al. 1994; Giveon et al. 2005; Murphy et al. 2010; Hindson et al. 2012) but many of these were carried out in snapshot mode, limiting UV-coverage and causing some H ii regions to be falsely identified as bright compact components of more extended emission (Kim & Koo 2000; Kurtz et al. 2000; Ellingsen, Shabala & Kurtz 2005)
Urquhart et al. (2013b) addressed this problem by cross-matching 870 |$\mu$|m submillimetre observations from ATLASGAL with 5 GHz CORNISH radio data and GLIMPSE mid-infrared 3-colour images (Benjamin et al. 2003; Schuller et al. 2009; Hoare et al. 2012). UC H ii regions could be recognized from the coincidence of the submillimetre and radio contours embedded in regions of strong dust emission and if they met three primary criteria: (1) they should have radio spectra consistent with thermal free–free continuum, (2) they are clearly associated with thermal infrared emission from the heated dust within the ionized nebula, and (3) they show signs of being embedded within the molecular cloud clump. Within the overlapping area of these surveys (10○ ≤ l ≤ 60○, |b| ≤ 1○; see Fig. 1), Urquhart et al. (2013b) were able to identify and confirm 213 bona fide UC H ii regions embedded within 170 clumps. Kinematic distances were derived for each clump (except where parallax distances were available) and used to estimate clump mass, clump size, Lyman continuum flux, and diameter for each embedded H ii region. Cesaroni et al. (2015) performed a similar analysis with Hi-GAL (Molinari et al. 2010) and CORNISH, finding a comparable number of 230 UC H ii regions (with 10○ ≤ l ≤ 65○, |b| ≤ 1○). However, due to the limited l range in CORNISH, these results are incomplete at larger values of galactocentric radii (RGC > 8 kpc). CORNISH objects within this longitudinal area may also include sources up to a heliocentric distance of D ∼ 20 kpc, which limits the number of detections that can occur past a certain point and affecting completeness limits (see Fig. 1).
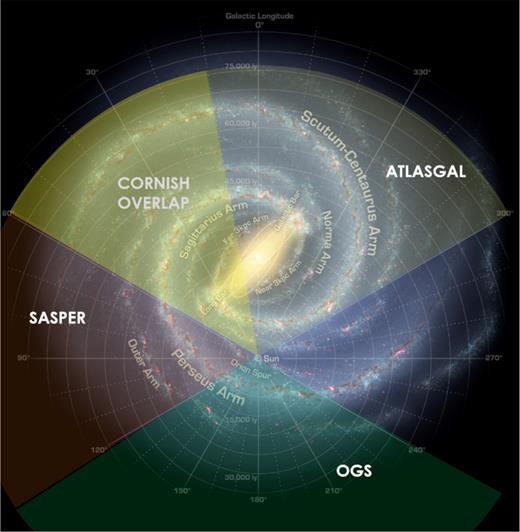
A schematic of the Milky Way showing the Galactic coverage of surveys relevant to this work. ATLASGAL is indicated by the gold shading, whereas the two components of SASSy (SASSy-Perseus or ‘SASPER’ and SASSy-Outer-Galaxy-Survey or ‘OGS’) are shown in red and green, respectively (see text for details). The CORNISH region which overlaps ATLASGAL from 10○ ≤ l ≤ 60○ is also shown. RMS covers the full Galactic range from 10○ ≤ l ≤ 350○ though it is not shown here so as to avoid cluttering the image. The background image is an artist’s impression of the Galactic plane and includes generic points of reference such as larger spiral arms and their names, location of the Sun, and the Galactic bar. To remain consistent with work by Urquhart et al. (2013b, 2014a), we adopt the value of RGC = 8.5 kpc for the distance of the Sun from the Galactic Centre and radius of the solar circle.
A well-sampled range in RGC is essential to fully appreciate the Galactic picture of massive star formation as evidenced by studies such as Twarog, Ashman & Anthony-Twarog 1997 who analysed a sample of open clusters and found that the Galactic metallicity gradient can be described via two zones, an inner and an outer, separated by a step-like discontinuity around the position of the solar circle (RGC ∼ 8.5 kpc). Thus, the outer Galactic regions (RGC > 8.5 kpc) will have systematically lower metallicities and higher gas-to-dust ratios compared to the inner Galaxy. Lépine et al. () and Eden et al. (2012) further suggested that this variation may be caused by entry shocks of material at the co-rotation radius, confirming such a boundary and a shift in environmental conditions at the position of the solar circle. Later, Ness & Freeman (2016) confirmed that metallicity decreases with increasing RGC, indicating that the material in the outer region is younger and suggesting star formation to be less frequent. Finally, Giannetti et al. 2017 used observations of the optically thin C18O(2–1) transition for 23 massive and dense star-forming regions at RGC > 14 to determine the approximate gradient by which the gas-to-dust mass ratio, R, increased as a function of RGC and found the relation, log (R) ∝ 0.087RGC. This is a significant variation from the model established by Draine et al. (2007) that assumes a constant value across all galactocentric radii (R = 100). The results imply that a sample covering the full range in Galactic longitude is necessary to accurately represent the entire Galaxy.
There have been several attempts to compile such a more diverse sample like the all-sky WISE-based one from Anderson et al. (2014) along with the ongoing Galactic H ii Region Discovery Survey (HRDS; Bania et al. 2010). The catalogue consists of over 8000 Galactic H ii regions and H ii region candidates selected via their characteristic mid-infrared morphologies with the HRDS used to follow up on candidate sources to detect hydrogen radio recombination lines and to confirm their status as a bona fide H ii region. However, the catalogue focuses on later-stage H ii regions or those that we consider to be extended or classical regions. HRDS uses the Green Bank Telescope (GBT) which has a full width at half-maximum (FWHM) beam size of 82 arcsec at 9 GHz (3 cm). This is too large to accurately sample and identify the UC H ii regions with expected sizes of approximately 1.5–20 arcsec and is not sufficient for our purposes of tracing recent massive star formation via these more compact sources. There are other WISE-based studies that continue to use infrared colour selection methods (e.g. Marton et al. 2016; Izumi et al. 2017) but remain similarly sensitive to resolution and colour selection issues. Additional attempts that use partial pre-existing H ii region catalogues (e.g. Eden et al. 2015; Vutisalchavakul, Evans II & Heyer 2016) suffer from the same problems as earlier infrared-based catalogues, including false sources and having large uncertainties. Few of these studies show a sample that provides complete Galactic coverage for larger values of RGC and they disagree on the predicted rates by which star formation might decline in the outer Galaxy. Wouterloot, Brand & Henkel (1988) did push the search for UC H ii regions to RGC = 14−20 kpc using a set of defined far-infrared colour criteria to select likely IRAS candidates and search for |$\rm {H_2O}$| masers (another tracer of star formation); however, with a beam size of 4.7 arcmin at 100 |$\mu$|m, the IRAS catalogue has too much confusion to identify and classify such compact objects with any significant level of confidence (Neugebauer et al. 1984).
Our goal in this paper is to use the Urquhart et al. (2013b) sample of H ii regions as a starting point to build the rest of a catalogue that will be well-sampled, reliable, and complete for a significant range of RGC. The SCUBA-2 Ambitious Sky Survey (SASSy; Thompson et al. 2007) offers an outer Galaxy submillimetre survey comparable to ATLASGAL in overall angular resolution and sensitivity (see Section 2 for details) but which focuses on Galactic longitudes of 60○ ≤ l ≤ 240○. As Fig. 1 illustrates, the SASSy data set is able to provide a more complete sample of objects in RGC = 8–20 kpc than available in ATLASGAL due to the overall closer heliocentric distances for larger larger corresponding values of RGC.
For this work, we adopt the UC H ii regions found by Urquhart et al. (2014a) for the remaining ATLASGAL area (300○ ≤ l ≤ 10○) and add in the high angular resolution results of SASSy (60○ ≤ l ≤ 240○) to build upon the results of Urquhart et al. (2013b) and further examine the changes in SFE as a function of RGC. Both new subsets used the same methodology to cross-match the submillimetre with radio and infrared data available from the RMS database which covers the Galactic plane from 10○ ≤ l ≤ 350○ (Lumsden et al. 2013). RMS avoids much of the confusion introduced by other infrared-bright objects by filtering the bona fide H ii regions via follow-up radio observations. The details of these surveys and the resulting radio catalogues are described in Section 2. The initial Urquhart et al. (2013b) sample was ultimately complemented with an additional 323 bona fide UC H ii regions. This more than doubles the original sample size, bringing the full number to 536 regions. We explain the detailed source compilation, classification, and matching process used to build the full catalogue in Section 3. In Sections 4 and 5, we present the relevant clump and H ii region properties and determine whether any variations exist between the inner and outer Galaxy subsets. In Section 6, we examine the resulting trends as a function of RGC and compare the findings to other studies that have investigated Galactic trends for massive SFRs and SFEs. Finally, in Section 7, we summarize our results and discuss the implications.
2 SURVEYS
The following section describes the surveys used in this study. The breakdown in Galactic longitudes for each is shown in Fig. 1.
2.1 ATLASGAL
The ATLASGAL survey was the first systematic submillimetre survey of the Galactic plane, covering 300○ ≤ l ≤ 60○ and |b| ≤1.5○, but was later extended to include 280○ ≤ l ≤ 300○ with 2○ ≤ b ≤ 1○ to account for the warp of the Galactic disc (Schuller et al. 2009; Csengeri et al. 2014). The survey used the Large APEX Bolometer Camera which consists of 295 bolometers observing at 870 |$\mu$|m or 345 GHz (Siringo et al. 2009). For this particular wavelength, the telescope has a beam size of 19.2 arcsec at FWHM and a positional accuracy of 4 arcsec (Schuller et al. 2009). Contreras et al. (2013) used the source extraction algorithm SE xtractor (Bertin & Arnouts 1996) to produce an initial compact source catalogue (CSC) of 6774 sources for the central region of the survey area (330○ ≤ l ≤ 21○). The full ATLASGAL CSC (Contreras et al. 2013; Urquhart et al. 2014c) consists of ∼10 000 sources and is 97 per cent complete for sources above 5σ and >99 per cent complete above 7σ using a normal distribution of noise values and a standard deviation of σ = 60 mJy beam−1. The results from the survey have provided a complete census of dense dust clumps within the inner Galaxy including all potential massive star-forming clumps with masses greater than 1000 M⊙ out to a heliocentric distance of ∼20 kpc (Urquhart et al. 2014c).
2.2 SASSy
The SASSy utilized the James Clerk Maxwell Telescope (JCMT) to observe the outer Galaxy at 850 |$\mu$|m, with an angular resolution of 17 arcsec (Dempsey et al. 2013). The results of this survey are currently being prepared for publication (Thompson et al. in preparation). It was designed to fully exploit SCUBA-2’s fast mapping capability and to form a long wavelength counterpart to Herschel’s PACS and SPIRE (Griffin et al. 2008; Poglitsch et al. 2010), via the targeting of cold, early-stage objects (Thompson et al. 2007). It covered ∼500 deg2 of the sky visible from Mauna Kea down to a 1σ noise level of ∼30 mJy beam−1. It was the first ground-based submillimetre survey to target specifically the outer Galaxy. As such, it may be used as a beneficial complement to ATLASGAL, possessing similar beam size and sensitivity limits. SASSy was split into two parts: SASSy-Perseus and SASSy-Outer-Galaxy-Survey (hereafter, SASPER and OGS, respectively). SASPER was designed as an extension to the original science verification data when it was announced that Hi-Gal (Molinari et al. 2010) would be increasing its coverage to include the 60○ ≤ l ≤ 120○ region, i.e. the Perseus arm (visible in Fig. 1). It was concluded with 100 per cent completion, covering ∼100 deg2 at a nominal depth of 25 mJy beam−1. The catalogue for SASPER consists of 1,372 individual sources (Thompson et al. in preparation). OGS covered most of the remaining Galactic regions with 120○ ≤ l ≤ 240○. Nettke et al. (2017) have produced a partial catalogue of 265 beam-sized sources for the 120○ ≤ l ≤ 140○ region, down to an rms of ∼40 mJy. The complete OGS catalogue contains 1766 sources with 99 per cent completeness above 5σ (Thompson et al. in preparation). Altogether, SASSy contains 3138 clump sources. Both of the subregions in SASSy used FellWalker source extraction algorithm tool (Berry 2014) to produce their respective catalogues.FellWalker was also the method used by JCMT Plane Survey (JPS) which previously used the SCUBA-2 instrument to observe the |$7^{^{\circ }} \le l \le 63^{^{\circ }}$| portion of the inner Galaxy (Eden et al. 2017).
2.3 RMS
The Red MSX Survey (RMS)1 provides a Galactic sample of massive young stellar candidates identified from the MSX satellite catalogue (Price et al. 2001) by comparing their mid-infrared colours to those of objects already identified as confirmed MYSOs and H ii regions (Lumsden et al. 2002). It covers the majority of the Galactic plane with 10○ ≤ l ≤ 350○ and |b| ≤ 5○, purposely avoiding longitudes near the Galactic centre to circumvent problems with source confusion as a result of crowded positions and/or sources whose kinematic distances cannot be constrained. Though initially selected via these colours, the database has been continuously added to and refined by a programme of multiwavelength observations, including radio continuum, molecular line, and mid-infrared observations (Hoare et al. 2005; Mottram et al. 2007; Urquhart et al. 2007a, 2008a,b, 2009). A full description of these is provided in Lumsden et al. (2013). This process resulted in a catalogue containing MYSOs, H ii regions, evolved stars, planetary nebulae, and nearby low-mass YSOs. Lumsden et al. (2013) classified each of these objects according to their three-colour images provided by GLIMPSE (Benjamin et al. 2003), WISE (Wright et al. 2010), or Hi-GAL (Molinari et al. 2010) surveys, as available, and the radio contours from counterparts identified in the follow-up observations. Approximately 1700 massive YSOs and H ii regions have been identified to date with radial velocities and distances available for 90 per cent of the objects (Urquhart et al. 2014a). An analysis from Lumsden et al. (2013) shows that RMS is more than 90 per cent complete for the massive protostellar population within the adopted selection boundaries with a positional accuracy of the exciting source of better than 2 arcsec.
2.4 CORNISH
The CORNISH survey was used by Urquhart et al. 2013b as a radio-counterpart to a corresponding area overlapping with ATLASGAL. CORNISH mapped 5 GHz radio continuum emission in the northern Galactic plane for 10○ ≤ l ≤ 60○ and |b| ≤ 1○. It was designed to identify UC H ii regions across the Galactic disc (Hoare et al. 2012) and to give a radio counterpart to arcsecond-resolution infrared surveys (e.g. UKIDSS, GLIMPSE, and MIPSGAL). CORNISH used the Very Large Array (VLA) to resolve radio emission on angular scales between 1.5 and 20 arcsec. The rms noise level of the images is better than 0.4 mJy beam−1, which is sufficient to detect free–free emission from an optically thin H ii region around a B0 star on the other side of the Galaxy (Urquhart et al. 2013b). The CORNISH catalogue contains 2637 sources above a 7σ intensity cut-off (Purcell et al. 2013).
3 THE CATALOGUE
The classification of a bona fide UC H ii region relies on examining the alignment of radio, infrared, and submillimetre data. Several studies have used this technique to classify radio emission, including Urquhart et al. (2009, 2013b), Thompson et al. (2006), Hindson et al. (2012), and Purcell et al. (2013). The coincidence of the submillimetre data with peaks in the radio and correlation with strong mid-infrared emission has proved a useful tool in confidently identifying objects that are often very similar when viewed via mid-infrared colours alone.
The compilation of the full catalogue is based on ATLASGAL and SASSy submillimetre datasets with ATLASGAL primarily representing the inner Galaxy and SASSy, the outer Galaxy. In addition to the final source lists, ATLASGAL and SASSy produced clump mask images marking the extent and location of each detected clump source. To ensure consistency between the survey results, we compared their clump-finding methods. As described in Section 2, ATLASGAL identified clumps using the source extraction algorithm SE xtractor whereas SASSy used FellWalker . We selected an area around the W3 star-forming complex and ran both algorithms using the SE xtractor parameters given in Contreras et al. (2013). After excluding sources with fewer than 12 pixels, FellWalker found 46 sources while SE xtractor produced 47 sources. The algorithms yielded overall similar results with minor variations in pinpointing the centre of a source and in how they distinguished partially blended sources.
We also examined the RMS database which includes radio and associated infrared data for a large majority of its objects. Lumsden et al. (2013) had utilized follow-up 5 GHz radio observations from multiple studies to match each source with either GLIMPSE 3.6, 4.5, and 8.0 |$\mu$|m, MIPSGAL 24 and 70 |$\mu$|m, WISE 3.4, 4.6, 12, and 22 |$\mu$|m, or Hi-GAL 70, 160, 250, 350, 500 |$\mu$|m data as available (Benjamin et al. 2003; Carey et al. 2009; Molinari et al. 2010; Wright et al. 2010, respectively). Each MYSO candidate was then classified according to a manual inspection of the results. Comments regarding the reasoning for each classification decision were recorded in the database (see footnote link provided in Section 2). The follow-up radio observations were completed with ATCA and the VLA, which was also used in the CORNISH survey. Both CORNISH and the follow-up observations are sensitive to radio emission from angular scales of up to 20 arcsec. RMS currently contains over 5000 objects across the Galactic plane but only ∼900 are classified as H ii regions which includes both compact and extended sources.
These radio sources were matched with their corresponding submillimetre host clump using positional matching methods. For ATLASGAL sources, we adopt the matches found by Urquhart et al. (2013b, 2014a) who took radio positions as given by RMS or CORNISH to match the H ii regions with corresponding submillimetre clumps whose position and extent had been defined by clump masks generated by SExtractor. Next, archival infrared data were inspected. The 3-colour image of the source overlaid with radio and submillimetre contours could be used to confirm proper coincidence and characteristics of an UC H ii region. Further details on the process of creating the 3-colour/contour postage stamps is given in Urquhart et al. (2013b) along with examples for a bona fide compact H ii region as well as other objects commonly mistaken for them when examined solely based on infrared colours. We used these same methods to then match associated RMS H ii regions with SASSy’s FellWalker clumps.
Of the 900 H ii regions listed in RMS, 751 are located in the area of the ATLASGAL survey (280○ ≤ l ≤ 60○), with 301 of these lying in the CORNISH region (10○ ≤ l ≤ 60○). Urquhart et al. (2013b) identified 213 UC H ii regions from ATLASGAL-CORNISH matching. Urquhart et al. (2014a) matched counterparts between ATLASGAL and RMS sources and found an additional 239 sources. Of these, 49 were located in the CORNISH area that had not been detected previously. We have examined these objects and find that the majority appear to have peak fluxes below the CORNISH sensitivity limit of ∼2.7 mJy. Others may have only been detected later as a result of flux variability. Kalcheva et al. (2018) has estimated that ∼5 per cent of all H ii regions are affected by this trait. The remaining few sources (∼5) have flux differences of only a few mJy from the CORNISH sensitivity limits which may be a result of differences between data reduction and/or calibration techniques among the various surveys. Lastly, in the SASSy region (60○ ≤ l ≤ 240○), RMS lists 124 H ii regions and we identified 84 matches with a SASSy counterpart. Overall, the final catalogue consists of 536 H ii regions associated with 445 molecular host clumps covering the Galactic plane with 280○ ≤ l ≤ 240○ and more than doubling the initial sample size from Urquhart et al. (2013b). We note that there are a relatively small number of matches identified for the SASSy-OGS region but further examination showed that very few of the potential RMS matches in this area had existing radio data. We will address the possible implications of this on the resulting galactocentric radial trends later in Section 6.
We are not concerned with the possibility of chance alignments of Galactic dust emission with extragalactic background sources, planetary nebulae, or radio emission from more extended H ii regions as these objects were already re-classified as non-H ii regions and excluded during the RMS classifications made using follow-up observations.
3.1 Distances
Reliable distance estimates are essential for examining the physical properties of the UC H ii regions and their host clumps. Maser parallax and spectroscopic distances are the preferred methods as these tend to be more reliable. In our catalogue, we found 20 sources known to be associated with the Cygnus X region located at D = 1.4 kpc and RGC = 8.2 kpc for which well-known parallax information is available and thus their associated uncertainties will be very small compared to the rest of the sample (Rygl et al. 2012).
The remaining sources in our catalogue have kinematic distances. It is important to stress we have chosen to use the updated distance and galactocentric radii values provided by Urquhart et al. (2018) which recalculated kinematic distances for many ATLASGAL clump sources (see distance reference flags included in Table 1). Despite the corrections, the radial velocity measurements tend to have a general uncertainty of ±10 km |$\rm {s}^{-1}$| due to systematic errors from streaming motions (Reid et al. 2009). This corresponds to a kinematic distance error of ∼0.6–1 kpc. For the SASSy sources, we adopt the distance listed for the corresponding radio source in the RMS catalogue which draws on various references and follow-up studies to provide values for each source (see Urquhart et al. 2007b, 2008b, 2014a and references therein). These values are subject to similar overall distance errors as those found in ATLASGAL. Of the 445 total host clumps, we were unable to determine distances for 6 of them (correlating with seven H ii regions) due to radial velocities not being available in RMS or other literature.
Derived clump properties of the host molecular clumps. The first column gives submillimetre name (AGAL for ATLASGAL objects; JCMTLSY for SASSy) with superscripts denoting publication clump source was adopted from: 1Urquhart et al. (2013b); 2Urquhart et al. (2014a); 3Thompson et al. (in preparation). The remaining columns include: complex that clump belongs to (if any); H ii region density; radial velocity; heliocentric distance; galactocentric radius; flag denoting source of adopted distance information ([1] Urquhart et al. 2018; [2] Urquhart et al. 2013b; [3] Urquhart et al. 2014a; [4] adopted from RMS database); effective radius of clump; peak and integrated submillimetre fluxes; gas-to-dust ratio value with Giannetti et al. (2015) correction; column density; corrected column density; clump mass; corrected clump mass. Full table will be available in electronic form at CDS.
| Submm name | Complex | H ii | vlsr | D | RGC | Flag | Radius | Peak flux | Int flux | R | Log |$N_{\mathrm{ H}_{2}}$| | Log |$N_{\mathrm{ H}_{2}}$| [corr] | Log M | Log M [corr] |
|---|---|---|---|---|---|---|---|---|---|---|---|---|---|---|
| (km s−1) | (kpc) | (kpc) | (pc) | (Jy beam−1) | (Jy) | (cm−2) | (cm−2) | (M⊙) | (M⊙) | |||||
| 1AGAL010.299−00.147 | W31-North | 1 | 12.8 | 3.5 | 4.9 | 1 | 2.77 | 7.67 | 54.18 | 73.5 | 19.13 | 19 | 3.38 | 3.25 |
| 1AGAL010.321−00.257 | W31-South | 1 | 32.2 | 3 | 5.4 | 1 | 2.48 | 2.39 | 14.93 | 81.25 | 18.62 | 18.53 | 2.69 | 2.6 |
| 1AGAL010.472+00.027 | − | 2 | 66.7 | 8.5 | 1.6 | 1 | 5.54 | 35.01 | 88.12 | 37.95 | 19.79 | 19.37 | 4.36 | 3.94 |
| 1AGAL037.819+00.412 | − | 2 | 18 | 12.3 | 7.7 | 1 | 3.58 | 2.94 | 7.57 | 128.8 | 18.71 | 18.82 | 3.62 | 3.73 |
| 1AGAL037.867−00.601 | − | 1 | 50.7 | 10 | 6.2 | 2 | 1 | 1.67 | 5.05 | 95.37 | 18.47 | 18.45 | 3.26 | 3.24 |
| 1AGAL037.874−00.399 | − | 1 | 60.8 | 9.7 | 6 | 1 | 4.4 | 5.37 | 18.45 | 91.62 | 18.97 | 18.94 | 3.8 | 3.76 |
| 1AGAL038.646−00.226 | − | 1 | 69.2 | 4.7 | 5.7 | 2 | 0.53 | 0.84 | 2.86 | 86.28 | 18.17 | 18.11 | 2.36 | 2.3 |
| 1AGAL038.652+00.087 | − | 1 | −36.5 | 14.6 | 9.6 | 1 | 2.38 | 0.77 | 3.62 | 188.45 | 18.13 | 18.41 | 3.45 | 3.72 |
| 2AGAL346.076−00.056 | − | 1 | −83.9 | 10.2 | 2.9 | 1 | 5.1 | 2.38 | 11.57 | 49.24 | 18.62 | 18.31 | 3.64 | 3.33 |
| 2AGAL346.232−00.321 | − | 1 | −11.5 | 14.98 | 7.02 | 3 | 1.31 | 0.78 | 2.65 | 112.39 | 18.14 | 18.19 | 3.33 | 3.39 |
| 2AGAL347.304+00.014 | − | 1 | −8.9 | 1.4 | 7 | 1 | 0.16 | 0.69 | 1.68 | 111.94 | 18.08 | 18.13 | 1.08 | 1.13 |
| 3JCMTLSY J073538.53−184855.1 | − | 1 | 46.8 | 3.5 | 10.8 | 4 | 0.95 | 0.27 | 15.38 | 239.66 | 17.7 | 18.08 | 2.81 | 3.19 |
| 3JCMTLSY J074451.83−240744.3 | − | 1 | 66.8 | 5.4 | 12 | 4 | 2.33 | 2.52 | 179.97 | 304.79 | 18.67 | 19.16 | 4.26 | 4.74 |
| 3JCMTLSY J194815.31+280727.4 | − | 1 | −55.3 | 11.7 | 11 | 4 | 2.19 | 0.54 | 0.53 | 249.46 | 18 | 18.4 | 2.4 | 2.8 |
| 3JCMTLSY J194914.48+265010.9 | − | 1 | − | − | − | − | − | 0.68 | 2.39 | − | 18.1 | − | − | − |
| 3JCMTLSY J195803.01+314407.3 | − | 1 | −65.5 | 11.7 | 11.6 | 4 | 2.08 | 0.33 | 0.32 | 281.32 | 17.79 | 18.24 | 2.18 | 2.63 |
| 3JCMTLSY J200137.46+333527.5 | − | 1 | −22.9 | 7.4 | 9.1 | 4 | 3.75 | 0.54 | 2.28 | 170.49 | 18 | 18.24 | 2.64 | 2.87 |
| 3JCMTLSY J200145.71+333244.3 | − | 1 | −25.2 | 7.6 | 9.2 | 4 | 7.8 | 12.68 | 47.43 | 173.94 | 19.37 | 19.62 | 3.98 | 4.22 |
| 3JCMTLSY J203900.97+421931.5 | − | 2 | −2.4 | 1.2 | 8.3 | 4 | 1.52 | 18.33 | 143.38 | 145.24 | 19.53 | 19.7 | 2.85 | 3.02 |
| 3JCMTLSY J203901.27+422203.6 | Cygnus X | 1 | −3.8 | 1.4 | 8.3 | 4 | 1.09 | 10.32 | 50.6 | 145.24 | 19.29 | 19.45 | 2.54 | 2.7 |
| 3JCMTLSY J203925.53+411959.2 | Cygnus X | 1 | −2 | 1.4 | 8.3 | 4 | 0.81 | 1.08 | 7.28 | 145.24 | 18.31 | 18.47 | 1.69 | 1.86 |
| 3JCMTLSY J204233.19+425645.6 | Cygnus X | 1 | −4.1 | 1.4 | 8.3 | 4 | 0.57 | 1.05 | 3.33 | 145.24 | 18.29 | 18.46 | 1.35 | 1.52 |
| 3JCMTLSY J205413.82+445408.8 | − | 1 | −35.8 | 5.5 | 9.6 | 4 | 2.82 | 1.88 | 6.02 | 188.45 | 18.55 | 18.82 | 2.8 | 3.07 |
Fig. 2 shows the complete distribution of distances for both the host massive star-forming clumps (grey) and UC H ii regions (blue). The upper panel shows the distribution in terms of heliocentric distances with the sample of star-forming regions possessing distances ranging from ∼1 to 20 kpc. There are evident peaks in massive star-forming clumps near 5 and 10 kpc. We also note several likely peaks near 2.5, 7, and 15 kpc where there is a higher density of UC H ii regions present per clumps. Urquhart et al. (2013b) pointed out that these distances roughly coincide with the tangent points of the Galactic spiral arms and the distance between the peaks is larger than the assumed distance errors of ±1 kpc which also describes the approximate average width of a spiral arm. In the lower panel of Fig. 2, the sources are re-plotted in terms of galactocentric radius. The location of the sun at RGC = 8.5 kpc is illustrated as a vertical dashed line. The sample is dominated by inner Galaxy sources (∼75 per cent) with 334 clumps and 420 H ii regions having RGC ≤ 8.5 kpc. In the outer Galaxy, the catalogue includes 105 clumps and 109 H ii regions. Again we see potential peaks around 6 and 9 kpc which correspond to spiral arms positions along our line of sight directly towards and away from the Galactic Centre (refer back to Fig. 1). In the following sections, we will examine how the properties of these clumps and their embedded UC H ii regions vary as a function of galactocentric radius. We will investigate any trends that appear, in particular how SFRs and SFEs are affected when viewing the relatively denser and higher metallicity inner Galaxy versus the sparser, lower metallicity regions of the outer Galaxy. The inclusion of SASSy data ensures that the sample is investigated out to a Galactocentric radius of 12 kpc with additional clumps scattered out to 15 kpc or up to nearly twice the solar radius.
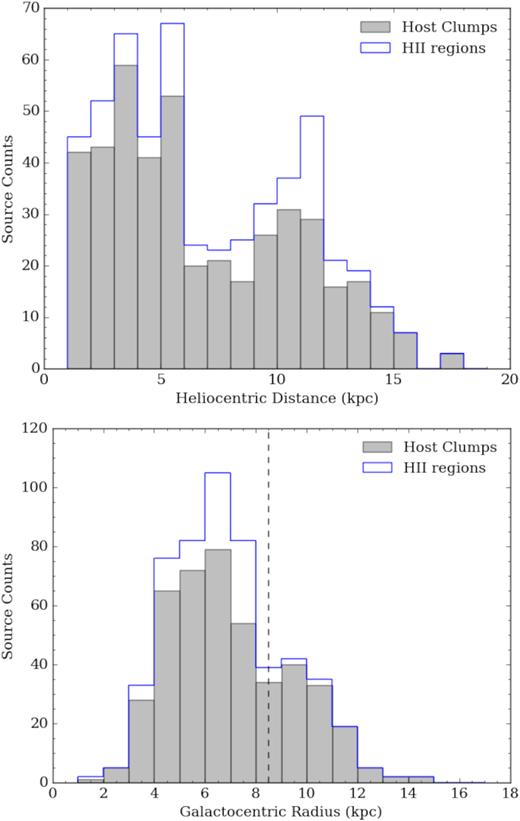
Distance distributions of host clumps (grey) and their embedded UC H ii regions (blue). The upper panel depicts heliocentric distance and shows a relatively complete distribution of distances between 1 and 20 kpc away. The lower panel presents the distribution for galactocentric radius. The vertical dashed line at RGC = 8.5 kpc represents the location of the sun and the corresponding solar circle which we will use as the boundary between the inner Galaxy and the outer Galaxy. On average, the outer Galaxy will have lower metallicities and higher dust-to-gas ratios when compared to the inner Galaxy.
3.2 Dust temperatures
The clump properties for sources adopted from Urquhart et al. (2013b, 2014a) were initially calculated using a uniform dust temperature of Tdust = 20 K across the Galactic plane. However, Urquhart et al. (2018) also obtained individual dust temperatures for each ATLASGAL source, showing that temperatures tend to increase by ∼5 K with galactocentric radius between 5 and 15 kpc. However, no dust temperatures are currently available for the SASSy clumps. For consistency, we have adopted the average dust temperature from those calculated by Urquhart et al. (2018) and find a mean value of |$T_{\rm {dust}}=27\,$|K. We will use this value to calculate all corresponding clump and H ii region properties as presented in Sections 4 and 5, with the caveat that if the temperature should actually increase as a function of radius, then we may be overestimating the masses for clumps at higher galactocentric radii.
4 CLUMP PROPERTIES
In the following section, we present the physical properties of the molecular clumps which host the sample of UC H ii regions. All calculations are based on the distances and temperature assumption described previously in Section 3. The clump properties for a selection of sources are listed in Table 1 with the full catalogue available online. The results are also summarized with a series of histograms displaying the data as two subsets representing inner and outer Galaxy sources. The inner Galaxy is normally defined as those sources that have RGC < 8.5 and outer Galaxy sources will have RGC above this value. However, due to the ±1 kpc distance error, we exclude sources within the range of uncertainty. Thus, the figures below display the definite inner Galaxy sources with 2 kpc ≤ RGC < 7.5 kpc while definite outer Galaxy sources have RGC > 9.5 kpc. We also exclude six individual clump sources whose distances could not be obtained. The host molecular clumps are likely to be forming protoclusters of YSOs. The most massive members of these protoclusters will be responsible for the majority of the observed bolometric luminosity and Lyman continuum flux.
4.1 Clump radius
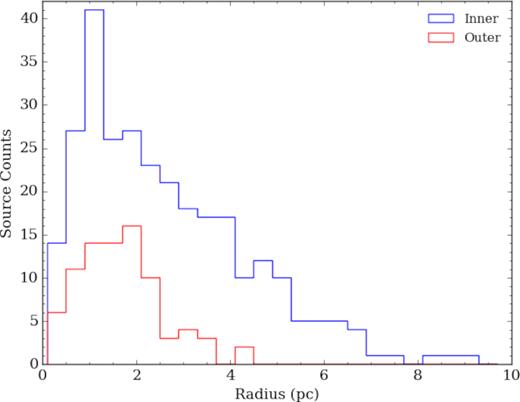
The distribution of inner (blue) versus outer (red) Galaxy sources of effective radii for each clump associated with at least one H ii region. See text for further details. Bin size is 0.4 pc.
4.2 Clump mass
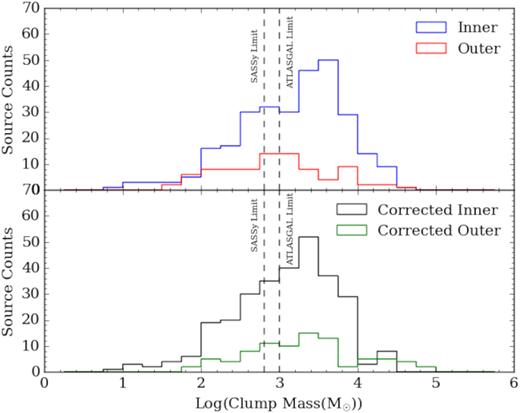
Upper panel: Distribution of clump masses for inner and outer Galaxy sources assuming R = 100. Lower panel: Distribution of clump mass after corrections have been made for R with respect to each source’s RGC. The mass limits for ATLASGAL and SASSy are depicted via the dashed horizontal lines at 103 and 102.8 M⊙, respectively. Bin size is 0.25 dex.
In the lower panel of Fig. 4, we have calculated ATLASGAL and SASSy clump masses using the corrections given by equation (3). Both values are included in Table 1. The completeness limits for ATLASGAL and SASSy are also shown at 103 and 102.8 M⊙, respectively. The ATLASGAL limit was adopted from Urquhart et al. (2013b) while the representative value for SASSy was estimated by measuring the background rms value of each image and averaging together to represent a flux uncertainty for the full SASSy region. This value was inserted into equation (2) along with the maximum observed distance (8 kpc) of a matched SASSy-RMS source to derive the corresponding mass completeness limit.
In the inner and outer Galaxy subsets, there are 289 and 86 clumps, respectively. When the gas-to-dust corrections are applied to the mass calculations, we notice an overall shift towards lower values for the inner Galaxy subset and an opposite shift apparent in the outer Galaxy sample. Inner galaxy uncorrected masses peak around 3.8 dex with an average value of 3.14 dex and a median of 3.27 dex. These are distinctly different from the outer Galaxy values of 3, 2.92, 2.93 dex, respectively. With the corrected masses, both subsets show a peak around 3.5 dex. Similarly, the inner and outer Galaxy averages (3.06 dex versus 3.3 dex) and median values (3.18 dex versus 3.47 dex) also show the relative shifts of each subset.
A KS-test shows that while the inner versus outer Galaxy uncorrected masses have a p-value of 0.012, the corrected values possess an even lower p-value of 0.006, This result suggests that there is a <1 per cent chance that our rejection of the null hypothesis is incorrect. However it remains outside the established 3σ confidence level. In Section 5, we will re-examine the clump masses as they correlate with other parameters of the star-forming clumps and embedded UC H ii regions to better cancel out corresponding sources of error.
4.3 Column density
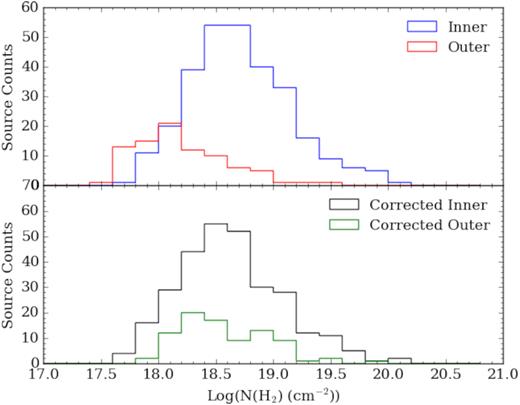
Upper panel: Column densities calculated with R = 100. Lower panel: Distribution of sources with corrected values of R. Bin size is 0.2 dex.
Both the inner and outer Galaxy subsets have an approximate range of ∼17.5–20 dex. After the R corrections, the inner Galaxy peak shifts from 18.75 to 18 dex, with the outer Galaxy peak also moving to ∼18.5 dex from 18 dex. The inner Galaxy pre-correction values for the median and mean column densities are 18.68 and 18.71 dex while the outer Galaxy has corresponding stats of 18.12 and 18.19 dex. After the corrections, the inner Galaxy median and mean become 18.58 and 18.63 dex with the outer Galaxy similarly shifting to 18.49 and 18.57 dex. A KS-test gives a p-value ≪0.001 allowing us to reject the null hypothesis that the two samples are drawn from the same parent population.
5 H ii REGION PROPERTIES
We now examine the properties of the embedded UC H ii regions using radio measurements obtained from CORNISH or the RMS database. Once more, we present the number distributions of these parameters with regards to inner and outer Galaxy subsets and remove sources within ±1 kpc of the solar circle boundary defined at R0 = 8.5 kpc. A selection of UC H ii regions is given in Table 2. The full catalogue is available online.
Derived H ii region properties for a selection of the full sample. Columns are as follows – radio name (in galactic coordinates); submillimetre name (as previously defined); offset between radio and submillimetre centres; radio peak and integrated fluxes; angular diameter; physical diameter; frequency of observations; lyman continuum flux; bolometric luminosity; associated ratios as discussed in Section 6. Full table will be available in electronic form at CDS.
| Radio name | Submm name | Offset | Peak flux | Int flux | d | d | Freq | Log NLy | Log Lbol | Log | Log | Log | Log |
|---|---|---|---|---|---|---|---|---|---|---|---|---|---|
| (arcsec) | (mJy beam−1) | (mJy) | (arcsec) | (pc) | (GHz) | (photons s−1) | (L⊙) | Lbol/M | Lbol/Mcorr | NLy/M | NLy/Mcorr | ||
| 1G010.3009−00.1477 | AGAL010.299−00.147 | 5.2 | 56.37 | 631.39 | 5.2 | 0.09 | 5 | 47.84 | 5.17 | 1.79 | 1.92 | 44.46 | 44.59 |
| 1G010.3204−00.2586 | AGAL010.321−00.257 | 4.1 | 14.61 | 18.2 | − | − | 5 | 46.17 | − | − | − | 43.48 | 43.57 |
| 1G010.4736+00.0274 | AGAL010.472+00.027 | 3.9 | 12.3 | 19.3 | 1.4 | 0.06 | 5 | 47.1 | 5.65 | 1.29 | 1.71 | 42.73 | 43.16 |
| 1G010.4724+00.0275 | AGAL010.472+00.027 | 0.8 | 22.34 | 38.43 | 1.7 | 0.07 | 5 | 47.4 | 5.65 | 1.29 | 1.71 | 43.03 | 43.45 |
| 1G010.6240−00.3813 | AGAL010.624−00.384 | 10.6 | 38.23 | 71.65 | 1.4 | 0.03 | 5 | 47.21 | 5.72 | 1.69 | 1.94 | 43.18 | 43.43 |
| 1G010.6218−00.3848 | AGAL010.624−00.384 | 8.5 | 16.81 | 37.06 | 1.7 | 0.04 | 5 | 46.92 | 5.72 | 1.69 | 1.94 | 42.9 | 43.14 |
| 2G031.0709+00.0508 | AGAL031.071+00.049 | 4.52 | 8.3 | 248.6 | − | − | 5 | 47.21 | 3.76 | 1.9 | 1.92 | 45.35 | 45.37 |
| 1G031.1596+00.0448 | AGAL031.158+00.047 | 12.4 | 18.7 | 23.83 | − | − | 5 | 46.19 | 3.27 | 0.9 | 0.92 | 43.82 | 43.84 |
| 1G031.1590+00.0465 | AGAL031.158+00.047 | 6.4 | 3.89 | 7.04 | 1.4 | 0.02 | 5 | 45.66 | 3.27 | 0.9 | 0.92 | 43.29 | 43.31 |
| 1G031.2435−00.1103 | AGAL031.243−00.111 | 4.1 | 133.77 | 353.06 | 2.2 | 0.14 | 5 | 48.72 | 5.28 | 1.6 | 1.53 | 45.04 | 44.97 |
| 2G302.0218+00.2539 | AGAL302.021+00.251 | 11.9 | 47.89 | 59.48 | 0.81 | 0.02 | 4.8 | 46.99 | 3.92 | 1.2 | 1.14 | 44.27 | 44.22 |
| 2G302.1525−00.9485 | AGAL302.149−00.949 | 11.73 | 5.66 | 39.17 | 6.52 | 0.35 | 4.8 | 47.64 | 4.52 | 1.41 | 1.13 | 44.52 | 44.24 |
| 2G302.4868−00.0315 | AGAL302.486−00.031 | 4.42 | 10.18 | 23.41 | 2.67 | 0.04 | 4.8 | 46.33 | 3.73 | 1.21 | 1.15 | 43.81 | 43.74 |
| 2G303.1173−00.9714 | AGAL303.118−00.972 | 3.19 | 192.9 | 411.8 | 2.45 | 0.02 | 4.8 | 46.98 | 3.03 | 1.62 | 1.52 | 45.57 | 45.47 |
| 2G303.5351−00.5971 | AGAL303.536−00.597 | 3.08 | 5.04 | 8.68 | 2.05 | 0.1 | 4.8 | 46.93 | 4.03 | 0.82 | 0.59 | 43.72 | 43.49 |
| 2G303.9976+00.2801 | AGAL303.999+00.279 | 6.85 | 6.56 | 33.04 | 4.97 | 0.28 | 4.8 | 47.6 | 4.23 | 1.35 | 1.06 | 44.73 | 44.43 |
| 3G064.1528+01.2817 | JCMTLSY J194815.31+280727.4 | 5.03 | 12.6 | 25.7 | − | − | 5 | 47.5 | 4.3 | 1.9 | 1.5 | 45.1 | 44.7 |
| 3G111.1919−00.7965 | JCMTLSY J231545.69+595239.3 | 7.05 | − | 1.1 | − | − | 5 | 45.26 | 3.76 | 2.2 | 1.83 | 43.7 | 43.33 |
| 3G111.2824−00.6639B | JCMTLSY J231603.89+600153.8 | 4.47 | 6.5 | 90.8 | − | − | 5 | 47 | 4.37 | 1.38 | 1.06 | 44.01 | 43.69 |
5.1 Lyman continuum flux
Fig. 6 shows the distribution of fluxes for the 350 inner (blue) and 81 outer (red) Galaxy sources. Radio observations for both CORNISH and RMS data were obtained with either VLA or ATCA, giving a consistent completeness limit of ∼1047 photons s−1. Both subsets have a similar range and peak near this value, although the outer Galaxy sources have a flatter distribution. The medians for both subsets also fall near the limit at 47.29 dex for the inner Galaxy and 46.95 dex for the outer Galaxy as do the mean values of 47.24 dex and 46.79 dex, respectively. A KS-test yields a p-value of 0.017. In this case, we are unable to reject the null hypothesis that the H ii regions are derived from a different parent distribution. This fact will be relevant for further discussion in Section 6.
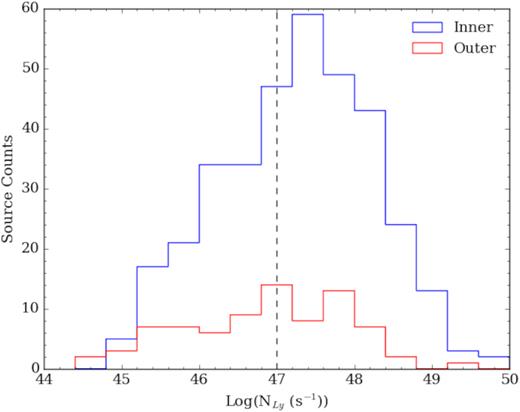
Lyman continuum flux distribution for inner (blue) and outer Galaxy H ii regions. The VLA completeness limit at 1047 photons s−1 is shown as the vertical dashed line. The outer Galaxy sources show a much flatter distribution when compared to the inner Galaxy subset which peaks near the completeness limit. Bin size is 0.4 dex.
5.2 H ii region size
Physical sizes for the UC H ii regions of each subset are given in Fig. 7. The outer Galaxy sample has a much smaller range falling between 0.1 and 0.5 pc in diameter, while inner Galaxy sources have an upper limit closer to 1 pc. None the less, both samples show most H ii regions falling within the compact and UC limits, as expected. The dashed vertical lines represent the arbitrary size limits usually assigned to UC, compact, and classical H ii regions. Both inner and outer Galaxy sources have a mean and median value around 0.1 pc. The inner Galaxy outliers with d > 0.5 pc appear to be objects that had the highest angular sizes and also fell near to the distance error cut-off limits around RGC = 8.5 ± 1 kpc. These objects will suffer the most from the associated distance uncertainties, thus skewing calculations for the physical diameter. All sources fall well below the maximum accepted 1 pc limit and may be regarded as ‘compact’ sources. Associated uncertainties will be dominated by the distance errors. A KS-test for this property does allow us to reject the null hypothesis giving a p-value result of p ≪ 0.001.
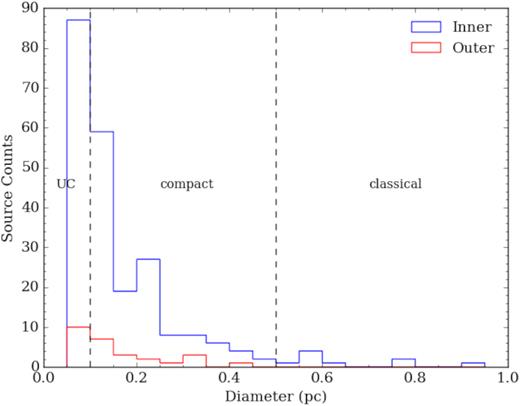
Distribution for diameter sizes of H ii regions. Vertical lines represent the cut-offs for UC, compact, and classical H ii regions normally used in the literature. Bin size is 0.05 pc.
5.3 Bolometric luminosity
The use of RMS allows us to include the estimated bolometric luminosities of each source (Mottram et al. 2011a,b). The RMS survey is complete to a few 104 L⊙ for the population of mid-infrared-selected H ii regions and MYSOs sample. Urquhart et al. (2013b) noted that this made it well matched to comparisons with CORNISH and we extend that comparison with our additional collection of H ii regions.
In Fig. 8, the inner Galaxy sources cover a wider range within ∼2–6.5 dex while the outer Galaxy subset is more limited between 3 and 6 dex. These limits equate to a B3 star and an O3 star, respectively (Martins, Schaerer & Hillier 2005). The inner Galaxy sample peaks at 5 dex but the outer Galaxy peak is closer to ∼4.3 dex. The median and average luminosity values for the inner Galaxy are identified to both be around 4.6 dex while the outer Galaxy values fall near 4.3 dex. The same trend appears for average and median values with outer Galaxy sources having average luminosities of 4.22 dex versus the inner Galaxy’s 4.62 dex and an outer Galaxy median at 4.26 versus the inner Galaxy median of 4.73 dex. A KS-test conclusively rejects the null hypothesis with p ≪ 0.001. The fluxes used to estimate the luminosities are effectively clump-averaged values and thus, are a measure of the total luminosity of the embedded YSOs. In reality, it will not be a single star embedded within the H ii region but several with the most massive star being a few subclasses later than expected. This agrees with the results found in Section 4 where the inner and outer Galaxy clumps appeared to most likely be distinctly different samples. Typical errors for these values are approximately 34|${{\ \rm per\ cent}}$| (Mottram et al. 2011b).
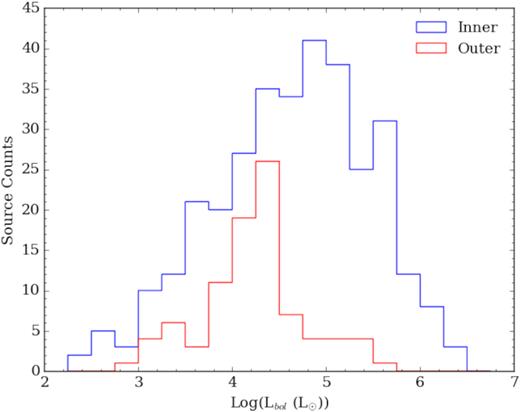
Bolometric luminosities for both subsets were adopted from the RMS catalogue. See text for further details. Bin size is 0.25 dex.
6 DISCUSSION
The supplementary UC H ii regions have more than doubled the sample size of the original ATLASGAL-CORNISH study. With an additional 323 H ii regions and 275 host clumps, the total UC H ii region catalogue now includes 536 UC H ii regions associated with 445 molecular clumps. These cover a wide range of Galactic longitudes encompassing ∼80 per cent of the Galactic plane. The farthest object is nearly 20 kpc away from the Sun and we have extended the sample to include sources out to RGC ∼ 15 kpc, allowing us to examine any trends in massive star formation across a more complete scope of Galactic plane variation.
6.1 Galactic distribution
Fig. 9 shows the Galactic longitude distribution of the full catalogue. Host clumps are plotted as the filled grey histogram and the embedded H ii regions are shown as the blue line. The addition of the remaining ATLASGAL and SASSy regions allows the total sample to cover the majority of the Galactic plane with the exceptions of −120○ ≤ l ≤ −80○ for which there are currently no equivalent submillimetre observations, and the Galactic centre (−10○ ≤ l ≤ 10○) that we have avoided due to source confusion. Peaks in the number of H ii regions per clump are clearly seen, indicating areas of intense star formation. These correspond to well-known star-forming complexes. For example, the effects from W43, W51, and W49A are visible within 30○ ≤ l ≤ 50○ (Urquhart et al. 2014a; Eden et al. 2017)
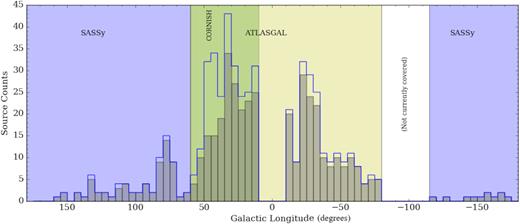
The distribution in Galactic longitude for the complete sample. Host clumps are shown as the filled histogram with H ii regions as the blue line. The background has been shaded according to the submillimetre survey which studied the corresponding longitudinal range. CORNISH has also been highlighted to illustrate the scope of the original catalogue. The inclusion of the rest of ATLASGAL and the more recent SASSy data greatly increase the area covered. Peaks can be observed where particularly intense regions of star formation have a high multiplicity of H ii regions per host clump. Bin size is 5○.
Fig. 10 shows the distribution in Galactic latitude. ATLASGAL observed sources with |b| < 1.5○ while the SASSy range included those with |b| < 2○. In the inner Galaxy, star formation appears to be mostly restricted to the Galactic plane with a skew towards negative latitudes due to the Sun’s position as well as from the observed warp in the Galactic plane. The outer Galaxy shows a broader distribution. This is in part due to the fact that the molecular disc flares out with galactocentric radius (Wouterloot et al. 1990) and also the overall closer SASSy sources will have larger ranges of latitudes observed than the more distant ATLASGAL sources.
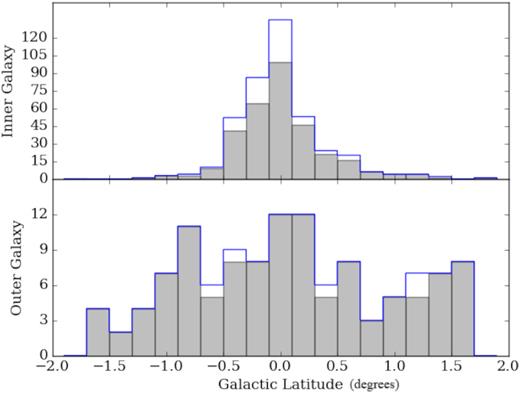
Distribution for star-forming clumps (grey filled) and embedded H ii regions (blue line) of the complete sample. The upper panel illustrates the distribution for sources with RGC < 8.5 and the lower panel shows the same for sources with RGC > 8.5. The broader distribution of the outer Galaxy is in part due to the flare in the molecular disc with increasing radius also from projection, with closer sources such as those found in SASSy having higher observed angles than the ATLASGAL sources observed at much farther distances. Bin size is 0.2○.
6.2 Galactic trends
6.2.1 Clump mass and Lyman continuum flux
In Fig. 11, we examine the relationship between clump mass and Galactocentric radius. The estimation of clump masses relies heavily on accurate distance measurements and we must be cautious of the completeness limits associated with each survey to ensure that any trends we may observe are not a result of the Malmquist bias. ATLASGAL observed across the inner Galaxy mid-plane covering 280○ ≤ l ≤ 60○, while SASSy was directed away from the centre and examined the overall closer regions of the outermost edges of the plane which include 60○ ≤ l ≤ 240○ (see Fig. 1). We determine their respective sensitivity limits by considering a hypothetical source at a distance of 8 kpc. At this range, ATLASGAL is complete for all inner Galaxy sources (RGC ≈ 2−8 kpc) and SASSy is complete for the outer radii (RGC ≈ 8−15 kpc). Using a significance level of 5σ and adopting the average rms values for each survey, we calculated mass completeness limits of 102.85 and 102.48 M⊙ for ATLASGAL and SASSY, respectively. For consistency, we use the higher of these values and remove any sources that fall below 102.85 M⊙. We also remove sources with heliocentric distance |$D \gt 8\,$| kpc since we will not be able to detect a complete distribution in masses beyond this boundary. In the end, we are left with 154 clumps, ranging from ∼103 to 105 M⊙ (using corrections from Giannetti et al. 2015 as previously discussed) across RGC = 2−15 kpc. Representative error bars are given in the lower right-hand corner of Fig. 11.
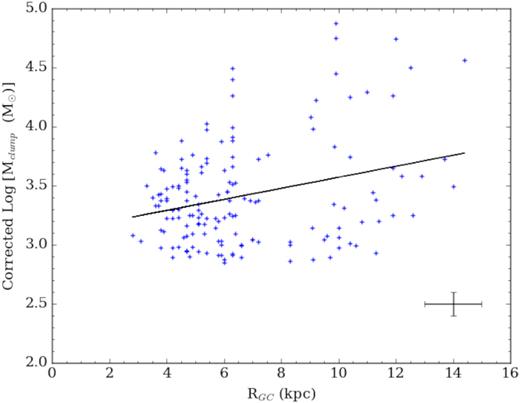
Corrected masses of host star-forming clumps as a function of Galactocentric radius. We have applied a uniform mass cut-off limit of 102.85 M⊙ and removed sources with D > 8 kpc. The vertical strip of sources near RGC ≈ 6 kpc consists of Cygnus X sources whose distances are known to a higher degree of accuracy than the surrounding data. See text for details.
We also calculated the equivalent completeness limits for the Lyman continuum fluxes. Once more, we consider a source at the maximum distance (8 kpc) and use the mean rms values as found in the RMS radio follow-up and CORNISH survey papers (Urquhart et al. 2007a; Urquhart et al. 2009; Purcell et al. 2013). The same 5σ significance level is applied. We find Lyman flux cut-offs at 1045.93 and 1046.06 photons s−1 for RMS and CORNISH data, respectively. We again implement the higher limit of 1046.06 photons s−1 as well as the distance cut-off limit for sources with D > 8 kpc. The results are plotted as a function of RGC in Fig. 12 for 238 UC H ii regions.
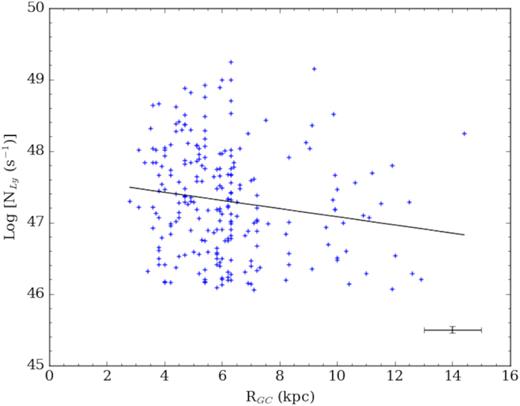
The relationship of Lyman continuum flux to galactocentric radius of UC H ii regions above the flux completeness limit of 1046.06 photons s−1 and with D > 8 kpc.
Both Figs 11 and 12 contain a great deal of scatter in the data, particular with sources in the outer Galaxy. In the case of Lyman flux, the inner Galaxy sources are also significantly scattered. To better interpret the data, we include trendlines representing the unweighted least-squares linear regression fits for each dataset. In Fig. 11, clump mass appears to increase with increasing RGC but has a relatively flat slope of +0.05 ± 0.01 kpc−1. We recall that our use of a single average dust temperature for all sources (Tdust = 27 K, see Section 3.2) may result in overestimating clump masses at higher radii. Indeed, a Spearman rank test gives a correlation of 0.123 with a high p-value of 0.11. We determine that the recorded slope is consistent with being flat and conclude that there is no correlation between clump mass with Galactocentric radius. In Fig. 12, we observe an overall decrease in Lyman flux but with another shallow slope of −0.06 ± 0.02 kpc−1 and there is a large amount of scatter present. The scatter is likely a result from using the optically thin assumption for all H ii regions (see Section 5.1) which would underestimate the Lyman continuum flux for the most compact regions that are optically thick at ν = 5 GHz. A Spearman test gives a correlation of −0.078 with another high p-value of 0.22. We conclude that there is also no significant correlation between Lyman continuum flux with Galactocentric radius. In the next step, we will examine the distance-independent variables of NLy/M and Lbol/M and how their corresponding trends correlate with previous studies.
6.2.2 A proxy for star formation efficiency and related quantities
By examining the Lyman flux and the luminosity of the H ii regions per unit mass, we are able to remove the distance dependence. As such, NLy/M will serve as a proxy for the massive SFE while Lbol/M will represent the overall SFE in massive star-forming clumps but includes both the low and high-mass stars. This gives us the added benefit of being able to study the whole catalogue as we no longer have to eliminate sources due to completeness limits.
These distance-independent parameters are shown in Figs 13 and 14. Both plots show a downward trend, initially suggesting that the massive and overall SFEs are lower in the outer Galaxy than in the inner Galaxy. However, Fig. 13 has a large amount of scatter and this affects the significance of the result. For the 518 H ii regions plotted, we estimate a gradient of −0.11 ± 0.02 kpc−1, but a Spearman test gives a correlation number of −0.075 with p-value of 0.24 which remains well above our desired 3σ confidence level and thus shows no significant correlation. Fig. 14 yields a slope of −0.1 ± 0.008 kpc−1 and this decline over RGC can be confirmed with the Spearman rank test giving a correlation of −0.258 with a p-value ≪0.001. Thus, we conclude that the overall SFE for massive star-forming clumps is decreasing and is lower in the outer Galaxy.
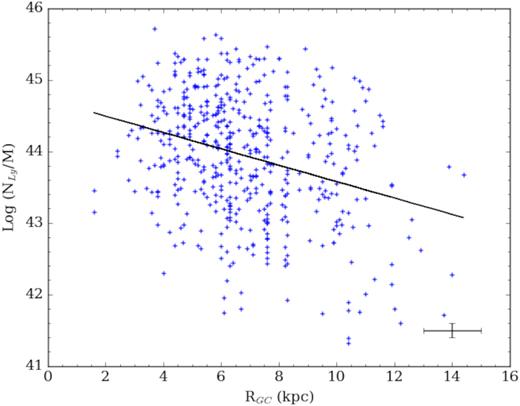
The Lyman continuum flux or rate of UV-photon output per unit mass serves as a proxy for the SFE of the most massive stars. We observe a downward trend when plotted again galactocentric radius but the scatter presents a high degree of uncertainty. See text for details.
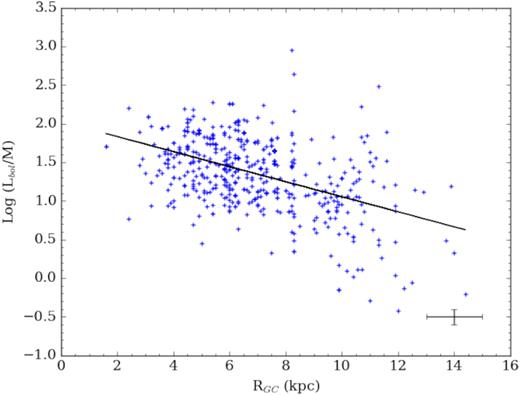
The relation Lbol/M serves as a proxy for overall SFE plotted against galactocentric radius. Again, we observe a downward trend where star formation appears to be less efficient in the outer Galaxy than in the inner Galaxy. This agrees with Fig. 13 which shows the trend for SFE of only the massive stars.
While there has been little previous investigation into these exact quantities as a function of Galactocentric radius, Lada, Lombardi & Alves (2010) previously showed that star formation was observed to be closely correlated with dense gas. The decline in overall SFE seen in Fig. 14 is mirrored in the results by Roman-Duval et al. (2016) who traced the ratio of dense (13CO-emitting) gas surface density to the total (12CO + 13CO) gas surface density and found an average gradient of −0.06 kpc−1 over 3 kpc ≤ RGC ≤ 8 kpc. A decreasing trend is also seen in Nakanishi & Sofue (2006) who plotted the molecular gas surface density as a function of galactocentric radius and found a noticeable decline, dropping steeply just beyond the solar neighbourhood or the start of the outer Galaxy by our previous definition. The same was observed in the nearby galaxy NGC 6946 by Schruba et al. (2011). Misiriotis et al. (2006) presented an estimate of the surface density of the SFR which declined steeply past RGC = 5 kpc though the data were acquired from older COBE observations of extended H ii regions (Boggess et al. 1992). Finally, Ragan et al. (2016) defined a star-forming fraction (SFF) as the ratio of Hi-GAL objects associated with a 70 μm component with the total catalogue of Hi-GAL sources. The SFF may be considered as the fraction of dense clumps with embedded YSOs. They derived a mean SFF in the Galactic disc (3.1 kpc < RGC < 8.6 kpc) of 25 per cent that declined with RGC at a rate of −0.026 ± 0.002 kpc−1. However, a few other studies have found no change in the dense gas between the inner and outer Galaxy, including Battisti & Heyer (2014) who defined a dense gas mass fraction as the ratio of the mass traced by submillimetre dust emission to the mass of the parent cloud traced by 13CO. They found no dependence on RGC but were limited to a range over 3 kpc ≤ RGC ≤ 8 kpc. Eden et al. (2012) also observed the ratio between clump to cloud mass to determine a clump formation efficiency and found no difference between the inter-arm and spiral-arm region along the selected line of sight (37.83○ ≤ l ≤ 42.50○) which translates to a galactocentric range of 4 kpc ≤ RGC ≤ 8.5 kpc. It must be noted that all of these studies are primarily restricted to the inner Galaxy and show very subtle trends which are only apparent with large samples (e.g. Roman-Duval et al. 2016) or large RGC range.
As noted in Section 3, we must address the possibility of whether the low number of matches between the SASSy OGS and RMS data may result in an incomplete catalogue for higher values of galactocentric radius, thus skewing our conclusions. Urquhart et al. (2014a) showed that the massive star-forming clumps are strongly associated with the highest column-density clumps in the Galaxy. Nearly all clumps with column density above 2–3 x 1023 cm−2 are host to massive star formation (Urquhart et al. 2014a). In Fig. 15 we show the column density distribution for all SASSy submillimetre sources (grey) along with the distribution of those particular clumps that are known to play host to massive star formation based on a review of the current literature. There are ∼20 SASSy clumps above the crucial column density limit that do not show associated tracers of massive star formation. Compared to the 445 clumps that we currently have in our final catalogue, this value represents less than 5 per cent of the total number of Galactic clumps and thus its absence will not have a significant effect on the trends we derive.
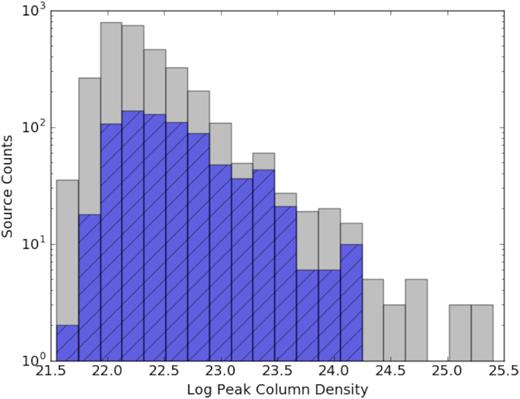
Column densities of the full SASSy submillimetre clump catalogue (grey). Previously observed clumps with known tracers of massive star formation are overlaid in blue. There are a relatively small number (∼20) of SASSy clumps with column density greater than 1023 cm−2 and no known presence of massive star formation. Bin size is 0.2 dex.
Overall, we see downward trends with increasing RGC for both the amount of massive stars per unit clump mass as well as overall stars per unit clump mass (in the massive star-forming clumps) although only the latter is confirmed as a significant result. This drop in the overall SFE combined with a flat trend in the massive SFE may imply a shift in the initial mass function (IMF) towards a lesser fraction of lower mass stars in the outer Galaxy. However, we are unable to draw any robust conclusions because we only see a statistically significant trend in the overall SFE or Lbol/M. The remaining quantities contain too much scatter to confidently identify any trends and would require further investigation in order to determine the effects if any on the IMF.
7 SUMMARY AND CONCLUSIONS
In summary, we have used the methods of Urquhart et al. (2013b, 2014a) and incorporated outer Galaxy data from SASSy to compile a sample of compact and UC H ii regions that covers the Galactic plane from 280○ ≤ l ≤ 240○. These massive star forming regions have been identified via cross-matching and coincidence of infrared, radio, and submillimetre data with ATLASGAL providing the bulk of inner Galaxy molecular clumps while SASSy encompassed the outer Galaxy. The complete catalogue totals 536 UC H ii regions associated with 445 host clumps. From this catalogue, we are able to draw the following conclusions:
We have compiled or calculated the host clump properties and find that the inner Galaxy clumps tend to be similar to their outer Galaxy counterparts as shown by a two-sample Kolmogorov–Smirnov test.
However, by the same test, there appears to be some difference in how star formation is happening and the inner and outer Galaxy H ii regions are clearly drawn from two different parent samples.
We plotted the clump mass and Lyman continuum flux as a function of galactocentric radius finding that mass tended to increase with increasing RGC while Lyman flux decreased, although the results could not be proven as significant due to the large degree of scatter and error in the data.
We removed the distance errors by also plotting the massive SFE or number of massive stars per unit mass (NLy/M) and the overall SFE or total number of stars per unit mass (Lbol/M) as a function of RGC.
By the Spearman rank test, we confirmed a significant correlation for Lbol/M with Galactocentric radius.
We conclude that the overall SFE is lower in the outer Galaxy than in the inner Galaxy.
SUPPORTING INFORMATION
Please note: Oxford University Press is not responsible for the content or functionality of any supporting materials supplied by the authors. Any queries (other than missing material) should be directed to the corresponding author for the article.
ACKNOWLEDGEMENTS
SASSy data were acquired via the James Clerk Maxwell Telescope. The James Clerk Maxwell Telescope is operated by the East Asian Observatory on behalf of The National Astronomical Observatory of Japan, Academia Sinica Institute of Astronomy and Astrophysics, the Korea Astronomy and Space Science Institute, the National Astronomical Observatories of China, and the Chinese Academy of Sciences (Grant No. XDB09000000), with additional funding support from the Science and Technology Facilities Council of the United Kingdom and participating universities in the United Kingdom and Canada. We acknowledge support from the United Kingdom Science & Technology Facility Council via grants ST/M001008/1 and ST/R000905/1. We also extend thanks to the valuable input from Toby Moore and David Eden in the final stages of the discussion. We acknowledge previous work and assistance provided by Gaius Manser in the early stages of the SASSy catalogue and matching, primarily with the SASPER dataset. Finally, we wish to thank the anonymous reviewer for valuable insight into clarifying certain details. This work would not have been possible without access to NASA ADS.
Footnotes
In the original paper, Giannetti’s equation uses γ instead of R. We have rewritten the formula here to remain consistent with our nomenclature.
REFERENCES
,
