


ABSTRACT
Some of the white dwarfs (WDs) exhibit among the strongest magnetic fields in the universe. Many of these degenerate magnetic stars are also rotating very slowly. Among these objects, Grw+70° 8247, with its century-long suspected rotation period and its 400 MG magnetic field, stands as a particularly interesting object. Surprisingly, for this star, the first WD in which a magnetic field was discovered, no spectropolarimetric observations have been discussed in the literature in the last 40 yr. Here, we present two sets of linear and circular polarization spectra taken in 2015 and 2018, and we compare them with spectropolarimetric data obtained in the 1970s. Polarization shows variability over a time interval of four decades, but some subtle changes may have been detected even over a three-year time interval. Using the variation of the polarization position angle as a proxy for the rotation of the magnetic axis in the plane of the sky, we conclude that the star’s rotation period probably lies in the range of 102–103 yr. Our data analysis is accompanied by a description of our various calibrations and tests of the ISIS instrument at the William Herschel Telescope that may be of general interests for linear spectropolarimetric measurements. We also found discrepancies in the sign of circular polarization as reported in the literature, and made explicit the definitions that we have adopted.
1 INTRODUCTION
A small percentage of white dwarfs (WDs) exhibit a magnetic field organized on a large scale over the stellar surface, probably the fossil remnant of a field that originated during an earlier stage of the star’s life. The mean magnitude of such fields ranges over more than 5 dex of strength, from a few kG to about 1000 MG, and can have important physical effects on the host star, for example by transferring angular momentum internally and exchanging it with circumstellar material, and through suppressing atmospheric and envelope convection under many circumstances.
In a larger context, the fields of the magnetic white dwarfs (MWDs) are an example of the occasional occurrence of large static fields in a variety of stars during stellar evolution, including upper main-sequence stars, WDs, and neutron stars. The origin of these fields is still essentially completely mysterious. This phenomenon may be capable of providing valuable information on specific evolution paths (e.g. of merging binary systems) that at present cannot be exploited because we have not understood some basic stellar processes. In addition, the fields of WDs provide access to a plasma laboratory permeated by fields far too large to be generated statically in terrestrial laboratories.
Up to a field strength of the order of 80 or 100 MG, WD fields are detected and studied using the splitting, shifting, and polarization of spectral lines. For higher field strengths, spectral lines are smeared almost out of recognition but the fields may be identified through the broad-band continuum circular and linear polarization usually observed throughout the optical and ultraviolet (UV) wavelength windows (Ferrario, de Martino & Gänsicke 2015), as well as through (usually very shallow) broad spectral features in the flux spectra.
Beyond identifying magnetic fields in WDs, and estimating the magnitude of the magnetic field, it is of considerable interest to try to understand the distribution of field strength and direction over the stellar surface. This kind of information can help to clarify the interaction of the field with other physical processes in the underlying star, and may provide clues about the still unclear processes that lead to the occurrence of magnetic fields in a small fraction of WDs.
Study of field structure generally requires observing the star repeatedly as it rotates. A number of MWDs exhibit short-term variability, with a period that is associated to the star’s rotation period (typically from a few hours to a few days). As in the case of the better studied magnetic chemically peculiar stars of the main sequence (Ap stars), the magnetic variability is explained in terms of a magnetic field not symmetric about the rotation axis, so that the observer sees a magnetic configuration that changes as the star rotates. This oblique rotator model was proposed to explain the polarimetric behaviour of the magnetic Ap stars by Stibbs (1950), and since then has been the basic model adopted for any large-scale stellar field that is not currently sustained by dynamo action.
Only about two dozen of the several hundred known MWDs have been clearly identified as having very high magnetic fields, above about 100 MG (e.g. Ferrario et al. 2015, fig. 5). About half of these 100+MG stars have emerged from the very large lists of new WDs found as byproducts of the Sloan Digital Sky Survey (SDSS). The other very high field MWDs were mostly found before the first data release from the SDSS by a variety of means, including surveys of broad-band circular polarization or discovery of remarkable flux spectra (flux spectra are usually denoted here as StokesIspectra).
For the SDSS very high field MWDs, in general a single low S/N (signal-to-noise ratio, typically in the range of 10–30), low resolution (R ∼ 2000) spectrum is available, and the characteristic field strength assigned is usually found by comparing the observed spectrum to spectra from a large grid of precomputed flux spectra of MWDs of a large range of Teff and field strength. The field structure assumed for the grid is a combination of low-order multipoles, often dominated by a dipole. The WD atmosphere is assumed to be pure H, and only the spectrum of H is included in the model spectra, with spectral line positions taken from tables of atomic level splitting in very large fields such as those of Wunner et al. (1985). The computation of the grid spectra and comparison with observed I spectra is described in detail by Jordan (1992), Euchner et al. (2002), and Külebi et al. (2009).
This method of modelling provides a first, basic characterization of typical field strength and a possible, but not unique, and almost certainly highly simplified, magnetic field geometry. It takes no account of the possibility that the field may look rather different as seen from different sides of the MWD as it rotates, and makes no use of information that may be contained in the linear and/or circular polarization spectra (Stokes components Q, U, and V). The results of such an analysis provide information about the general magnitude of the field and possibly of the spread of field strength over the hemisphere visible at the time that the spectrum was taken, but little further information.
For most of the dozen or so earlier discovered, and generally brighter, very high field MWDs, more information is often available. For example, several StokesI spectra may have been taken, or spectra in non-optical wavelength regions such as the UV may be available, or there may be polarization spectra (often of circularly polarized light, Stokes V, sometimes of the linear polarization components Q and U). For four of the 100+MG field MWDs, the rotation period is known, so data taken during a reasonably short interval could be assigned to distinct lines of sight to the MWD. When rotational phase-resolved data are available, models of the surface magnetic field strength and structure may be considerably better constrained. An excellent example of the quality of modelling that can be achieved when several phase-resolved spectra of both Stokes I and V are available is the analysis of PG 1015+014 carried out by Euchner et al. (2006) on the basis of modelling tools developed by Jordan (1992) and Euchner et al. (2002). Their results clearly show that the field of this star is dominated by regions with local field strength mostly in the range of 70–80 MG, and provide fairly well-constrained low-resolution maps of the large-scale distribution of flux over the surface.
However, although models have been developed for each of the four highest field MWDs with known rotation periods, none of these four MWDs have been observed systematically enough to make it possible to try to model a series of phase-resolved flux and polarization spectra.
Remarkably, for several of the earliest discovered and most intensely studied high-field MWDs, including the prototype, Grw+70° 8247 = WD 1900+705,1 it is not even clear whether any real variations have been detected. Since any magnetic configuation not strictly symmetric about the rotation axis of the star should lead to some kind of observable variability as the underlying star rotates, these non-varying stars are suspected of having extremely long rotation periods, of the order of decades or centuries (as is also the case for a few middle main sequence magnetic Ap stars, e.g. Mathys 2017). For the MWDs in the tranche with fields above 100 MG, variability may have been detected, but no rotation periods have been established that are longer than 1.4 d.
For these high-field stars, searching for modest levels of variability of polarization through broad-band filters over time spans of decades is not straightforward. Both filter bandpasses and detector wavelength sensitivity change with time and technology, and observed variations may simply be the caused by a different sampling of the stellar polarized spectrum. The information content of filter polarimetry is also quite limited.
There is little doubt that the most robust method of identifying variability, measuring the rotation period, and obtaining spectral information useful for modelling and mapping the field structure, is to repeatedly obtain polarized spectra through large wavelength windows (say 2000 Å or more), using high enough spectral resolution so that measurements taken over time with different instruments can be reliably compared. Perhaps surprisingly, this has so far hardly been done, even though at least two current facility spectropolarimeters, ISIS at the William Herschel Telescope (WHT) of the Isaac Newton Group of Telescopes (ING), and FORS at the ESO VLT, are quite capable of measuring both circular and linear continuum polarization accurately over large wavelength ranges, and have been capable of doing this for at least two decades. Fortunately, for a few of the brightest, most strongly magnetic and highly polarized WDs, some low resolution archival spectropolarimetry is available for comparison with modern data (Angel, Landstreet & Oke 1972; Landstreet & Angel 1974, 1975; Angel, Liebert & Stockman 1985; Schmidt et al. 1996).
In this paper, we present new moderate resolution line and continuum spectropolarimetry for Grw+70° 8247, and we compare our data to archival spectropolarimetry. It has not yet been established that Grw+70° 8247 is actually variable, and on the basis of apparently constant data available decades ago it has been suggested that this WD may be rotating with a period of order 102 yr or more.
The search for subtle variations in the stellar polarized spectra has prompted us to pay particular attention to the characterization of the polarimetric module of the instrument employed in our observations, so that if differences between new spectropolarimetry and archival data are found, we can be reasonably sure that they are not due to instrumental artefacts in the old or the new data.
2 DEFINITIONS OF THE OBSERVED POLARIZATION, WITH A SPECIAL ATTENTION TO THE SIGN OF CIRCULAR POLARIZATION
In this paper, we will consider the reduced Stokes parameters PX = X/I (where X = Q, U, V) and the corresponding null profiles NX. It will also be useful to describe the linear polarization in terms of the fraction of linear polarization |$P_{\rm L}= (P_\mathrm{ Q}^2+P_\mathrm{ U}^2)^{1/2}$| and its position angle Θ, such that |$P_\mathrm{ Q}=P_{\rm L}\, \cos (2\Theta)$| and |$P_\mathrm{ U}=P_{\rm L}\, \sin (2\Theta)$|. The Stokes parameters are defined according to Shurcliff (1962), and for linear polarization we haved adopted as a reference direction the great circle passing through the object and the North Celestial Pole. The position angle of the linear polarization Θ is measured positive looking at the source, counting counterclockwise from the great circle passing through the object and the North Celestial pole.
The two representations of linear polarization (PQ, PU) and (PL, Θ) are equivalent, but from the physical and geometrical point of view, (PL, Θ) may be more convenient for a physical understanding of variability and discrepancies. In case of the observations of standard stars, an incorrect alignement of the polarimetric optics is promptly detected by a discrepancy in the position angle of the polarization. The position angle of polarization due to the presence of a magnetic field is directly influenced by the transverse components of the magnetic field; for instance, in the Zeeman regime, and neglecting the magneto-optical effects, the direction of the maximum polarization is parallel to the projected magnetic axis (e.g. Landolfi et al. 1993). For small polarization values, the position angle is not well defined, and may be dramatically affected even by small amounts of instrumental polarization or other spurious effects; therefore sometimes the representation (PQ, PU) will be more convenient. In this paper, to report our observations of unpolarized standard stars, we will adopt the (PQ, PU) representation; to report our observations of standard stars for linear polarization we will adopt the (PL, Θ) representation. For our primary target, which is a magnetic star but has a polarization close to zero at certain wavelength ranges, we will describe the linear polarization both with (PQ, PU) and with (PL, Θ).
Our main target, Grw+70° 8247, is usually thought of as a star with circular polarization approximately constant with time (and as such it was often suggested as a standard star for circular polarization). However, it is found that literature data of circular polarization measured in similar interval wavelength ranges have sometimes discrepant signs. For instance, Kemp et al. (1970b) and Angel & Landstreet (1970b) reported a positive sign; Landstreet & Angel (1975) and Butters et al. (2009) a negative value. This sign ambiguity is probably related to the adoption of different definitions of the Stokes parameters, and in particular of the sign of circular polarization, as discussed for instance by Clarke (1974), Landi Degl’Innocenti, Bagnulo & Fossati (2007), and Bagnulo et al. (2009).
The ambiguity in the sign of circular polarization does not seem to have affected the sign of the magnetic field reported in the literature. For instance, we note that Putney (1995) reports a negative circular polarization for Grw+70° 8247 (see her fig. 1c), i.e. with the sign opposite to what we measure. However, for the field determinations of MWDs in the Zeeman regime, she adopts equation (1) with the plus sign in its right-hand term, and so other authors do (e.g. Borra & Landstreet 1980). This suggests that the sign of stellar magnetic fields are probably defined consistently in most if not all literature.
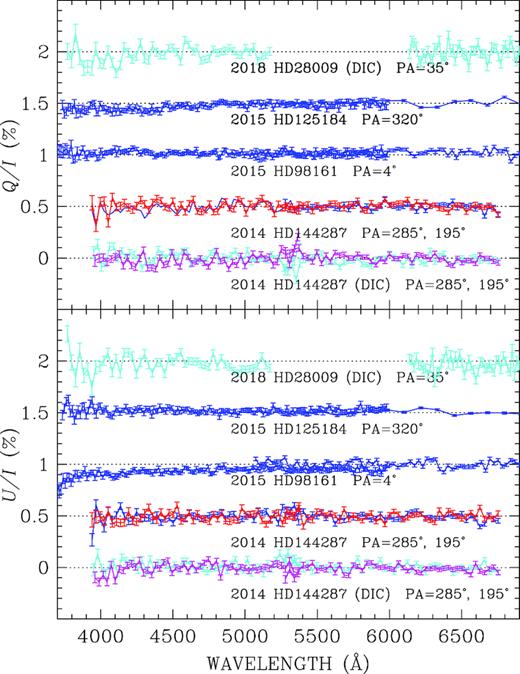
Polarization spectra of unpolarized stars, offset in 0.5 per cent steps for display purpose. Observations labelled with ‘DIC’ (represented with light blue and magenta colour) were obtained in both arms simultaneously using a dichroic beam splitter. The remaing observations (red and blue solid lines) were obtained independently in the two instrument arms. The spectra of HD 144287 were obtained with the instrument position angle at 195° (magenta and red lines) and 285° (blue and light blue lines).
Removing the ambiguity in the sign of circular polarization is obviously crucial to allow one a proper comparison of the observations of different authors and epochs. Establishing the geometrical significance of the sign of the circular polarization is also important when the original of circular polarization is associated to homochirality.
3 NEW OBSERVATIONS: INSTRUMENT SETTINGS
We carried out our new spectropolarimetric observations with the ISIS instrument of the WHT. The ISIS polarimetric module consists of an achromatic retarder waveplate (λ/2 for observations of linear polarization, or λ/4 for observations of circular polarization) which can be rotated to a series of fixed positions, followed by a Savart plate that splits the incoming radiation into two beams linearly polarized in directions perpendicular to each other, one along the principal plane of the plate (the parallel beam f∥), and one perpendicular to that plane (the perpendicular beam f⊥). These beams propagate parallel to each other but separated. A special 18 arcsec dekker prevents the superposition of each beam split by the Savart plate with the light coming from the other parts of the observed field of view. The use of a dichroic beam splitter with cut-off centred at 5300 Å allows us to observe simultaneously in the blue arm with grating R600B (which we have set at a central wavelength = 4400 Å so as to cover the spectral range of 3700–5300 Å), and in the red arm with grating R1200R (central wavelength = 6500 Å, to cover the spectral range 6100–6900 Å). Our observations were obtained with slit width of 1.0, 1.2, and 2.0 arcsec for a spectral resolving power R of 2500, 2050, and 1280 in the blue arm, and 8950, 7100, and 4500 in the red arm, respectively. Spectral features of Grw+70° 8247 are broad enough that observations obtained at the lowest resolution with the 2 arcsec slit width did not appear more smeared than those obtained at the highest resolution with a 1 arcsec slit width.
For Grw+70° 8247, we have obtained three observations of circular polarization, two in 2015 August and one in 2018 November, and two observations of linear polarization, one in 2015 August and one in 2018. During the 2018 November run (night 21–22), we obtained an additional set of observations both in circular and linear polarization, but the selection of a wrong combination of decker and window readout did not allow us to record the background. Therefore, both data sets obtained on the night of November 21 were discarded.
For our measurements, we adopted the use of the beam swapping technique (e.g. Bagnulo et al. 2009) which minimizes the impact of instrumental polarization. ISIS circular polarization measurements were obtained using a series of four exposures with the λ/4 retarder waveplate set at position angles −45°, +45°, +45°, and −45°, while our linear polarization measurements were obtained with a series of eight exposures with the λ/2 waveplate set at position angles 0°, 22.5°, 45°, 67.5°, 90°, 112.5°, 135°, and 157.5°.
The redundancy of our observing strategy allows us to measure also the so called null profiles NX, which give us an experimental estimate of the uncertainties (Donati et al. 1997; Bagnulo et al. 2009).
The dates and times of the new observations, along with other data to be explained later, are listed in Table 4.
4 DATA REDUCTION
Reduction of circular polarization data is fully explained in Bagnulo & Landstreet (2018) and references therein. Most of the steps used to reduce linear spectropolarimetric data are similar to the procedure for reducing circular polarization data, but additional steps have to be taken to correct linear polarization measurements for the chromatism of the retarder waveplate. Also, because sky background may be linearly polarized, its subtraction is particularly crucial. These steps will be described in Sections 4.1 and 4.2 below.
4.1 Correction for the chromatism of the retarder waveplate
4.2 Background subtraction
Our observations of Grw+70° 8247 were obtained close to Full Moon. For a V = 13.5 target, the background level is relatively small, but because it is highly polarized, it may introduce spurious effects if not correctly subtracted (especially in the case of linear polarization measurements). In both our linear polarization measurements of Grw+70° 8247, the background level was about 10 per cent of the source level, both in the blue and in the red spectral range. During the 2015 observations, the background polarization was ∼36 per cent in the blue and ∼22 per cent in the red. In the 2018 observations, the background polarization was about 51 per cent in the blue and 28 per cent in the red (see Section 5.5.4).
In ISIS, the background sky may be measured in four 5 arcsec strips (two per beam) parallel to the strips illuminated by the target, each separated by 18 arcsec from the central beam which is centred on the target (see the bottom panels of fig. 1 of Bagnulo & Landstreet 2018).
We have experimented with different algorithms for background subtraction among those that are offered by the iraf procedure apall, finding that our final results for the polarization of Grw+70° 8247 were always consistent with each other within photon-noise error bars. We have also carried out a more critical experiment as follows: instead of extracting the background from both full side strips, we used only a small window of one of the strips (of course still considering both beams split by the Savart plate). The results of this experiment were fully consistent (within error bars) with those obtained by estimating the background flux using both full strips. We are therefore satisfied that the presence of a non-negligible polarized backgrounds does not affect our data, e.g. by introducing a systematic effect, apart from reducing their S/N.
In contrast, our linear polarization measurements obtained during the rejected night 2018 September 21 could not be background subtracted, and the measured values were totally inconsistent with those obtained on the next night, when background subtraction could be correctly performed.
For circular polarization, sky subtraction is a less critical step because the sky is not circular polarized. The effect of not subtracting the backround would be a dilution of the polarization signal by a factor roughly equal to the ratio between the sky and the star flux.
4.3 From spectropolarimetry to broad-band polarimetry
5 QUALITY CHECKS
In the following, we investigate the instrument accuracy and stability. We examine various potential issues that may affect the accuracy of our measurements: cross-talk from I to V (Section 5.1), from I to Q and U (Section 5.2), and from Q and U to V (Section 5.3). We present observations of magnetic stars and standard stars for linear polarization that we have performed to check the correct alignment of the polarimetric optics (Section 5.4 for circular polarization measurements and Section 5.5 for linear polarization measurements). In Section 5.6, we discuss whether the use of a dichroic introduces a signal of spurious polarization, as warned by the ISIS user manual. In Section 5.7, we discuss the polarimetric efficiency at shorter wavelengths. All results are then summarized in Section 5.8.
5.1 Estimate of instrumental circular polarization in the continuum
The large majority of nearby WDs have a spectrum that is intrinsically unpolarized. Our extensive surveys of WDs (see Bagnulo & Landstreet 2018) offer abundant material to determine whether the instruments that we have used introduce a spurious signal of circular polarization. For ISIS, we have found that the signal of circular polarization in the continuum is generally |$\lesssim 0.03$| per cent in the blue arm and |$\lesssim 0.05$| per cent in the red arm.
5.2 Observations of unpolarized stars in linear polarization
During the course of various observing runs with ISIS in spectropolarimetric mode we have obtained a number of measurements in linear spectropolarimetric mode of unpolarized stars listed in Table 1 (in our list we have included the solar analogue HD 28099 that being within 50 pc was deemed as probably non-significantly polarized, although was never adopted as unpolarized standard star before). Some observations have been obtained independently both in the red and blue arms (one after the other), and some have been obtained simultaneously in both arms with the use of a dichroic beam splitter. We note that using the highly sensitive PlanetPol instrument, Hough et al. (2006) estimated that the spurious polarization introduced by the telescope optical surfaces of the WHT is of the order of |$1.5\,\times \, 10^{-5}$|. Assuming that this was still true during our observing run, any measured signal of spurious polarization would come from the ISIS instrument.
Observations of zero-polarized stars.
| DATE | UT | EXP | PA | PQ (per cent) | PU (per cent) | PQ (per cent) | PU (per cent) | |||
|---|---|---|---|---|---|---|---|---|---|---|
| STAR | yyyy-mm-dd | hh:mm | (s) | (°) | Setting | B | R | Ref. | ||
| HD 144287 | 2014-03-07 | 05:00 | 100 | 285 | R600R | – | 0.01 ± 0.01 | 0.00 ± 0.00 | 1 | |
| 2014-03-07 | 05:05 | 100 | 285 | R600B | 0.00 ± 0.02 | −0.01 ± 0.02 | – | |||
| 2014-03-07 | 05:09 | 100 | 285 | R600B+R600R | −0.02 ± 0.03 | 0.02 ± 0.03 | −0.02 ± 0.00 | 0.00 ± 0.00 | ||
| 2014-03-07 | 05:28 | 120 | 195 | R600R | – | −0.00 ± 0.00 | −0.01 ± 0.00 | |||
| 2014-03-07 | 05:33 | 120 | 195 | R600B | −0.03 ± 0.00 | −0.02 ± 0.00 | – | |||
| 2014-03-07 | 05:38 | 120 | 195 | R600B+R600R | −0.03 ± 0.02 | −0.01 ± 0.02 | −0.01 ± 0.02 | −0.01 ± 0.02 | ||
| HD 98161 | 2015-01-06 | 05:33 | 240 | 4 | R300B | 0.02 ± 0.09 | −0.08 ± 0.09 | – | 2 | |
| 2015-01-06 | 05:50 | 120 | 4 | R158R | – | 0.02 ± 0.01 | 0.00 ± 0.01 | |||
| HD 125184 | 2015-01-06 | 06:21 | 40 | 321 | R158R | – | 0.01 ± 0.02 | −0.01 ± 0.01 | 1 | |
| 2015-01-06 | 06:24 | 40 | 321 | R300B | −0.05 ± 0.01 | 0.02 ± 0.01 | – | |||
| HD 28099 | 2018-09-24 | 06:16 | 35 | 240 | R600B+1200R | −0.03 ± 0.00 | −0.02 ± 0.00 | −0.01 ± 0.00 | −0.04 ± 0.00 | 3 |
Our measurements are summarized in Table 1 and Fig. 1, and show clearly that instrumental polarization seems consistently well within 0.1 per cent in both Stokes parameters Q and U, with the exception of one observations of HD 98161. Star HD 144287 was observed twice with the instrument position angle rotated by 90°. Instrumental polarization measured via equation (5) was found |$\lesssim 0.05$| per cent at all wavelengths.
Star HD 144287 was observed first with the dichroic, then independently without dichroic in the two arms. A comparison between the results shown no evidence that the use of dichroic leads to a spurious signal of linear polarization in stars that are intrinsically unpolarized. We will come back to this point in Section 5.6.
5.3 Cross-talk from linear to circular polarization
The optics that precede the retarder waveplate may transform linear into circular polarization or vice versa. Observations of circular polarization of a source that is strongly linearly polarized may be affected by cross-talk from linear to circular polarization and may give a non null measurement even if the source is not intrinsically circularly polarized. This is a well-known instrumental effect present for instance in the FORS instrument of the ESO VLT, in which it is believed that the instrument collimator (located above the polarimetric optics) transforms a few per cent of the linear polarization into circular polarization (see section 7.4 of Bagnulo et al. 2009). To check whether ISIS at the WHT (which has no dichroic optics above the wave plates) suffers from this problem, we have observed HD 25443, a standard star for linear polarization, in linear and in circular polarization, both in the red and the blue arms simultanesouly, with the dichroic. We measured ∼5 per cent of linear polarization (consistently with previous literature), 0.02 per cent of circular polarization in the blue and less than 0.05 per cent in the red. Hence cross-talk from linear to circular polarization is smaller than 1 per cent. Because the typical linear polarization of strongly MWDs is only a few per cent, this cross-talk is an unimportant contributor to the error budget of V/I measurements.
5.4 Alignment of the optics for circular polarization: observations of magnetic stars
The correct alignment of the polarimetric optics used to measure circular polarization was checked by measuring stars with known magnetic fields. For the ISIS observations obtained in our 2015 run, this check is described by Bagnulo & Landstreet (2018). In our 2018 September run (on 2018 September 21 at 20:11 UT), we observed the magnetic Ap star γ Equ (= HD 201610) and measured a mean longitudinal field of −970 ± 30 G in the blue arm and −974 ± 26 G in the red arm. These values are perfectly internally consistent, and are consistent with what is expected for that long period (|$P \gtrsim 100$| y) magnetic variable (see section 5.1.3 and table A.1 of Bagnulo & Landstreet 2018).
5.5 Alignment of the optics for linear polarization
Since we aim to detect subtle variations of the polarimetric properties of the target star, we need to pay special attention the correct alignment of the polarimetric optics. This was checked with the help of measurements of standard stars for linear polarization (Section 5.5.1), of the Moon (Section 5.5.2), of the twilight sky (Section 5.5.3) and of the background sky during our science observations (Section 5.5.4).
5.5.1 Observations of standard stars for linear polarization
The most obvious check to do is to observe standard stars for linear polarization and compare the results with literature data. In order to assess the overal instrument stability we have considered ISIS data obtained in a period of time more extended than the epochs of the science observations presented in this paper. Since literature data report measurements in broad-band filters, we have used equation (3) to integrate the spectra obtained in the blue arm with the B filter response curve, and the spectra in the red arm with the R filter response curve. In Table 2, we report all our observations of standard stars, even those that we suspect are affected by spurious signals. Our objective is not to establish a list of standard stars but to characterize the instrument and in particular check its stability. Results that are slightly off from expectations are still useful to help to evaluate what can go wrong during spectopolarimetric observations.
Observations of standard stars for linear polarization. Position angle is measured counterclockwise looking at the source from the great circle passing through the star and the North Celestial Pole. For comparison, literature data are reported in boldface fonts. Uncertainties are due to photon noise, and do not take into account systematics. Observations marked with asterisks are likely to be affected by the contamination of a strong background for the reasons explained in the notes.
| DATE | UT | EXP | PL (per cent) | Θ (°) | ΔΘ (°) | PL (per cent) | Θ (°) | ΔΘ (°) | ||
|---|---|---|---|---|---|---|---|---|---|---|
| STAR | yyyy-mm-dd | hh:mm | (s) | Setting | B | R | ||||
| HD 161056 | Schmidt et al. (1992) | 3.80 ± 0.60 | 66.6 ± 0.4 | 4.01 ± 0.03 | 67.3 ± 0.2 | |||||
| 2014-03-06 | 06:00 | 160 | R600R | 3.99 ± 0.01 | 68.0 ± 0.1 | +0.7 | ||||
| 2014-03-06 | 06:06 | 80 | R600B | 3.65 ± 0.01 | 68.0 ± 0.1 | +1.4 | ||||
| 2014-03-06 | 06:10 | 80 | R600B+R600R | 3.65 ± 0.03 | 67.9 ± 0.3 | +1.2 | 4.00 ± 0.01 | 68.1 ± 0.1 | +0.8 | |
| HD 204827 | Schmidt et al. (1992) | 5.65 ± 0.02 | 58.2 ± 0.1 | 4.89 ± 0.03 | 59.1 ± 0.2 | |||||
| 2015-01-05 | 19:24 | 80 | R158R | 4.93 ± 0.02 | 59.7 ± 0.1 | +0.6 | ||||
| 2015-01-05 | 19:32 | 240 | R300B | 5.73 ± 0.00 | 58.6 ± 0.1 | +0.4 | ||||
| HD 154445 | Schmidt et al. (1992) | 3.45 ± 0.05 | 88.9 ± 0.4 | 3.68 ± 0.07 | 88.9 ± 0.6 | |||||
| 2015-02-04 | 06:35 | 160 | 600B | 3.44 ± 0.04 | 89.5 ± 0.3 | +0.6 | ||||
| HD 160529 | Hsu & Breger (1982) | 6.97 ± 0.03 | 20.1 ± 0.1 | 7.04 ± 0.01 | 20.8 ± 0.1 | |||||
| 2015-08-30 | 20:28 | 80 | R1200R | 6.97 ± 0.00 | 19.7 ± 0.0 | −1.1 | ||||
| 2015-08-30 | 20:35 | 240 | R600B | 6.97 ± 0.02 | 19.1 ± 0.1 | −1.0 | ||||
| 2015-08-30 | 20:42 | 120 | R600B+R1200R | 6.94 ± 0.00 | 19.2 ± 0.0 | −0.9 | 6.93 ± 0.00 | 19.7 ± 0.0 | −1.1 | |
| 2015-08-30 | 20:48 | 240 | R1200R | 6.97 ± 0.00 | 19.4 ± 0.1 | −1.4 | ||||
| HD 25443 | Schmidt et al. (1992) | 5.23 ± 0.09 | 134.3 ± 0.5 | 4.73 ± 0.05 | 133.7 ± 0.3 | |||||
| 2014-03-11 | 20:31 | 480 | 300B | 5.12 ± 0.02 | 135.9 ± 0.1 | +1.6 | ||||
| 2014-03-11 | 21:03 | 80 | 158R | 4.80 ± 0.01 | 135.3 ± 0.0 | +1.6 | ||||
| 2015-01-06 | 00:17 | 80 | R158R | 4.76 ± 0.04 | 135.4 ± 0.2 | +1.7 | ||||
| 2015-01-06 | 00:24 | 320 | R300B | 5.11 ± 0.02 | 135.7 ± 1.4 | |||||
| (*) | 2015-08-31 | 06:28 | 120 | R1200R | 4.91 ± 0.00 | 136.6 ± 0.0 | +2.9 | |||
| (*) | 2015-08-31 | 06:34 | 120 | R600B | 5.16 ± 0.02 | 136.0 ± 0.1 | +1.7 | |||
| (*) | 2015-08-31 | 06:38 | 100 | R600B+1200R | 5.03 ± 0.00 | 135.1 ± 0.0 | +0.8 | 5.11 ± 0.00 | 135.5 ± 0.0 | +1.8 |
| (**) | 2018-09-22 | 03:57 | 480 | R600B+1200R | 5.11 ± 0.01 | 138.1 ± 0.1 | +3.8 | 4.87 ± 0.02 | 137.9 ± 0.1 | +3.2 |
| HD 19820 | Schmidt et al. (1992) | 4.70 ± 0.04 | 115.7 ± 0.2 | 4.53 ± 0.03 | 114.5 ± 0.2 | |||||
| (**) | 2018-09-22 | 03:42 | 480 | R600B+R1200R | 4.59 ± 0.02 | 118.4 ± 0.1 | +2.7 | 4.55 ± 0.02 | 117.0 ± 0.1 | +2.5 |
| BD+59 389 | Schmidt et al. (1992) | 6.35 ± 0.04 | 98.1 ± 0.2 | 6.43 ± 0.02 | 98.1 ± 0.1 | |||||
| (**) | 2018-09-22 | 03:25 | 720 | R600B+R1200R | 6.20 ± 0.03 | 102.0 ± 0.2 | +3.9 | 6.48 ± 0.02 | 101.1 ± 0.1 | +2.0 |
Notes: (*) Observations were obtained close to sunrise; sky background was high and rapidly increasing from one exposure to the next.
(**) Observations were taken with a wrong combination of dekker and window readout, therefore sky background could not be measured and subtracted.
Calibrations of the polarization position angle in the blue arm.
| Date UT | Θ (°) | ΔΘ (°) | ||
|---|---|---|---|---|
| OBJECT | yyyy-mm-dd hh:mm | Expected | Observed | |
| MOON | 2015-02-01 20:16 | 175.8 | 175.7 ± 1.1 | −0.1 |
| 2015-09-01 06:06 | 159.0 | 159.0 ± 0.4 | 0.0 | |
| 2018-09-22 19:38 | 151.8 | 151.7 ± 0.2 | −0.1 | |
| TWILIGHT | 2018-09-22 19:38 | 3.8 | 5.1 ± 0.0 | +1.3 |
| 2018-09-23 19:09 | 0.6 | 179.7 ± 0.1 | −0.9 | |
| BACKGROUND | 2015-09-01 00:17 | 3.9 | 1.7 ± 0.3 | −2.2 |
| 2015-09-22 21:01 | 39.2 | 39.6 ± 0.3 | +0.4 | |
It appears that, apart from the cases flagged in the table footnotes, the position angle of the polarization of standard stars is always within 1° of the literature data, and polarization values differed at most by 0.1 per cent. In the context of this investigation, these discrepancies are not significant, our conclusion is that ISIS observations of standard stars for linear polarization confirm that the instrumental systematics are at most 0.1–0.2 per cent and 1°–2°. When not dominated by photon noise, uncertainties should be generally of that order of magnitude.
5.5.2 The position angle of the polarization of the Moon
The Moon was observed at the beginning of each night of our observations. On 2015 September 01 and 2018 November 22, the Moon phase angle (the angle between the Sun, the Moon, and the observer, not to be confused with the angle Φ which identifies the position of the scattering plane) was 25° and 20°, respectively. At these phase angles, the (small) lunar polarization is expected to be perpendicular to the scattering plane, and our measurements were found within 1–2° of the expected value Φ + 90° (see Table 3).
5.5.3 Position angle of the polarization of the twilight sky
Assuming a single scattering mechanism, the light scattered by the sky should be polarized in the direction perpendicular to the scattering plane. We verified that the position angle of the polarization of the twilight sky was consistent with the value of Φ + 90°, where Φ is again obtained from equation (6), in which (αo, δo) are the coordinates of the Sun and (αTel, δTel) are the coordinates of the point on the sky pointed by the telescope.
5.5.4 Position angle of the polarization of the background sky
The polarization of the background sky of science observations may be accurately measured if exposures are sufficiently long and/or background intensity is sufficiently high, for instance because of the presence of the Moon. One can compare the direction of the polarization of the background sky and verify that it is perpendicular to the scattering plane (if Moon light is nearly unpolarised, as in our case). During our science exposures, the background was illuminated (and highly polarized) because of the presence of a nearly full Moon (see Section 4.2). We found that the direction of the background sky was oriented within a few degree of the value Φ + 90° as obtained from equation (6), where (αo, δo) are the coordinates of the Moon and (αTel, δTel) the coordinates of Grw+70° 8247.
5.6 Does the dichroic produce a spurious polarization signal?
The ISIS spectrograph has two different camera arms, one optimized for the red and one for the blue. The insertion of a dichroic beam splitter allows one to observe simultaneously with both arms. This is a very valuable instrument feature that doubles the diagnostic capabilities compared to a situation in which the two arms are fed individually in separate exposures. The instrument web pages suggests that light scattered by the back of the dichroic may compromise polarimetric measurements, and that therefore observations in spectropolarimetric mode should not be carried out in both arms simultaneously. In section 4.2.2 of Bagnulo & Landstreet (2018), we found that magnetic field measurements obtained with the dichroic inserted in the optical path do not differ significantly from those obtained when the blue and red arms are fed separately. Table 2 shows that our observations of linear polarization obtained with the dichroic are consistent with literature data, suggesting that spurious effects introduced by the dichroic, if present at all, are probably not very significant. Moreover, in 2015, the standard star for linear polarization HD 160529 was observed with the dichroic in the blue and red arms, and also (quasi-simultaneously) in the blue and red arms individually (see Fig. 2 and Table 2). A similar observation was carried out on 2014 March 06 on the standard star HD 160556 and on the unpolarized star HD 144287 (see Table 1). The results of these two experiments do not point to spurious effects introduced by the dichroic. Therefore, even if the possibility that scattered light may affects polarimetric measurements should not be forgotten, we proceed assuming that the measurements obtained with the dichroic are not affected by significant spurious effects.
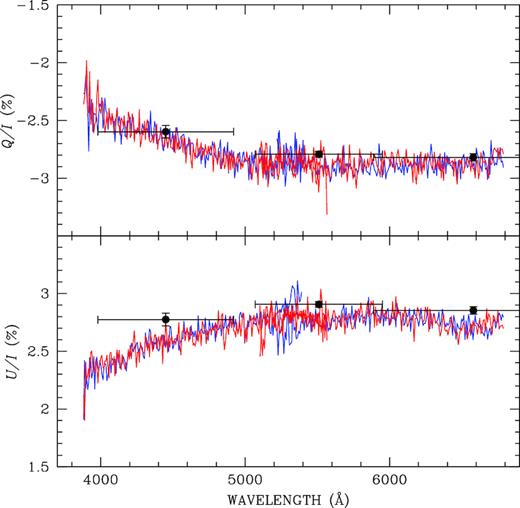
Polarization spectra of star HD 161056 obtained on 2014 March 06 using the dichroic (blue lines) and observing in the two arms separately, without the dichoric (red lines). Solid circles represent the broad-band linear polarization values from Schmidt, Elston & Lupie (1992, horizontal error bars corresponds to the filter FWHM).
5.7 Polarimetric behaviour at shorter wavelenghts
In Section 8, we will see that at |$\lambda \lesssim 4000$| Å, the ISIS circular polarization spectrum of Grw+70° 8247 shows remarkable differences compared to previous data obtained in the 1970s. To explore whether the observed changes are due to an instrumental effect (for instance, a dramatic change of the retardation or the position angle of the fast axis of ISIS retarder waveplate), we have inspected the polarization spectrum of the strongly magnetic Ap star HD 215441 that we obtained in 2015 (Bagnulo & Landstreet 2018) with the same setting as Grw+70° 8247 (see Fig. 3). Visual inspection shows that the higher order Balmer lines appear polarized in a similar way as Hγ and Hβ (taking into account the fact that Zeeman effect varies as λ2). In a more quantitative way, the longitudinal magnetic field calculated from each individual Balmer line via equation (1) gives the same result (within error bars). We conclude that, in the observed spectral range, the chromatism of the quarter retarder waveplate is not reponsible for obvious artefacts.
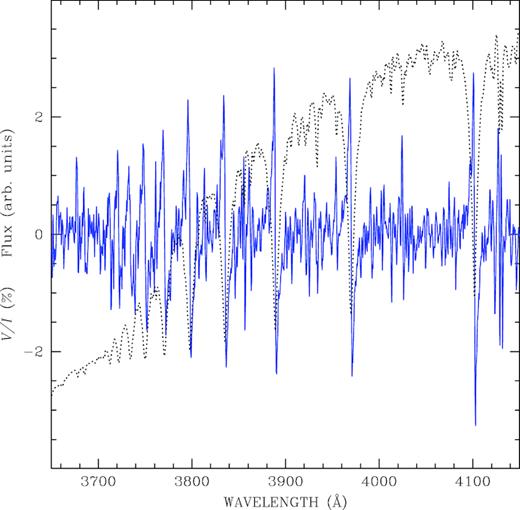
The polarized spectrum of the magnetic Ap star HD 215441 shows that the optical properties of ISIS are stable at shorter wavelenghts.
5.8 Summary
To summarize the results of this section:
We find negligible zero-point polarization present in observations of both circular and linear polarization made with ISIS in spectropolarimeteric mode.
We find negligible crosstalk between Stokes components Q, U, and V in ISIS data.
Both the scale and position angle deduced from ISIS linear spectropolarimetry are extremely accurate.
Our methods for correcting for polarized night sky contaminating spectra of faint objects are robust and reliable.
We did not find any evidence that the use of a dichroic beam splitter with cut-off at 5300 Å produces a signal of spurious polarization.
We did not find evidence for artefacts due to the chromatism of the quarter waveplate.
6 OBSERVATIONS OF GRW+70° 8247
In the late 1960s James Kemp, an experimental physicist at the University of Oregon, realized that thermal emission from an incandescent body in a very strong magnetic field should display broad-band (spectrally diffuse) circular polarization, at a level of the order of 10−2 per cent for a field of 105 G (Kemp 1970). He showed experimentally that this idea is qualitatively correct (Kemp, Swedlund & Evans 1970a). When he heard from George Preston of the Hale Observatories that efforts were being made to detect large fields in WD stars (Preston 1970; Angel & Landstreet 1970a), he adapted his laboratory polarimeter for astronomical observations and started a search for circular polarization due to magnetic fields in bright WDs on the 24-inch telescope of the University of Oregon’s Pine Mountain Observatory.
At the suggestion of one of us (JDL), Kemp observed Grw+70° 8247 and promptly detected strong circular polarization. Following a telephone call from Kemp, three confirming measurements were obtained by Angel and Landstreet at Kitt Peak National Observatory, using the photoelectric polarimeter described by Angel & Landstreet (1970a). These measurements showed circular polarization increasing with wavelength from about 1.5 per cent at 380 nm to 3.3 per cent at 620 nm. These observations represented the first discovery of a magnetic field in a WD (Kemp et al. 1970b).
This result triggered a number of further surveys for magnetic fields in WDs, which up to the present have led to the identification of several hundred MWDs (Ferrario et al. 2015). Grw+70° 8247 still has one of the strongest WD magnetic fields known. It is often considered to be a star with a constant signal of circular polarization. However, it has not been monitored nearly as frequently as one could have imagined. In the following, we will review the polarimetric measurements that are found in the literature (Sections 6.1 and 6.2), before presenting our new data (Section 6.3) and comparing them with earlier data sets (Section 8).
6.1 Observations of circular polarization in the literature
In this and in the following sections, we will report the sign of circular polarization using our definition of Section 2. Therefore, some numerical values may appear with the opposite sign with respect to that found in the original papers.
After the discovery by Kemp et al. (1970b), Angel & Landstreet (1970b) reported a number of measurements of circular polarization of Grw+70° 8247 obtained between 1970 June 20 and July 7, made using the photolectric polarimeter descibed by Angel & Landstreet (1970a). No on-sky calibration sources were known for circular polarimetry, and the instrument performance was tested using circular polarizers. Observations were obtained without any filter, covering the spectral range 400–700 nm (see table 1 and fig. 1 of Angel & Landstreet 1970b). The circular polarization was found to be constant with time over an interval of days.
Circular polarization was also measured in eight different wavelength windows from 310 to 800 nm, using filters with estimated full width at half-maximum (FWHM) between 30 and 120 nm (see table 2 and fig. 2 of Angel & Landstreet 1970b). These data provided a very low resolution (R ∼ 10) spectrum of the wavelength dependence of the circular polarization of Grw+70° 8247. The peak circular polarization was about 3.7 per cent, around 415 nm.
Kemp & Swedlund (1970) measured circular polarization in the infrared, but we will not follow-up further on this spectral region.
Angel et al. (1972) reported further polarimetric monitoring of the star, which was observed again during four observing runs in late 1970 and early 1971 in circular polarization, using a variety of filters. These measurements are compared with the earlier filter polarization data. They appear to rule out substantial changes on a time scale of months shortward of 600 nm. Angel et al. (1972) noted a possibly real variation of circular polarization at λ = 740 nm, where circular polarization decreased from about 2.4 per cent in 1970 to about 1.0 per cent in 1972, but this could have been due to the different red sensitivity of two different photomultipliers, one with S-20 red response and one with GaAs photocathodes, used in the polarimeter during this period.
The spectrum of circular polarization was measured in 1971 June with higher spectral resolution (resolution 80 Å below about 5500 Å, and 160 Å above, or resolving power R ∼ 40–50), using the multichannel spectrophotometer (MCSP) on the 200-inch Hale telescope on Mount Palomar, which was converted into a spectropolarimeter with the addition of a Pockels cell waveplate followed by a polarizer in front of the entrance aperture (Angel et al. 1972). Globally this polarization spectrum is in agreement with the very low-resolution spectrum found with filters, but it has high enough R to begin to reveal spectral features in Stokes V/I associated with weak absorption features in the Stokes I.
Landstreet & Angel (1975) reported further observations using the MCSP as a spectropolarimeter. The circular polarization spectrum observed in 1972 August was compared to a new, very similar V/I spectrum from 1973 June. Both were taken with spectral resolution of 80 Å in the blue and 160 Å in the red. No strongly significant differences among the three MCSP V/I spectra were detected, suggesting that any changes occur on a time of a decade or more.
One more circular polarization spectrum was taken in 1976 in the spectral window 4–7000 Å. This spectrum, which has strongly variable resolution decreasing towards the red, was obtained using a prism spectropolarimeter with a Digicon detector on the Steward Observatory 2.3-m telescope (Angel et al. 1985). This spectrum was digitized from the published graph for this paper.2 Apart from a few differences due to the different resolving power of the Palomar and Steward spectra, all the circular polarization spectra from the 1970s appear essentially identical. When the large differences in resolving power are taken into account, the polarized spectra are also in general agreement with the results of filter polarimetry. Overall, the available data show no convincing evidence for variability over the period of about six years during the 1970s when the star was actively observed.
Putney (1995) published a circularly polarized spectrum of Grw+70° 8247 (see her fig. 3), with a 11.1 Å spectral resolution, in the spectral range 3900–8900 Å. The spectrum was presented as ‘unpublished data’ from Keck, and used for comparison with the spectra of other MWDs. We assume that were obtained around the time of other similar spectra presented in the paper, i.e. late 1994 or early 1995. Also this spectrum was digitized by us for its use in this paper.
WHT archive data revealed that the star was observed a number of times with the ISIS instrument, both in spectroscopic and spectropolarimetric modes. In this paper, we consider circular spectropolarimetric observations obtained in 2004 August 05 at UT 21:28, obtained for a total 480 s exposure time with grating R600B in the wavelength range 4000–5200 Å and a 1.12 arcsec slit width. Setting is very similar to what we have used in the blue arm, except that, compared to our data, the archive spectrum is offset by about 450 Å to the red. A lower S/N ratio spectrum was obtained the next night and appears consistent with the one obtained on August 5, within photon-noise error bars.
Grw+70° 8247 has been used as a standard star for circular BBP by Butters et al. (2009), who report measurements in the UBVRI filters consistent with previous literature (see their table 5), e.g. 3.6, 4.0, and 4.1 per cent in the B, V, and R filters, respectively. We have found in the literature no other published monitoring of circular BBP of this star.
6.2 Observations of linear polarization in the literature
In addition to a series of circular polarization measurements (Section 6.1), Angel & Landstreet (1970b) discovered strong linear polarization, and measured the relevant Stokes parameters using four different filters in the spectral range between 310 and 700 nm. They detected a peak polarization around 380 nm of 3.7 per cent (but no linear polarization at |$\lambda \gtrsim 500$| nm), with a position angle in the blue between 16° and 24°. Angel et al. (1972) reported similar values measured in 1970 September and 1971 July.
A single MCSP linear polarization spectrum, observed with resolutions 160 and 360 Å (in blue and red respectively) in 1972 August, in the range 329–1092 nm, was reported by Landstreet & Angel (1975); they also reported a private communication from Gehrels suggesting detection of a rotation of the position angle at 560 nm.
Another MCSP linear polarization spectrum, very similar to the one reported by Landstreet & Angel (1975) was obtained on 1975 April 28 by Angel and Landstreet (unpublished). Over most of the spectral window studied, these two Palomar linear polarization spectra are very similar but perhaps not quite identical.
A single linear polarization spectrum, very similar to the circular polarization spectrum from the Steward Observatory team described in the previous section, was obtained in 1976 by Angel et al. (1985). This spectrum (digitsed as for the circular polarization spectrum from the same paper) shows somewhat more significant changes relative to the two Palomar linear polarization spectra. Some of these differences are certainly due to the markedly higher resolving power of the Steward spectrum relative to the Palomar spectra in the blue, but other differences, between 5500 and 6500 Å, may possibly be real. Overall, however, these data, together with the BBP observations, do not provide convincing evidence of variability of the linear polarization during the 1970s.
West (1989) obtained a single BBP measurement during 1986 in the B filter: 3.19 per cent with Θ = 19°.76.
Friedrich & Jordan (2001) searched for variability due to rapid rotation of linear polarization using a trailing technique at the 2.2 m telescope of Calar Alto in the Johnson B filter. They confirmed that the linear polarization of the star is not variable on a time-scale of minutes.
6.3 New intensity and polarization spectra
Our new data consist of intermediate resolution flux and polarized spectra obtained in 2015 and 2017.
Fig. 4 presents both archival and new polarization spectra of Grw+70° 8247. Table 4 gives the observing log and reports the broad-band values of our new polarization spectra calculated via equation (3).
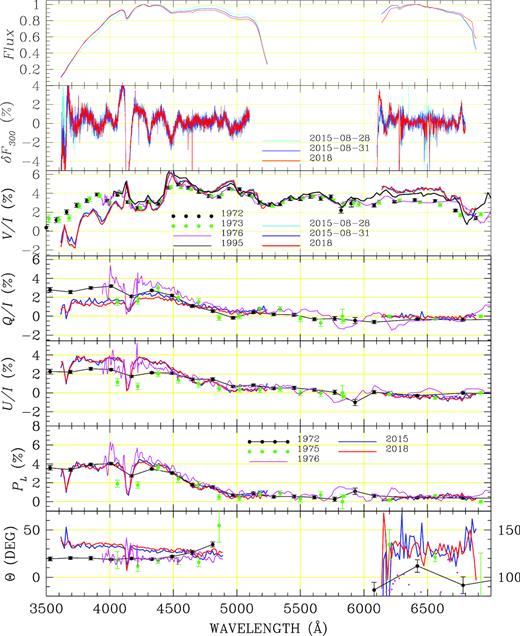
Polarization spectra of Grw+70° 8247 obtained at various epochs. For display purposes, the position angle data Θ in the red (|$\lambda \gtrsim 6000$| Å, see y-axis on the right) are reported with a 100° offset with respect to the data in the blue (|$\lambda \lesssim 5000$| Å, see y-axis on the left). Keys to the symbol are given in the second panel from the top (for flux measurements) in the third panel from the top (for V/I measurements) and in the sixth panel from the top (for Q/I, U/I, PL, Θ measurements). References are given in the text.
Log of our new observations of Grw+70° 8247. We show also the BBP values obtained using the transmission curves of the old FORS B Bessel filter (columns 3–7) and of the FORS Red Bessel filter (columns 8–12). As in Table 2, uncertainties reflect photon noise. Systematics errors are probably of the order of 0.1–0.2 per cent at most for PV, PQ, PU, and PL, and 1–2° for the position angle Θ. The large uncertainties of Θ in the red are due to the fact that linear polarization is very small, hence its position angle not well determined. For the reasons explained in the text, these values are only internally self-consistent, and should not be compared to BBP measurements obtained with other instrument/telescopes.
| B | R | ||||||||||
|---|---|---|---|---|---|---|---|---|---|---|---|
| Date UT | EXP | PV | PQ | PU | PL | Θ | PV | PQ | PU | PL | Θ |
| (s) | (per cent) | (per cent) | (per cent) | (per cent) | (°) | (per cent) | (per cent) | (per cent) | (per cent) | (°) | |
| 2015-08-28 22:10 | 1920 | 3.39 ± 0.01 | 3.99 ± 0.00 | ||||||||
| 2015-08-31 23 :25 | 2400 | 3.37 ± 0.02 | 3.99 ± 0.01 | ||||||||
| 2015-09-01 00:17 | 2400 | 1.67 ± 0.08 | 2.70 ± 0.08 | 3.17 ± 0.08 | 29.1 ± 0.7 | −0.04 ± 0.08 | −0.33 ± 0.08 | 0.34 ± 0.08 | 131.3 ± 6.6 | ||
| 2018-09-22 21:51 | 1800 | 3.22 ± 0.01 | 4.00 ± 0.04 | ||||||||
| 2018-09-22 21:01 | 3600 | 1.40 ± 0.04 | 2.74 ± 0.04 | 3.08 ± 0.04 | 31.5 ± 0.4 | −0.10 ± 0.14 | −0.43 ± 0.14 | 0.44 ± 0.14 | 128.6 ± 9.0 | ||
From top to bottom, the various panels of Fig. 4 show (1) the measured (unpolarized) flux |$\mathcal {F}$|, not corrected for the instrument transmission function; (2) the difference |$\delta \mathcal {F}_{\rm 300}$| defined by equation (7) (limited to our new WHT data only); (3) the reduced Stokes parameter V/I; (4) the reduced Stokes parameter Q/I; (5) the reduced Stokes parameter U/I; (6) the fractional linear polarization PL; and (7) the polarization position angle Θ. Literature data shown in Fig. 4 are those obtained at Mount Palomar in 1972 (circular and linear), 1973 (circular only), and 1975 (linear only), as well as the Steward spectra (linear and circular) from 1976.
The interpretation of the spectrum of Grw+70° 8247 remained a mystery for more than a decade after the discovery of its magnetic field. The main spectral line features were identified when calculations of the wavelengths of line components of the spectrum of hydrogen in fields of hundreds of MG were successfully made by Roesner et al. (1984). Using these data, Angel et al. (1985) were able to account qualitatively for all the principal absorption features in the optical spectrum as being due to H in a magnetic field ranging in strength between about 160 and 320 MG. This interpretation of the observed spectra was confirmed by comparison of the observed Stokes I spectrum with spectrum synthesis calculations of Jordan (1992), who however showed that the atomic data were not yet sufficient to make possible modelling of the polarization spectra.
In the blue ISIS spectrum, the well-known Minkowski band at 4135 Å (Greenstein & Matthews 1957) stands out spectacularly both in |$\delta \mathcal {F}_{\rm N}$| and in Stokes Q/I, U/I, and V/I. Other Minkowski bands at 3650 and 4466 Å are also visible. Additional, somewhat weaker but apparently real absorption features confirmed by corresponding polarization features are found at about 4300 and 4480 Å, and possibly at 4950 Å. Corresponding absorption lines are seen in some of the model Stokes I spectra computed by Jordan (1992); because these are quite weak features in the raw Stokes I spectrum, it is not clear if most of them are present in the observed I spectrum of Angel et al. (1985). A very weak feature in the Stokes I spectrum at 6650 Å also correponds to weak but quite clear feature in the |$\delta \mathcal {F}_{\rm N}$|, V/I, and Q/I spectra. This feature may correspond to the 3s’0–2p+1 component of Hα, which is stationary at about 6643 Å at a field strength of about 140 MG and appears in the syntheses of Jordan (1992).
7 BROAD-BAND POLARIMETRY MEASUREMENTS MAY NOT BE SUITABLE TO DETECT REAL VARIABILITY
Since this work is primarily devoted to the search for subtle variablity of Grw+70° 8247, we make a preliminary comment about BBP measurements.
In the blue spectral region, the polarization of Grw+70° 8247 changes rapidly with wavelength. Therefore, BBP measurements obtained with slightly different instruments settings may differ one from each other, even if the polarization intrinsic to the star is constant. This can be easily seen via numerical simulations through equation (3), using the observed spectra but different filter transmission curves. As an example, Table 5 shows the integrated polarization calculated using equation (3) and the transmission functions of three different broad-band B filters: an old B Bessel filter used with the FORS instrument of the ESO VLT, the currently used FORS b_high filter, and the B Bessel filter used with the ACAM instrument of the WHT (filter transmission curves may be found in the respective instrument web pages). For Grw+70° 8247, the results differ by 0.2–0.3 per cent, which may well be larger than uncertainties due to photon noise, and hence easily detected.
Polarization of standard star HD 25443 and of MWD Grw+70° 8247 (observed on 2018 September 22) integrated in different B filters as explained in the text.
| HD 25443 | Grw+70° 8247 | ||||
|---|---|---|---|---|---|
| PL(per cent) | Θ (°) | PL (per cent) | Θ (°) | PV (per cent) | |
| FORS B Bessel | 5.11 | 138.1 | 3.08 | 31.5 | 3.22 |
| FORS b_high | 5.14 | 138.1 | 2.76 | 30.7 | 3.58 |
| ACAM B Bessel | 5.13 | 138.1 | 2.86 | 31.0 | 3.43 |
| HD 25443 | Grw+70° 8247 | ||||
|---|---|---|---|---|---|
| PL(per cent) | Θ (°) | PL (per cent) | Θ (°) | PV (per cent) | |
| FORS B Bessel | 5.11 | 138.1 | 3.08 | 31.5 | 3.22 |
| FORS b_high | 5.14 | 138.1 | 2.76 | 30.7 | 3.58 |
| ACAM B Bessel | 5.13 | 138.1 | 2.86 | 31.0 | 3.43 |
This excercise shows that subtle changes observed in BBP measurements may actually be due to small differences of the transmission function of the instrument+telescope, rather than stellar variability. It is important to note that such differences due to different filters would not be detected in the observations of a standard star for linear polarization. Table 5 shows that, due to its smooth behaviour with wavelength, the differences in the wavelength integrated polarization of a standard star are of the order of 10−4, i.e. some 10 times smaller than those calculated for Grw+70° 8247. Even using the same instrument and instrument setup for broad-band measurement may not lead to conclusive results because instrument sensitivity may change over the years in a way not detectable through the monitoring of standard stars.
8 HAS THE POLARIZED SPECTRUM OF Grw+70° 8247 CHANGED WITH TIME?
Inspection of the data from the 1970s in Fig. 4 confirms the conclusions of the original literature, i.e. that circular polarization spectra obtained from 1972 to 1976 appear very similar to each other, and that the linear polarization spectra obtained over the same period of time show at most some small differences in the blue spectral regions. Our new measurements obtained in 2015 and 2018 also seem nearly identical to each other.
Compared to the measurements in the 1970s, our new circular polarization clearly show significant differences both in the red and at the shortest wavelengths. Linear polarization shows obvious changes in the blue, and perhaps marginal differences in the red. Since about 40 yr have elapsed between the observations of Angel et al. (1972), Landstreet & Angel (1975), and Angel et al. (1985) and our observations, polarization measurements set a time-scale for the changes of the order of decades or more.
In the following, we inspect and comment on these differences in more detail.
8.1 Intensity spectra
ISIS data reveal that |$\delta \mathcal {F}_{\rm N}$| is constant within the 3-yr interval of time from 2015 to 2018, both in the blue and in the red part of the observed spectrum. Unfortunately, we are not able to perform a meaningful comparison with intensity data obtained in previous decades.
8.2 Circular polarization
As noted above, circular polarization spectra obtained between 1972 and 1976 appear very similar to each other, as do the three circular polarization spectra obtained by us in 2015 and 2018. However, when comparing data sets obtained 40 yr apart, the amplitude of circular polarization has changed significantly at |$\lambda \lesssim 4000$| Å, betwen 4400 and 5000 Å and between 6100 and 6700 Å. Spectra obtained by Putney (1995) and WHT archive data obtained in 2004 show also some differences as discussed below.
8.2.1 The blue
The most remarkable variation in the circular polarization spectra of Grw+70° 8247 is seen at |$\lambda \lesssim 4000$| Å. Compared to the spectra obtained in the 1970s, circular polarization is offset by about −1 per cent. A careful inspection also shows that while the two data sets obtained in 2015 are fully consistent among themselves (within error bars), the polarization measured in 2018 is slightly different precisely in those wavelength regions where large differences are detected when we compare data taken 40–45 yr apart. This is best seen in Fig. 5. Differences bewteen 2015 and 2018 data sets are tiny (e.g. ∼−0.2 per cent at |$\lambda \lesssim 4000$| Å). They are above the uncertainty due to photon noise, but not large enough to exclude that they are entirely due to some systematics. However, the fact that they appear in the same spectral region where large changes are seen in a 40-yr interval of time suggests that the variability detected during a three-year span may well be intrinsic to the source (rather than due to an instrumental effect). Obviously this conclusion should be confirmed by further monitoring.
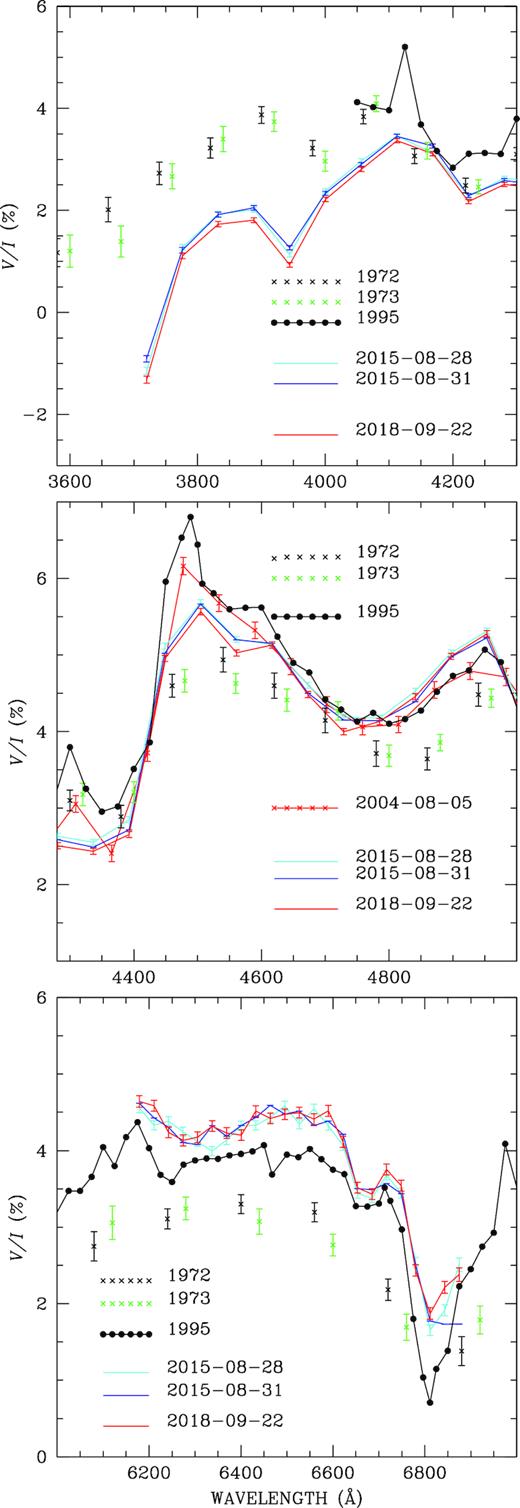
Enlarged view of circular spectropolarimetric data in spectral region covered by the ISIS instrument where discrepancies among data sets are noted.
Differences are prominent also betweeen 4400 and 4600 Å, where circular polarization had a maximum in 1995, then decreased in 2004 and continued to decrease in 2015 and 2018.
Due to the large variations of the polarization in the Minkowski bands, a comparison between our measurements synthetically integrated in the blue (3.43 per cent in a B Bessel filter) and the 3.61 ± 0.11 per cent value measured in the B filter by Butters et al. (2009) is not meaningful, apart from confirming that the polarization does not change much within a time-scale of a few years.
8.2.2 The red
Circular polarization around 6500 Å seems to have increase by about 1.5 per cent from the 1970s (when it was about 3 per cent) to about 4.5 per cent at the time of our observations. In this spectral region, we have not detected any change between 2015 and 2018, but data obtained in 1995 were in between the values measured in the two epochs. At 6800 Å, data obtained by Putney (1995) show the lowest values among all data sets (∼1 per cent).
Our BBP measurements in the red (4.0 per cent integrated over a R filter) are consistent with the relatively recent BBP measurement of Butters et al. (2009), who had detected a signal of 4.06 ± 0.16 per cent. In conclusion, we have clearly detected a change of 1.5 per cent over a 40+ yr interval, but found no evidence of change over a time-scale of the order of three years.
8.3 Linear polarization
No large changes of the fraction of linear polarization are detected either on a short (3-yr) or long (40-yr) time-scale. However, over a 40–45 yr interval of time, the position angle has definitely changed by more than 10° both in the blue and the red. In the following, we look at the various linear polarization spectra and their differences in more detail.
On the long time-scale sampled by the difference between the 1970s data and our recent ISIS spectra (40 yr), there definitely are changes. In particular, below 4000 Å, the recent level of linear polarization sampled by Q/I seems to have decreased, while that sampled by U/I is larger. This corresponds to a very significant rotation of the position angle of the linear polarization away from the value of ∼20° found in the 1970s to about 33° in recent times.
We note that the measurement by West (1989) obtained 1986 suggests also a decrease of linear polarization compared to the 1970s (3.19 per cent in the B filter, for a position angle of 19.1 ± 0.8) but as discussed in Section 4.3, these kinds of comparison should be made with caution.
It is notable that although the circular polarization is quite different from zero throughout the visible spectrum, the non-zero linear polarization is present essentially below 5500 Å, with possible low-level features suggested by the Steward spectrum, but largely absent from the lower resolution MCSP data. The position angle in the red as measured in the 1970s was around 110°, with a fair amount of scatter due to the small but not quite vanishing amplitude of Q and U in that region. In the ISIS data, both Q and U are also close to zero, therefore the position angle has a large uncertainty, but is consistent with a 10°–30° rotation from the value measured in the 1970s.
We conclude that linear polarization measurements are certainly variable over a time-scale of decades, mostly in terms of a rotation, while no significant variation has been detected on time-scale of three years. A rotation constant in wavelength provides a first rough description of the change in linear polarization.
9 CONSTRAINTS ON THE ROTATION PERIOD OF Grw+70° 8247
Measurements of the position angle of the broad-band linear polarization of Grw+70° 8247 in the blue between about 3800 and 4600 Å may be used to try to detect evidence of stellar rotation, under the assumption that the polarization position angle Θ tracks the position angle of the magnetic axis Λ.
We assume that the star may be described by an oblique rotator model, with rotation axis tilted at an angle i with respect to the line of sight, and that the magnetic axis, for example a dipole axis, is tilted at an angle β with respect to the rotation axis. Formally, the angle i identifies the positive rotation pole, and the angle β identifies the positive magnetic pole, and both i and β may range from 0° to 180° (e.g. Landolfi, Bagnulo & Landi Degl’Innocenti 1998). For simplicity, we will assume that i ≤ 90° and β ≤ 90°, a situation to which one can always be brought back to, after reversing the rotation direction, the polarity of the magnetic field, or both (see section 3 of Landolfi et al. 1998). None of these transformations will affect our conclusions below, which depend neither on the direction of the rotation, nor on the sign of the magnetic field.
There are two rather different geometrical situations that we should consider when interpreting time variations in the observed position angle of linear polarization. One situation is when the tilt angle of the rotation axis i is smaller than the obliquity of the magnetic axis β, and one when the tilt angle i is larger than the obliquity β.
(1) When i < β, the position angle of the dipolar axis Λ will span the range 0° to 360° as the star rotates. This situation is visualized in the left-hand panel of Fig. 6, and may be more easily understood by thinking of a star with the rotation axis parallel to the line of sight (i = 0°) and the magnetic axis perpendicular to the rotation axis (β = 90°). As the star rotates, the magnetic pole completes a 360° tour in the plane of the sky, and the polarization spans twice the range 0°–180°, always rotating in the same direction. Note, however, that the specific example of a rotation axis parallel to the line of sight implies that the longitudinal component of the magnetic field should be constant as the star rotates; this is not consistent with the observations of circular polarization of Grw+70° 8247, which show variability with time.
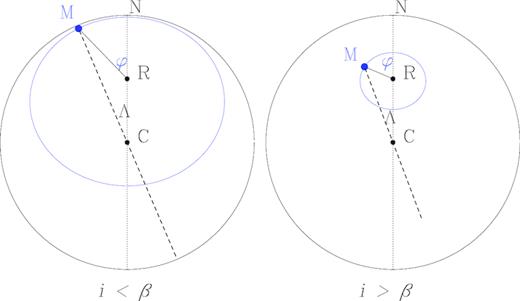
Two examples of oblique rotator model. The black solid lines represent the stellar disc; the centre of the stellar disc C, the rotation pole R, and the North Celestial Pole N are aligned. M represents the magnetic pole at the surface of the star, and the blue solid line represents its trajectory on the stellar disc as the star rotates (φ represents the rotation angle). The dashed line represents the projection of the dipolar axis in the plane of the sky, and forms and angle Λ with the direction to the North Celestial Pole. Left-hand panel: β > i (as the star rotates, the position angle Λ spans monotonically the range 0°–360°, and the polarization position angle spans twice the range 0°–180°). Right-hand panel: β < i (as the star rotates, the position angle Λ spans a limited angle range, and changes direction twice, and so does the polarization position angle).
(2) When i > β, the projected dipolar axis will not complete a full 360° as the star rotates, but would simply oscillate on the sky, changing direction every half-rotation period (see the right-hand panel of Fig. 6). The amplitude of the wobble of the position angle would be larger, the larger the value of β.
Because the position angle of linear polarization may be quite precisely determined, searching for changes in the direction of the position angle is clearly a relatively straightforward method of detecting stellar rotation, unless the star rotates extremely slowly, or the field axis and the rotation axis are very closely parallel.
As we have detected rotation of the polarization position angle, which we assume is due to rotation of the underlying star rather than significant evolution of the stellar magnetic field structure, it is of interest to try to obtain constraints on the stellar rotation period from the observations. Of course, we are severely limited by the obvious fact that we have not yet observed one full rotation, and so we do not yet know whether the geometry of the rotation axis and field obliquity is closer to case (1) or (2).
If the situation is close to case (1), with i ≤ β, then a single rotation produces two full circles of the position angle on the sky. In this case, we might have observed 10°–15° of a full 360° rotation in about 40 yr, suggesting a rotation period of the order of one millenium.3
If Grw+70° 8247 is closer to case (2), the minimum possible period would correspond to our two main epochs of observation corresponding roughly to the two extremes of position angle oscillation. In this case another 40 or 50 yr might bring the position angle back to about 20°. If this is the situation, the rotation period might be as short as a century.
In this discussion, we have made the implicit assumption that the polarization position angle has monotonically changed during the last 40 yr. In fact, we are not aware of linear polarization measurements that can validate this. Also, we note that our period limit estimates are based on the assumption that dΛ/dt is constant with time. This clearly cannot be true, around the epoch of inversion of the direction of changes of Λ, in scenario no. 2. Also, the effect of Faraday rotation may change as the star rotates, affecting also the assumption that dΛ/dt is constant with time. However, our simple modelling should be sufficient for an order-of-magnitude estimate of the rotation period, which is all we can extract from the very limited available data. We conclude that the rotation period lies probably in the range of 102–103 yr.
Our period estimate may seem outrageously long, but there are main-sequence stars known to have rotation periods near the lower limit, for example the star HD 201601 = γ Equ, with a period estimated to be about one century (Leroy et al. 1994; Bychkov, Bychkova & Madej 2016). It is clear that physical processes exist that are capable of removing virtually all of a star’s angular momentum, and that one of the most powerful of these processes acts through the stellar magnetic field.
10 CONCLUSIONS
We have presented new polarization spectra of the white dwarf Grw+70° 8247, one of the most strongly magnetic of the known MWDs, and searched for variability.
To carry out our investigation, we had to perform a careful analsysis of various polarimetric measurements obtained with the ISIS instruments in the last few years. We found some important results that help to characterize the instrument, and that may be useful to other users interested in the polarimetric capabilities at the WHT. In particular, we found that:
Both linear and circular instrumental polarization are smaller (in absolute value) than 0.05 per cent.
Cross-talk from linear to circular polarization is negligible for most practical situations. Our estimate is that less than 1 per cent of the linear polarization signal is transformed into circular polarization.
We found no evidence that the use of a dichroic beam splitter introduces a spurious linear polarization signal, confirming what was already found for circular polarization by Bagnulo & Landstreet (2018).
We have presented a list of ISIS observations of standard stars for linear polarization to which we may refer in the future to monitor instrument stability,
We have used lunar, twilight, and background spectra to confirm the alignment of the polarimetric optics. These methods may be adopted more systematically as they are probably faster and more accurate than observing standard stars.
We have found inconsistencies between the way the circular polarization of Grw+70° 8247 has been reported over the years; we have discussed the definition of the sign of circular polarization, and clarified what we have adopted.
Regarding the scientific investigation of Grw+70° 8247:
We have shown that spectropolarimetry in all four Stokes parameters (as opposed to BBP measurement) is the method of choice for the study of strongly MWDs for two reasons. One is that only spectropolarimetry may reveal the shape of the Stokes profiles of the spectral features; the other is that it allows to discriminate between changes of the instrument sensitivity and changes of the polarization intrinsic to the source.
We have clearly established the variability of the polarization spectra of the MWD Grw+70° 8247. We have argued that the observed rotation of the position angle of linear polarization suggests that the rotation period is probably in the range of 102–103 yr. This result would imply that Grw+70° 8247 is one of the most slowly rotating stars known.
At this early stage in restarting systematic observations of the highest field MWDs, we hope that we have relaunched the systematic observation of these mysterious and potentially very important objects, which contain the largest fields in the universe that are easily observable directly in optical light. One of the long-term goals of this work is to obtain the observations needed to determine the rotation period of Grw+70° 8247, and to map the surface field structure, a task that we are obliged to leave to future generations of astronomers.
ACKNOWLEDGEMENTS
This work is based on observations collected at the WHT, operated on the island of La Palma by the Isaac Newton Group, in the context of programmes P17 during semester 15B, and programme P15 during semester 18B. Important ISIS calibration data were obtained in the context of programme P5 during semester 14A, programme P30 during semester 14B and programme P28 during semester 15A. This paper has also made use of data obtained from the Isaac Newton Group Archive which is maintained as part of the CASU Astronomical Data Centre at the Institute of Astronomy, Cambridge. JDL acknowledges the financial support of the Natural Sciences and Engineering Research Council of Canada (NSERC), funding reference number 6377-2016. We thank Ian Skillen (ING) for calculating the instrument position angle on sky when the instrument and telescope were in the parking position, Tom Marsh for the data of Grw+70° 8247 obtained in 2004 at the WHT, and Stefan Jordan for his useful review of this manuscript. We also acknowledge the use of digitizing software available at https://automeris.io/WebPlotDigitizer.
Footnotes
In addition to being the first MWD discovered, and the first high-field MWD, Grw+70° 8247 (which was identified and catalogued in the Greenwich Observatory zone of the Astrographic Catalogue) was only the fifth WD ever identified (Kuiper 1935).
Using software available at https://automeris.io/WebPlotDigitizer/.
It was this argument, applied in the 1970s to an upper limit of perhaps 4° of position angle rotation in two years of observation, that led to the suggestion of a period of the order of 100 yr or longer (Landstreet & Angel 1975), which has frequently been repeated in the literature.
