


Abstract
At fixed stellar mass, satellite galaxies show higher passive fractions than centrals, suggesting that environment is directly quenching their star formation. Here, we investigate whether satellite quenching is accompanied by changes in stellar spin (quantified by the ratio of the rotational to dispersion velocity V/σ) for a sample of massive (M* > 1010 M⊙) satellite galaxies extracted from the Sydney-AAO Multi-object Integral field spectrograph (SAMI) Galaxy Survey. These systems are carefully matched to a control sample of main sequence, high V/σ central galaxies. As expected, at fixed stellar mass and ellipticity, satellites have lower star formation rate (SFR) and spin than the control centrals. However, most of the difference is in SFR, whereas the spin decreases significantly only for satellites that have already reached the red sequence. We perform a similar analysis for galaxies in the Evolution and Assembly of GaLaxies and their Environments (EAGLE) hydrodynamical simulation and recover differences in both SFR and spin similar to those observed in SAMI. However, when EAGLE satellites are matched to their true central progenitors, the change in spin is further reduced and galaxies mainly show a decrease in SFR during their satellite phase. The difference in spin observed between satellites and centrals at z ∼ 0 is primarily due to the fact that satellites do not grow their angular momentum as fast as centrals after accreting into bigger haloes, not to a reduction of V/σ due to environmental effects. Our findings highlight the effect of progenitor bias in our understanding of galaxy transformation and they suggest that satellites undergo little structural change before and during their quenching phase.
1 INTRODUCTION
Observational evidence that galaxy properties vary as a function of environment has been presented since at least Hubble & Humason (1931). After almost a century, it is now clear that the structure (usually quantified via visual classification or two-dimensional surface brightness decomposition) and star formation activity of galaxies depend on their location within the large-scale structure (e.g. Dressler 1980; Lewis et al. 2002; Gómez et al. 2003; Boselli & Gavazzi 2006; Wetzel, Tinker & Conroy 2012).
It is also firmly established that these trends, generally referred to as ‘morphology–density’ and ‘star formation rate–density’ relations, are not simply two different manifestations of the same evolutionary paths. For example, there is plenty of evidence for the existence of a large population of rotationally supported discy systems with low (or no) star formation in groups and clusters (e.g. van den Bergh 1976; Poggianti et al. 1999; Gavazzi et al. 2006; Lisker, Grebel & Binggeli 2006; Boselli et al. 2008; Bamford et al. 2009; Cortese & Hughes 2009; Toloba et al. 2009; Bundy et al. 2010; Hester 2010). Thus, separating between quenching and structural transformation becomes critical to reveal what shaped the environmental trends that we see today.
The advent of large area spectroscopic surveys and the refinement of large-scale cosmological simulations have also highlighted that the way in which we define ‘environment’ does matter (e.g. Muldrew et al. 2012; Fossati et al. 2015). There is no ‘golden environmental ruler’, every metric has its advantages and disadvantages and the definition of environment should be tuned to the particular issue being addressed (e.g. Brown et al. 2017). Nevertheless, it is now well established that one of the best ways to isolate galaxies most likely to be affected by environment is to focus on satellites. Central galaxies dominate in number at all stellar masses (e.g. Tempel et al. 2009; Yang, Mo & van den Bosch 2009), and it is still debated whether or not their evolution is significantly affected by environment (e.g. Blanton & Berlind 2007; van den Bosch et al. 2008; Wilman, Zibetti & Budavári 2010). Thus, including centrals in the analysis would significantly reduce or completely wash out any signatures of environmentally driven transformation.
Interestingly, while the focus on satellite galaxies has reduced the disagreement between some observational results, this approach turns out not to be sufficient to separate the relative importance of quenching and morphological transformation in the life of satellite galaxies. Indeed, observational evidence supporting seemingly opposite transformation scenarios has been presented, namely simultaneous quenching and morphological transformation on one side (e.g. Moss & Whittle 2000; Christlein & Zabludoff 2004; Cappellari 2013; George et al. 2013; Omand, Balogh & Poggianti 2014; Kawinwanichakij et al. 2017), and quenching-only followed by no or minor structural transformation on the other (e.g. Larson, Tinsley & Caldwell 1980; Blanton et al. 2005; Cortese & Hughes 2009; Woo et al. 2017; Rizzo, Fraternali & Iorio 2018). There are various potential reasons behind these conflicting results, but our view is that most of the difference can be ascribed to two – equally important – limitations.
First, the techniques used to quantify structure/morphology vary significantly in the literature, encompassing both visual classification (generally used to isolate early- from late-type galaxies) and structural parameters obtained via two-dimensional surface brightness decomposition of optical images. Arguably, neither of the two has a direct connection to the kinematic properties of galaxies, as it has now been demonstrated that they are not able to distinguish between rotationally- and dispersion-supported systems (e.g. Emsellem et al. 2011; Krajnović et al. 2013; Cortese et al. 2016b). Thus, to identify and quantify truly structural transformation, and separate it from visual changes simply due to quenching and disc fading, information on the kinematic properties of stars is vital.
Second, it is now well established that, for massive satellite galaxies (stellar masses M* > 1010 M⊙), full quenching takes at least a few Gyr after infall (e.g. Cortese & Hughes 2009; Weinmann et al. 2010; Wetzel et al. 2013; Oman & Hudson 2016; Bremer et al. 2018), a time during which central star-forming systems have grown significantly (van der Wel et al. 2014). This means that today’s centrals cannot be naively assumed to be representative of the progenitor population of local satellites and used to quantify the effect of nurture on galaxy evolution, an issue generally referred to as progenitor bias (van Dokkum & Franx 2001; Woo et al. 2017). Only by identifying the real progenitors of satellites at the time of infall we can reveal how satellites have been transformed by environment. While this is still out of reach from an observational perspective, the improvement of cosmological simulations is starting to make it possible to use models to quantify the effect of progenitor bias and try to correct for it.
In this paper, we revisit the issue of satellite transformation with the goal of quantifying the change in star formation activity and structure separately, and to determine if they both happen simultaneously or on different time-scales. Our analysis improves on previous works by directly addressing the two limitations discussed above. First, we take advantage of optical integral field spectroscopic observations obtained as part of the Sydney-AAO Multi-object Integral field spectrograph (SAMI) Galaxy Survey (Bryant et al. 2015) to directly trace the stellar kinematic of galaxies. Second, we compare our findings with predictions from the Evolution and Assembly of GaLaxies and their Environments (EAGLE; Schaye et al. 2015) cosmological simulation, and use it to quantify the effect of progenitor bias. The use of a cosmological simulation such as EAGLE turns out to be critical for a less biased interpretation of SAMI data, highlighting the danger of inferring galaxy evolutionary histories from single-epoch snapshots.
This paper is organized as follows. In Section 2, we describe how our sample is extracted from the SAMI Galaxy Survey, the stellar kinematic parameters, and the ancillary data used in this paper. In Section 3, we compare the star formation and kinematic properties of satellites and centrals and compare our results with the prediction from the EAGLE simulation. This section includes the main results of this work. Lastly, the implications of our results are discussed in Section 4.
Throughout this paper, we use a flat Λ cold dark matter concordance cosmology: H0 = 70 km s1 Mpc1, Ω0 = 0.3, and ΩΛ = 0.7.
2 THE DATA
The SAMI Galaxy Survey has observed ∼3000 individual galaxies in the redshift range 0.004 < z < 0.095 and with stellar masses greater than ∼107.5 M⊙ taking advantage of the SAMI (Croom et al. 2012), installed at the Anglo-Australian Telescope. SAMI is equipped with photonic imaging bundles (‘hexabundles’; Bland-Hawthorn et al. 2011; Bryant et al. 2014) to simultaneously observe 12 galaxies across a 1° field of view. Each hexabundle is composed of 61 optical fibres, each with a diameter of ∼1.6 arcsec, covering a total circular field of view of ∼14.7 arcsec in diameter. SAMI fibres are fed into the AAOmega dual-beam spectrograph, providing a coverage of the 3650–5800 and 6240–7450 Å wavelength ranges with dispersions of 1.05 and 0.59 Å pixel−1, respectively.
In this paper, we extract our sample from the 1552 galaxies overlapping with the footprint of the Galaxy And Mass Assembly Survey (GAMA; Driver et al. 2011) included in the SAMI Data Release 2 (Scott et al. 2018) and for which integrated current star formation rate (SFR) estimates are available (referred to as parent sample). SFRs are taken from Davies et al. (2016) and have been derived by fitting the spectral energy distribution fitting code magphys (da Cunha, Charlot & Elbaz 2008) to the full 21-band photometric data available for GAMA galaxies across the ultraviolet to the far-infrared frequency range (Driver et al. 2016; Wright et al. 2016). In addition to the wealth of multiwavelength data available, the GAMA regions are characterized by an exquisitely high spectroscopic completeness, providing us with a state-of-the-art group catalogue (Robotham et al. 2011), critical for distinguishing between central and satellite galaxies.
We focus on galaxies with stellar mass greater than 1010 M⊙ (768 galaxies), for which the signal-to-noise ratio (S/N) in the continuum is generally high enough to allow a proper reconstruction of the stellar velocity field. Stellar masses (M*) are estimated from g − i colours and i-band magnitudes following Taylor et al. (2011), as described in Bryant et al. (2015).
The procedure adopted to extract stellar kinematic parameters is extensively described in van de Sande et al. (2017b) and Scott et al. (2018). Here, we briefly summarize its key steps. Stellar line-of-sight velocity and intrinsic dispersion maps are obtained using the penalized pixel-fitting routine ppxf, developed by Cappellari & Emsellem (2004). SAMI blue and red spectra are combined by convolving the red spectra to match the instrumental resolution in the blue. We then use the 985 stellar template spectra from the Medium resolution INT Library of Empirical Spectra (MILES) stellar library (Sánchez-Blázquez et al. 2006) to determine the best combination of model templates able to reproduce the galaxy spectrum extracted from annular binned spectra following the optical ellipticity and position angle of the target. We apply the following quality cuts to each spaxel to discriminate between good and bad fits (van de Sande et al. 2017b): S/N > 3 Å−1, σ > FWHMinstr/2 ∼ 35 km s−1, Verr < 30 km s−1, and σerr < σ × 0.1 + 25 km s−1, where V, Verr, σ, and σerr are the line-of-sight and dispersion velocities and their uncertainties.
As SAMI galaxies cover a wide range of effective radii, we want to make sure that the one effective radius aperture provides a reasonable number of independent resolution elements to determine V/σ, and minimize the effect of beam smearing. Thus, we remove all galaxies with re < 2 arcsec or re smaller than 2.5 the half-width at half-maximum of the point spread function of the secondary standard star observed with the same plate (121 galaxies). Conversely, we keep galaxies with effective radii larger than the SAMI bundle (154 objects) and apply the aperture correction as described in van de Sande et al. (2017a) to recover the value of V/σ within one effective radius.
The selections described above reduce our sample from 768 to 605 galaxies. During the analysis described in Section 3, five satellite galaxies were further removed from the sample as visual inspection highlighted issues with their photometric ellipticity and/or position angles (e.g. contamination by foreground/background objects, structural parameters tracing the inner bar instead of the disc, etc.). In conclusion, the final sample used in this paper is composed of 600 galaxies, 431 of which are centrals and 169 are group satellites according to v09 of the group catalogue by Robotham et al. (2011). Our satellites occupy halo masses up to ∼1014.5 M⊙, with an average value of ∼1013.4 M⊙.
The stellar mass, r-band ellipticity (ϵ), and specific SFR distributions for our parent and final samples are shown in Fig. 1 as empty and filled histograms, respectively. All galaxies are shown in the top, with only centrals/satellites included in the middle/bottom row, respectively. It is clear that our quality cuts preferentially affect round, low-mass passive objects. However, as the two samples cover the same parameter space in all three variables, we are confident that the matching procedure at the basis of our analysis in Section 3 is not biased by the strict criteria used to extract our final sample. Indeed, our main conclusions and average trends are not affected even if we relax the criteria used to exclude ‘marginally resolved’ galaxies, with the only noticeable change being an increase in scatter. The potential effect of beam smearing on our estimates of V/σ is discussed in Appendix A, where we show that correcting for beam smearing would even reinforce the main conclusions of this paper.
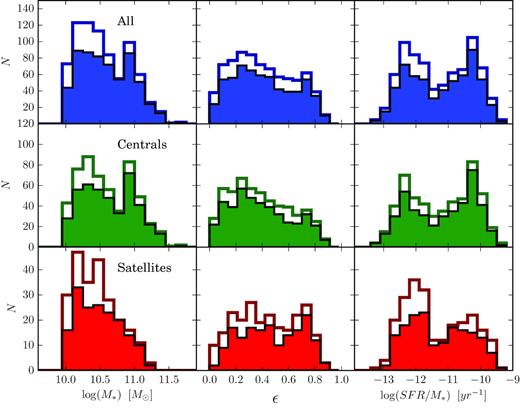
The stellar mass (M*, left), ellipticity (ϵ, middle), and specific star formation rate (SFR/M*, right) distribution for our parent (empty histogram) and final (filled histogram) samples. The top row includes all galaxies, while the middle and bottom rows focus on central and satellite galaxies only. It is clear that our final sample covers the same parameter space as our initial parent sample.
3 QUENCHING AND STRUCTURAL TRANSFORMATION AT |$\boldsymbol{z}$| ∼ 0
Our primary goal is to separately quantify the changes in SFR and V/σ (a proxy for the stellar spin parameter) experienced by galaxies after they have become satellites. As shown in Fig. 2, and consistently with previous works (e.g. van den Bosch et al. 2008; Weinmann et al. 2009; Peng et al. 2012), the fraction of satellite galaxies with low specific SFR in our parent sample are significantly larger than that of centrals. This supports the common assumption that environmental effects are playing a more active role in the evolution of satellite than in centrals. Our aim is to determine if satellites being quenched after infall do also experience changes in their kinematic properties.
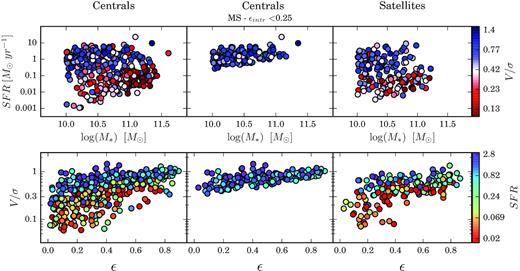
The M*–SFR (top) and V/σ–ϵ (bottom) planes for all centrals in our sample (left), main-sequence discy centrals (middle), and satellite galaxies (right). Points are colour coded by V/σ and SFR in the top and bottom panels, respectively.
Ideally, this would require a priori knowledge of the properties of satellite galaxies at the time of infall into their host halo. While this is currently possible in cosmological simulations, observationally we are not yet able to link progenies and progenitors at different redshifts. Thus, nearly all observational studies so far have used central galaxies at z ∼ 0 to ‘guess’ the properties of galaxies at the time when they became satellites (e.g. van den Bosch et al. 2008; Woo et al. 2017).
In this work, we first make a similar assumption to quantify the variation in stellar kinematic between SAMI satellites and centrals. We then compare our results with the predictions of the EAGLE hydrodynamical simulation (Crain et al. 2015; Schaye et al. 2015; McAlpine et al. 2016) at z ∼ 0. This is needed to validate the ability of the simulation to reproduce the observed difference between centrals and satellites. Lastly, we use EAGLE to quantify the effect of progenitor bias on the z ∼ 0 comparison. This last step is the most critical one for the interpretation of the results emerging from the SAMI data.
3.1 SAMI galaxies
In order to quantify the amount of transformation experienced by SAMI satellites, we compare their properties to those of rotationally supported centrals in the star-forming main sequence. Of course, this is very conservative and would imply that all galaxies become satellites as rotating star-forming discs. As we have evidence that this is not always the case (e.g. Cortese et al. 2006; Mei et al. 2007), our findings must be interpreted as an upper limit for the real amount of transformation experienced by galaxies during their satellite phase. We will further discuss this point in the following sections.
We isolate star-forming centrals by selecting systems with SFR higher than the lower 1σ envelope of the z ∼ 0 main sequence obtained by Davies et al. (2016) for GAMA galaxies, namely log (SFR) > 0.7207 × (log (M*/M⊙) − 10) + 0.061–0.73. Similarly, rotationally supported centrals are selected by imposing that log (V/σ) > 0.4 × ϵ − 0.5, where ϵ is the observed ellipticity in rband. Following the formalism in Cappellari (2016), this is nearly equivalent to selecting only axisymmetric galaxies with intrinsic ellipticity (ϵintr) smaller than ∼0.25 for anisotropy βz = 0.6ϵintr, i.e. consistent with what observed for disc-dominated galaxies (e.g. Giovanelli et al. 1994; Unterborn & Ryden 2008; Foster et al. 2017). We favour this empirical criterion to the analytical prescription as it provides a more conservative cut at low ellipticities, where the difference between the analytic prescription for different intrinsic shapes becomes significantly smaller than the measurement errors in both V/σ and ϵ. The combination of both criteria yields 167 star-forming, rotating centrals, including both isolated (i.e. with no detected companions: 90 objects) and group centrals, with the vast majority of centrals in groups (55 out of 77 objects) having just one or two satellites according to the GAMA group catalogue.
The results of our selection are shown in Fig. 2, where we compare the distribution in the SFR–M* (top row) and V/σ–ϵ plane (bottom row) of all 431 centrals in our sample (left-hand column), and for the 167 main-sequence, rotationally supported centrals (middle column). For reference, we also show the distribution of the 169 group satellites (right-hand column). Points are colour coded by V/σ in the SFR–M* plane (top row) and SFR in the V/σ–ϵ (bottom row) to highlight the tight apparent link between SFR and V/σ. Fig. 2 also shows that the V/σ and SFR cuts adopted to isolate our control sample of central galaxies are equivalent from a statistical point of view, i.e. applying only one of the two would result in a control sharing the same properties and, indeed, would lead us to the same results. This is also consistent with the tight correlation between V/σ and stellar age recently presented by van de Sande et al. (2018). The simultaneous use of the two cuts is preferred simply because it provides a more rigorous initial hypothesis to our exercise (i.e. it gives independent constraints to both star formation activity and structural properties of the control sample).
In order to quantify the difference in SFR and spin of satellites compared to main-sequence, rotationally supported centrals, we follow a technique similar to that discussed in Ellison et al. (2015) and Ellison, Catinella & Cortese (2018). We define Δ(SFR) and Δ(V/σ) as the difference (in log-space) between the SFR or V/σ of a satellite and the median value obtained for a control sample of main-sequence, rotation-dominated centrals matched in both stellar mass and ellipticity. During the matching procedure, we start isolating all the control centrals within 0.15 dex in stellar mass and 0.1 in ellipticity from each satellite. If such control sample includes fewer than 10 galaxies, we iteratively increase the range of stellar mass and ellipticity (in steps of 0.01) until the control includes at least 10 objects. The end result is that our average bins are ∼0.16 dex and 0.11 wide in stellar mass and ellipticity, respectively. We then compute the median SFR and ϵ for the control and use it to determine Δ(SFR) and Δ(V/σ) for each satellite.
The additional matching by ellipticity is adopted mainly because the V/σ estimates do not include an inclination correction. This is also justified by the fact that the ellipticity distribution of central and satellites may not always be the same (e.g. see Fig. 2). The fact that, for SAMI galaxies, observed and intrinsic ellipticity do not correlate (van de Sande et al. 2018) also suggests that this assumption is not introducing any significant bias. Indeed, matching only by stellar mass would not change our results. Our findings are also unchanged if we limit our control sample to isolated or group centrals only.
It is important to acknowledge that, despite some differences in the technique used here, our quantification of Δ(SFR) and Δ(V/σ) is deeply inspired by the definition of atomic gas (H i) deficiency originally introduced by Haynes & Giovanelli (1984). By quantifying the difference in H i content with respect to galaxies of same morphology and size, H i deficiency has become a key parameter for isolating the effect of environment on the cold gas content of galaxies (e.g. Giovanelli & Haynes 1985; Solanes et al. 2001; Boselli & Gavazzi 2006; Cortese et al. 2011, 2016a).
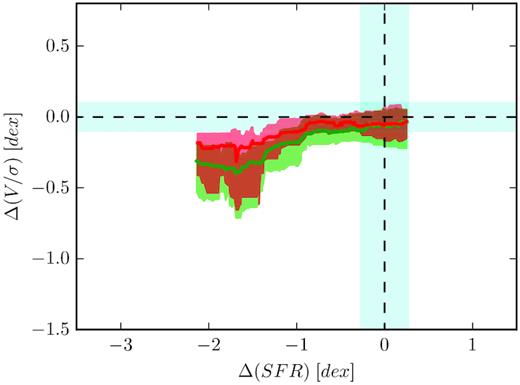
In Fig. 3, we show the result of the matching procedure by plotting Δ(V/σ) versus Δ(SFR), with points colour coded by stellar mass. Dashed lines define ‘normalcy’ (i.e. no change) in SFR and/or V/σ, with cyan bands highlighting the 1σ variation for the control sample. If satellites were to first lose spin and then decrease their star formation with respect to centrals, they would move vertically downwards (i.e. negative Δ(V/σ) around Δ(SFR) ∼ 0) and then horizontally towards the left (negative Δ(SFR) and negative Δ(V/σ)). Similarly, if changes in SFR were followed by similar changes in stellar spin, satellites would form a diagonal sequence showing Δ(SFR) ∝ Δ(V/σ). Conversely, satellite galaxies occupy an L-shaped parameter space in the Δ(SFR)–Δ(V/σ) plane with large changes in V/σ only for the passive population.
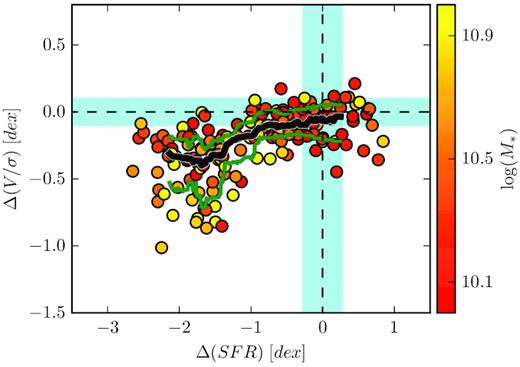
Variations in stellar V/σ and SFR for satellite galaxies with respect to our control sample of main-sequence, high V/σ centrals. Points are colour coded by stellar mass. Dashed lines and cyan bands show the average and standard deviation for the control sample. The thick black and thin green lines show the running median and 20–80 per cent percentile ranges for Δ(V/σ) in bins of Δ(SFR). See Section 3.1 for details on the matching procedure.
Main-sequence satellite galaxies show an average V/σ marginally lower than that of our control sample (Δ(V/σ) ∼ −0.08, with standard deviation ∼0.13 dex). During the satellite quenching phase, Δ(V/σ) remains roughly constant until galaxies have reduced their current SFR by more than a factor of 10. Then, for the more passive population (Δ(SFR) ∼ −1.8 dex), the scatter in Δ(V/σ) more than doubles and satellites span almost a dex in Δ(V/σ), although the median value never goes below −0.4 dex. This is qualitatively consistent with previous observational (e.g. Boselli & Gavazzi 2006; Cortese & Hughes 2009; Woo et al. 2017) and theoretical works (e.g. Correa et al. 2017) suggesting the presence of a wide range of visual and/or photometric morphologies in the red sequence of satellite galaxies.
No significant dependence of the position of satellites in the Δ(SFR)–Δ(V/σ) plane on stellar mass (or group halo mass, not shown here) is observed. Intriguingly, the three outliers in the bottom right-hand quadrant (i.e. positive Δ(SFR) and negative Δ(V/σ)) are all interacting systems (GAMA IDs 301382, 485833, 618992), suggesting that our technique may also be able to identify boosts in SFR accompanied by kinematic perturbations.
It is tempting to interpret Fig. 3 in terms of galaxy transformation, and consider the variation of Δ(SFR) and Δ(V/σ) as the evolutionary paths followed by satellites after infall. As such, one would immediately conclude that satellites experience a two-phase transformation, with quenching of the star formation happening first and structural transformation – if any – taking place at later stages or on longer time-scales, and visibly affecting only galaxies already quenched. Unfortunately, Fig. 3 would directly show evolutionary tracks only if the vast majority of satellite galaxies at z ∼ 0 had become satellites in the last couple of billion years. As this is clearly not the case (e.g. De Lucia et al. 2012; Han et al. 2018), their properties at the time of infall could be significantly different from those of central galaxies in the local Universe. Not only their stellar mass was likely smaller, potentially undermining the basis of our matching procedure but, most importantly, their SFR was higher and their spin parameter lower than those of star-forming centrals at z ∼ 0 with the same mass. Thus, our results most likely provide just an upper limit to the change in V/σ parameter and a lower limit to the change in SFR experienced by satellite galaxies. We will demonstrate this point in the next section.
3.2 Simulated galaxies in EAGLE
In order to quantify the potential effect of progenitor bias on the results presented in Fig. 3, we perform the same analysis presented in the previous section on galaxies extracted from the EAGLE simulation. We focus on the EAGLE reference model, denoted as Ref-L100N1504 and rescaled to the cosmology adopted in this paper, which corresponds to a cubic volume of 100 comoving Mpc per side, and use the stellar kinematic measurements presented in Lagos et al. (2018). Briefly, stellar kinematic maps are produced by projecting the stellar particle kinematic properties on a two-dimensional plane with bin size of 1.5 comoving kpc. The line of sight is fixed along the z-axis of the simulated box, providing a random distribution for the orientation of galaxies, and line-of-sight and dispersion velocities are obtained by fitting a Gaussian to line-of-sight velocity distribution for each pixel. The V/σ ratio is then estimated in the same way as in the observations, by integrating only pixels within one effective radius and using the r-band luminosity of each pixel as weight. SFR is implemented following the prescription of Schaye & Dalla Vecchia (2008), and here we use total current SFRs as described in Furlong et al. (2015). Central galaxies in the simulation are defined as those objects hosted by the main subhalo, while galaxies hosted in other subhaloes within the group are considered satellites. Across the stellar mass range of interest of this paper (10 < log (M*/M⊙) < 11.5), we find 2265 centrals and 1413 satellites. Satellite galaxies in EAGLE span a slightly wider range of halo masses than our SAMI final sample, extending up to ∼1014.8 M⊙ with an average halo mass of ∼1013.6 M⊙, i.e. ∼0.2 dex higher than our final sample.
Because the main sequence of star-forming galaxies in EAGLE is slightly offset towards lower SFR with respect to the observed one (Furlong et al. 2015), we revise the cut used to isolate star-forming centrals for the matching procedure, i.e. log (SFR) > 0.7207 × (log (M*/M⊙) − 10) + 0.061–1.2. Similarly, EAGLE passive galaxies have naturally SFR equal to 0, whereas SAMI red sequence objects have their star formation clustered around ∼10−1.8 M⊙ yr−1. This is due to the inability of SED-fitting techniques to quantify very low levels of SFRs. For consistency with observations, EAGLE galaxies with SFR < 10−1.8 M⊙ yr−1 are assigned a random value of SFR following a lognormal distribution peaked at 10−1.8 M⊙ yr−1, with 0.2 dex scatter. We note that the exact location and shape of the distribution used to rescale passive galaxies do not affect our results. Our final sample used for the matching is thus composed of 1204 main-sequence, rotationally supported centrals and 1413 satellites.
We perform a matching procedure identical to the one used for SAMI data. Namely, each satellite is matched with all main-sequence, rotationally supported centrals within 0.15 dex in stellar mass and 0.1 in ellipticity. The median SFR and V/σ are then used to estimate Δ(SFR) and Δ(V/σ) for each satellite. The result is shown in Fig. 4. The density distribution of EAGLE galaxies is highlighted in grey, with Gaussian kernel density contours in red. SAMI galaxies are overplotted as empty blue circles for comparison. We find agreement between the distribution of SAMI and EAGLE galaxies, with the values of Δ(V/σ) for EAGLE galaxies becoming large only for galaxies already in the passive population.
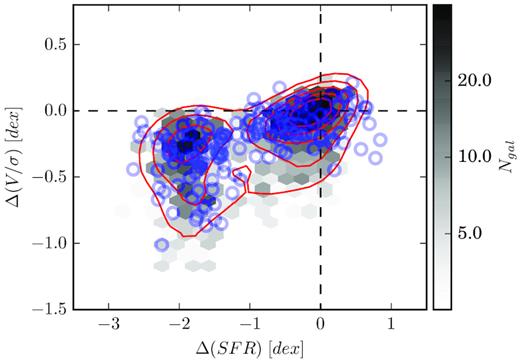
Variations in stellar V/σ and SFR for satellite galaxies in the EAGLE simulation. Density distribution and Gaussian kernel contours are shown in grey and red, respectively. Matching is done following the same technique used for SAMI galaxies, overplotted as empty blue circles for comparison.
The good agreement between SAMI and EAGLE gives us confidence to use EAGLE to investigate the effect of progenitor bias in our analysis. To do so, in Fig. 5 we plot Δ(SFR)true versus Δ(V/σ)true, estimated by comparing the satellite’s property at z ∼ 0 with those at the last simulation snapshot before infall, if they have become satellites between z ∼ 0 and 2 (i.e. ∼92 per cent of the local satellite population). The picture that emerges is significantly different from before, with variations in V/σ becoming smaller and galaxies preferentially moving horizontally in the diagram. Interestingly, galaxies with small negative Δ(SFR) (i.e. satellites at the beginning of their quenching phase) show marginally positive Δ(V/σ). This is likely because, despite becoming satellites, galaxies keep acquiring additional angular momentum even after infall.
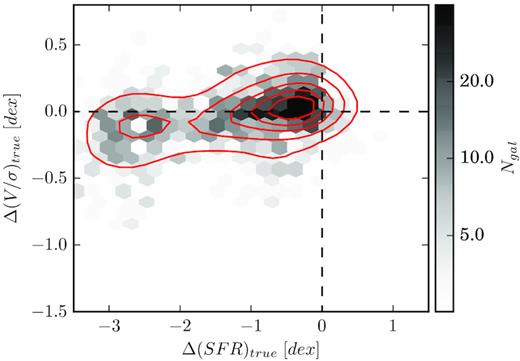
‘True’ variations in stellar V/σ and SFR for satellite galaxies in the EAGLE simulation, determined by comparing the z ∼ 0 properties to those at the last snapshot during which the galaxy was a central. Density distribution and contours are as in Fig. 4.
4 DISCUSSION AND CONCLUSION
In this work, we have quantified the difference in stellar spin parameter and SFR between satellites and main-sequence, rotationally dominated centrals at z ∼ 0 (matched in stellar mass and ellipticity). Satellites in the main-sequence and transition region show very similar stellar kinematic properties to star-forming centrals, and only satellites already in the red sequence have spin parameters significantly (i.e. at least a factor of 2) lower than those typical of thin star-forming discs. As our control sample of central galaxies at z ∼ 0 includes only galaxies with stellar spin typical of disc-dominated galaxies, the lack of any major decrease in satellite’s V/σ in the main sequence rules out significant structural transformation before quenching.
If we use the same matching technique presented in Section 3 to estimate the variation of r-band Sérsic index (Δ(n)) and stellar mass surface density (Δ(μ*), where |$\mu _{*}=M_{*}/(2\pi r_{\rm e}^{2})$|) for main-sequence satellite galaxies, we find that both Δ(n) and Δ(μ*) change very little (∼0.08 dex on average, with standard deviations ∼0.21 and 0.18 dex, respectively), in line with what obtained for Δ(V/σ). This is consistent with Bremer et al. (2018), who find no difference in the bulge K-band luminosity between late-type blue sequence and green valley galaxies.
In recent years, several works have proposed a scenario in which a rapid increase in the central galaxy density truncates star formation, i.e. galaxies grow their inner core and then quench (a process sometimes referred to as ‘compaction’; e.g. Cheung et al. 2012; Fang et al. 2013; Woo et al. 2015; Zolotov et al. 2015; Tacchella et al. 2016; Wang, Kong & Pan 2018). While originally motivated by studies of central galaxies (e.g. Cheung et al. 2012; Fang et al. 2013), compaction has also been suggested as a viable quenching path for satellite galaxies (e.g. Wang et al. 2018).
Our findings would appear to rule out any forms of ‘compaction’ that significantly reduces the stellar spin (or increases the average stellar surface density) of main-sequence satellites within one effective radius (with respect to star-forming, rotationally dominated centrals). Given the limited spatial resolution of SAMI observations, we cannot exclude changes in the central kiloparsec of satellite galaxies (i.e. where stellar mass surface densities used to quantify compaction are generally estimated). However, if this is the case, ‘compaction’ does not seem to be affecting the global kinematic and/or photometric properties of group galaxies before quenching.
In other words, it seems unlikely that, after they have become satellites, galaxies grow prominent dispersion-dominated bulges while still on the main sequence. Of course, star-forming satellites could still harbour small photometric and/or kinematic bulge components, but their structural properties are not different from those of star-forming, rotationally dominated centrals of similar stellar mass. Our interpretation is in line with Tacchella et al. (2017) and Abramson & Morishita (2018) who show that ‘compaction’ may not be needed to explain the properties of the local passive population.
While SAMI data alone allow us to determine what happens to z ∼ 0 star-forming satellites at the start of their quenching phase, cosmological simulations are invaluable to properly reconstruct the evolution of passive satellites (i.e. galaxies with Δ(SFR) < 1 dex). By comparing our findings with predictions from the EAGLE hydrodynamical simulation, we demonstrate that the difference in spin parameter between satellites and centrals must be interpreted as just an upper limit of the true structural transformation experienced by satellites after infall.
Indeed, at least within the framework of EAGLE, the difference in spin between central and satellites at z ∼ 0 (Δ(V/σ)) is always larger than the actual loss experienced by satellites since infall (Δ(V/σ)true). This is because most of the observed difference at z ∼ 0 is due to the star-forming central population acquiring additional angular momentum in the last few billion years, rather than satellites losing it via environmental effects during the quenching phase. This is summarized in the cartoon presented in Fig. 6, which illustrates why Figs 4 and 5 are so different.
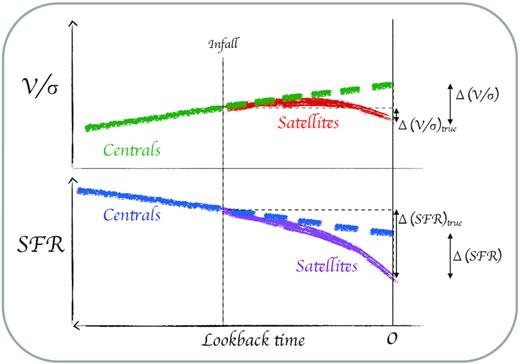
A cartoon summarizing the evolutionary scenario emerging from this work and the potential effect of progenitor bias. The top panel shows the increase of V/σ with decreasing lookback time/redshift for galaxies while being star-forming centrals (solid green line), and the change in V/σ once they become satellites (red line). The green dashed line shows the expected evolution of V/σ in case the galaxy would have remained a star-forming central until z ∼ 0. The true Δ(V/σ) and the value obtained via our matching technique are shown by the black vertical arrows. The bottom panel shows the case of SFR, with the changes for centrals and satellites highlighted by the blue and pink lines, respectively. In this case, the observed Δ(SFR) at z ∼ 0 is always smaller than the real value.
From theoretical models of structure formation (e.g. White 1984; Mo, Mao & White 1998), hydrodynamical simulations (e.g. Pedrosa & Tissera 2015; Lagos et al. 2017), and recent observations (e.g. Simons et al. 2017; Swinbank et al. 2017), we see that star-forming central disc galaxies gradually increase their spin with time (solid green line in the top panel), due to the continuing accretion of gas that, on average, is expected to bring high specific angular momentum (e.g. Catelan & Theuns 1996; El-Badry et al. 2018). The typical increase expected in the stellar spin parameter from z ∼ 1 to 0 is ∼0.3 dex in our stellar mass range (Lagos et al. 2017), consistent with the observed decrease in gas velocity dispersion (Wisnioski et al. 2015; Simons et al. 2017) and increase in gas specific angular momentum (Swinbank et al. 2017). After infall, the spin of satellite galaxies either remains constant or slightly decreases (solid red line), whereas centrals keep acquiring angular momentum (dashed green line). Thus, the difference observed at z ∼ 0 between centrals and satellites is always larger than the real change in V/σ experienced by satellite galaxies. The situation is opposite in the case of the SFR. On average, a galaxy’s star formation activity is decreasing over time (solid blue line; e.g. Madau et al. 1996). Thus, when centrals become satellites the effect of environment is simply to accelerate this decrease. As such, the difference in SFR observed at z ∼ 0 is always lower than the decrease experienced by satellites since infall. In EAGLE we know the properties at infall, so we can relate z ∼ 0 satellites to their progenitors. In the observations, we are forced to compare satellites to z ∼ 0 central, missing the changes that centrals themselves have experienced since the time of infall of satellites into their haloes.
Our results demonstrate that the first and most important phase in the transformation of satellites is quenching, i.e. a significant reduction in their star formation activity. Changes in stellar kinematic properties (i.e. structure) – if any – become evident at a later stage and are on average minor, such that satellites remain rotationally dominated. This is consistent with a scenario in which multiple physical processes – acting on different time-scales – may play a significant role in altering the evolutionary history of galaxies in groups and clusters. Indeed, while many physical processes (e.g. ram pressure, tidal stripping) are able to start actively removing the gas reservoir of galaxies and initiate the quenching phase soon after infall, it can take a significantly longer time for low-speed gravitational interactions and/or minor mergers to change the kinematic properties of satellites. However, detailed analysis and modelling of objects occupying different regions in the Δ(SFR) versus Δ(V/σ) is required to properly isolate the physical processes acting on satellite galaxies. Moreover, it is important to remember that our results are valid for galaxies with stellar masses greater than 1010 M⊙ and cannot be blindly extrapolated to lower stellar masses.
Thanks to the way Δ(SFR) and Δ(V/σ) are quantified for both SAMI and EAGLE galaxies, they automatically incorporate the effect of any pre-processing on galaxy transformation, i.e. environmental effects experienced by galaxies while satellites in a halo different from the one occupied at z ∼ 0. Thus, our results also suggest that in current numerical simulations pre-processing has a limited effect on the structural properties of satellite galaxies, contrary to what is commonly assumed (e.g. Zabludoff & Mulchaey 1998; Cortese et al. 2006).
ACKNOWLEDGEMENTS
We thank the referee for useful comments and suggestions that improved the clarity of this paper.
LC is the recipient of an Australian Research Council Future Fellowship (FT180100066) funded by the Australian Government. This research was conducted by the Australian Research Council Centre of Excellence for All Sky Astrophysics in 3 Dimensions (ASTRO 3D), through project number CE170100013. JvdS is funded under Bland-Hawthorn’s ARC Laureate Fellowship (FL140100278). CPL has received funding from a Discovery Early Career Researcher Award (DE150100618) and the MERAC Foundation for a Post-doctoral Research Award. SB acknowledges the funding support from the Australian Research Council through a Future Fellowship (FT140101166). MSO acknowledges the funding support from the Australian Research Council through a Future Fellowship (FT140100255).
The SAMI Galaxy Survey is based on observations made at the Anglo-Australian Telescope. The Sydney-AAO Multi-object Integral field spectrograph (SAMI) was developed jointly by the University of Sydney and the Australian Astronomical Observatory. The SAMI input catalogue is based on data taken from the Sloan Digital Sky Survey, the GAMA Survey, and the VST ATLAS Survey. The SAMI Galaxy Survey is supported by the Australian Research Council Centre of Excellence for All Sky Astrophysics in 3 Dimensions (ASTRO 3D), through project number CE170100013, the Australian Research Council Centre of Excellence for All-sky Astrophysics (CAASTRO), through project number CE110001020, and other participating institutions. The SAMI Galaxy Survey website is http://sami-survey.org/
GAMA is a joint European–Australasian project based around a spectroscopic campaign using the Anglo-Australian Telescope. The GAMA input catalogue is based on data taken from the Sloan Digital Sky Survey and the UKIRT Infrared Deep Sky Survey. Complementary imaging of the GAMA regions is being obtained by a number of independent survey programs including GALEX MIS, VST KiDS, VISTA VIKING, WISE, Herschel-ATLAS, GMRT, and ASKAP providing UV to radio coverage. GAMA is funded by the STFC (UK), the ARC (Australia), the AAO, and the participating institutions. The GAMA website is http://www.gama-survey.org/.
Part of this work was performed on the gSTAR national facility at Swinburne University of Technology. gSTAR is funded by Swinburne and the Australian Government’s Education Investment Fund.
We acknowledge the Virgo Consortium for making their simulation data available. The EAGLE simulations were performed using the DiRAC-2 facility at Durham, managed by the ICC, and the PRACE facility Curie based in France at TGCC, CEA, Bruyeres-le-Chatel.
Footnotes
See also Harborne et al. (2019) for an independent test of these corrections.
REFERENCES
APPENDIX A: THE EFFECT OF BEAM SMEARING
The typical seeing of SAMI observations is a significant fraction of the effective radius of the targeted galaxies. Thus, beam smearing could systematically bias our estimates of the V/σ ratio. In this paper, we adopted stringent quality cuts (re > 2 arcsec and re > 2.5 HWHM) to define our final sample, and minimize the effect of beam smearing. However, it is unquestionable that even for the final sample, our estimates of V/σ have been systematically lowered by the atmospheric conditions during the observations.
Fig. A1 shows the median and 20–80 per cent percentile ranges of Δ(V/σ) in bins of Δ(SFR) for the uncorrected (green line; used in the main paper) and corrected (using equation A3; red line) final sample, respectively. We find that beam smearing has a noticeable effect for galaxies with large negative Δ(SFR), and is almost negligible close to the main sequence. This mainly reflects the difference in apparent size and Sérsic index between passive satellites and star-forming centrals, which translates into a larger correction for passive systems (see equation A1). This shows that, if any, the effect of beam smearing would be to further reduce the change in Δ(V/σ) experienced by satellites during their quenching phase, thus reinforcing the main conclusions of this paper.
Variations in stellar V/σ and SFR for satellite galaxies with respect to our control sample of main-sequence, high V/σ centrals. Dashed lines and cyan bands show the average and standard deviation for the control sample. The green line and shaded region show the running median and 20–80 per cent percentile ranges for Δ(V/σ) in bins of Δ(SFR) for the final sample used in this paper. The red line and shaded regions show how our results would change if we were to apply a beam smearing correction based on the work by Graham et al. (2018).
