


Abstract
We study the physical properties of the ionized gas in local discs using the sample of 38 nearby ∼108.5–11.2 M⊙ Star-Forming Main-Sequence (SFMS) galaxies observed so far as part of the MUSE Atlas of Disks (MAD). Specifically, we use all strong emission lines in the MUSE wavelength range 4650–9300 Å to investigate the resolved ionized gas properties on ∼100 pc scales. This spatial resolution enables us to disentangle H ii regions from the diffuse ionized gas (DIG) in the computation of gas metallicities and star formation rates (SFRs) of star-forming regions. The gas metallicities generally decrease with radius. The metallicity of the H ii regions is on average ∼0.1 dex higher than that of the DIG, but the metallicity radial gradient in both components is similar. The mean metallicities within the inner galaxy cores correlate with the total stellar mass of the galaxies. On our < 100 pc scales, we find two correlations previously reported at kpc scales: a spatially resolved mass–metallicity relation (RMZR) and a spatially resolved SFMS (RSFMS). We find no secondary dependence of the RMZR with the SFR density. We find that both resolved relations have a local origin, as they do not depend on the total stellar mass. The observational results of this paper are consistent with the inside-out scenario for the growth of galactic disks.
1 INTRODUCTION
The emission line spectrum emitted by ionized gas is the observational key to the properties of not only the ionized gas in galaxies, but also of the massive young stellar population that has recently formed inside galactic discs, as the line fluxes are a direct tracer of the properties of the H ii regions that are ionized by such a population. Also, far from and in-between H ii regions, diffuse ionized gas (DIG; also known as warm ionized medium) adds further information about the global gas-stellar cycle that is globally sustained within galactic discs. The DIG is warm (∼104 K), ionized, low-density (0.1 cm−3) gas with a low-ionization parameter that can extend 1 kpc or more above the disc plane (see Mathis 2000 and Haffner et al. 2009 for reviews). Most of the ionized gas in a galaxy is in the form of DIG (Walterbos 1998). This gas component is understood to be ionized by stars (O, B, and hot evolved stars) in the disc whose Lyman continuum photons travel large path lengths (non-local sources of ionization), and its emission is superimposed on that coming from the local ionization inside H ii regions (Mathis 1986, 2000; Domgorgen & Mathis 1994; Sembach et al. 2000; Wood & Mathis 2004; Wood et al. 2010). This component can be pushed above the galactic disc by superbubbles created by supernova events (e.g. Wood et al. 2010). Weilbacher et al. (2018) recently found that the UV photons leaked by the H ii regions in the Antennae can explain the ionization of the DIG there.
The metallicity of the gas phase [referred to as Zgas ≡ 12 + log(O/H), oxygen abundance or metallicity throughout this paper] is a product of the whole formation and evolutionary history of a galaxy. Oxygen is synthesized in high-mass stars and can be released into the interstellar medium (ISM) via supernova explosions or into the circumgalactic medium through galactic outflows. In addition, pristine metal-poor gas may accrete during the evolution of the galaxy (see e.g. Sánchez Almeida et al. 2014 and references therein), changing the metallicity of a galaxy but also triggering star formation (SF) that would enrich the galactic disc. On global galactic scales, the relationship between total galaxy stellar mass and total gas metallicity (i.e. the mass–metallicity relation, MZR) is well established over a wide range of galaxy masses (e.g. Lequeux et al. 1979; Tremonti et al. 2004; Lee et al. 2006; Kewley & Ellison 2008; Zhao, Gao & Gu 2010). The MZR has been shown to evolve with redshift (e.g. Savaglio et al. 2005; Erb et al. 2006; Maier et al. 2006; Maiolino et al. 2008; Onodera et al. 2016).
Although still controversial (Barrera-Ballesteros et al. 2017; Sánchez et al. 2017, 2018), it has also been argued that the total star formation rate (SFR) is a second parameter in the MZR (with SFR being anticorrelated with gas metallicity), and that possibly the three-parameter relation of mass, gas metallicity, and SFR is universal at all epochs (Ellison et al. 2008; Lara-López et al. 2010; Mannucci et al. 2010). This so-called ‘Fundamental Metallicity Relation’ (FMR) is well explained by self-regulated ‘bathtub’ galaxy evolution models (e.g. Bouché et al. 2010; Lilly et al. 2013). Lilly et al. (2013) showed that the FMR emerges naturally in their ‘regulator’ model, due to the fact that the evolution of the specific SFR, sSFR, closely follows the specific accretion rate of dark matter haloes. However, other ‘regulator’ models identify different parameters as the key drivers of the internal galactic (semi-)equilibrium (e.g. Finlator & Davé 2008; Davé, Finlator & Oppenheimer 2012; Forbes et al. 2014). Studying the relationship between Zgas, M⋆, and SFR is important to understand the relative importance of different physical parameters in establishing the physical balance within galactic discs (Lilly et al. 2013; Ma et al. 2016).
Important details are coming from the novel Integral Field Unit spectrographs (IFUs), which are enabling the study of the existence and properties of MZR- and FMR-equivalent relationships on resolved local scales within individual galaxies. The resolved spectra enable us not only to disentangle H ii regions from DIG emission, and gas with SF excitation properties from gas that is excited by shocks and/or active galactic nuclei (AGNs), but also to understand whether the global MZR, FMR, and Star-Forming Main-Sequence (SFMS) relations emerge from averaging the local contributions to the total mass, metallicity, and SFR. Several IFU surveys such as the Calar Alto Legacy Integral Field Area (CALIFA; Sánchez et al. 2012a), Mapping Nearby Galaxies at Apache Point Observatory (MaNGA; Bundy et al. 2015), SAMI Galaxy Survey (Croom et al. 2012), and others have investigated the relation between stellar surface mass density (Σ⋆), SFR surface density, and gas metallicity resolved on kpc scales within galaxies (e.g. Rosales-Ortega et al. 2012; Barrera-Ballesteros et al. 2016; Barrera-Ballesteros et al. 2017; Sánchez et al. 2017, 2018). While Rosales-Ortega et al. (2012) find a local FMR, Sánchez et al. (2013), Barrera-Ballesteros et al. (2017), and Sánchez et al. (2017, 2018) find a lack of a secondary relation between the MZR and the SFR at one effective radius (Re). Using IFU data, Cano-Díaz et al. (2016) and Hsieh et al. (2017), and Medling et al. (2018) among others, have studied the relationship between Σ⋆ and ΣH α (or ΣSFR) on kpc scales, finding a resolved SFMS (RSFMS) relation at these kpc scales.
The availability of spatially resolved information for the ionized gas component of galactic discs also enables more detailed determination of the radial profiles of oxygen abundances within galaxies, i.e. of gas metallicity gradients within the discs. Their shape, together with the azimuthal variations around the radial gradients, adds crucial information on the past chemical enrichment histories of the whole galaxies and their main structural components such as bulges, bars, and discs. The above-mentioned IFU surveys, which disentangle the ionized gas within galaxies on kpc-sized scales, have shown that negative gas metallicity gradients, i.e. outward-decreasing metallicity profiles, are quite common in the local Universe (e.g. Sánchez et al. 2012b, 2014; Sánchez-Menguiano et al. 2018). Importantly, however, the precise shape of these gradients depends on the specific metallicity calibrator that is adopted to convert line fluxes into oxygen abundances (e.g. Sánchez-Menguiano et al. 2016, 2018; Vogt et al. 2017).
The overall result of widespread negative gas metallicity gradients is not very surprising, given that inward gas flows over the lifetime of a galaxy would almost inevitably cause radial metallicity gradients like those observed (e.g. Lacey & Fall 1985). Such negative gradients are also however consistent with an inside-out formation scenario of the discs, which is reasonable to expect for cosmological reasons (e.g. White & Frenk 1991; Mo, Mao & White 1998). Other processes such as secular evolution, radial migration, and merging can also occur over cosmic time; in general, their global effect seems to be in the direction of flattening these profiles within a large radial extent (e.g. Vila-Costas & Edmunds 1992a; Friedli, Benz & Kennicutt 1994; Martin & Roy 1994, 1995; Zaritsky, Kennicutt & Huchra 1994; Friedli & Benz 1995; Vilchez & Esteban 1996; Roy & Walsh 1997; Portinari & Chiosi 2000; Marino et al. 2012, 2016; Cavichia et al. 2014).
The Multi Unit Spectroscopic Explorer (MUSE; Bacon et al. 2010) spectrograph on the Very Large Telescope (VLT) of the European Southern Observatory (ESO) is opening a new avenue of studies of far and near galactic populations. In particular, MUSE, within its field of view (FoV) of 1 arcmin2, delivers higher combination of spatial and spectral resolutions than any other current instrument. Targeting a sample of ∼50 disc galaxies that are close enough to be dissected by MUSE at an average spatial resolution of ∼100 pc or less, our MUSE Atlas of Disks (MAD) survey (Carollo et al., in preparation) provides a new view of the local disc population on the small physical scales that are relevant for probing the physical conditions on which gas and stars directly affect each other and thus the physical origin of the global state of galactic discs. The MAD sample covers the galaxy mass range between 108.5 and 1011 M⊙ and traces, within this range, the so-called ‘SFMS’ relation between total stellar mass and total SFR (SFMS; Daddi et al. 2007; Elbaz et al. 2007; Noeske et al. 2007; Peng et al. 2010; Tomczak et al. 2016).
In this paper, we focus our attention on the physical properties of the ionized gas inside the 38 MAD galaxies observed and analysed so far, with emphasis on the gas metallicity and SFR of both H ii and DIG components. Companion articles will present other aspects of the MAD survey, including its specifications and goals (MAD1; Carollo et al. in preparation), the main properties of stellar and gas kinematics across the SFMS (MAD3; den Brok et al. in preparation) and the analysis of the stellar continuum and line absorption spectra for stellar ages, abundances, and abundance ratio determinations (MAD4; Onodera et al. in preparation). More specifically, exploiting the unprecedented <100 pc resolution of the MAD data, in this paper we separate the emission of H ii and DIG regions and give an overview of the SFRs and metallicities of the star-forming regions at our sub-kpc scales. We also study the relations between surface stellar mass density, gas metallicity, and surface SFR density separately for the H ii regions and for the surrounding DIG to understand how the chemical enrichment happens at these local scales and across the SFMS.
This paper is organized as follows. Section 2 describes the MAD sample that we use in this study and the basic data reduction; Section 3 describes the analysis performed on MUSE data in order to obtain the line flux diagnostics on which we base this study, including correction for dust effects. Section 4 presents the basic diagnostics. The results are presented in Section 5 and discussed in Section 6. We summarize in Section 7. In Appendix A, we provide additional information on the individual galaxies and show their flux and derived-diagnostic maps; the latter are available for download together with the reduced MUSE cubes.1 Throughout this paper, we adopt an H0 = 73 ± 5 km s−1 Mpc−1 and 1 arcsec corresponds to ≈50 pc at a distance of 10 Mpc.
2 MAD DATA
2.1 The sample
We analyse 38 galaxies, out of which 36 were observed during the MAD Guaranteed Time Observation (GTO) runs conducted between 2015 April and 2017 September, plus NGC 337 from the MUSE Commissioning Programme 60.A-9100(C) and NGC 1097 from the Time Inference with MUSE in Extragalactic Rings survey (TIMER; Gadotti et al. 2019). These 36 constitute all the MAD observations before the AO was mounted on the VLT. A detailed table with the properties of the MAD galaxies and description of their observations is presented in MAD1. In Table 1, we present some of the global properties of the 38 galaxies studied in this paper. Briefly, these galaxies are nearby (|$z$| < 0.013), spiral galaxies with an inclination <70° and stellar masses between 108.5 and 1011.2 M|$\odot$|, which lie in the |$z$| = 0 SFMS. They show a variety of structural components (bars, star-forming rings, AGN, bulges, and pseudo-bulges).
Global properties of the 38 MAD galaxies studied in this paper, ordered by total stellar mass. Column I: Galaxy name. Column II: Morphological classification from The Third Reference Catalogue of Bright Galaxies (RC3; de Vaucouleurs et al. 1991). Columns III and IV: Galaxy redshift and adopted values of the distances, from the NASA/IPAC Extragalactic Database (NED). Column V: Effective radius in arcsec, obtained from 2D decomposition to photometric images (procedure explained in MAD1). Columns VI and VII: Total stellar mass and SFR, computed from spectral energy distribution (SED) fitting (details given in MAD1). Column VIII: Average gas metallicity inside 0.5 Re. Columns IX and X: Metallicity gradient for all the regions computed when normalizing the galactocentric distance by Re and by physical distance, respectively.
| Galaxy name | Morphology | |$z$| | D | Re | log(M⋆) | SFR | 〈Zgas〉0.5Re | ▽Zgas | ▽Zgas |
|---|---|---|---|---|---|---|---|---|---|
| (Mpc) | (arcsec) | log(M|$\odot$|) | (M|$\odot$| yr−1) | (dex) | (dex/Re) | (dex/kpc) | |||
| NGC 4030 | SA(s)bc | 0.004 887 | 29.9 | 31.8 | 11.18 | 11.08 | 9.00 ± 0.07 | −0.13 ± 0.01 | −0.03 ± 0.01 |
| NGC 3521 | SAB(rs)bc | 0.002 672 | 14.2 | 61.7 | 11.15 | 2.98 | 8.85 ± 0.06 | −0.09 ± 0.02 | −0.02 ± 0.01 |
| NGC 3256 | pec | 0.009 354 | 38.4 | 26.6 | 11.14 | 3.10 | 8.77 ± 0.09 | −0.04 ± 0.04 | −0.01 ± 0.01 |
| NGC 4603 | SA(s)c? | 0.008 647 | 32.8 | 44.7 | 11.10 | 0.65 | 8.82 ± 0.10 | −0.17 ± 0.04 | −0.02 ± 0.01 |
| NGC 3393 | (R’)SB(rs)a? | 0.012 509 | 55.2 | 21.1 | 11.09 | 7.06 | 8.86 ± 0.02 | 0.04 ± 0.02 | 0.01 ± 0.01 |
| NGC 1097 | SB(s)b | 0.004 240 | 16.0 | 55.1 | 11.07 | 4.66 | 8.99 ± 0.08 | −0.07 ± 0.08 | −0.03 ± 0.01 |
| NGC 289 | SB(rs)bc | 0.005 434 | 24.8 | 27.0 | 11.00 | 3.58 | 8.93 ± 0.11 | −0.09 ± 0.03 | −0.03 ± 0.01 |
| NGC 4593 | (R)SB(rs)b | 0.009 000 | 25.6 | 63.3 | 10.95 | 4.10 | 8.94 ± 0.14 | −0.38 ± 0.01 | −0.01 ± 0.02 |
| IC 2560 | (R’)SB(r)b? | 0.009 757 | 32.2 | 37.8 | 10.89 | 3.76 | 8.81 ± 0.11 | −0.05 ± 0.04 | −0.01 ± 0.01 |
| NGC 5643 | SAB(rs)c | 0.003 999 | 17.4 | 60.7 | 10.84 | 1.46 | 8.82 ± 0.11 | −0.25 ± 0.12 | −0.06 ± 0.03 |
| NGC 3081 | (R)SAB0/a(r) | 0.007 976 | 33.4 | 18.9 | 10.83 | 1.47 | 8.97 ± 0.08 | −0.08 ± 0.01 | −0.02 ± 0.01 |
| NGC 4941 | (R)SAB(r)ab? | 0.003 696 | 15.2 | 64.7 | 10.80 | 3.01 | 8.93 ± 0.13 | −0.22 ± 0.02 | −0.06 ± 0.02 |
| NGC 5806 | SAB(s)b | 0.004 533 | 26.8 | 27.2 | 10.70 | 3.61 | 8.84 ± 0.07 | −0.04 ± 0.02 | 0.00 ± 0.01 |
| NGC 3783 | (R’)SB(r)ab | 0.009 730 | 40.0 | 27.7 | 10.61 | 6.93 | 8.82 ± 0.06 | −0.04 ± 0.01 | −0.01 ± 0.01 |
| NGC 5334 | SB(rs)c? | 0.004 623 | 32.2 | 51.2 | 10.55 | 2.45 | 8.64 ± 0.11 | −0.30 ± 0.03 | −0.05 ± 0.01 |
| NGC 7162 | SA(s)c | 0.007 720 | 38.5 | 18.0 | 10.42 | 1.73 | 8.76 ± 0.06 | −0.11 ± 0.01 | −0.03 ± 0.01 |
| NGC 1084 | SA(s)c | 0.004 693 | 20.9 | 23.8 | 10.40 | 3.69 | 8.69 ± 0.05 | −0.11 ± 0.01 | −0.05 ± 0.01 |
| NGC 1309 | SA(s)bc? | 0.007 125 | 31.2 | 20.3 | 10.37 | 2.41 | 8.57 ± 0.04 | −0.11 ± 0.01 | −0.04 ± 0.01 |
| NGC 5584 | SAB(rs)cd | 0.005 464 | 22.5 | 63.5 | 10.34 | 1.29 | 8.49 ± 0.10 | −0.31 ± 0.03 | −0.05 ± 0.01 |
| NGC 4900 | SB(rs)c | 0.003 201 | 21.6 | 35.4 | 10.24 | 1.00 | 8.67 ± 0.08 | −0.15 ± 0.02 | −0.04 ± 0.01 |
| NGC 7496 | SB(s)b | 0.005 365 | 11.9 | 66.6 | 10.19 | 1.80 | 8.71 ± 0.10 | −0.17 ± 0.04 | −0.05 ± 0.01 |
| NGC 7552 | (R’)SB(s)ab | 0.005 500 | 14.8 | 26.0 | 10.19 | 0.59 | 8.93 ± 0.13 | −0.12 ± 0.03 | −0.06 ± 0.02 |
| NGC 1512 | SB(r)a | 0.002 995 | 12.0 | 63.3 | 10.18 | 1.67 | 8.79 ± 0.06 | – | −0.03 ± 0.01 |
| NGC 7421 | SB(rs)bc | 0.005 979 | 25.4 | 29.6 | 10.09 | 2.03 | 8.81 ± 0.12 | −0.18 ± 0.02 | −0.05 ± 0.01 |
| ESO 498-G5 | SAB(s)bc pec | 0.008 049 | 32.8 | 19.8 | 10.02 | 0.56 | 8.78 ± 0.09 | −0.02 ± 0.02 | 0.00 ± 0.01 |
| NGC 1042 | SAB(rs)cd | 0.004 573 | 15.0 | 63.7 | 9.83 | 2.41 | 8.76 ± 0.12 | −0.14 ± 0.01 | −0.03 ± 0.02 |
| IC 5273 | SB(rs)cd? | 0.004 312 | 15.6 | 33.8 | 9.82 | 0.83 | 8.46 ± 0.08 | −0.13 ± 0.01 | −0.04 ± 0.01 |
| NGC 1483 | SB(s)bc? | 0.003 833 | 24.4 | 19.0 | 9.81 | 0.43 | 8.27 ± 0.09 | −0.10 ± 0.01 | −0.05 ± 0.01 |
| NGC 2835 | SB(rs)c | 0.002 955 | 8.8 | 57.4 | 9.80 | 0.38 | 8.64 ± 0.10 | −0.27 ± 0.03 | −0.08 ± 0.01 |
| PGC 3853 | SAB(rs)d | 0.003 652 | 11.3 | 73.1 | 9.78 | 0.35 | 8.57 ± 0.10 | −0.31 ± 0.01 | −0.06 ± 0.02 |
| NGC 337 | SB(s)d | 0.005 490 | 18.9 | 24.6 | 9.77 | 0.57 | 8.36 ± 0.08 | −0.12 ± 0.01 | −0.05 ± 0.01 |
| NGC 4592 | SA(s)dm? | 0.003 566 | 11.7 | 37.9 | 9.68 | 0.31 | 8.15 ± 0.08 | −0.06 ± 0.01 | −0.03 ± 0.01 |
| NGC 4790 | SB(rs)c? | 0.004 483 | 16.9 | 17.7 | 9.60 | 0.39 | 8.47 ± 0.08 | −0.09 ± 0.01 | −0.04 ± 0.01 |
| NGC 3513 | SB(rs)c | 0.003 983 | 7.8 | 55.4 | 9.37 | 0.21 | 8.46 ± 0.09 | −0.29 ± 0.06 | −0.13 ± 0.01 |
| NGC 2104 | SB(s)m pec | 0.003 873 | 18.0 | 16.5 | 9.21 | 0.24 | 8.25 ± 0.07 | −0.08 ± 0.01 | −0.05 ± 0.01 |
| NGC 4980 | SAB(rs)a pec? | 0.004 767 | 16.8 | 13.0 | 9.00 | 0.18 | 8.15 ± 0.10 | −0.06 ± 0.01 | −0.05 ± 0.01 |
| NGC 4517A | SB(rs)dm? | 0.005 087 | 8.7 | 46.8 | 8.50 | 0.10 | 8.27 ± 0.12 | −0.15 ± 0.10 | −0.13 ± 0.01 |
| ESO 499-G37 | SAB(s)d? | 0.003 186 | 18.3 | 18.3 | 8.47 | 0.14 | 8.00 ± 0.14 | −0.01 ± 0.02 | 0.00 ± 0.01 |
2.2 Observations
The data cubes studied in this paper have the MUSE spatial sampling of 0|${^{\prime\prime}_{.}}$|2 and spectral sampling of 1.25 Å. These MAD galaxies were observed with the wide field (i.e. FoV of 1 arcmin2) and nominal modes (i.e. wavelength range from 4650 to 9300 Å) for 1 h on target, with seeing values between 0|${^{\prime\prime}_{.}}$|4 and 0|${^{\prime\prime}_{.}}$|9. Offset sky observations were taken before or after the target observations in order to subtract the sky. With one pointing per galaxy (targeting the central 1 arcmin2), the spatial coverage varies from 0.3 to 4 Re (from 3 to 15 kpc on physical scale).
2.3 Data reduction
The details of the basic data reduction are fully described in MAD1. Briefly, the data were reduced using the MUSE pipeline (Weilbacher et al. 2012). This initial basic reduction step includes bias and dark subtraction, flat fielding, wavelength calibration, and drizzling of the different IFU slices into one final data cube for each individual exposure. Each of the individual data cubes were then aligned, sky-subtracted with the Zurich Atmosphere Purge (zap; Soto et al. 2016) algorithm, median-combined using a 10σ clipping algorithm to remove cosmic rays until finally obtaining one single MUSE data cube per galaxy.
3 FITS TO EMISSION LINES: METHODOLOGY
The MUSE spectral coverage includes several strong emission lines including H β, [O iii]λ4959, [O iii]λ5007, [N ii]λ6548, H α, [N ii]λ6583, [S ii]λ6717, and [S ii]λ6731. The MUSE spectra of a number of galaxies (in some spatial regions) also show weaker emission lines. The analysis of these additional lines will be reported in forthcoming papers.
We correct each spectrum for Milky Way extinction using the E(B − V) values from NED. These values are obtained from the Schlafly & Finkbeiner (2011) recalibration of the Schlegel, Finkbeiner & Davis (1998) dust map. This recalibration assumes a Fitzpatrick (1999) reddening law with RV = 3.1.
3.1 Subtraction of the stellar continuum
We removed the contribution of the stellar components from the spectra in order to obtain pure emission line spectra (assuming that contamination to the continuum from nebular emission can be neglected, see e.g. Byler et al. 2017; MAD4). The continuum-fitting procedure is explained in detail in MAD4. Briefly, the stellar continuum was computed by performing full spectral fitting to each spectrum using the pPXF package (Cappellari & Emsellem 2004) with the ELODIE stellar libraries (Le Borgne et al. 2004) between Z = 0.004 and 0.1 and ages between 1 Myr and 13 Gyr. To increase the accuracy of the continuum fits, the 2D spectra were tessellated using the Voronoi adaptive binning package of Cappellari & Copin (2003) so as to achieve a signal-to-noise ratio (S/N) of 50 in each Voronoi cell in the wavelength range 5650–5750 Å (i.e. a region without emission lines).
The best-fitting stellar continuum determined for each cell was subtracted, after rescaling in flux, from the total spectrum in each spaxel encompassed within that cell, resulting in a pure emission line spectrum for each spaxel. This step assumes that the stellar properties are identical for each spaxel within a Voronoi cell, which is not necessarily true; it is however a good compromise that avoids fitting the stellar continua to poor S/N data, which would lead to unreliable results.
3.2 Determination of the stellar mass surface density
We use in this paper the stellar mass surface density maps, Σ⋆, derived by fitting stellar population models to the stellar continuum spectra of our galaxies; details about these fits are provided in MAD1 and MAD4. Briefly, a second continuum fitting was performed on the stellar Voronoi tessellation (S/N = 50 on the continuum) in order to get ages, metallicities, and Σ⋆. This second pPXF run was done using the stellar templates from miles (Sánchez-Blázquez et al. 2006). A discussion of the robustness of pPXF when obtaining these stellar properties can be found in Ge et al. (2018) and MAD4.
Then, we transform the resulting Σ⋆ map to a spaxel-by-spaxel map, assuming that the continuum is the same at each stellar Voronoi bin.
3.3 Emission line fitting
The Voronoi tessellation performed on the stellar continuum is not ideal for constructing 2D maps of the emission line signal. First, the regions where the stellar continuum is brightest may not coincide with the H ii regions or generally with regions of high emission line flux. Secondly, the Voronoi binning based on the stellar continuum may lead to dilution of the emission line flux within a cell; important but weak emission lines may disappear within a stellar Voronoi bin.
We therefore performed the study of the emission line features in a spaxel-by-spaxel basis, masking those where the S/N < 3 in all the studied lines. Taking into account the data from all the galaxies in this paper, the total number of spaxels are ∼1330 000, with a median physical scale of 20 pc. In each spaxel, the emission spectrum may have contributions from several physical sources of emission such as narrow and/or broad AGN emission, inflows and/or outflows that give rise to blue-/red-shifted lines relative to the bulk disc emission, and so on. We see, at some physical locations, clear double components in at least 4 of our 38 galaxies, namely NGC 3256 (a merger relic; de Vaucouleurs 1956), NGC 5643 (a Seyfert-2 galaxy; Condon et al. 1998), and NGC 7496 and NGC 7552 (LIRG; Sanders et al. 2003). We nevertheless assumed in the current analysis that each line is well described by a single Gaussian profile. The use of multiple-component decompositions of the emission line spectra is postponed to future papers.
To obtain the pure emission line fluxes, we simultaneously fitted two independent groups of emission lines. Specifically, we fit H β and H α together and, in the other group, we performed a simultaneous fit to the [O iii]λ4959, [O iii]λ5007, He iλ5876, [O i]λ6300, [N ii]λ6548, [N ii]λ6583, [S ii]λ6717, and [S ii]λ6731 lines. The fits were carried out by assuming identical velocities and velocity dispersions for each line inside each of the groups. In the following, we focus on the analysis of the emission line diagnostics based on line fluxes and flux ratios, in order to investigate the SF, ionization, and metallicity properties of the ionized gas.
3.4 Uncertainties on emission line fluxes
In order to assess the uncertainty in the emission line fluxes, we estimate the errors in the fitting code plus residuals due to continuum subtraction imperfections.
First, we use 100 000 simulated spectra of a Gaussian emission line to test our fits to the observed spectra. Specifically, we create 1000 simulated spectra for each value of S/N between 1 and 100 (in S/N steps of 1), and fit the resulting spectra using both the same software and approach used for our observed spectra. The errors on the uncertainties of the emission line flux reach about 10 per cent in the low S/N≲3 regime, decreasing to about 2 per cent for higher S/N values.
Secondly, systematic errors due to uncertainties in the continuum subtraction must be added to the error budget. Pessimistic errors for the H α flux estimates can be inferred by considering the maximum stellar absorption equivalent width (EW), which are ∼50 Å for the youngest regions (higher than the corrections proposed for the granada models; González Delgado et al. 2005). To place empirical limits on the incorrect stellar continuum subtraction on our emission line flux estimates, we perform a simple test on our observed spectra. Specifically, we extract four ‘extreme’ stellar absorption spectra from the four corners of the stellar age versus stellar metallicity plane that includes all stellar spaxels for the whole galaxy sample (5 and 95 per cent of the cumulative distribution function of both age and metallicity distributions; see MAD4 for details). We then represent those ‘extreme’ spectra covered by our sample through Single Stellar Population models with age and metallicity values close to those spectra; the four templates combine ages of 1.6 and 12.00 Gyr with metallicities of Z = 0.0004 and 0.1, respectively.
We then subtract from each total spectrum in each of the four age–metallicity corners not only its optimal stellar continuum spectrum but also the other three age–metallicity combinations, i.e. also the ‘maximally inaccurate’ stellar continua. We calculate the emission line fluxes from the four resulting spectra, and compare the distribution of line fluxes produced by the four continuum subtractions. From this test, we estimate that stellar continuum subtraction errors produce uncertainties on the H α and H β fluxes of the order of 4 per cent for S/N = 10, decreasing to 2 per cent for S/N = 20 and 1 per cent for S/N = 40. We take these conservative errors as fiducial systematic errors arising from a possibly incorrect continuum subtraction from our spectra.
3.5 Dust correction and dust-corrected emission line flux maps
These dust-corrected emission line flux maps were then used to compute the gas diagnostic maps analysed in this paper. The dust-corrected line emission flux maps and the dust-correction maps of each galaxy are presented in Appendix A.
4 DIAGNOSTICS OF IONIZED GAS AT MAD RESOLUTION
The high spatial resolution of the MUSE data enables us to handle two key issues that are of importance in the determination of the SFR densities and gas metallicities inside disc galaxies. Specifically, we are able to (i) compute SFRs and gas metallicities largely unaffected by contamination from regions of non-thermal emission; and (ii) establish the relative contributions to the SFR of compact H ii regions and the diffuse component, as well as the separate contributions of these components to gas metallicities. Previous 2D spectroscopic surveys have looked into these issues as well, e.g. CALIFA, MaNGA, and SAMI (Croom et al. 2012); but the ∼10 times higher spatial resolution of the MAD data boosts the ability to disentangle the different components, in addition to providing information on scales that are still largely unexplored in terms of a systematic study as a function of the location on the SFMS.
4.1 Resolved BPT diagrams
We use the well-known [O iii]/H β versus [N ii]/H α Baldwin, Phillips & Terlevich (hereafter BPT; Baldwin, Phillips & Terlevich 1981) diagram to identify regions within the galaxies that are ionized by UV radiation from newly born stars (regions of star formation – hereafter, the SF gas) and regions that are ionized by AGN-emitted radiation, shocks, or AGB stars. In these diagrams (e.g. Fig. 1), the upper, solid line is the photoionization model of Kewley et al. (2001), which defines the upper envelope of the region of parameter space occupied by extreme starbursts; this line is a conservative boundary between SF gas and AGN/shocks. The lower, dashed line shows an equivalent but empirical demarcation derived by Kauffmann et al. (2003). The area of BPT parameter space that lies between these two lines is regarded as identifying regions of gaseous emission with an intermediate ionization spectrum.
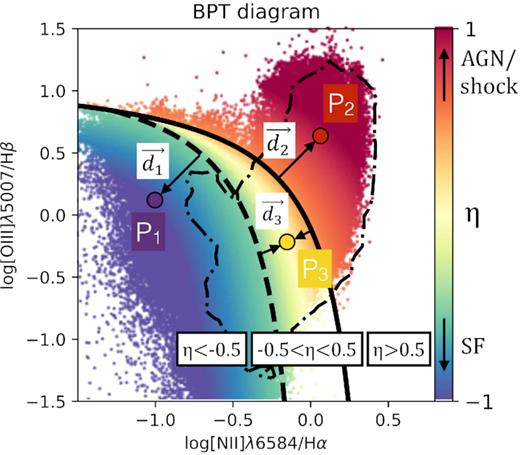
BPT diagram of all the spaxels from all the galaxies in the sample. The colour scheme has been selected as a continuous variation from purple/blue (SF) to red (AGN/shock dominated), using the η parameter. To explain how η is defined, we compute the minimum distances (d1, d2, and d3) of three general points (P1, P2, and P3, respectively, each one in a different region of the BPT diagram) to the two lines that define the three BPT regions. The spaxels with EW(H α)<6 Å lie inside the dash–dot area (see the text).
It is also well known that the EW is an extra proxy to constrain the possible ionization source of the ionized gas, restricting the SF regions to those with EW(H α) > 6 Å (e.g. Cid Fernandes et al. 2011; Sánchez et al. 2014; Barrera-Ballesteros et al. 2016; Belfiore et al. 2017). The EW(H α) is measured by dividing the H α intensity by the flux density of the underlying continuum of the emission line-free spectra, computed as the mean flux density of two windows of 30 Å wide and centred at ±60 Å from the observed H α wavelength. The spaxels with EW(H α) < 6 Å are presented in Fig. 1 as those inside the dash–dotted area. The ratio between all the spaxels with EW(H α) < 6 Å and all the spaxels under the empirical SF demarcation of the BPT is 4 per cent. Although this ratio is lower than 2 per cent for 24 out of 38 galaxies, it is significant for some galaxies such as NGC 3521 (23 per cent), IC5273 (11 per cent), or NGC 4941 (8 per cent).
To obtain a single-valued continuous parameter that conveys the location of each spaxel on its galaxy’s BPT diagram, we define the variable η as either (i) the inward-pointing orthogonal distance from the dashed line, identifying SF gas; (ii) the outward-pointing orthogonal distance from the solid line, identifying AGN/shock-ionized gas; or (iii) the inward- or outward-pointing orthogonal distance from the η = 0 line, taken to be the line that splits vertically the intermediate region of the BPT diagram in half. η is normalized such that η for SF gas is η ≤ −0.5, for AGN/shock-ionized gas is η ≥ +0.5, and the intermediate region has −0.5 < η < +0.5. A detailed explanation of how the parameter η is computed can be found in Appendix B.
The variable η is presented throughout the paper with a continuous colour map starting from blue in the SF regions, going to yellow for the intermediate regions and finishing in red for the regions ionized by AGN/shocks/AGB stars, as shown in Fig. 1. The individual BPT diagrams for each of the galaxies are shown in panel (e) of the figures in Appendix A. The 2D maps showing the EW and resolved BPT properties of the individual galaxies, using the local values of η, are presented in panel (f) of the figures in Appendix A.
The dominant ionization mechanism in most spaxels is SF, except for some galaxies with clear AGN/shock emission in the central (e.g. NGC 4941 or NGC 5643) or bar regions (e.g. NGC 289, NGC 1042, NGC 1512, NGC 4603, NGC 5806, or NGC 7421), where intermediate ionization spectra in between the SF and AGN/shock regions are found. Furthermore, there is a relationship between the gas ionization mechanism and the substructure, e.g. star-forming rings in NGC 1097, NGC 1512, NGC 3081, NGC 5806, and NGC 7552, or the intermediate ionization in the interarm regions of NGC 289 and NGC 4030.
Here we use the knowledge of the resolved EW and BPT properties of the galaxies to exclude the non-thermal gas spaxels when estimating gas metallicities and SFR; the calibrations may break down when using gas ionized by hard radiation fields such as from AGNs or shocks (see Section 4.4).
4.2 Distributions of SFRs
In regions of SF, the H α line traces emission from massive young stars and thus the very recent SF occurring on time-scales <20 Myr. H α is less sensitive to dust attenuation than the UV (although dust effects on H α are not entirely negligible, e.g. Cardelli et al. 1989; Erroz-Ferrer et al. 2013).
This equation assumes a Kroupa (2001) stellar IMF with a mass range of 0.1–100 M⊙, an electron temperature of Te = 104 K, and electron density ne = 100 cm−3. Variations in Te from 5000 to 20 000 K would result in a variation of the calibration coefficient (10−41.27) of ≈15 per cent. Variations of ne = 100–106 cm−3 would result in variations in the calibration coefficient below 1 per cent (Osterbrock & Ferland 2006). This calibration also assumes that over time-scales > 6 Myr, SF remains constant, and no information about the previous SF history is given (see Kennicutt & Evans 2012 and references therein). Some of these assumptions may break down when studying resolved SFR (i.e. ΣSFR) maps for a number of reasons: (i) an incomplete sampling of the IMF, especially at regions of low (≲0.01 M|$\odot$| yr−1) SFRs; (ii) the assumption that the SF remains constant may not be true when the spatial resolution encloses single young clusters; (iii) the spatial resolution may be smaller than the Strömgren diameter of the H ii regions. We refer to Weilbacher & Fritze-v. Alvensleben (2001) for a thorough modelling showing the effects that have an impact on the ratio between L(H α) and SFR. The main consequence of an incomplete sampling of the IMF would typically be a suppressed H α flux (e.g. Lee et al. 2009; Fumagalli, da Silva & Krumholz 2011) and thus an underestimate of the SFR. A variable SF history can lead to both a lower and higher conversion factor between H α luminosity and SFR, which is likely to add some scatter in the relations below, especially for the DIG. As discussed above, there are regions in our galaxies that are not ionized by young stars, but from nuclear activity, shocks, or post-AGB stars. We therefore restrict our SFR calculations to the SF regions (obtained from the BPT diagram).
Keeping these caveats in mind, we present the resolved H α-based SFR maps in panel (d) of the figures in Appendix A. The strong patchiness of the SFR maps reflects the highly inhomogeneous distribution of the H α emission, which is highly concentrated in the H ii regions across the discs. The maps show nuclear SF rings in NGC 1097, NGC 1512, NGC 3081, NGC 5806, and NGC 7552; inner SF rings in NGC 3783, NGC 4941, and IC 2560; and outer SF rings in NGC 3081 and NGC 5806, most of those previously identified in Comerón et al. (2010, 2014). As also discussed in, e.g. Erroz-Ferrer et al. (2015) (and references therein), some bars in our sample show enhanced star formation while others do not; it is unclear whether this is entirely due to the presence/absence of gas or also to different gas conditions in similarly gas-rich galaxies.
4.3 Identification of the DIG
There are two ways to identify the DIG emission in our data: (i) using an H α flux threshold to isolate the H ii regions, and identifying the remaining gas as the DIG [as done, e.g. by Marino et al. (2013) for the CALIFA sample, using the HIIexplorer package presented in Sánchez et al. (2012b) that identifies the H ii regions]; or (ii) following the method developed in Blanc et al. (2009) to compute the fraction of flux coming from DIG and from H ii regions. The idea behind this method is that the observed H α flux [F(H α)] includes the emission from both the H ii regions and the surrounding DIG. Here we follow the method by Blanc et al. (2009).
4.4 Resolved gas-phase metallicities
The gas-phase metallicity Zgas is an important diagnostic for constraining the past star formation and assembly histories of galaxies, and the origin of their gas components. Several calibrations – either empirical, theoretical, or hybrid – have been proposed over the years to derive gas metallicities from emission line fluxes. We refer to the recent studies by Barrera-Ballesteros et al. (2017) and Sánchez et al. (2017, 2018) for a detailed comparison between metallicity calibrators.
In our work, we explored a number of calibrations, to understand their impact on our results. Specifically, we applied to our data: (a) the Marino et al. (2013) (M13 hereafter) fully empirical calibration, based on the O3N2 indicator, |$\mathrm{O3N2}\equiv \log \frac{[{\rm O\,{\small III}}]\lambda 5007}{\mathrm{H}\,\beta }\frac{\mathrm{H}\,\alpha }{[{\rm N\,{\small II}}]\lambda 6584}$|; (b) the calibration of Pettini & Pagel (2004), which uses the O3N2 indicator and is based on a hybrid combination of oxygen measurements in galaxies and photoionization models; and (c) the calibration of Dopita et al. (2016) (DOP16 hereafter). This calibration was inferred from photoionization models and requires only the H α, [N ii], and [S ii] emission lines to infer the oxygen abundance. Since both calibrators have been derived for regions where the ionizing mechanism is SF, we exclusively consider SF-only spaxels (i.e. excluding spaxels with an AGN or shock spectrum).
There are indeed differences between the calibrations. The absolute metallicity values may differ: for the same O3N2 ratio, PP04 delivers systematically higher metallicities than M13 due to the photoionization models used in PP04. The M13 calibration covers a smaller dynamical range than DOP16. Consequently, as expected, the standard deviations using M13 calibration are lower than those in DOP16 due to the smaller dynamical range of the former. We present some results of these tests in Fig. 2 where we show the average metallicity inside 0.5 Re, using the DOP16 and M13 calibrations, plotted as a function of the total stellar mass and colour coded by the average SFR density inside 0.5Re. With both calibrations, there is a positive correlation between the average Zgas within 0.5Re and the total stellar mass M⋆ (i.e. the MZR holds when the average metallicity inside 0.5Re is used instead of the metallicity of the entire galaxy in our reduced sample galaxies, see e.g. Sánchez et al. 2017 for a study of the MZR using a large set of metallicity calibrators for a set of 734 galaxies). The slopes of the relation are, respectively, α = 0.31 ± 0.03 dex/logM|$\odot$| using the DOP16 calibration, and α = 0.18 ± 0.03 dex/logM|$\odot$| up to |$10^{10} \, \mathrm{M}_{\odot }$| using M13. However, we note that M13 reaches a plateau metallicity for |$M_{\star }\gtrsim 10^{10} \, \mathrm{M}_{\odot }$|. This is not the case for the DOP16 calibration, which covers a larger dynamic range than the M13 calibration.
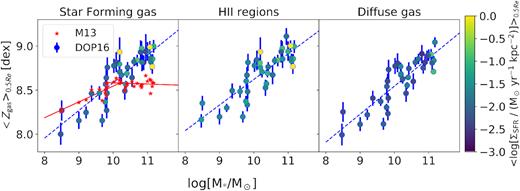
Mean gas metallicity inside 0.5 Re as a function of the total stellar mass of the galaxy, colour coded by the mean SFR density inside 0.5 Re. From left to right, mean metallicity inside 0.5 Re derived from all SF spaxels according to the BPT classification, only spaxels belonging to H ii regions, and only spaxels belonging to the DIG. The left-hand panel, displaying the metallicity of the gas with SF BPT properties, shows the comparison between our fiducial DOP16 calibration (circles colour coded according to the bar to the right) and the M13 calibration (red stars).
Although the DOP16 calibration depends on the N/O ratio, we adopt it as our fiducial calibration because it reproduces supersolar oxygen abundances. Fig. 2 shows that the MZR inside 0.5 Re holds not only when the total SF gas is taken into account, but also when either only the H ii regions or only the DIG components are considered. Note that we see no clear trend of the average SFR density with either total stellar mass or gas metallicity inside 0.5 Re.
5 RESULTS
5.1 Gas metallicities: comparison between diffuse gas and H ii regions
Exploiting the high spatial resolution of the MAD data, we study the distinct contributions from the H ii regions and DIG to the properties of the SF gas in SFMS discs. We discuss the differences in chemical enrichment that we detect in these two components of the ISM.
5.1.1 Emission line ratios in H ii regions and DIG
The typical size of an H ii region is between few tenths of pc to ∼200 pc (Kennicutt, Bothun & Schommer 1984; Garay & Lizano 1999; Kim & Koo 2001; Hunt & Hirashita 2009); the resolution of the MAD data therefore makes it possible to identify and isolate a substantial fraction of H ii regions from the surrounding DIG, although few H ii regions may remain unresolved. As noted in the previous section, it is important to use only the star-forming gas when applying certain calibrations. Kewley & Dopita (2002), Kewley & Ellison (2008), and Yuan et al. (2012) excluded contaminated (non-SF) regions when lacking the spatial resolution required to avoid computing incorrect gas metallicities with some calibrations. Hence we study here the emission line ratios of H ii regions and DIG of the SF regions only, distinguished using the methodology explained in Section 4.3.
The ionization source for DIG and H ii regions may be different (Mathis 2000; Haffner et al. 2009). If so, we may expect the gas properties to differ in these regions. In order to explore this issue, we present in Fig. 3 the ratios of the dust-corrected emission line fluxes of [O iii]/H β, [N ii]/H α, [S ii]/H α, O3N2, and [S ii]λ6717/[S ii]λ6731 for both H ii regions and DIG. Thanks to the great spatial resolution of our data, it is possible to measure the median emission line fluxes at very low and high values of Σ⋆ (100.5 and 105 M⊙ pc−2, respectively). The first two rows show the difference in BPT ionization between H ii regions and DIG. Since we study the H ii regions and DIG that are in the SF area of the BPT diagram and show EW(H α) > 6 Å, we expect that both the [O iii]/H β and [N ii]/H α ratios are similar for both components. The third row in the figure shows the [S ii]/H α ratio, which is almost constant with Σ⋆ for both H ii regions and DIG. The median value for this ratio in H ii regions is, as expected, systematically lower than in the DIG (given the way the DIG is identified). The fourth row of the figure shows the O3N2 ratio. We observe a correlation between O3N2 and Σ⋆, i.e. a resolved MZR on the local scales of MAD. Note that the ratio [S ii]λ6717/[S ii]λ6731, a tracer of the electron density, is similar for the H ii regions and DIG, although with larger variation for the latter.
![Emission line ratios corrected for dust extinction for SF regions with dominant H ii emission (left) and for the DIG (right), plotted as a function of Σ⋆ and colour coded by the number of spaxels at each x–y bin. In each panel, the squares denote the median y-value at a fixed Σ⋆ and the error bars are the 1σ error of the distribution. Top and second rows: [O iii]/H β and [N ii]/H α ratios, respectively. Third row: The [S ii]/H α ratio, used to identify regions of DIG emission. Fourth row: The O3N2 ratio, an indicator of Zgas. Last row: The [S ii]6717/[S ii]6731 ratio, which traces the electron density.](https://oup.silverchair-cdn.com/oup/backfile/Content_public/Journal/mnras/484/4/10.1093_mnras_stz194/1/m_stz194fig3.jpeg?Expires=1750229238&Signature=ryyMRH1B4tkAgrG8Q2-c3yMX1ZdTqH~dkd~25EVTS2eaDJES4Uk8IYgzVSaBjuw4a8aA6rgqLELsvsmsVKICSUFHnSMVAf1BhyFendv70jyn8gdr6awzI9xF82WSQyHM6EU9UW-OaeoNhsgJoB67a-AYjs8wkzjgdQFF8QcD3-rBoFx3zTP262JLtNqMIyHhISVc-ojszYbI3eRyf8SAOGBsARR2zdXrW8oDOveEGsdPpubPjr1rKEBgkKoqtGU5EfH-25YFYGPnG5kccyLDrGPCwBmr8J8AILx7GVIXf5t96ztrt6QxanO9HlbtZpSE1pdz2yrpGo~0W8dBS1VxpA__&Key-Pair-Id=APKAIE5G5CRDK6RD3PGA)
Emission line ratios corrected for dust extinction for SF regions with dominant H ii emission (left) and for the DIG (right), plotted as a function of Σ⋆ and colour coded by the number of spaxels at each x–y bin. In each panel, the squares denote the median y-value at a fixed Σ⋆ and the error bars are the 1σ error of the distribution. Top and second rows: [O iii]/H β and [N ii]/H α ratios, respectively. Third row: The [S ii]/H α ratio, used to identify regions of DIG emission. Fourth row: The O3N2 ratio, an indicator of Zgas. Last row: The [S ii]6717/[S ii]6731 ratio, which traces the electron density.
Overall the emission line ratios in the DIG are similar than those found in H ii regions, i.e. the range of BPT, Zgas, and ne properties. This is in part inherited from the restriction to study SF-only regions and from the constraints on the [S ii]/H α ratio that are applied to define and identify the DIG.
5.1.2 Metallicity radial gradients
The prediction from an inside-out formation scenario (e.g. White & Frenk 1991; Mo et al. 1998), where the stars in the central parts are formed before the stars in the outer parts, is that the metallicity decreases with galactocentric radius (i.e. a negative gradient). Non-interacting galaxies show, in general, negative gas metallicity gradients (Searle 1971), and, at least in some studies, the slope of this gradient has been found not to depend strongly on galaxy properties (e.g. Zaritsky et al. 1994; Sánchez et al. 2014; Ho et al. 2015). Other studies (e.g. Belfiore et al. 2017) however find that the metallicity gradient steepens with stellar mass. Carton et al. (2015) found a correlation between the metallicity gradients and the gas content of 50 isolated, late-type galaxies. Interacting galaxies seem to have flatter metallicity gradients than isolated galaxies, likely because of gas flows induced by the mergers (Vila-Costas & Edmunds 1992a; Krabbe et al. 2008, 2011; Kewley et al. 2010; Rupke, Kewley & Chien 2010; Rosa et al. 2014; Torres-Flores et al. 2014). Recently, using IFU data, Sánchez et al. (2012b, 2014), Kaplan et al. (2016), and Sánchez-Menguiano et al. (2018) have found that barred and unbarred spirals show similar metallicity gradients, in contrast with some previous studies based on long-slit data (e.g. Vila-Costas & Edmunds 1992b; Martin & Roy 1994; Zaritsky et al. 1994; Dutil & Roy 1999; Henry & Worthey 1999).
To fairly explore the metallicity radial profiles in galaxies with different radial coverage and of different sizes/masses, the galactocentric distances are normalized to the half-light radius (listed in Table 1). The galactocentric distance has been binned in units of 0.3 R/Re, and the median metallicity for each bin is shown in Fig. 4. Note that no gradient is measured for NGC 1512, as its radial extent does not reach 0.6 R/Re. We computed the gradient α to be the slope of the fitted line to the median points up to the probed radius. We note that the qualitative trends that we report do not change when using the galactocentric distance in physical units (kpc).
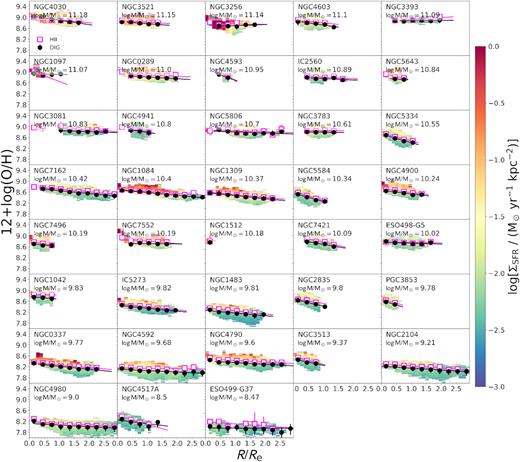
Gas-phase metallicity of the SF regions computed using the DOP16 calibration, as a function of galactocentric distance normalized by the effective radius (R/Re), colour coded by SFR density. We compute the median metallicities in bins of 0.3 R/Re for the H ii regions (pink squares) and DIG (black circles), respectively. The gradient α for both the H ii regions and DIG regions has been measured as the slope of the fitted line, and coloured in pink and black for the H ii regions and DIG, respectively. The galaxies are ordered according to their total stellar mass – starting with the highest stellar mass in the top-left panel, down to the lowest stellar mass in the bottom-right panel. Note that no gradient is measured for NGC 1512, as its radial extent does not reach 0.6 R/Re.
MAD spatial resolution enables us to study the gas metallicity profiles of H ii regions and DIG separately. To this aim, we compare, for every galaxy, the metallicity gradient that results when using H ii regions-only spaxels (pink open squares in Fig. 4) to the gradient that results when using DIG regions (black circles in the figure). We only consider (and compute a median value for) radial bins in which the number of spaxels covered by SF regions is at least 10 per cent of all spaxels in that radial bin.
The metallicity gradients that we measure in the inner SF regions of discs are mostly negative (29 out 37 cases) or flat (8 out 37 cases). Outward-decreasing metallicities, i.e. negative gradients, are consistent with a disc evolution following the classical inside-out scenario. Flat metallicity gradients, also reported by other authors (e.g. Marino et al. 2012; Marino et al. 2016), point towards scenarios that include the presence of bars, changes in the SF histories, or coincidence with the corotation radius.
When comparing the gas metallicity profiles of H ii regions and DIG separately (Fig. 4), we find that their metallicity gradients are similar. However, the median values of the gas metallicity in each radial bin are higher for the H ii regions than for the DIG regions by ∼0.1 dex on average. Fig. 4 is colour coded by the ΣSFR: we note that, at any given radius, regions of lower metallicity have lower median SFR density.
Fig. 5 shows the metallicity gradients as a function of the total stellar mass for our three analyses: SF (no AGN/shock ionization) regions, H ii regions, and DIG. We find that the gradients hardly change between H ii regions and DIG; we observe no dependence on stellar mass in any of the panels of Fig. 5. We use this figure to also show the impact of the adopted metallicity calibration on the measured gradients. Specifically, for the SF-only gas, we show the comparison between metallicity gradients measured with our fiducial calibration and with the M13 calibration. The M13 calibration yields substantially shallower metallicity gradients, and occasionally even positive metallicity gradients (in some high-mass galaxies), due to a drop in metallicity in the inner 0.5Re. Sánchez-Menguiano et al. (2018) also reported a drop in metallicity in the inner 0.5Re when using M13, not found when using the DOP16 calibration (see their appendix C). Our aforementioned results regarding the metallicity gradients of H ii regions are consistent with those of Sánchez-Menguiano et al. (2018), although their sample is three times as large and has in some cases larger spatial coverage.
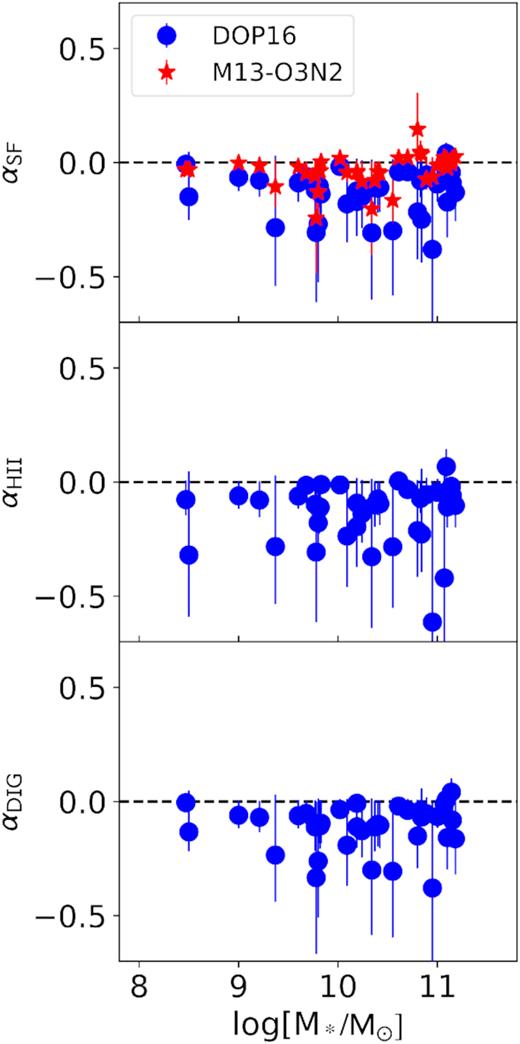
Gas metallicity gradients α of (top panel) SF regions using two different metallicity calibrators: DOP16 (blue dots) and the M13 calibration based on the O3N2 ratio (red stars); (second panel) H ii regions and (third panel) DIG regions. The dashed line at α = 0 is shown to guide the eyes in separating outward-decreasing (negative) from outward-increasing (positive) gradients.
Fig. 6 shows the radial metallicity profiles of the SF regions dividing the sample in three mass bins with a roughly similar number of galaxies per bin: low-mass galaxies (|$M_{\star }\, \lt \, 10^{10}\, \mathrm{M}_{\odot }$|), intermediate-mass galaxies (|$10^{10}\, \mathrm{M}_{\odot }\, \lt \, M_{\star }\, \lt \, 10^{10.8}\, \mathrm{M}_{\odot }$|), and high-mass galaxies (|$M_{\star }\, \gt 10^{10.8}\, \mathrm{M}_{\odot }$|). Both DOP16 and M13 calibrations have been used to compute the metallicities. At a fixed galactocentric distance, the median metallicity values increase with increasing total mass (at all radii for both metallicity calibrators). It is evident, however, that the shape of these profiles depends on the adopted calibration: the metallicity profiles decrease for all mass bins for our fiducial calibration DOP16, whereas for M13 they are much flatter, even rising for the high-mass bin.
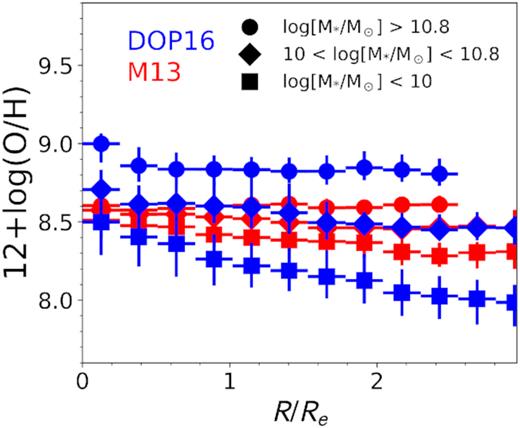
Median metallicity radial profiles measured using DOP16 (blue) and O3N2-M13 (red) metallicity calibrators, grouped in three mass bins: squares for low-mass galaxies (|$M_{\star } \lt 10^{10} \, \mathrm{M}_{\odot }$|), diamonds for intermediate-mass galaxies (|$10^{10} \, \mathrm{M}_{\odot } \lt M_{\star } \lt 10^{10.8} \, \mathrm{M}_{\odot }$|), and dots for high-mass galaxies (|$M_{\star } \gt 10^{10.8} \, \mathrm{M}_{\odot }$|). There are 12–13 galaxies in each mass bin.
Significant information concerning the enrichment histories of galactic discs is lost when computing the azimuthal averages that produce the metallicity gradients; this produces the scatter in each radial bin that is shown in the previous figures, which is on average ∼0.2 dex. This typical scatter that we find across our sample has also been reported for studies of individual galaxies based on data of similar resolution to ours, e.g. in HCG 91c by Vogt et al. (2017). The gradients result from averaging at any given radius substantially different metallicities in H ii regions, DIG, spiral arms, bars, non-gravitational (inflow/outflow) components, galactic rings, and other small-scale substructure that stands out in the 2D maps. As the DIG regions have lower metallicities than the H ii regions, the median metallicities reported in the radial (azimuthally averaged) gradients are in between the two extremes produced by these two gas components. In general, morphological substructure stands out clearly in the 2D metallicity maps: the nuclear rings in NGC 5806 and NGC 7552 have a very different metallicity than their surroundings; the H ii regions in the spiral arms in NGC 289 and NGC 4030 have a different metallicity compared to the interarm regions. The latter may result from inflow of low-metallicity gas along the arms, either from the diffuse circumgalactic medium or due to the accretion of a low-metallicity satellite; alternatively, we may be seeing an increase in metallicity due to enhanced star formation in the gas-compression zones generated by the spiral arms. In general, however, the H ii regions have typical metallicities that are higher than those found in the interarm regions. In Appendix A, we describe the results for each individual galaxy, relating the scatter and features in the metallicity maps to the other gas diagnostics presented in this paper. In Appendix C, we compare the 2D metallicity distribution with its azimuthally averaged metallicity gradient.
5.2 The spatially resolved mass–metallicity relation on ∼100 pc scales
An important question is whether the global relationships reported above arise from local ones. The high-spatial-resolution MAD data enable us to explore relationships between local physical properties such as local SFR, local metallicities, or Σ⋆.
In Fig. 7, we present the distribution of the oxygen abundance as a function of Σ⋆ for all the SF spaxels provided by our sample galaxies. The oxygen abundances are derived using DOP16 (top) and M13 (bottom) calibrations. This figure is based on the ∼1070 000 SF spaxels out of the ∼1330 000 spaxels from the entire sample of 38 galaxies. The number of spaxels in each x–y bin is represented by a colour scale. These plots show a clear relationship between Σ⋆ and Zgas, i.e. a resolved MZR (RMZR) for ∼100 pc local scales. Specifically, Zgas increases with increasing Σ⋆ up to a stellar surface mass density of ∼103 M|$\odot$| pc−2. Interestingly, Zgas continues to increase beyond this threshold value, but more gently than at lower Σ⋆. Using the M13 calibration instead of our fiducial DOP16 calibration produces a more dramatic flattening of the relation above ∼103 M|$\odot$| pc−2. In contrast, with the DOP16 the RMZR keeps increasing up to the highest stellar surface mass densities that we probe with our data. With our smaller spatial scales, we extend the RMZR to Σ⋆ of ∼105 M|$\odot$| pc−2, i.e. 1 and 1.5 mag higher than those reached with MaNGA and CALIFA, respectively.
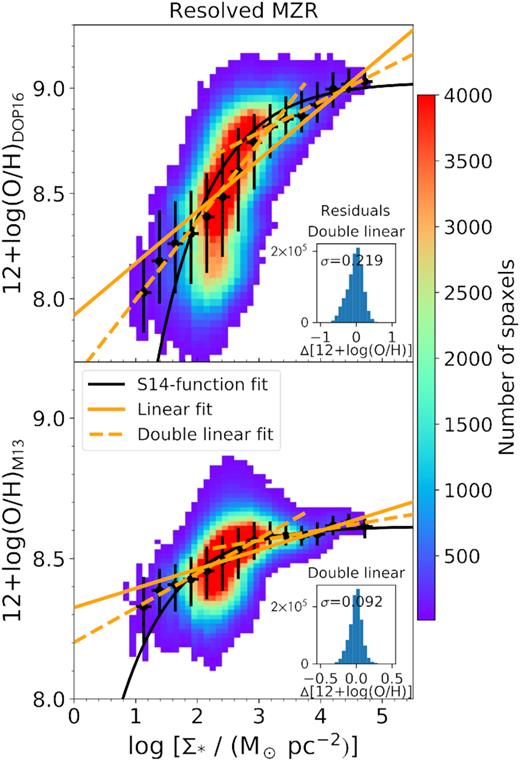
Spatially resolved stellar surface mass density–gas metallicity relation (i.e. the RMZR) using DOP16 (top) and M13 (bottom) calibrations, colour coded by the number of spaxels in each x–y bin. In these plots, there are |${\sim }1 070\, 000$| SF spaxels from the 38 galaxies. The orange solid lines show the linear fit to all the median values of Zgas. Two additional fits are performed to the data above and below the apparent threshold in surface mass density at ∼103 M|$\odot$| pc−2 (orange dashed lines). The black solid line is the fit to the S14-function previously used in the literature.
In order to explain the shape of the RMZR, we search for a mathematical formula that can reproduce both the linear behaviour at lower Σ⋆ and the flattening (asymptotic behaviour) at higher Σ⋆. We fit the median metallicity values inside each bin of Σ⋆ using three different approaches: (i) a linear function based on two free variables, i.e. slope and y-intercept, (ii) a three-variable function, y = a + b(x − c)e−(x − c) (Sánchez et al. 2014), S14-function thereafter, and (iii) double-linear function for the two regimes below and above the ∼103 M|$\odot$| pc−2 threshold that comprises four free variables. The threshold at ∼103 M|$\odot$| pc−2 has been calculated as the optimal value that describes the break in the two linear regimes. In Table 2 the coefficients of the fitted functions for both DOP16 and M13 calibrations are summarized. The residuals are computed as |$\Delta {\rm 12+log(O/H)} =y-\overline{y}$| for all y (metallicity) values from all the SF spaxels. We compute the scatter of the RMZR as the standard deviation of the residuals after subtracting the fitted relations to the RMZR. The distribution of the residuals, as well as the scatter in this distribution, is presented in a subplot inside Fig. 7.
Best fits to the RMZR using three different functions: (i) linear fit y = mx + n, (ii) fit using the S14-function y = a + b(x − c)e−(x − c), and (iii) double-linear fit, performing two linear fits before and after 103 M|$\odot$| pc−2. The fits have been done using both DOP16 and M13 metallicity calibrators. The scatter has been measured as the standard deviation of the residuals after subtracting the best fit to the data.
| DOP16 | M13 | ||
|---|---|---|---|
| Linear y = mx + n | |||
| m(dex/logΣ*) | 0.25 ± 0.02 | 0.07 ± 0.01 | |
| n(dex) | 7.92 ± 0.07 | 8.33 ± 0.03 | |
| Residuals | σ(dex) | 0.227 | 0.096 |
| χ2 | – | 4.526 | 2.846 |
| p-value | – | 0.033 | 0.092 |
| S14-function y = a + b(x − c)e−(x − c) | |||
| a(dex) | 9.03 ± 0.05 | 8.61 ± 0.05 | |
| b(dex/logΣ*) | 0.000 ± 0.001 | 0.000 ± 0.001 | |
| c(dex) | 10.00 ± 16.04 | 10.00 ± 16.04 | |
| Residuals | σ(dex) | 0.283 | 0.108 |
| χ2 | – | 3.215 | 1.331 |
| p-value | – | 0.200 | 0.514 |
| Double linear y = mx + n | |||
| x < 103 M|$\odot$| pc−2 | m(dex/logΣ*) | 0.37 ± 0.02 | 0.12 ± 0.01 |
| n(dex) | 7.62 ± 0.04 | 8.20 ± 0.01 | |
| x > 103 M|$\odot$| pc−2 | m(dex/logΣ*) | 0.15 ± 0.01 | 0.04 ± 0.01 |
| n(dex) | 8.34 ± 0.06 | 8.45 ± 0.04 | |
| Residuals | σ(dex) | 0.219 | 0.092 |
| χ2 | – | 0.416 | 1.411 |
| p-value | – | 0.937 | 0.703 |
In order to assess which function represents the data better, we analyse the residuals, χ2, and p-value of the aforementioned fits. From Table 2, we see that the double-linear fit presents less scatter than the others for both metallicity calibrators. Additionally, the χ2 for the double-linear fit is also the lower one for both metallicity calibrators. Even if χ2 determines the goodness of the fits, including more degrees of freedom (more free variables) to our fitted functions may result in a lower χ2 parameter. Thus we study the p-value to see the significance of our results, finding that the higher p-value corresponds to the double-linear function for both metallicity calibrators, confirming that this function represents the data distribution better than the other two. In any case, both the double-linear fit and the S14 functions can explain the saturation in metallicity at the highest densities. This saturation has been suggested to be consequence of the maximum yield of oxygen in spiral galaxies (Pilyugin, Thuan & Vílchez 2007), low sSFR in the inner regions of the galaxies, or efficiency of cooling in high-metallicity and low-temperature H ii regions (Rosales-Ortega et al. 2012).
In order to understand the physical interpretation of the chosen formula, we divide the galaxies of our sample in three mass bins with a roughly similar number of galaxies per bin. The second, third, and fourth panels of Fig. 8 show the Σ⋆ versus Zgas relation, respectively, for the lower (<|$10^{10} \, \mathrm{M}_{\odot }$|), intermediate (|$10^{10} \, \mathrm{M}_{\odot } \lt M_{\star } \lt 10^{10.8} \, \mathrm{M}_{\odot }$|), and high (>|$10^{10.8} \, \mathrm{M}_{\odot }$|) stellar mass bins. For each mass bin, we use a different colour for the contour of the RMZR relation; the contours enclose the loci where the data points lie: we use blue for the low-mass galaxies, green for the intermediate-mass galaxies, and red for the more massive galaxies. These contours are superimposed in the left-most panel (i.e. the one containing the whole sample of 38 galaxies) using the same colour coding. Specifically, the slope of the RMZR relation is rather steep in the lowest mass bin and flattens substantially towards the higher masses (slopes α = 0.25 ± 0.01, 0.21 ± 0.01, and 0.08 ± 0.01 for the low-, intermediate-, and high-mass bins, respectively). Contrary to the behaviour of considering all the spaxels from all the galaxies, the median metallicities at each Σ⋆ of the three mass bins are very well fitted by a line, and no threshold in Σ⋆ is found. This points towards a scenario where the maximum oxygen yield that produces the saturation at high densities depends on the total stellar mass, and the saturation observed is the result of combining all the stellar mass bins in the same plot. In other words, the double-linear fit is the best formula that fits to the data and shows the saturation at high masses. However, a single-linear correlation explains the RMZR at each bin of total stellar mass.
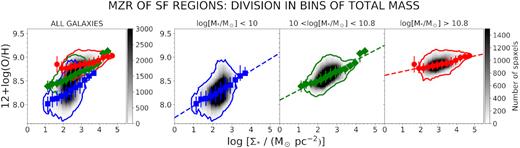
RMZR for all SF spaxels from the whole sample (left), followed by subsamples defined according to the total stellar mass of the galaxies (low, intermediate, and high stellar mass moving from left to right). Each plot is colour coded in grey scale by the number of spaxels in each x–y bin. The blue, green, and red contours for the low-, intermediate-, and high-mass galaxies enclose the loci where the data points lie. The corresponding dashed blue, green, and red lines indicate the linear fit to the median values of Zgas for each mass bin. The same contours are reported in the left-most panel, to ease the comparison.
We also note that a wide range of Zgas is measured at a given Σ⋆ from the right plots of Fig. 8: at fixed values of surface mass density, which are found in galaxies of all masses in our sample, the range in metallicities measured within the discs slightly increases with the total stellar mass of the galaxies. For example, at a surface mass density of |$10^{2.5} \, \mathrm{M}_{\odot }\,{\rm pc}^{-2}$|, the lowest stellar mass bin has gas metallicities within the range 7.8 < Zgas < 8.9, the intermediate-mass galaxies have a range 8.3 < Zgas < 9.1, and the most massive bin has a range of 8.4 < Zgas < 9.3. This does not imply, however, that the metal enrichment has a global origin rather than a local one, as denser (less dense) regions are found in more (less) massive galaxies. The dependence of the RMZR with the total stellar mass will be discussed in Section 6.
We furthermore explore how other important parameters depend on Σ⋆ and Zgas by adopting a ‘supergalaxy view’ in Fig. 9. By ‘supergalaxy view’ we mean a diagnostic diagram in which, at each (x,y) point, the value of the third variable (colour coded) represents the median of the distribution of values of that third variable obtained from the spaxels with those specific (x,y) values. We present two complementary figures in Appendix D, which show, respectively, the standard deviation σ of the distribution of values for the third (colour coded) parameter, and the number of galaxies contributing to each x–y bin. These complementary figures are important to establish how meaningful and statistically representative the median values are in each (x,y) location of the diagrams.

RMZR colour coded by the median value of a third parameter: from top to bottom, galactocentric distance, dust extinction from the Balmer decrement, and SFR surface density. As in Fig. 8, the plots show the results for all SF spaxels from the whole sample (left column), followed by the subsamples defined according to the total stellar mass of the galaxies (low, intermediate, and high stellar mass from left to right).
The four parameters that we consider are, from top to bottom of the figure, galactocentric distance (normalized by the effective radius), E(B − V) computed from the Balmer decrement measured in our spectra, and ΣSFR. The top row of Fig. 9 shows how galactocentric distance (normalized by the effective radius) varies with Zgas and Σ⋆. As expected from an inside-out scenario, Σ⋆ of the discs decreases with increasing galactocentric distance (the median position of denser spaxels – high Σ* – is at low galactocentric distance, i.e. the central regions). In the three panels showing the different mass bins, denser regions are found in the more massive galaxies and vice versa. The middle row shows the variation of the dust extinction with Zgas and Σ⋆. Garn & Best (2010) and Zahid et al. (2012) found that globally, dust extinction increases with SFR, metallicity, and stellar mass, but as stellar mass is the dominant factor, the relationships between dust and metallicity or SFR and extinction and SFR are secondary effects (Garn & Best 2010). We find locally that, when all the galaxies are included, E(B − V) increases with increasing Σ⋆ and increasing Zgas. However, the different mass bins show that E(B − V) does not strongly correlate with Σ⋆ or Zgas but increases with the total stellar mass at a given Σ⋆.
The last row shows the dependence of ΣSFR with Zgas and Σ⋆. When considering all masses together, we find a complex dependence of ΣSFR with Zgas and Σ⋆. As expected from the intrinsic local relation between Σ⋆ and ΣSFR (RSFMS, see the following section), low SFR densities are found in regions of low Zgas and high SFR densities are found in regions of high metallicities, but a wide range of ΣSFR is found at intermediate metallicities and Σ⋆. For intermediate-mass galaxies, ΣSFR increases with Σ⋆ and Zgas. For low- and high-mass galaxies, however, there is not a clear correlation between ΣSFR and Zgas at a fixed Σ⋆. It is therefore important to further discuss the secondary dependence of the RMZR with ΣSFR (Section 6).
5.3 The stellar mass density versus SFR density relation on MAD scales
As discussed in the ‘Introduction’ section, the almost linear correlation between total M⋆ and total SFR, i.e. the so-called SFMS, is well known at low (e.g. Brinchmann et al. 2004; Renzini & Peng 2015) and high redshifts (e.g. Daddi et al. 2007; Noeske et al. 2007; Wuyts et al. 2013; Tacchella et al. 2015). Here we address the question of whether this relation holds on the ∼100 pc scales probed by MAD, when looking at the individual regions inside disc galaxies, i.e. an RSFMS. We first focus on the relationship for all the SF regions in the top panel of Fig. 10, where the colour coding shows the number of spaxels in each x–y bin. We find that ΣSFR is positively correlated with Σ⋆ when considering all galaxies together, although showing some scatter. This correlation spans 5 orders of magnitude in Σ⋆ and four in ΣSFR. Just as we observed in the RMZR, the local ΣSFR–Σ⋆ relation is characterized by a break around |$10^{3} \, \mathrm{M}_{\odot }\,{\rm pc}^{-2}$| above and below which the relation is steeper and flatter. As in the previous subsection, we use different functions to fit the median values of ΣSFR in bins of Σ⋆: (i) single-linear fit and (ii) two linear fits before and after the threshold at Σ⋆ = 10|$^{3}\, \mathrm{M}_{\odot }\, {\rm pc^{-2}}$|. Table 3 collects the slopes, intercepts, and scatter for each function. A double-linear fit reduces the scatter again, although not significantly with respect to the single-linear one. The χ2 is lower and the p-value is higher for the double-linear fit, which shows that it is a better fit than the single-linear fit. We note a sharp cut at lower ΣSFR, which may cause the relation to flatten at lower values of Σ⋆. Taking into account a possible incompleteness of our sample at lower values of ΣSFR, the single line fit represents better the contours of the distribution.
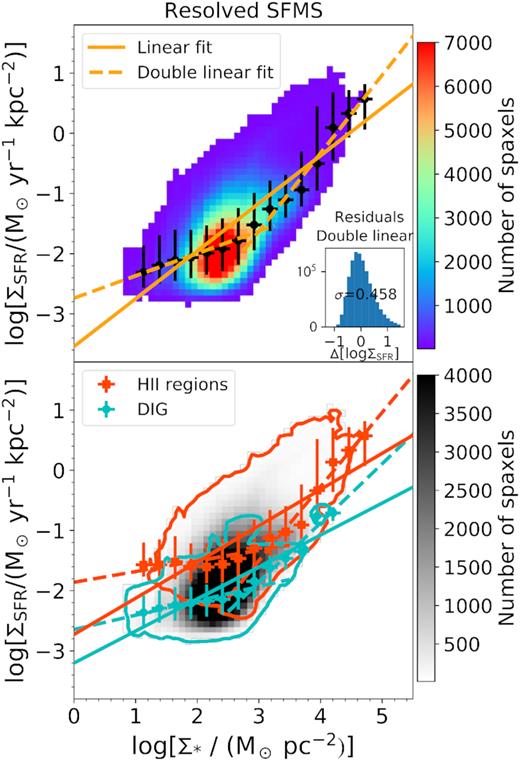
Top: Spatially resolved stellar mass surface density–SFR density relation (SFMS) at ∼100 pc scales for all the SF spaxels from all the galaxies in the sample, colour coded by the number of spaxels in each x–y bin. The orange solid line shows the linear fit to all the median values of ΣSFR. Two additional fits are performed to the data above and below the apparent threshold in surface mass density at |${\sim }10^3\, \mathrm{M}_{\odot }\, \mathrm{pc}^{-2}$|, plotted as orange dashed lines. Bottom: RSFMS, with overplotted contours from the H ii regions (red) and DIG (cyan). Again, single- and double-linear fits have been done to the median values of ΣSFR in bins of Σ⋆ for both H ii regions (red squares) and DIG (cyan circles).
Best fits to the RSFMS using two different functions: (i) linear fit using the equation y = mx + n, (ii) double-linear fits before and after 103 M|$\odot$| pc−2. The scatter has been measured as the standard deviation of the residuals after subtracting the best fit to the data.
| Linear y = mx + n | ||
|---|---|---|
| m(dex/logΣ*) | 0.79 ± 0.07 | |
| n(dex/logΣSFR) | -3.54 ± 0.20 | |
| Residuals | σ(dex/logΣSFR) | 0.472 |
| χ2 | – | 6.424 |
| p-value | – | 0.011 |
| Double linear y = mx + n | ||
| x < 103 M|$\odot$| pc−2 | m(dex/logΣ*) | 0.37 ± 0.04 |
| n(dex/logΣSFR) | −2.74 ± 0.08 | |
| x > 103 M|$\odot$| pc−2 | m(dex/logΣ*) | 1.30 ± 0.09 |
| n(dex/logΣSFR) | −5.52 ± 0.35 | |
| Residuals | σ(dex/logΣSFR) | 0.458 |
| χ2 | – | 0.604 |
| p-value | – | 0.895 |
Cano-Díaz et al. (2016) found an RSFMS using SF regions of galaxies of all morphological types from the CALIFA sample (0.5–1.5 kpc spatial resolution). They found a slope of γ = d log(Σ⋆)/d log(ΣH α) = 0.72 ± 0.04 and a zero-point of −7.63 [in units of log(|$\mathrm{M}_{\odot }\, \mathrm{yr^{-1}\, kpc}^{-2}$|)]. Our results at higher spatial resolution agree, finding a slope of γ = 0.714 ± 0.064 and a zero-point of −7.564 in their units. Using MaNGA (∼1 kpc spatial resolution) data for star-forming regions in star-forming galaxies, Hsieh et al. (2017) found a slope of γ = d log(Σ⋆)/d log(ΣH α) = 0.715 ± 0.001 and a zero-point of 33.204 erg s−1 kpc−2. In our data at higher spatial resolution, we find a slope of γ = 0.714 ± 0.064 and a zero-point of 33.704 erg s−1 kpc−2. The aforementioned results indicate that the relationship between Σ⋆ and ΣSFR remains unchanged for star-forming regions over several orders of magnitudes of spatial scales, from kpc scales down to the ∼100 pc scales probed with MUSE in the MAD galaxies.
The bottom panel of Fig. 10 shows the RSFMS distinguishing the H ii regions (red contours) and DIG (cyan contours) over the SFMS for all the SF spaxels, now grey colour coded. We perform the same fits to the distinct components (H ii regions and DIG), finding similar slopes for both single- and double-linear fits. The median ΣSFR values for the H ii regions have higher ΣSFR on average (i.e. higher y-intercept on the fits). In other words, we find a ‘retired’ RSFMS for the DIG component. As our study focuses on the regions ionized by hot/young stars, this result helps us to understand the origin of the DIG at sub-kpc scales and agrees with Weilbacher et al. (2018), where they found that the leaking UV photons from H ii regions can explain the ionization of the DIG. Our study cannot rule out the possibility that the hot old stars can ionize part of the DIG because we do not study the LINER-like ionized regions. In this regard, Hsieh et al. (2017) found a ‘retired’ RSFMS for the LINER spaxels in their SF galaxies.
When dividing the sample into stellar mass bins (Fig. 11), the ΣSFR–Σ⋆ relations of the respective bins nearly coincide. The break in the ΣSFR–Σ⋆ relation moves between 103 and |$10^{4} \, \mathrm{M}_{\odot }\,{\rm pc}^{-2}$| with increasing total stellar mass. As a result, the slopes of the relation do increase with total mass (γ = 0.612 ± 0.108 for the low-mass galaxies, 0.762 ± 0.118 for galaxies with intermediate stellar masses, and 0.906 ± 0.068 for the high-mass galaxies), but this variation is small compared to the 3 orders of magnitude variation in ΣSFR over the range of Σ⋆. We note however that the scatter in ΣSFR at a constant Σ⋆ is quite large; this scatter does not change substantially across the range of total stellar mass that we sample (with the exception of the very centres of intermediate- and high-mass galaxies, most likely due to the superposition of bulge and disc data). Section 6 will further study whether the RSFMS has a local or global origin.
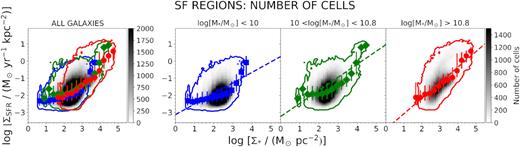
Spatially resolved stellar mass surface density–SFR density relation (RSFMS) at ∼100 scales for all the SF spaxels from all the galaxies (left), followed by the separation of the sample in three mass bins as in Fig. 9.
We investigate the ΣSFR–Σ⋆ relation further by mapping the dependence of third parameters on this relation. These are the same as those analysed in the previous section and are represented by the colour coding in Fig. 12. Galactocentric distance does not vary significantly with ΣSFR but increases with decreasing Σ⋆ as expected from an inside-out scenario. This is true in all stellar mass bins, indicating that Σ⋆ is directly correlated with the galactocentric distance regardless of the value of total stellar mass. Dust extinction increases with increasing ΣSFR but does not depend on Σ*. This indicates that the apparent correlation between dust extinction and Σ⋆ observed in the RMZR (middle row of Fig. 9) is a consequence of the correlation between Σ⋆ and ΣSFR. Thus dust extinction follows SFR and does not seem to depend on either Σ⋆ or metallicity. Finally, the last row shows the variation of gas metallicity with Σ⋆ and ΣSFR: the only correlations seem to be between Σ⋆ and Zgas and between Σ⋆ and ΣSFR, but not between ΣSFR and Zgas. At a fixed Σ⋆, the metallicity does not vary with ΣSFR. These results agree with a scenario in which the dust is formed with newly born stars, irrespectively of the amount (mass) of stars or the local metal enrichment.
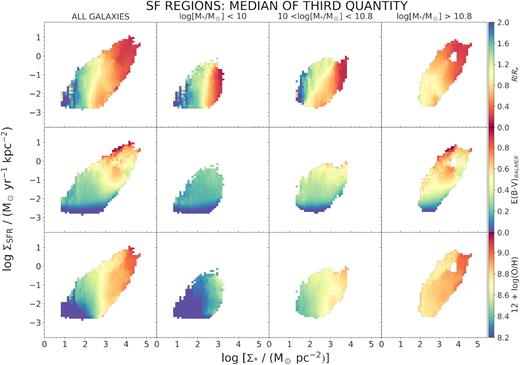
Supergalaxy view of the spatially RSFMS for all the SF spaxels from all the galaxies (left), followed by the separation of the sample in three mass bins as in Fig. 9. Each row shows a different colour coding according to the median value of a third quantity: galactocentric distance (top row), dust extinction from the Balmer decrement (middle row), and Zgas (bottom row).
6 DISCUSSION
6.1 Resolved relations: local or global origin?
First we explore the possible dependence of the local gas metallicity with the global stellar mass. As found in Section 5.1.2, the inner-disc gas metallicities that we measure at a given (normalized) galactocentric distance increase with the total stellar mass of the galaxies. Fig. 8 showed that the local enrichment varies with Σ⋆ and the total stellar mass of the galaxies. It is therefore important to understand whether this local enrichment varies due to Σ⋆, total stellar mass, or both.
To do so, we study the behaviour of the residuals from the RMZR as a function of the total mass of the galaxy. The median residuals in bins of total stellar mass are computed and presented in the left-hand panel of Fig. 13 for the three performed fits: single linear, double linear, and S14-function. From this figure, we see that (i) M13 calibration shows lower residuals due to the lower range in metallicities of the calibrator, (ii) the S14-function fit delivers larger residuals than the single-linear and double-linear fits for both metallicity calibrators, especially for the low-mass galaxies, and (iii) the residuals are within the metallicity calibration uncertainties except for the low-mass galaxies. The residuals using the linear and double-linear fits do not depend on the total stellar mass. However, the bad fits on the lower Σ⋆ data using the S14-function deliver high residuals for the low-mass galaxies. We thus conclude that the RMZR does not depend on the total stellar mass, as the residuals when adopting a linear/double-linear function do not depend on the total stellar mass. The chemical enrichment occurs at local scales (<100 pc), also observed at larger spatial resolution (e.g. at 1–2 kpc; Barrera-Ballesteros et al. 2016; Hwang et al.2018).
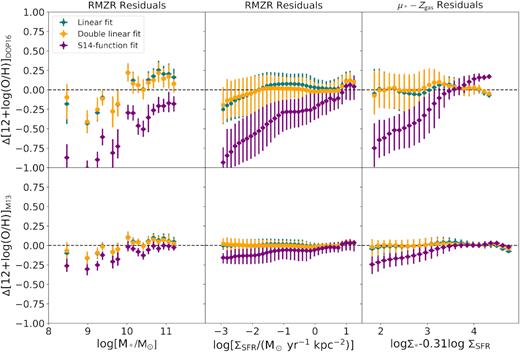
Analysis of the residuals Δ12 + log(O/H) for the DOP16 (top) and M13 (bottom) calibrations, as a function of the total stellar mass (left), logΣSFR (middle), and logΣ⋆ - 0.31 log ΣSFR. The median and 1σ deviation (error bar) from all the SF spaxels in each x-bin have been presented as blue dots, orange squares, and purple diamonds for the linear fit, double-linear fit, and S14-function fit, respectively.
Similarly, it is important to determine whether the RSFMS has a local or global origin. Fig. 11 already showed that the shape of the RSFMS barely changed with increasing total stellar mass. Analogously to the study of the residuals of the RMZR, we now analyse the residuals from the RSFMS as a function of the total stellar mass. Fig. 14 confirms that the RSFMS does not depend on the total stellar mass, as the residuals of this relation do not depend on the total stellar mass.
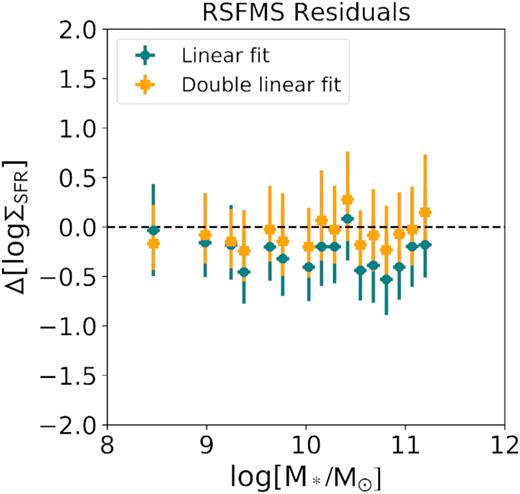
Analysis of the residuals ΔlogΣSFR as a function of the total stellar mass. The median and 1σ deviation from all the SF spaxels in each x-bin have been presented as blue dots and orange squares for the linear and double-linear fits, respectively.
6.2 Secondary dependence of the RMZR with the SFR
In global terms, the total SFR has been suggested to be a second parameter on the global MZR (e.g. Ellison et al. 2008; Lara-López et al. 2010; Mannucci et al. 2010). Neither MaNGA (Barrera-Ballesteros et al. 2017) and CALIFA (Sánchez et al. 2017) nor SAMI (Sánchez et al. 2018) have found the corresponding second relation in their IFU data. This discrepancy between global and resolved studies is an important matter of study. Equally important is to find the physical scenario that can describe our collection of results.
First, the bottom-left panel of Fig. 9 showed a complex relationship between the RMZR and ΣSFR: ΣSFR increases with both increasing Zgas and Σ⋆. Secondly, the RSFMS (Fig. 10) revealed increasing ΣSFR with Σ⋆. It is therefore unclear whether the relationship seen in Fig. 9 between the RMZR and ΣSFR is due to the RSFMS or due to the SFR as a secondary parameter in the RMZR.
As in the previous subsection, the analysis of the residuals clarifies the existence of this possible dependence. The second column of Fig. 13 shows the behaviour of the residuals of the RMZR as a function of ΣSFR. We see that the residuals do not correlate with ΣSFR. We also define μ* = logΣ⋆ − αlog ΣSFR (Mannucci et al. 2010) as a possible quantity to minimize the scatter in the RMZR relation. Therefore, we explore the μ⋆–Zgas relation, fitting it using three different functions (single linear, double linear, and S14-function), and study the residuals (third column of Fig. 13). The minimum scatter in the residuals was found for α = 0.31 and is σDOP16 = 0.237, 0.234, and 0.286 dex and σM13 = 0.094, 0.092, and 0.108 dex for the single-linear, double-linear, and S14-function fits, respectively. These residuals are larger than those of the original RMZR, confirming that there is no secondary dependence of the RMZR with the ΣSFR. Additionally, the unclear relationship between RMZR and ΣSFR may well be due to a rescaling of the stellar mass axis (as suggested in Barrera-Ballesteros et al. 2017).
We thus conclude that there are local (<100 pc) Σ⋆–Zgas and Σ⋆–ΣSFR relations for SF regions in galaxies that lie in the SFMS. This result, where less-dense regions are less chemically evolved than the denser regions (which tend to reside in the centres of galaxies), is consistent with an inside-out growth (i.e. the central regions form earlier and are denser than the outer regions). The global MZR thus emerges from the local one, and the local enrichment does not depend on the total stellar mass. In other words, the chemical enrichment is dominated by local processes (Rosales-Ortega et al. 2012; Sánchez et al. 2014; Barrera-Ballesteros et al. 2016, 2017). The local SFR seems to depend only on the local potential, being directly correlated with the local Σ⋆ on top of which the local SF is taking place, but this relation is independent of the total stellar mass. Dust attenuation appears to follow SFR alone. It is independent of local metallicity, Σ⋆, and total stellar mass.
7 CONCLUSIONS
We have presented the first results for the 38 star-forming disc galaxies along the |$z$| = 0 SFMS that have been observed so far in the MAD survey. The novelty of MAD is the ability to probe the emission line fluxes on spatial scales of ∼100 pc. After correcting the emission line fluxes from dust extinction using the local Balmer decrements measured in the MUSE spectra, we have computed the relevant emission line ratios required to measure accurate SFR, BPT diagrams, DIG components, and gas metallicities. To parametrize the local BPT properties within the discs, we defined a continuous variable η that unambiguously identifies the location of the spectrum on the BPT diagram, and thus the source of the gas ionization. Our main conclusions are as follows:
There is a correlation between the mean gas metallicity inside 0.5 Re and the total stellar mass (MZR). This correlation holds for all star-forming components, i.e. when H ii regions and DIG are considered separately.
Adopting as our fiducial gas metallicity calibrator the theoretically based parameter introduced by DOP16, we find a universal trend for negative gas metallicity gradients in the inner regions of the local discs that are sampled in our MAD data. This result is consistent with the cosmologically motivated inside-out scenario for the growth of galactic discs, although it is not a sufficient condition to prove such a scenario. Radially declining metallicities, i.e. negative metallicity gradients, are found also when separately considering H ii regions and the DIG. Outside 0.5 Re, the metallicity decreases with radius more rapidly for low-mass galaxies than for high-mass galaxies.
The 2D gas metallicity distributions reveal a large amount of structure and scatter at any galactocentric radius, which is lost when deriving the azimuthal averages to produce the gradients. Generally, the H ii regions are on average ∼0.2 dex more metal enriched than the DIG at any radius.
We find that the RMZR holds at the ∼100 pc scales sampled by MAD for about 4 orders of magnitude in Σ⋆ and over a broad range of metallicities, 7.8 < Zgas < 9.3. The relation flattens above a threshold of |$\Sigma _{\star }\gtrsim \, 10^3\, \mathrm{M}_{\odot }{\rm \,pc}^{-2}$|, although Zgas continues increasing for increasing Σ⋆ with a shallower slope. We find that the global MZR arises from the local MZR at these scales (RMZR), as the residuals of the RMZR do not depend on the total stellar mass. We find that there is no secondary dependence of the RMZR with the ΣSFR, as introducing this as a secondary parameter does not reduce the scatter of the RMZR.
We find a correlation between Σ⋆ and ΣSFR on the explored ∼100 pc scales, spanning 5 orders of magnitude in Σ⋆ and four in ΣSFR. This relation holds for both H ii regions and DIG, being the ΣSFR in the H ii regions ∼1 dex higher than that of the DIG (we find a ‘retired’ RSFMS for the DIG). The slope of this relation depends only weakly on total stellar mass. The residuals of the RSFMS do not correlate with the total stellar mass.
Dust extinction seems to follow only ΣSFR. It is independent of Σ⋆ and metallicity.
SUPPORTING INFORMATION
Additional Supporting Information may be found in the online version of this article:
Appendix A. Notes on individual galaxies
Appendix B. Determination of the BPT-parameter η
Appendix C. Beyond the radial gradients: 2D metallicity distributions
Appendix D. Complementary figures to the resolved mass–metallicity relation
Appendix E. Complementary figures to the resolved mass–SFR relation
Please note: Oxford University Press is not responsible for the content or functionality of any supporting materials supplied by the authors. Any queries (other than missing material) should be directed to the corresponding author for the article.
ACKNOWLEDGEMENTS
We thank Amanda Bluck for her useful comments during the preparation of this manuscript. We thank the referee for their comments, which improved the quality of the paper. Based on observations collected at the European Organisation for Astronomical Research in the Southern Hemisphere under ESO programmes 095.B-0532(A), 096.B-0309(A), 097.B-0165(A), 097.B-0640(A), 098.B-0551(A) and 099.B-0242(A). and we would like to thank the ESO staff for their assistance and support during the MUSE GTO campaigns. We acknowledge the usage of the HyperLeda data base (http://leda.univ-lyon1.fr). This research has made use of the NASA/IPAC Extragalactic Database (NED), which is operated by JPL, Caltech, under contract with NASA. SEF and CMC acknowledge support from the Swiss National Science Foundation. AMI acknowledges support from the Spanish MINECO through project AYA2015-68217-P. JS acknowledges VICI grant 639.043.409 from the Netherlands Organization for Scientific Research (NWO). VPD is supported by STFC Consolidated grant ST/M000877/1 and acknowledges the personal support of George Lake, and of the Pauli Center for Theoretical Studies, which is supported by the Swiss National Science Foundation (SNF), the University of Zürich, and ETH Zürich, during a sabbatical visit in 2017.
Footnotes
Based on observations obtained at the VLT of the European Southern Observatory, Paranal, Chile (ESO Programme IDs 095.B-0532, 096.B-0309, 097.B-0165, 098.B-0551, and 099.B-0242).
REFERENCES
,
