


Abstract
LMC P3 is the most luminous gamma-ray binary discovered to date and the first detected outside of the Galaxy, with an orbital period of 10.301 d. We report on optical spectroscopic observations undertaken with the Southern African Large Telescope using the High Resolution Spectrograph. We find the binary is slightly eccentric, e = 0.40 ± 0.07, and place the time of periastron at HJD 2457412.13 ± 0.29. Stellar model fitting finds an effective temperature of |$T_ {\rm eff} = 36351 \pm 53$| K. The mass function, f = 0.0010 ± 0.0004 M|$\odot$|, favours a neutron star compact object. The phases of superior and inferior conjunctions are 0.98 and 0.24, respectively (where phase 0 is at the Fermi-LAT maximum), close to the reported maxima in the GeV and TeV light curves.
1 INTRODUCTION
Gamma-ray binaries are a distinct class of high-mass binary systems, defined by having spectral energy distributions that peak (in a νFν distribution) in the gamma-ray regime (see e.g. Dubus 2013, for a detailed review of these sources). There are only seven such systems known, the most recent of which, PSR J2032+4127, was recently detected at very high energies around periastron in 2017 November (Ho et al. 2017; Mirzoyan & Mukherjee 2017; The VERITAS Collaboration 2018). In this paper we present high-resolution spectroscopic optical observations of the recently discovered source LMC P3, the most luminous of the gamma-ray binaries and the first detected outside of the Galaxy, lying in the Large Magellanic Cloud (LMC; Corbet et al. 2016).
All gamma-ray binaries consist of a compact object, within the mass range of a neutron star or a black hole, which is in orbit around an O- or B-type star (Dubus 2013; Corbet et al. 2016). However, for only two systems, PSR B1259−63/LS 2883 and the recently detected PSR J2032+4127, is the nature of the compact known, since they have been detected as pulsars (Johnston et al. 1992; Abdo et al. 2009). In these systems, the non-thermal emission is believed to arise due to the particle acceleration that occurs at the shock that forms between the pulsar and stellar winds. In the other sources a black hole compact object cannot be ruled out, and microquasar scenarios are still considered.
LMC P3 was a point-like source ‘P3’ detected in Fermi-LAT observations of the LMC (Ackermann et al. 2016). The binary nature of LMC P3 was discovered through a search for periodicity in Fermi-LAT observations, finding a 10.301 ± 0.002 d period (Corbet et al. 2016). LMC P3 is associated with the previously detected point-like X-ray source CXOU 053600.0−673507 located in the supernova remnant DEM L241 (Bamba et al. 2006). It was previously suggested by Seward et al. (2012) that based on the variability of the X-ray flux and small variations of the radial velocity of an O5 iii(f) star (V = 13.5) coincident with this X-ray source, that the object was a High-Mass X-ray Binary (HMXB) with a period of tens of days. X-ray and radio observations confirmed the multiwavelength modulation on the same 10.301 d period while optical radial velocity measurements of the O5 iii(f) star (the earliest type of any gamma-ray binary) also showed a variation consistent with this period (Corbet et al. 2016). The binary solution to the radial velocities found a mass function of |$f(M) = \left(1.3^{+1.1}_{-0.6} \right) \times 10^{-3}$| M⊙, however, the eccentricity of the system could not be constrained.
The radio and X-ray light curves are in phase, but are in antiphase with the Fermi-LAT light curves (Corbet et al. 2016). The H.E.S.S. telescope has subsequently reported detection at TeV energies (though only in a single phase bin) which is also in antiphase with the Fermi-LAT observations (HESS Collaboration 2018). This is very similar to what is observed for the gamma-ray binary LS 5039 (Aharonian et al. 2005; Abdo et al. 2009; Kishishita et al. 2009). Key to understanding the gamma-ray emission is obtaining a clear solution for the binary parameters of the source. Here we report on optical spectroscopic observations of LMC P3 undertaken with the Southern African Large Telescope (SALT) using the High Resolution Spectrograph (HRS), to establish the binary parameters.
2 OBSERVATIONS
2.1 Observations and data reduction
LMC P3 was successfully observed 24 times with the HRS (Bramall et al. 2010, 2012; Crause et al. 2014) on the SALT (Buckley, Swart & Meiring 2006) between 2016 September 14 and 2017 February 6.
The HRS is a dual-beam fibre-fed Échelle spectrograph, housed within a vacuum tank, inside a thermo-stable room. The HRS is designed for extrasolar planet searches with velocity accuracies of 5 m s−1 in the High Stability Mode. As part of the HRS calibration plan, flats and ThAr hollow-cathode lamp spectra are obtained weekly through both the object and sky fibres. Observations of radial velocity standards are taken as part of the HRS calibration plan.1
Observations were undertaken using the Low Resolution Mode (|$R=14\, 000$|), with each observation consisting of two camera exposures of 1 220 s, (except for two nights where the exposure was increased to 2 × 1 640 s). The different orders of the HRS spectra were extracted and wavelength calibrated using the HRS pipeline discussed in Kniazev, Gvaramadze & Berdnikov (2016). Each individual order of the spectrum was normalized and merged into a single one dimension spectrum using the standard iraf/pyraf packages. Heliocentric correction was performed for each individual exposure using rvcorrect/dopcor and then nightly observations were averaged together.
HRS observations are undertaken with a 2.2 arcsec fibre placed on the target and a separate ‘sky fibre’ that must be placed at least 16 arcsec away from the target. Because the target lies within a nebula the sky lines are dominated by the Balmer emission lines arising from the nebula, and the background sky measured in the sky fibre was significantly different from the sky as measured at the target. As a result, the sky subtraction was not able to properly correct for the nebula emission and introduced more noise into the spectrum. For this reason, no sky subtraction was performed and the analysis was restricted to the ‘blue’ arm of the HRS where the nebula and sky contamination was minimal.
2.2 Radial velocity determination
The radial velocity was investigated by fitting the position of individual lines and by cross-correlating the spectrum to a template.
The observed central wavelength of different absorption lines was determined by fitting Gaussian profiles, which showed that different line species have different radial velocities. This effect has previously been noted in O-type stars, and is most likely due to the contamination by the stellar wind (see e.g. Puls et al. 1996; Casares et al. 2005; Sarty et al. 2011; Waisberg & Romani 2015).
Because of the different velocities found for different lines the radial velocity was determined by cross-correlating individual spectra to a template, using the rvsao/xcsao package (Kurtz & Mink 1998). We followed a similar process to that described in, for example, Foellmi, Moffat & Guerrero (2003), Manick, Miszalski & McBride (2015), and Monageng et al. (2017), and created the template from the available observations. To create the reference template, first an average of all observations was found and the velocity shift between each observation and the average spectrum was determined through cross-correlation. Next, all the individual spectra were corrected by the shift to the average spectrum and the template was produced by averaging these velocity corrected spectra. The final template spectrum, in the 4150–4600 Å wavelength range used for the cross-correlation, is shown in Fig. 1.
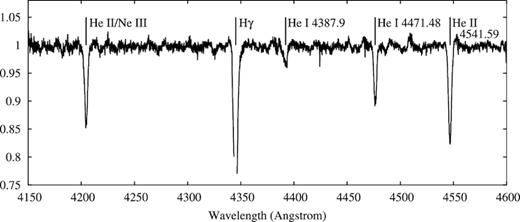
Template spectrum created from averaging over all observations. The gap in the H γ line is where a section was excluded from the cross-correlation calculation because of contamination by a emission line from the nebula.
In order to determine the zero velocity of the template spectrum, we used the ulyss program (Koleva et al. 2009) with a medium spectral-resolution MILES library to simultaneously determine the line-of-sight velocity for the star, and its T|$_{\rm eff}$|, log g, and [Fe/H]. A fit over the 4160–5000 Å wavelength range finds a redshift of cz = 320.7 ± 0.7 km s−1 (with a dispersion of 58.9 ± 1.2 km s−1). The stellar model fitting method also provides a best fit to the atmospheric properties of the star, finding an effective temperature of |$T_{\rm eff} = 36351 \pm 53$| K, a surface gravity log g = 3.4 ± 0.1 [log (cm s−2)], and a metallicity of |${}[{\rm Fe/H}] = 0.25 \pm 0.01$|.
This is compatible with an O iii type star, though the values are lower than those of an O5 iii star in, for example, Martins, Schaerer & Hillier (2005). However, the exclusion of parts of the Balmer lines prevents us from undertaking more detailed stellar atmospheric modelling.
The final radial velocity, relative to the template, was calculated by performing the cross-correlation analysis in the 4150–4600 Å wavelength range which contains four He lines and the H γ line, and which has limited contamination from the sky lines and the nebula. The wavelength region 4343.5–4346.5 Å was ignored in the cross-correlation analysis as it contained significant contamination from a narrow nebula emission line superimposed on the stellar absorption line.
2.3 Orbital parameter determination
The binary orbital parameters were determined from the fit to the radial velocities using the helio_rv package which is part of the IDL Astronomy Library (Landsman 1993).2 All reported errors on the fitted binary parameters are calculated by scaling the errors in the radial velocity measurements to achieve a reduced χ2 of exactly 1 (Lampton, Margon & Bowyer 1976). This scaling factor was ∼1.2–5.2 depending on the data. This does not change the values of the fitted parameters, but gives a more accurate estimate of the error, since addition systematic errors are better accounted for.
Table 1 shows the orbital parameters determined from the velocities of the individual lines. All fits were performed assuming a fixed period of 10.301 d. We find different velocities from the He i and He ii lines, as was noted above. The measurements of the individual lines do suffer from lower signal to noise and for H β contamination from a nebula emission line.
Orbital parameters as determined from the radial velocities calculated by Gaussian fits to individual lines.
| H β | He i 4471 | He i 4921 | He ii 4541 | He ii 5411 | |
|---|---|---|---|---|---|
| Time of periastron (HJD) | 2457412.15 ± 0.50 | 2457412.45 ± 0.21 | 2457411.89 ± 0.36 | 2457411.99 ± 0.21 | 2457412.14 ± 0.33 |
| Orbital period (fixed, d) | 10.301 ± 0.000 | 10.301 ± 0.000 | 10.301 ± 0.000 | 10.301 ± 0.000 | 10.301 ± 0.000 |
| Systemic velocity (km s−1) | 298.43 ± 1.26 | 331.02 ± 0.75 | 335.95 ± 2.77 | 340.00 ± 0.48 | 337.33 ± 0.71 |
| K (velocity semi-amplitude) | 13.80 ± 2.84 | 15.14 ± 2.10 | 24.23 ± 26.31 | 11.30 ± 1.21 | 11.87 ± 1.68 |
| Eccentricity | 0.40 ± 0.12 | 0.52 ± 0.07 | 0.69 ± 0.28 | 0.42 ± 0.06 | 0.46 ± 0.08 |
| Longitude of periastron (deg) | 5.9 ± 20.9 | 29.9 ± 10.4 | 354.5 ± 10.9 | 12.0 ± 8.9 | 8.1 ± 13.34 |
| Mass function (M|$\odot$|) | 0.0021 ± 0.0014 | 0.0023 ± 0.0010 | 0.0058 ± 0.0201 | 0.0011 ± 0.0004 | 0.0013 ± 0.0006 |
The solution using the radial velocities determined from cross-correlation is shown in Table 2. If the orbital period is kept as a free parameter, the best-fitting orbital period is 10.314 ± 0.044 d, which is consistent with the 10.301 ± 0.002 d period found from the Fermi-LAT data (Corbet et al. 2016). However, searches for periodicity using the Lomb–Scargle technique could not detect a statistically significant period and we have, therefore, adopted an orbital period of 10.301 d for our final result.
Orbital parameters determined from the velocities calculated by cross-correlation. Note the systemic velocity is relative to the template file used.
| Parameters | Free | Fixed |
|---|---|---|
| (adopted) | ||
| Time of periastron (HJD) | 2457411.77 ± 1.34 | 2457412.13 ± 0.29 |
| Orbital period (d) | 10.314 ± 0.044 | 10.301 ± 0.000 |
| Systemic velocity relative to template (km s−1) | 0.73 ± 0.59 | 0.68 ± 0.55 |
| Systemic velocity (km s−1) | 321.23 ± 0.88 | 321.18 ± 0.85 |
| K (velocity semi-amplitude) | 10.69 ± 1.24 | 10.69 ± 1.23 |
| Eccentricity | 0.39 ± 0.08 | 0.40 ± 0.07 |
| Longitude of periastron (deg) | 12.9 ± 12.8 | 11.3 ± 12.0 |
| Mass function (M|$\odot$|) | 0.0010 ± 0.0004 | 0.0010 ± 0.0004 |
We do note the systemic velocity we find, Γ = 321.18 ± 0.85 km s−1, is higher than the 295.8 ± 2.0 km s−1 previously reported (Corbet et al. 2016). We undertook additional analysis to confirm that the wavelength calibration performed by the HRS pipeline was correct and that the comparison to the radial velocity standards was accurate to within the expected performance. We found no evidence of any discrepancy in the calibration, nor any long-term systematic shift in the wavelength calibration over the period of observations. We believe that there are two possible reasons for this difference; there may be a possible systematic offset arising from the fit of the high-resolution template fit to the medium resolution MILES libraries (however there is no significant offset to the radial velocity standards) or there may have been a systematic offset in the zero velocity in the field O-type star used in the previous analysis. However, this difference does not change the main results of determining the orbital parameters. If this difference in the systemic velocity is removed the radial velocities are in agreement with the previous results. The final radial velocity curve and the best-fitting model are shown in Fig. 2, and the data are given in Table 3. We find the binary is slightly eccentric, e = 0.40 ± 0.07, and place the time of periastron at HJD 2457412.13 ± 0.29.
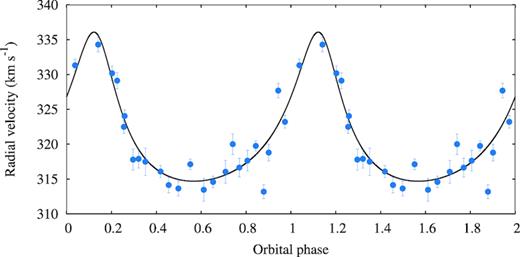
Radial velocity of the O5 iii star in the binary system, as determined from cross-correlation. The solid line shows the best fit to this data, with a fixed 10.301 d orbital period. For clarity the plot is reported over two orbital phases with phase ϕ = 0 at MJD = 57 410.25, which corresponds to the given phase in Corbet et al. (2016). The error bars show the statistical errors reported by the rvsao package.
Radial velocities obtained from cross-correlation.
| HJD | Radial velocity (km s−1) |
|---|---|
| 2457655.60791 | 316.64 ± 1.35 |
| 2457665.60399 | 320.00 ± 1.48 |
| 2457691.50654 | 322.48 ± 0.94 |
| 2457708.46002 | 318.79 ± 1.20 |
| 2457711.56664 | 330.17 ± 1.03 |
| 2457722.44354 | 324.03 ± 0.87 |
| 2457723.39659 | 317.48 ± 1.96 |
| 2457724.46868 | 314.13 ± 1.11 |
| 2457725.46161 | 317.11 ± 0.76 |
| 2457728.46743 | 319.75 ± 0.74 |
| 2457730.47147 | 331.31 ± 0.87 |
| 2457731.53120 | 334.28 ± 1.04 |
| 2457732.40171 | 329.11 ± 1.15 |
| 2457733.38795 | 317.89 ± 1.32 |
| 2457734.39469 | 316.07 ± 0.86 |
| 2457736.37916 | 313.45 ± 1.65 |
| 2457737.37704 | 316.03 ± 1.64 |
| 2457738.38493 | 317.63 ± 1.48 |
| 2457774.33596 | 317.78 ± 1.51 |
| 2457776.41725 | 313.64 ± 1.06 |
| 2457780.33657 | 313.18 ± 0.99 |
| 2457781.31273 | 323.20 ± 0.89 |
| 2457788.31389 | 314.58 ± 0.82 |
| 2457791.30522 | 327.68 ± 1.04 |
3 DISCUSSION
3.1 Mass of the compact object
The binary parameter solution gives a mass function of f = 0.0010 ± 0.0004 M|$\odot$| and the constraints on the mass of the compact object are shown in Fig. 3. The mass of an O5 iii(f) star is ∼40 M|$\odot$| (Martins et al. 2005), but due to the binary evolution could be different. A mass range of 25–42 M|$\odot$| was considered in Seward et al. (2012). For this mass range both a neutron star or black hole mass is compatible with the mass function, though a neutron star is favoured. For a 40 M|$\odot$| star, the mass of the compact object will be >5 M|$\odot$| for inclinations i ≤ 15 ± 2°, and while the inclination must be i ≤ 11 ± 1° for a 25 M|$\odot$| optical companion. Assuming the compact object is a pulsar, with a mass of 1.4 M|$\odot$|, the inclination will lie between i = 39 ± 6° and i = 59 ± 11° for a 25 M|$\odot$| and 40 M|$\odot$| star, respectively.
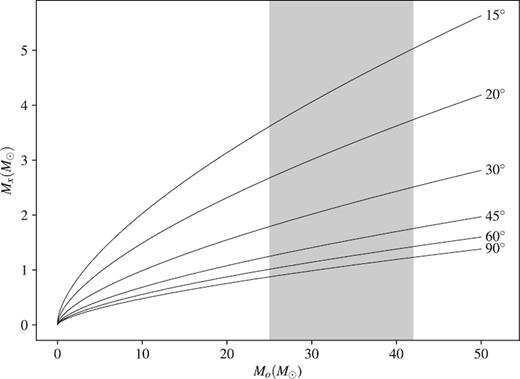
The constraint on the mass of the compact object in LMC P3. The shaded area marks the range of assumed masses of the optical companion.
3.2 Binary orientation
The orientation of the binary system is shown in Fig. 4. The system parameters are calculated assuming the optical star has a mass of M⋆ = 33.5 M|$_{\rm \odot }$| and a radius of R⋆ = 14.5 R|$_{\rm \odot }$| (average of the reported mass range and the corresponding average radius; e.g. Martins et al. 2005) and a mass of Mp = 1.4 M|$_{\rm \odot }$| for the compact object. This would correspond to an inclination of i ≈ 50°. Following Corbet et al. (2016) phase ϕ = 0 is assumed to be at MJD = 57410.25. Superior conjunction (when the compact object is behind the optical star) occurs at |$\phi _{\rm sup} = 0.98$| and inferior conjunction is at |$\phi _{\rm inf} = 0.24$| with periastron occurring at |$\phi _{\rm per} = 0.13$|.
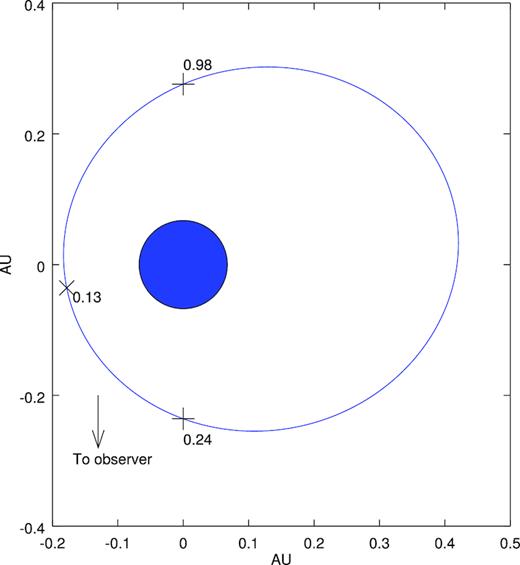
The binary orientation of the LMC P3. This is calculated assuming an M⋆ = 33.5 M|$_{\rm \odot }$| and radius of R⋆ = 14.5 R|$_{\rm \odot }$|, and Mp = 1.4 M|$_{\rm \odot }$|. The blue circle shows the relative size of the optical star while the black line traces the orbit of the compact object. The positions and orbital phase of superior and inferior conjunction are marked by + while the position and phase of periastron is marked by a ×.
3.3 Implications for gamma-ray emission
The SALT HRS observations have shown that LMC P3 has an eccentricity of ≈0.4 and established the orientation (longitude of periastron) of the system. Both the eccentricity and the orientation play an important role in the modulation of the observed gamma-ray emission, since the inverse Compton scattering is dependent on the energy density of the target photons and the angle of scattering. In the cases of the highly eccentric systems PSR B1259−63/LS 2883 and PSR J2032+4127 gamma-ray emission is only detected near periastron (e.g. H.E.S.S. Collaboration 2013; The VERITAS Collaboration 2018).
The Fermi-LAT observations of LMC P3 show a flux, peaking slightly after phase ϕ ∼ 0 (Corbet et al. 2016) while the H.E.S.S. telescope has only detected the VHE emission, in a single phase bin of ϕbin = 0.2–0.4 (HESS Collaboration 2018). Such an out of phase light curve between the GeV and TeV gamma-ray emission can arise since γγ absorption can modulate very high energy emission (e.g. Böttcher & Dermer 2005; Dubus 2006). In this scenario, because of the strong angular dependence of inverse Compton scattering and γγ absorption, both the maximum in the inverse Compton emission and γγ absorption should occur around superior conjunction. This could lead to a maximum in the GeV light curve near superior conjunction since the photons are below the pair-production threshold energy, while the maximum in the TeV light curve will occur around inferior conjunction where the γγ opacity is lowest. The binary solution found in this paper supports this for the LMC P3, with superior conjunction lying at ϕ ≈ 0.98 at the peak of the Fermi-LAT light curve, while inferior conjunction, ϕ ≈ 0.24 is around the peak in the H.E.S.S. light curve.
Additionally Doppler boosting of the emission may play a role. The tail of the shock may obtain a relativistic bulk velocity, as is evident from hydrodynamical simulations of gamma-ray binaries (e.g. Bogovalov et al. 2008, 2012). If, due to γγ absorption, we predominately observe TeV gamma-ray emission originating from this region (with the GeV emission originating from the apex of the shock), this would lead to an enhancement in the observed TeV emission near inferior conjunction when the material is directed towards us (see e.g. Dubus, Cerutti & Henri 2010; Zabalza et al. 2013).
4 CONCLUSION
We have undertaken SALT/HRS observations of LMC P3 and established the best orbital parameters for this system so far. The best-fitting solution shows the binary has an eccentricity of e = 0.40 ± 0.07, which makes it similar to LS 5039. The best orbital parameter fit places superior conjunction at orbital phase ϕ = 0.98, close to the maximum in the Fermi-LAT light curve, while inferior conjunction is at phase ϕ = 0.24. This orientation may explain the antiphase between the GeV and TeV light curves. The determined mass function, f = 0.0010 ± 0.0004 M|$\odot$|, favours a neutron star compact object, and subsequently favours a pulsar wind driven and not accretion driven system.
ACKNOWLEDGEMENTS
The authors are grateful to P.A. Charles, A. Odendaal, A.F. Rajoelimanana, and L.J. Townsend for valuable discussions. All of the observations reported in this paper were obtained with the Southern African Large Telescope (SALT). BvS and NK acknowledge that this work was supported by the Department of Science and Technology and the National Research Foundation of South Africa through a block grant to the South African Gamma-Ray Astronomy Consortium. AK and PV acknowledge the support of the National Research Foundation of South Africa.
Footnotes
Based on observations made with the Southern African Large Telescope (SALT) under program 2016-1-MLT-006 (PI: N. Komin).
The full details of the calibration plan and the stability of the radial velocity determinations are given in the SALT proposal call documentation http://pysalt.salt.ac.za/proposal_calls/current/ProposalCall.html.
