


ABSTRACT
We present a suite of seven 3D supernova simulations of non-rotating low-mass progenitors using multigroup neutrino transport. Our simulations cover single star progenitors with zero-age main-sequence masses between |$9.6$| and |$12.5 \, \mathrm{M}_\odot$| and (ultra)stripped-envelope progenitors with initial helium core masses between |$2.8$| and |$3.5 \, \mathrm{M}_\odot$|. We find explosion energies between |$0.1$| and |$0.4\, \mathrm{Bethe}$|, which are still rising by the end of the simulations. Although less energetic than typical events, our models are compatible with observations of less energetic explosions of low-mass progenitors. In six of our models, the mass outflow rate already exceeds the accretion rate on to the proto-neutron star, and the mass and angular momentum of the compact remnant have closely approached their final value, barring the possibility of later fallback. While the proto-neutron star is still accelerated by the gravitational tug of the asymmetric ejecta, the acceleration can be extrapolated to obtain estimates for the final kick velocity. We obtain gravitational neutron star masses between |$1.22$| and |$1.44 \, \mathrm{M}_\odot$|, kick velocities between |$11$| and |$695\, \mathrm{km}\, \mathrm{s}^{-1}$|, and spin periods from |$20\, \mathrm{ms}$| to |$2.7\, \mathrm{s}$|, which suggest that typical neutron star birth properties can be naturally obtained in the neutrino-driven paradigm. We find a loose correlation between the explosion energy and the kick velocity. There is no indication of spin–kick alignment, but a correlation between the kick velocity and the neutron star angular momentum, which needs to be investigated further as a potential point of tension between models and observations.
1 INTRODUCTION
While it is well established that many massive stars end their life as a core-collapse supernova, numerical simulations have long struggled to conclusively explain the mechanism that powers these explosions. The best-explored scenario is arguably the neutrino-driven mechanism, which relies on the partial reabsorption of neutrinos emitted from the young proto-neutron star (PNS) and the accretion layer at its surface to revive the shock and power the explosion (for reviews, see Mezzacappa 2005; Janka 2012; Burrows, Dolence & Murphy 2012). Models of neutrino-driven explosions have long teetered on the verge between success and failure, and temporary setbacks – like the failure of the first three-dimensional (3D) three-flavour multigroup neutrino hydrodynamics simulations (Hanke et al. 2012) – sometimes unduly obscured the progress in methodology and understanding.
In the last few years, however, 3D first-principle models of neutrino-driven explosions have become increasingly successful (see the reviews of Müller 2016; Janka, Melson & Summa 2016). Shock revival by neutrino heating has now been observed in a sizable number of 3D simulations by different groups employing multigroup transport with varying degrees of sophistication (Takiwaki, Kotake & Suwa 2012, 2014; Melson, Janka & Marek 2015a; Melson et al. 2015b; Müller 2015; Lentz et al. 2015; Roberts et al. 2016; Müller et al. 2017a; Ott et al. 2018; Chan et al. 2018; Kuroda et al. 2018; Summa et al. 2018; Müller et al. 2018; Vartanyan et al. 2018) for a wide mass range of progenitors. Perhaps even more importantly in the light of modelling uncertainties and lingering failures without shock revival (Hanke et al. 2012; Tamborra et al. 2014; O’Connor & Couch 2018), it has been realized that a number of physical effects that are not yet included in most simulations can systematically help to further expedite neutrino-driven explosion, such as the softening of the equation of state by muon creation (Bollig et al. 2017), convective seed asymmetries in the progenitors (Couch & Ott 2015; Müller & Janka 2015; Couch et al. 2015; Müller 2016; Müller et al. 2017a), and the reduction of the neutrino scattering opacity due to nucleon correlations (Horowitz et al. 2017; Bollig et al. 2017), or the strangeness of the nucleon (Melson et al. 2015b).
With strong indications that neutrino heating can indeed trigger shock revival, one of the next challenges for the models is to predict explosion and compact remnant properties in order to connect to observational findings, e.g. on the distribution and systematics of neutron star birth masses (Özel & Freire 2016; Antoniadis et al. 2016; Tauris et al. 2017), neutron star kicks (Hobbs et al. 2005; Faucher-Giguère & Kaspi 2006; Ng & Romani 2007), and supernova explosion energies and nickel masses (Poznanski 2013; Pejcha & Prieto 2015; Müller et al. 2017b). First-principle simulations still face a time-scale problem here, whereas shock revival is typically expected to occur on time-scales of only a few hundred milliseconds after the collapse of the iron core to a PNS, the explosion and remnant properties are determined during a phase of concurrent accretion and mass ejection that can last on the order of seconds (Müller 2015; Bruenn et al. 2016). While axisymmetric models can probe these long time-scales (Müller 2015; Bruenn et al. 2016; Nakamura et al. 2016), 3D effects qualitatively alter this phase (Müller 2015). Except for low-energy explosions from the least massive progenitors (Melson et al. 2015a; Müller et al. 2018), self-consistent 3D models cannot yet follow neutrino-driven explosions sufficiently far to obtain fully converged explosion energies and remnant properties. It thus remains to be demonstrated that neutrino-driven explosions can explain the full gamut of supernova energies – although the long-time models of Bruenn et al. (2016) in two dimensions (2D) and Müller et al. (2017a) in 3D have progressed far towards this goal – and reveal the systematics of explosion and remnant properties. More phenomenological models (Ugliano et al. 2012; Ertl et al. 2016; Pejcha & Thompson 2015; Müller et al. 2016a; Sukhbold et al. 2016) are presently the only viable theoretical approach for this purpose, but it is imperative that they be put on a firmer footing with the help of select multidimensional simulations.
In this paper, we take the next step towards this goal. Using a larger set of long-time 3D simulations with multigroup transport, we explore variations in explosion and remnant properties of supernova progenitors with low-mass cores and investigate possible correlations among them, such as the claim of spin–kick alignment (Ng & Romani 2007; Noutsos et al. 2012, 2013; Rankin 2015) and the suggested correlation between explosion energy, progenitor mass, and neutron star kick (Bray & Eldridge 2016; Janka 2017; Tauris et al. 2017; Vigna-Gómez et al. 2018). Focusing on progenitors with low-mass cores allows us to advance the simulations sufficiently far to tentatively address these questions using 3D models with multigroup neutrino transport for the first time. Recognizing the importance of binary star evolution for stripped-envelope supernovae (Smith et al. 2011; Eldridge et al. 2013), we include both single-star progenitors in the mass range of |$9\!-\!13 \, \mathrm{M}_\odot$| as well as binary progenitor models, extending our recent work on ultra-stripped supernovae (Müller et al. 2018). The single- and binary-star progenitor models cover a similar range of final helium core1 masses below |$3.2\, \mathrm{M}_\odot$|. The existence of ultra-stripped supernovae was first suggested purely based on theoretical calculations of the final stages of mass transfer in close-orbit binaries (Tauris et al. 2013) and it was realized that progenitors of neutron star gravitational wave mergers must have experienced such ultra-stripped supernovae when the second-formed neutron star is born (Tauris et al. 2013; Tauris, Langer & Podsiadlowski 2015). A number of promising ultra-stripped supernova candidates have been identified based on observed properties of rapidly decaying supernova light curves (Drout et al. 2013; Moriya et al. 2017; De et al. 2018).
Where appropriate, the progenitors investigated here are initialized with proper 3D initial conditions in the active oxygen burning shell by simulating the last minutes of the shell evolution in 3D in the vein of Müller et al. (2016b).
Our paper is structured as follows: in Section 2, we introduce the stellar progenitor models, including a short discussion of the multidimensional flow geometry in the oxygen shell at collapse where applicable. In Section 3, we briefly describe the coconut-fmt code used for our supernova simulations with a focus on recent updates to the neutrino rates and hydrodynamics. The results of the simulations are presented in Section 4, and we conclude with a discussion of their implications in Section 5.
2 PROGENITOR MODELS
We simulate the collapse and explosion of seven progenitor models of different mass and metallicity. Four of our progenitors (z9.6, s11.8, z12, and s12.5) are single-star models evolved from the hydrogen zero-age main sequence (ZAMS) to core collapse using the stellar evolution code kepler (Weaver, Zimmerman & Woosley 1978; Heger & Woosley 2010). Two of these have been described previously: Model z9.6 was first used in Janka et al. (2012), and the 3D simulation presented here is identical to the one in Müller (2016); progenitor model s11.8 is taken from Banerjee et al. (2016).
In addition to single-star progenitors, we consider progenitors that have undergone mass loss via binary interactions. Models he2.8 and he3.5 (Tauris et al. 2015) are examples for ultra-stripped progenitors that can evolve from the companion star in high-mass X-ray binary (HMXB) systems which undergo common-envelope (CE) evolution followed by an additional (so-called Case BB) mass-transfer episode (Tauris et al. 2013; Tauris et al. 2015, 2017). Model he2.8 is the same progenitor as used in Müller et al. (2018) with an initial helium core mass of |$2.8 \, \mathrm{M}_\odot$| and an initial orbital period of |$20 \, \mathrm{d}$|. Model he3.5 has an initial helium core mass of |$3.5 \, \mathrm{M}_\odot$| and an initial orbital period of |$2 \, \mathrm{d}$|, and is representative for the ultra-stripped progenitors with more massive metal cores at collapse in Tauris et al. (2015). These two models were evolved starting with a zero-age helium star main-sequence configuration after the termination of the CE phase. The interior evolution and the final mass transfer were calculated using the binary evolution code bec (Wellstein, Langer & Braun 2001; Yoon, Woosley & Langer 2010) until after the detachment of the binary. To follow the late burning stages using a large nuclear reaction network, the models were then mapped to kepler during core Ne burning.
In addition, we consider the |$3 \, \mathrm{M}_\odot$| helium star model he3.0 that has been evolved with kepler as an example of a progenitor that has lost its complete H envelope due to binary interactions, but has not undergone further mass transfer afterwards.
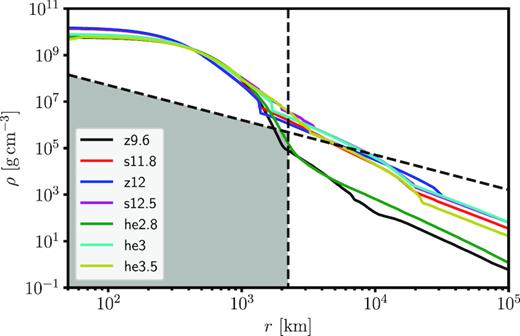
Density profiles of the seven progenitor models. The grey-shaded area marks the region for ECSN-like explosion dynamics, which obtains if the density drops below a critical value given by equation (1, slanted dashed line) inside a radius of about |$2200 \, \mathrm{km}$| (vertical dashed line). The slanted dashed line also roughly corresponds to an accretion rate on to the shock of |$0.05 \, \mathrm{M}_\odot \, \mathrm{s}^{-1}$|. Models z9.6 and he2.8 fall into the regime of ECSN-like explosions.
Summary of initial stellar models and simulation set-up.
| Model | Initial state | Mini|${}(\, \mathrm{M}_\odot )$| | Mf|${}(\, \mathrm{M}_\odot )$| | MHe, f|${}(\, \mathrm{M}_\odot )$| | Z (Z⊙) | Code up to Ne burning | 3D initial conditions | PPM scheme | Axis treatment | Nucleon correlations | Weak magnetism | ga, s |
|---|---|---|---|---|---|---|---|---|---|---|---|---|
| z9.6 | H ZAMS | 9.6 | 9.6 | 1.38 | 0 | kepler | No | CW84 | Coarsening | No | no | 0 |
| s11.8 | H ZAMS | 11.8 | 10.4 | 2.45 | 1 | kepler | Yes | CS08 | Coarsening | Yes | no | −0.05 |
| z12 | H ZAMS | 12.0 | 12.0 | 2.49 | 0 | kepler | Yes | CW84 | Coarsening | Yes | no | −0.05 |
| s12.5 | H ZAMS | 12.5 | 9.78 | 3.17 | 1 | kepler | Yes | CW84 | Coarsening | Yes | no | 0 |
| he2.8 | He ZAMS | 2.8 | 1.49 | 1.49 | 1 | bec | No | CW84 | Coarsening | No | no | 0 |
| he3.0 | He ZAMS | 3.0 | 3.00 | 3.00 | 1 | kepler | Yes | CS08 | Fourier filter | Yes | yes | −0.05 |
| he3.5 | He ZAMS | 3.5 | 2.39 | 2.39 | 1 | bec | No | CS08 | Fourier filter | Yes | no | −0.05 |
Notes: Mini is the initial mass of the stellar evolution model. For the single-star progenitors, this is the ZAMS mass; for the helium star (binary) models, it is the initial helium star mass. Mf and MHe, f are the progenitor mass and the helium (core) mass at the pre-supernova stage; these are identical for the stripped-envelope models. Z is the initial metallicity. CW84 refers to the original PPM reconstruction of Colella & Woodward (1984), and CS08 refers to the sixth-order extremum-preserving method of Colella & Sekora (2008). ga, s is the strangeness contribution to the axial coupling constant for neutral currents. Tauris et al. (2015).
Recognizing the potentially significant role of pre-collapse seed asphericities in the core-collapse supernova explosion mechanism (Couch & Ott 2013; Müller & Janka 2015; Müller et al. 2017a), we simulated the convective burning in the active O shell in 3D for the last few minutes prior to collapse for some of these progenitors (s11.8, z12, s12.5, and he3.0) using the same methodology as in Müller et al. (2016b). The other models do not exhibit violent shell convection at the onset of collapse that could affect shock revival: in the 1D stellar evolution models, the innermost active convective shells in models z9.6, he2.8, and he3.5 sit at almost |$10\,000\, \mathrm{km}$| and have convective Mach numbers of only 0.04, 0.0025, and 4 × 10⁻⁴, respectively.
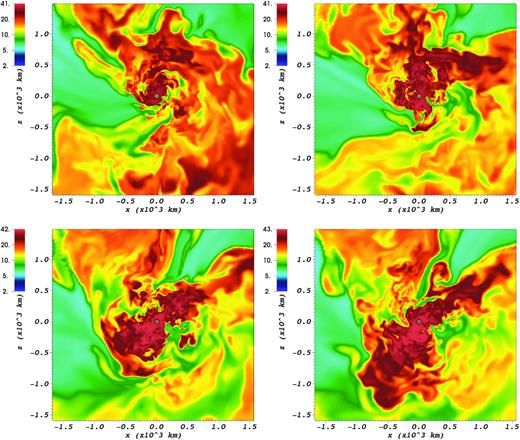
In Fig. 2, we show the radial velocity at the onset of core collapse on 2D slices for these models. Our 3D simulations of O-shell burning confirm the predictions of Collins, Müller & Heger (2018) inasmuch as they show significant variations in convective velocities, Mach numbers, and flow geometries across progenitors. Model s11.8 exhibits comparatively weak small-scale convection in the O shell with a convective Mach number of 0.06 at the base of the shell, Model z12 is relatively similar to the |$18 \, \mathrm{M}_\odot$| progenitor of Müller et al. (2016b) in terms of the convective Mach number, but the typical convective eddy scale is comparatively small. Models s12.5 and he3 both have thick convective shells dominated by large-scale motions and even higher convective Mach numbers of 0.14 and 0.16 at the base.
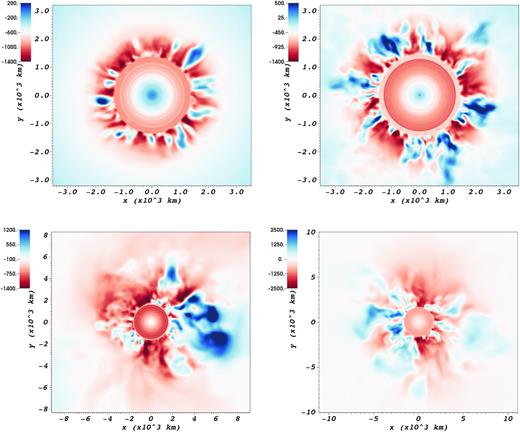
Radial velocity in units of |$\mathrm{km}\, \mathrm{s}^{-1}$| for progenitor models s11.8 (top left), z12 (top right), s12.5 (bottom left), and he3.0 (bottom right) on 2D slices at the onset of collapse. The models exhibit widely varying convective velocities and flow geometries in the active oxygen shell.
Some key parameters of the progenitor models, as well as details of the core-collapse supernova simulations that will be described in the next section, are summarized in Table 1.
3 NUMERICAL METHODS AND SIMULATION SET-UP
We use the coconut-fmt code, which solves the equations of general relativistic neutrino hydrodynamics using the extended conformal flatness (xCFC) approximation (Cordero-Carrión et al. 2009) for the space–time metric. The finite-volume hydro solver employs a hybrid HLLC/HLLE Riemann solver with higher order reconstruction (Dimmelmeier, Font & Müller 2002; Müller, Janka & Dimmelmeier 2010) and uses spherical polar coordinates. As in Müller (2015), severe time-step constraints in 3D are avoided by treating the core of the PNS in 1D and adopting a mixing-length treatment for PNS convection, and by using a filtering scheme for the conserved variables near the axis.
Recent updates to the code include sixth-order extremum-preserving reconstruction (Colella & Sekora 2008; Sekora & Colella 2009) instead of the original fourth-order piecewise parabolic method of Colella & Woodward (1984) and an alternative scheme for filtering near the polar axis. Müller (2015) and follow-up work relied on a mesh coarsening scheme that involved averaging the solution on the original spherical polar grid over coarser ‘supercells' and projecting back to the fine grid using piecewise linear reconstruction, which may favour the development of bipolar asymmetries in weakly perturbed models. For the more recent models, we have therefore adopted an alternative scheme for taming the prohibitive Courant constraint near the grid axis. Following common practice in meteorology (Jablonowski & Williamson 2011), we apply a latitude-dependent filter to damp short-wavelength Fourier modes. This technique avoids the axis artefacts of the older mesh coarsening technique and allows us to smoothly switch off filtering at large radii without complicating the data layout and communication in mpi mode. The implementation of both the mesh coarsening scheme and the Fourier-based filter is described in more detail in Appendix A.
All our models include the effect of nucleon interaction potentials on the charged-current rates (Martínez-Pinedo et al. 2012); and in the more recent simulations, we include the modification of the neutrino-nucleon scattering opacity due to nucleon correlations following Horowitz et al. (2017). Model he3.0 also includes weak magnetism corrections following Horowitz (2002).
At high densities, we use the nuclear equation of state of Lattimer & Swesty (1991) with a bulk incompressibility of |$K=220 \, \mathrm{MeV}$|, supplemented by a low-density equation of state for nuclei, nucleons, and lepton and photon radiation. The flashing treatment of Rampp & Janka (2002) is used for nuclear reactions below a temperature of |$0.5\, \mathrm{MeV}$|; at higher temperatures, nuclear statistical equilibrium is assumed.
4 RESULTS
4.1 Shock propagation and explosion energetics
The evolution of the maximum shock radius and the diagnostic explosion energy Eexpl (defined as in Müller et al. 2017a) is shown in Fig. 3. All the models in this study undergo neutrino-driven shock revival and evolve into explosion with large-scale unipolar or bipolar asymmetries (Fig. 4). Important explosion and remnant properties are summarized in Table 2. With the exception of model s12.5, the shock is revived at rather early post-bounce times between |$100$| and |$200 \, \mathrm{ms}$|. This is the result of the early infall of the O shell and the concomitant drop of the mass accretion rate |$\dot{M}_\mathrm{acc}$| (top panel of Fig. 5).
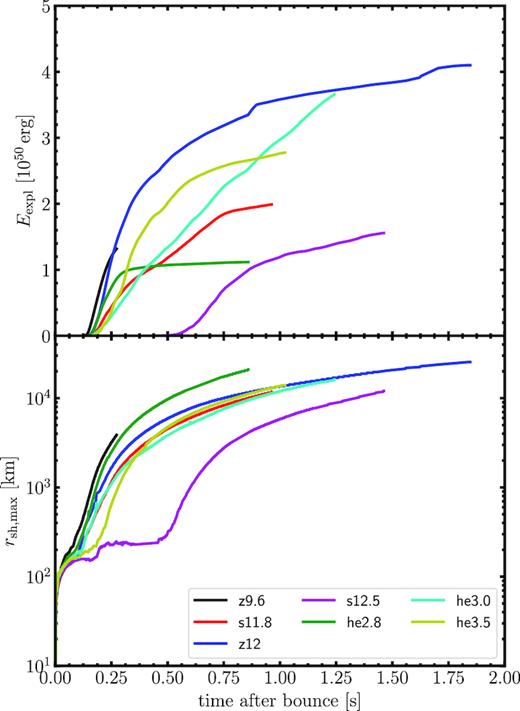
Diagnostic explosion energy Ediag (top) and maximum shock radius rsh, max as a function of time for all of the seven low-mass models.
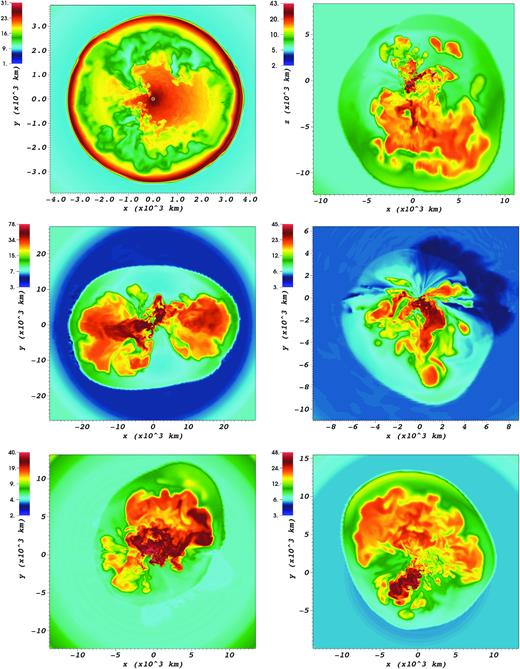
Entropy s in units of kb/nucleon on 2D slices at the end of the simulations for models z9.6 (top left), s11.8 (top right), z12 (middle left), s12.5 (middle right), he3 (bottom left), and he3.5 (bottom right). The axis of the spherical polar grid is aligned with the x-axis of the plots. Note that there is no visible alignment of the flow structures with the axis of the spherical polar grid in models s11.8, s12.5, he3, and he3.5. The explosion are predominantly unipolar, with the exception of z12, and to some degree z9.6 at early times.
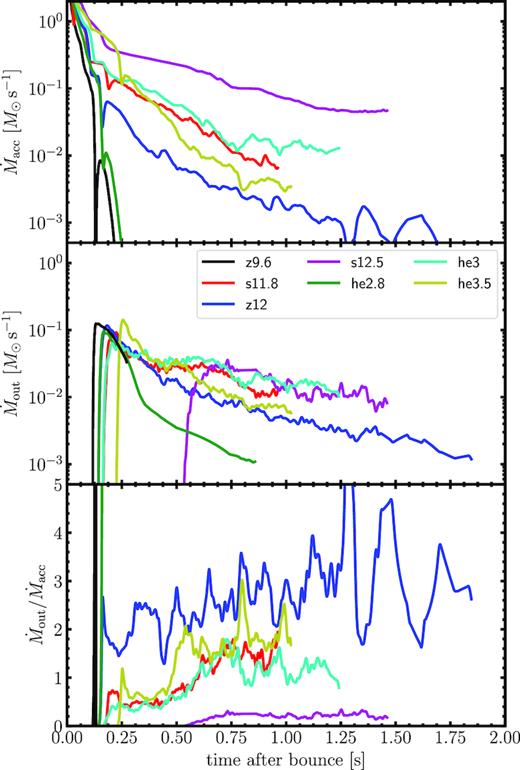
Mass accretion rate |$\dot{M}_\mathrm{acc}$| (top), mass outflow rate |$\dot{M}_\mathrm{out}$| (middle), and their ratio |$\dot{M}_\mathrm{out}/\dot{M}_\mathrm{acc}$| for all models, measured at a radius of |$400 \, \mathrm{km}$|.
Explosion and neutron star properties.
| tfin | Eexpl | MIG | Mby | Mgrav | vPNS | vPNS, ex | PPNS | α | |
|---|---|---|---|---|---|---|---|---|---|
| Model | (ms) | |$(10^{50} \, \mathrm{erg})$| | |$(\, \mathrm{M}_\odot)$| | |$(\, \mathrm{M}_\odot)$| | |$(\, \mathrm{M}_\odot)$| | |$(\mathrm{km}\, \mathrm{s}^{-1})$| | |$(\mathrm{km}\, \mathrm{s}^{-1})$| | (ms) | |
| z9.6 | 273 | 1.32 | 0.014 | 1.35 | 1.22 | 9.2 | 21 | 1060 | 48° |
| s11.8 | 963 | 1.99 | 0.024 | 1.35 | 1.23 | 164 | 278 | 152 | 64° |
| z12 | 1847 | 4.10 | 0.039 | 1.35 | 1.22 | 58 | 64 | 205 | 62° |
| s12.5 | 1461 | 1.56 | 0.013 | 1.61 | 1.44 | 170 | >170 | 20 | 55° |
| he2.8 | 860 | 1.12 | 0.010 | 1.42 | 1.28 | 10.4 | 11 | 2749 | 55° |
| he3.0 | 1242 | 3.66 | 0.035 | 1.48 | 1.33 | 308 | 695 | 93 | 76° |
| he3.5 | 1023 | 2.78 | 0.031 | 1.57 | 1.41 | 159 | 238 | 98 | 80° |
Notes: tfin is the final post-bounce time reached by each simulation, Eexpl is the final diagnostic explosion energy at the end of the simulations, MIG is the mass of iron-group ejecta, Mgrav is the gravitational neutron star mass, vPNS is the kick velocity at the end of the run, vPNS, ex is the extrapolated kick obtained from equation (6), PPNS is the estimated neutron star spin period, and α is the angle between the spin and kick vector at the end of the simulations.
Shock propagation is fastest for models z9.6 and he2.8, which have very thin O and C/O shells and hence exhibit the most rapid drop of the accretion rate. Residual accretion is thus quickly overwhelmed by the developing neutrino-heated outflows. Without the supply of fresh matter at the gain radius, the mass outflow rate |$\dot{M}_\mathrm{out}$| also declines strongly after shock revival, and the explosion energy therefore essentially plateaus at a low value as can be seen for model he2.8. The diagnostic energy at the end of these two simulations is only |$1.32 \times 10^{50}\, \mathrm{erg}$| for model z9.6 and |$1.12 \times 10^{50}\, \mathrm{erg}$| for model he2.8.
Among the other models, z12 exhibits the lowest accretion rates, but the accretion phase is much more drawn-out than for z9.6 and he2.8. This also allows the model to maintain a higher outflow rate of neutrino-heated matter, and the explosion energy Eexpl, which initially grows at a similar rate as in z9.6 and he2.8, plateaus later. By the end of the simulation at |$1.847\, \mathrm{s}$|, Eexpl has already reached a value |$4.1\times 10^{50}\, \mathrm{erg}$|; although the explosion energy has not finally saturated yet, its rate of increase has already slowed considerably.
Model he3.5 also shows first signs of the explosion energy converging towards its asymptotic value. While shock revival occurs somewhat later at a post-bounce time of |$200 \, \mathrm{ms}$| due to a later infall of the O shell, the accretion rate also drops quickly thereafter, approaching similarly low values as for z12 after |$\mathord {\sim }700 \, \mathrm{ms}$|. At the end of the simulation, the growth of the explosion energy has slowed down considerably, and we obtain a final value of |$E_\mathrm{expl}=3.66 \times 10^{50}\, \mathrm{erg}$|.
Models s11.8 and he3.0 evolve in a remarkably similar way until about |$\mathord {\sim }700 \, \mathrm{ms}$| in terms of their mass accretion rate, mass outflow rate, shock propagation, and explosion energy. At that point, the models part company with the growth of the explosion energy in model s11.8 slowing down. It is not clear whether this already indicates that the explosion energy in s11.8 is nearing saturation. Although this model shows a stronger decline of |$\dot{M}_\mathrm{acc}$| than he3.5 at late times, the mass outflow rate |$\dot{M}_\mathrm{out}$| is still similar, suggesting that the slower growth of the explosion energy is not due to a lack of supply of fresh matter at the gain region. The slower growth rate is instead due to a lower average total enthalpy |$\bar{h}_\mathrm{tot}$| in the outflows (Fig. 6), which is the main determining factor for Eexpl along with the mass outflow rate (Müller 2015). In model s11.8, |$\bar{h}_\mathrm{tot}$| drops significantly below the typical values of |$6\tt {-}9 \, \mathrm{MeV}\mathrm{\,per\,}\mathrm{baryon}$| for the other models with sustained accretion. In model he2.8, a similar drop marks the transition from the initial explosion phase to the incipient neutrino-driven wind phase, but a close inspection of the multidimensional flow dynamics in model s11.8 points towards a different reason for the drop in |$\bar{h}_\mathrm{tot}$|. Fig. 7 shows that this drop coincides with a significant realignment of the downflow and outflow geometry. Initially, the model is characterized by a strong outflow in the 3 o’clock to 6 o’clock direction (top left panel in Fig. 7, |$798\, \mathrm{ms}$| after bounce). During the next few hundreds of milliseconds, a downflow from the 9 o’clock direction intrudes into and mixes with this outflow (top right panel in Fig. 7, |$911\, \mathrm{ms}$|). Hence, much of the ejected neutrino-heated material is diluted with cold matter from the downflows, which lowers the average energy and enthalpy of the outflow. Later on (bottom row in Fig. 7, |$1045$| and |$1094\, \mathrm{ms}$|), a new outflow of high-entropy material develops into the 7 o’clock direction. Due to the limited simulation time, we cannot exclude that this new outflow grows further and reinvigorates the growth of the explosion energy. The reorientation of the outflow bears some resemblance to the phenomenon of outflow quenching in 2D simulations (Müller 2015), albeit in less dramatic form. It suggests that the energetics of 3D models after shock revival can still exhibit some degree of stochasticity and is not determined by bulk parameters like the total accretion rate, and the neutron star mass and radius alone.
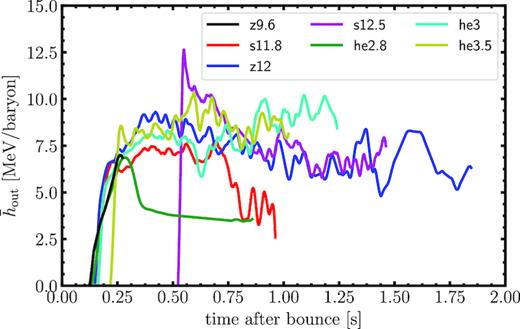
Specific total enthalpy |$\bar{h}_\mathrm{out}$| (i.e. enthalpy minus gravitational binding energy) in the outflows as a function of post-bounce time for all models.
Entropy s in units of kb/nucleon on 2D slices for model s11.8 at post-bounce times of |$798\, \mathrm{ms}$| (top left), |$911\, \mathrm{ms}$| (top right), |$1045\, \mathrm{ms}$| (bottom left), and |$1094\, \mathrm{ms}$| (bottom right). As time progresses, the two strong high-entropy outflows in the directions of 11 o’clock and 3’o clock–6 o’clock are replaced with a new outflow in the 7 o’clock direction.
Model s12.5 is characterized by significantly higher accretion rates than the other cases, and the drop in |$\dot{M}_\mathrm{acc}$| associated with the infall of the O shell is not very pronounced. Despite rather strong convective seed perturbations in the O shell, this delays shock revival to about |$500 \, \mathrm{ms}$| after bounce. During the explosion phase, the mass outflow rate |$\dot{M}_\mathrm{out}$| remains low compared to the mass accretion rate; the model is the only one that still exhibits a positive net accretion rate on to the PNS. This results in a slow growth of the explosion energy. Without additional simulations, it is not possible to definitively pin down the reasons behind the rather tepid explosion of model s12.5 as compared to he3.0, he3.5, and z12, but it is likely that a combination of factors contribute. A comparison of the neutrino emission in the different simulations (Fig. 8) reveals that s12.5 only exhibits modestly higher electron flavour luminosities and mean energies than the other progenitors in spite of considerably higher accretion rates. This is especially true beyond the first second, when the electron neutrino and antineutrino luminosity even drops below he3.0, he3.5, and z12. In the models that include strangeness corrections and nucleon correlations, somewhat faster diffusion of neutrinos from the outer layer of the PNS helps to maintain higher neutrinospheric temperatures at these rather late times. During the first |$\mathord {\sim }0.5 \, \mathrm{s}$| of the explosion, the neutrino luminosities and mean energies are, however, noticeably higher than in the other models, and should in principle allow for significantly stronger heating and a higher mass outflow rate, which is not observed. The explosion geometry may partly explain why neutrino heating is less efficient at driving outflows in this simulation. All of the other models are characterized some degree of bipolarity at the early stages of the explosion, either with two similarly prominent outflows (model z12) or with a strong and a subdominant outflow in the opposite direction (z9.6, s11.8, he2.8, he3.0, and he3.5). In model s12.5, by contrast, the explosion is clearly unipolar from early times. Accretion proceeds mostly through a very broad downflow that covers almost one entire hemisphere and undergoes very little turbulent braking and turbulent mixing before reaching the PNS. The narrower downflows in the other models dissolve more readily further away from the PNS, which implies a lower burden for the re-ejection of the accreted matter and thus allows higher outflow rates (Müller 2015; Müller et al. 2017a).
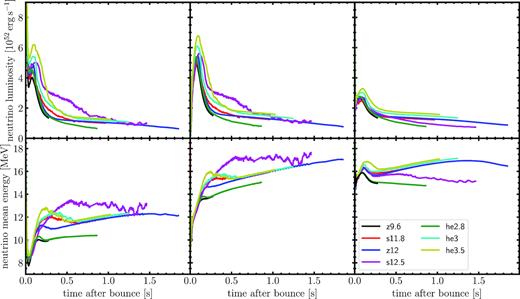
Luminosities (top row) and mean energies (bottom row) for electron neutrinos (left-hand column), electron antineutrinos (middle), and heavy flavour neutrinos (right) for all models.
4.2 Ejecta composition
Due to our simple flashing treatment and the approximations in the neutrino treatment, we can only draw limited conclusions on the inner ejecta of the simulated explosions. In particular, uncertainties in the electron fraction Ye translate into an uncertainty in the composition of the iron-group ejecta made by (partial) recombination of the neutrino-processed ejecta as discussed previously in Müller et al. (2017a). Models with more sophisticated neutrino transport tend to predict predominantly proton-rich outflows with Ye > 0.5 (Pruet et al. 2006; Fröhlich et al. 2006; Müller, Janka & Marek 2012; Wanajo et al. 2018; Vartanyan et al. 2018), although significant amounts of neutron-rich material can be produced in rapidly developing explosions. Under ‘normal’, proton-rich conditions, 56Ni is the predominant nucleus in the iron-group ejecta (Hartmann, Woosley & El Eid 1985).
Following our approach in Müller et al. (2017a, 2018), we therefore consider the total mass MIG of unbound iron-group material as an estimator for the mass of radioactive nickel (Fig. 9). In line with previous 3D simulations (Melson et al. 2015a; Müller et al. 2017a), the models are characterized by a steep rise of MIG immediately at the onset of the explosion, which stems from the recombination of shocked, photodisintegrated material that never makes it close to the PNS and/or from iron-group material from explosive burning that is entrained by the neutrino-heated bubbles. Later on, the neutrino-driven outflows contribute further iron-group material made by partial recombination at a smaller rate.
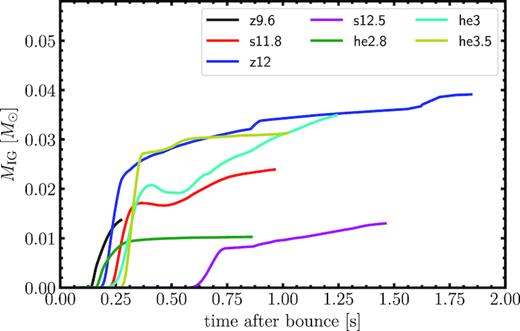
Total mass of iron-group elements in the ejecta (defined as the material that is nominally unbound at any given time) as a function of post-bounce time.
Like the explosion energies, the iron-group masses have not fully converged yet, although the increase of MIG has already flattened considerably in he2.8, he3.5, s11.8, z12, and s12.5. The preliminary values at the end of the simulations lie between |$0.01$| and |$0.04 \, \mathrm{M}_\odot$|, and there is a clear correlation between explosion energy and nickel mass. This is broadly compatible with observationally inferred values for low-mass supernovae (Chugai & Utrobin 2000; Fraser et al. 2011; Pejcha & Prieto 2015; Lisakov et al. 2018) and the well-established observational correlation between Eexpl and the nickel mass (Hamuy 2003; Pejcha & Prieto 2015).
4.3 Neutron star properties
Except for the case of s12.5, the uncertainties in the final neutron star properties are considerably smaller than for the explosion energies and nickel masses.
4.3.1 Neutron star masses
Fig. 10 shows the baryonic mass Mby of the PNS for all seven simulations. In six of the models (z9.6, s11.8, z12, he2.8, he3, and he3.5), Mby has essentially asymptoted to its final value, and actually decreases at a very small rate since the outflow rate already exceeds the accretion rate. Barring the possibility of late-time fallback, the values at the end of the runs can therefore be taken as upper limits for these six models.
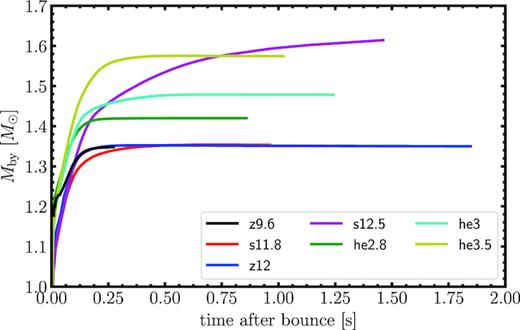
Baryonic PNS masses Mby as a function of post-bounce time. Except for model s12.5, Mby has essentially reached its final value.
Even though a comparison with observed neutron star masses is complicated by intricacies of binary evolution-like mass transfer and binary breakup, it is noteworthy that these gravitational masses fall nicely within the range of measured masses (|${\sim } 1.17\tt {-}1.6 M_{\odot }$|) in double neutron star systems (Martinez et al. 2015; Özel & Freire 2016; Tauris et al. 2017; Ferdman & PALFA Collaboration 2018). This suggests that even the rather high neutron star mass of |$\mathord {\sim } 1.67\, \, \mathrm{M}_\odot$| for the |$18\, \, \mathrm{M}_\odot$| explosion model of Müller et al. (2017a) is merely an outlier among the double neutron star systems and may otherwise be explained by the rarer observed cases of high neutron star birth masses (|$\mathord {\gt }1.7 M_{\odot }$|) in binary systems in general (Tauris, Langer & Kramer 2011). Hence, we conclude that our current 3D neutrino-driven explosion models are in fine agreement with observed neutron star masses.
4.3.2 Neutron star kicks
Fig. 11 shows the evolution of vkick for all seven models. Although the acceleration of the PNS has already slowed down in most of the models, it has clearly not yet reached its final asymptotic value. Fortunately, however, the ongoing acceleration of the PNS is mostly due to the asymmetric gravitational ‘tug' (Wongwathanarat, Janka & Müller 2013) of the early ejecta. Except for model s12.5, asymmetries in the downflows and outflows closer to the PNS no longer strongly affect the evolution of the kick for two reasons: not only has the accretion rate already dropped considerably so that there is little mass around close to the PNS to exert a gravitational tug; the orientation and strength of downflows and outflows is also quite variable at small radii so that there is little net acceleration of the PNS over time.
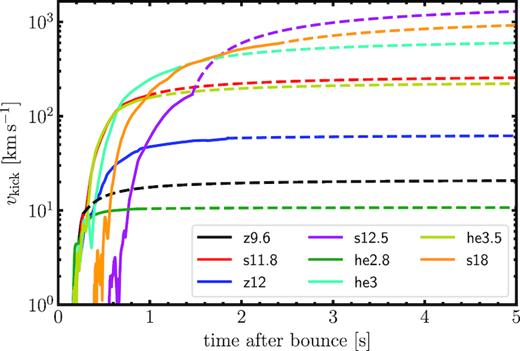
PNS kick velocity vkick as a function of post-bounce time for all models. During the simulated evolution, the kick is computed from the momentum of the ejecta invoking momentum conservation (solid curves). In addition to our seven low-mass progenitors, the |$18 \, \mathrm{M}_\odot$| model (s18) of Müller et al. (2017a) is also included. In order to extrapolate the kick beyond the final simulation time (dashed curves), we use equation (6), which assumes that the late evolution of the kick is dominated by the gravitational tug of the ejecta, and that the ejecta expand roughly homologously. Except for model s12.5, this yields a very smooth extrapolation.
Extrapolated values for vkick are shown as dashed curves in Fig. 4, and the asymptotic values are listed in Table 2. With the exception of model s12.5, equation (6) indeed provides a smooth extrapolation of the kick velocities. The inferred final values range from |$11\tt {-}21 \, \mathrm{km}\, \mathrm{s}^{-1}$| for he2.8 and z9.6 to |$695\, \mathrm{km}, \mathrm{s}^{-1}$| for he3. The values at the low-mass end of the spectrum of single-star and (ultra)stripped-envelope progenitors of iron core-collapse supernovae are thus of the same order as for ECSNe (Gessner & Janka 2018). This is due to the structural similarity of these models to ECSN progenitors discussed in Section 2: models with a very small helium core mass exhibit a steep density gradient outside the Si core (Fig. 1), which implies that only a small amount of mass can become involved in aspherical fluid motions after shock revival, and hence the gravitational tug on the PNS remains weak.2
The kicks of the more massive progenitors (producing more massive metal cores) appear broadly compatible with the observed distribution of neutron star kicks (Hobbs et al. 2005; Faucher-Giguère & Kaspi 2006; Ng & Romani 2007). Again, our simulations indicate that the rather high value found for the |$18 \, \mathrm{M}_\odot$| model of Müller et al. (2017a) – |$600\, \mathrm{km} \, \mathrm{s}^{-1}$| at the end of the simulation or |$1236\, \mathrm{km} \, \mathrm{s}^{-1}$| after using our extrapolation procedure – is an outlier rather than a symptom of a generic problem of self-consistent neutrino-driven explosion models. It is remarkable that the extrapolated value for the model of Müller et al. (2017a) would place it just around the highest observed kick velocities (Cordes, Romani & Lundgren 1993; Chatterjee et al. 2005; Tomsick et al. 2012; Tauris 2015).
It is interesting to consider models he2.8 and he3.5 on their own. Since these two models are representative examples for low- and relatively high-mass metal cores (|$1.47$| and |$1.81 \, \mathrm{M}_\odot$|, respectively) that can form in ultra-stripped progenitors,3 we can assume that they allow us to probe the range of kicks that can be achieved in this evolutionary channel. It is noteworthy that model he3.5 develops a considerably larger kick (|$159 \, \mathrm{km}\, \mathrm{s}^{-1}$|) than has been found so far in simulations of ultra-stripped supernovae (Suwa et al. 2015; Müller et al. 2018). Thus, we estimate that kicks for ultra-stripped explosions should fall roughly between |${\sim } 10\, \rm {km\, s}^{-1}$| and (at least) |${\sim } 200\, \rm {km\, s}^{-1}$|, compatible with the properties of double neutron star systems that formed via the ultra-stripped channel. Indeed, Tauris et al. (2017) found evidence for a range of ultra-stripped supernova kicks (producing the second-formed neutron star in known double neutron star systems) with a majority of small kicks |$\lt 50\, {\rm km\, s}^{-1}$| (see also Beniamini & Piran 2016) and a few systems with large kicks (see also Fryer & Kalogera 1997; Wex, Kalogera & Kramer 2000). For example, PSRs B1534+12 and B1913+16 were found to have experienced neutron star kicks of |$175\tt {-}300$| and |$185\tt {-}465\, {\rm km\, s}^{-1}$|, respectively. Based on our simulations presented here, it is possible that explosions of ultra-stripped stars with metal cores |$\mathord {\gtrsim } 2.0\, \, \mathrm{M}_\odot$| may result in neutron star kicks in excess of |$200\, {\rm km\, s}^{-1}$|. This will be investigated in future simulations.
In the top panel of Fig. 12, we plot the extrapolated final kick velocity (where applicable) against the diagnostic explosion energy at the end of our simulation for the low-mass models presented in this paper, and also add the |$18 \, \mathrm{M}_\odot$| model of Müller et al. (2017a). The values for the explosion energy are to be taken only as lower limits, but for most of the models (except he3), one would not expect a further increase by more than a few tens of percent, so that the preliminary values of Eexpl are a good indicator of the ordering of the final explosion energies.
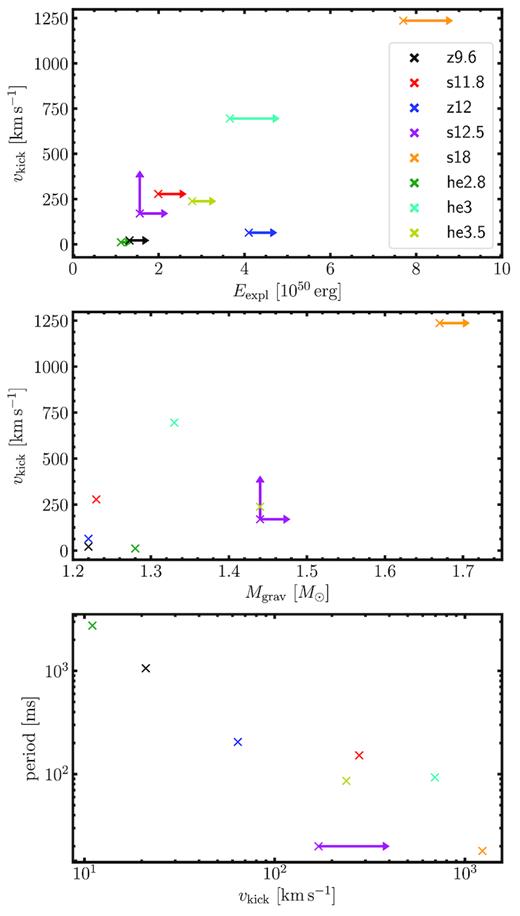
Correlations between explosion energy Eexpl and the (extrapolated) neutron star kick vkick (top panel), between the gravitational neutron star mass Mgrav and vkick (middle panel), and between vkick and the spin period (bottom panel). The plots include the |$18 \, \mathrm{M}_\odot$| model (s18) of Müller et al. (2017a) in addition to our seven low-mass models. Since the explosion energy is still evolving in all of the models, the plotted values are only lower limits, the same is true for Mgrav in models s12.5 and s18 and vkick in model s12.5. The length of the arrows has no firm quantitative meaning, but gives a subjective estimate for the further growth of these uncertain quantities.
Our simulations appear compatible with a moderately strong correlation between kick velocity and explosion energy or, alternatively, the mass of iron-group ejecta, which is tightly linked to the explosion energy as discussed in Section 4.2 and can be seen as a proxy for the relevant ejecta mass Mej in equation (7). Model z12 is a significant exception, however. It is the most energetic model among the low-mass cases considered in this study, yet it yields a low kick velocity of only |$64\, \mathrm{kms}\, \mathrm{s}^{-1}$|. This is naturally explained by the explosion geometry of this model, which stands out from the other cases as clearly bipolar rather than unipolar (Fig. 4), so that the net gravitational tug remains close to zero.
Whether or not there is a tight correlation between vkick and Eexpl depends on whether such bipolar explosions are frequent or not, and our current models do not permit any conclusions on this question. It is possible that the bipolar explosion geometry of model z12 is an artefact of the older mesh coarsening scheme of Müller (2015), which may favour explosions aligned with the grids axis in the absence of strong large-scale perturbations in the progenitor. However, model s11.8, which has also been simulated using the old mesh coarsening scheme, casts doubt on this explanation. Its explosion is clearly not aligned with the grid axis even though the progenitor does not exhibit violent large-scale convection in the O shell either that could imprint a preferred geometry on to the model and swamp grid artefacts. It is therefore equally plausible that bipolar explosions as in model z12 are physical and reasonably frequent. Moreover, the current models do not include rotation, and even slow rotation could lead to a more bipolar flow geometry. The small body of self-consistent 3D explosion models in the literature does not provide much further guidance either. Only few models have been evolved sufficiently far by other groups to show the emerging explosion geometry (Takiwaki et al. 2014; Melson et al. 2015a,b; Lentz et al. 2015; Ott et al. 2018; Vartanyan et al. 2018), and although there is a preponderance of unipolar explosions, examples of more bipolar explosions are also found (e.g. the |$15 \, \mathrm{M}_\odot$| model of Ott et al. 2018). Moreover, a number of those simulations studied more massive progenitors where the spiral mode of the standing accretion-shock instability (SASI) imprints a strong ℓ = 1 mode on to the flow.
At this point, the evidence thus allows us to conclude only that there is at least a loose correlation between Eexpl and vkick. It is plausible that the achievable kick velocity indeed scales roughly linearly with Eexpl, while there is considerable scatter below this upper limit. Whether the distribution of kicks below this limit is strongly top heavy with a few outliers with low kicks, more uniform, or whether there is even a bimodality between unipolar and bipolar explosions as speculated by Scheck et al. (2006) will need to be investigated with a considerably larger sets of supernova models, and detailed studies of neutron stars within supernova remnants may also shed light on this question (Katsuda et al. 2018).
Tauris et al. (2017) found indications of an empirical correlation between the kick and the neutron star mass in their analysis of double neutron star systems and also presented qualitative arguments to support such a correlation. In our simulations, however, we find only a loose correlation between those two quantities (middle panel of Fig. 12). It is to be expected that this correlation is weaker than that between Eexpl and vkick. The correlation between Eexpl and vkick directly reflects the physics of hydrodynamical kicks and comes about because Eexpl and vkick are both intimately linked to the mass of ejected neutrino-heated material (Janka 2017; Vigna-Gómez et al. 2018). By contrast, the weaker correlation between Mgrav and vkick is likely a secondary consequence of a loose correlation between Mgrav and Eexpl (Müller et al. 2016a): progenitors with a higher silicon core mass (which mostly determines Mgrav) tend to explode more energetically because they also tend to have denser and more massive oxygen shells and hence experience stronger, more sustained accretion after shock revival. Since this correlation is not a tight one in the stellar evolution models, and since it is further compounded by scatter in the relation between Eexpl and vkick, one may only expect a weak general correlation between Mgrav and vkick from the theoretical point of view. As a sub-population, however, ultra-stripped supernovae may exhibit a stronger correlation between Mgrav and vkick. Future simulations and further empirical data are needed to confirm or reject this hypothesis.
4.3.3 Neutron star spins
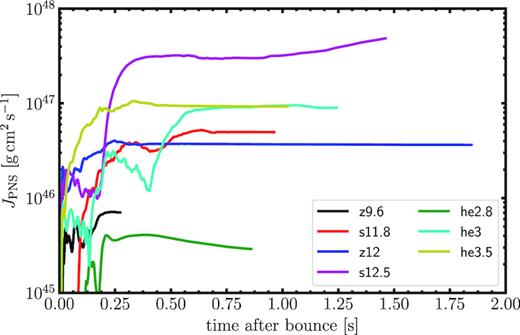
Angular momentum JPNS advected on to the PNS computed according to equation (8).
With our non-rotating progenitor models, we obtain a wide range of spin periods from seconds (z9.6 and he2.8) down to |$20\, \mathrm{ms}$| for s12.5, which is similar to the |$18 \, \mathrm{M}_\odot$| model of Müller et al. (2017a). It is quite remarkable that the PNS angular momentum stabilizes quite early in all simulations, and well before the explosion energy shows any sign of saturating. Even in model s12.5, which only explodes at |$0.75\, \mathrm{s}$| after bounce and still accretes quite heavily at the end of the run, the JPNS does not evolve dramatically any more. In fact, JPNS appears to be set already before the onset of the explosion. This early freeze-out of the PNS angular momentum was also observed, though not discussed, in Müller et al. (2017a), but our models suggest that it could be a rather generic phenomenon. It is likely explained by the dynamics of the accretion flow in the explosion phase: the rate of change of JPNS naturally scales with the mass accretion rate on to the PNS (Spruit & Phinney 1998; Wongwathanarat et al. 2013), which drops significantly as the explosion develops in all our models. This is different from the kick, which can change due to the long-range force of gravity, and also somewhat different from the explosion energy. Although the continued growth of the explosion is tied to ongoing accretion into the gain region, much of the accreted matter no longer settles on to the PNS, but is re-ejected from relative large turnaround radii (Müller et al. 2017a) so that it does not impart any angular momentum on to the compact remnant.
Intriguingly, the spin periods that we obtain for our non-rotating progenitors due to aspherical accretion alone roughly cover the observed range of birth period of young pulsars (Faucher-Giguère & Kaspi 2006; Perna et al. 2008; Popov & Turolla 2012; Noutsos et al. 2013; Igoshev & Popov 2013). Although our sample is still too small and too selective to draw conclusions on the shape of the distribution, it fits the picture suggested by observations with a skewed distribution and significant clustering of birth periods below |$\mathord {\sim }200 \, \mathrm{ms}$| (Popov & Turolla 2012; Noutsos et al. 2013; Igoshev & Popov 2013). This is significantly different from the parametrized explosion models of Wongwathanarat et al. (2013), which do not compute the diffusive neutrino flux form the PNS core self-consistently. These show less spin-up by aspherical accretion (with typical spin periods of |$\mathord {\gtrsim } 0.5 \, \mathrm{s}$|), presumably because the neutrino flux from the core is somewhat on the high side and quenches the accretion flow faster than in self-consistent models. Naturally, our results do not imply that the PNS spin is set by the physics of the early explosion phase only. In reality, the spin of the progenitor core may not be negligible, in particular for exploding stars in tight binaries where tidal effects are at work. It is possible that even the presence of modest amounts of angular momentum in the progenitor core qualitatively alters the mechanism of spin-up seen in our models by providing a preferred axis for the convective flow around the PNS and forcing it into a non-stochastic flow pattern. However, for the rotation rates predicted by current stellar evolution models (Heger, Woosley & Spruit 2005), one obtains high convective Rossby numbers Ro ≳ 10 in the gain region, which suggests that rotation is not fast enough to affect the geometry of the convective flow (Müller 2016). First 3D simulations of moderately rotating progenitors (Summa et al. 2018) appear to confirm this expectation. None the less, the interplay of stochastic spin-up and progenitor rotation needs to be investigated further in the future. In addition to the spin of the progenitor that is neglected in our simulations, another caveat concerns fallback, which could alter the PNS spin appreciably during the late phase of the explosion.
Some indications that the origin of neutron star spins cannot be understood based on asymmetric accretion during the first seconds alone comes from an anticorrelation between kick velocities and spin periods that emerges for our models (bottom panel of Fig. 12). Although there is considerable scatter, we see a clear trend towards shorter spin periods for higher kick velocities, which is again different from Wongwathanarat et al. (2013). Such a correlation is not unexpected (and has in fact already been anticipated by Spruit & Phinney 1998), since the magnitude of both the kick and spin depends on the mass that is involved in overturn motions behind the shock, which varies considerably between progenitors and thus naturally accounts for a high degree of covariance between vkick and JPNS.
This correlation is not unproblematic, however. Observationally, there are examples of short spin periods of young neutron stars with low kicks; the Crab pulsar is the most prominent example with a kick of |$\mathord {\sim } 160 \, \mathrm{km}\, \mathrm{s}^{-1}$| (Kaplan et al. 2008; Hester 2008) and a birth spin period of |$\mathord {\lesssim } 20\, \mathrm{ms}$| (Lyne et al. 2015). Such cases can still be explained by invoking sufficiently rapid rotation of the progenitor core or spin-up by fallback. Based on the correlation between JPNS and vkick in our models, one would not expect to find long birth periods for neutron stars with high kicks. A number of the pulsars in recent observational studies of kicks and spins (Noutsos et al. 2013), however, do not conform to this trend. At this stage, it is unclear whether this issue has its origin in our limited simulations of progenitor models or if it can (partly) be explained by observational selection effects. Evidently, the scatter of the emerging correlation needs to be investigated with more simulations before we can draw conclusions. Moreover, it is still unclear how spin-up or spin-down during the explosion affects rotating progenitors, and whether the correlation seen in our models still holds in this case. Another simple explanation could be that a fraction of neutron stars come from higher mass progenitors that have much more complicated explosion dynamics. It is also noteworthy that the observed pulsars with high kicks and long birth spin periods tend to be old (|$\mathord {\gtrsim } 10^6\, \mathrm{yr}$|), and on these time-scales magnetic field dissipation may become relevant (Pons et al. 2007; Pons & Geppert 2007), which could induce uncertainties in the inferred natal spin periods.
4.3.4 Absence of spin–kick alignment
Observations have suggested a tendency towards spin–kick alignment in young pulsars (Johnston et al. 2005; Ng & Romani 2007; Noutsos et al. 2012, 2013). However, the determination of the angle between the spin axis and the kick velocity is challenging and not without uncertainties; for a discussion see Kaplan et al. (2008) for optical measurements and section 4.2 of Noutsos et al. (2012) for the radio polarization method.
Although various hypotheses have been formulated to explain this putative finding (see Spruit & Phinney 1998; Lai, Chernoff & Cordes 2001; Wang, Lai & Han 2007 and especially Janka 2017 for a more exhaustive summary of ideas), hydrodynamical simulations have not borne out these ideas so far. No indication of spin–kick alignment was seen in the parametrized 3D models of Wongwathanarat et al. (2013) and Gessner & Janka (2018). In their |$18 \, \mathrm{M}_\odot$| model, Müller et al. (2017a) also obtained a large angle of 40° between the kick and spin direction at the end of the run, but found that this angle decreased steadily over time-scales of seconds. They speculated that this decrease might be due to a ‘righting’ mechanism from the preferential accretion of material at directions perpendicular to the kick.
Our larger set of models does not support such a righting mechanism. As shown by Fig. 14, the angle α between the spin and kick direction varies considerably in our models. If anything, the spin vectors cluster at α > 50°, although this should not be overinterpreted considering the small sample size. There is no systematic trend towards a decrease of α due to ongoing accretion; some models actually show an increase in α at late times.
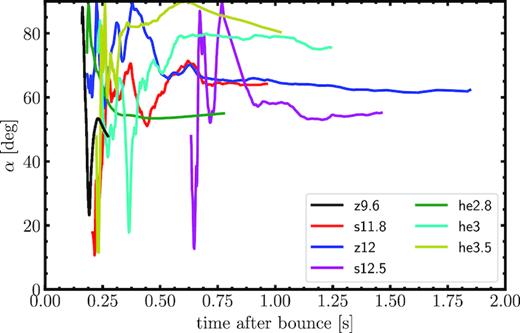
Evolution of the angle α between the spin and kick direction. Since this angle fluctuates rapidly as long as the spin and kick are small, we only evaluate α once the diagnostic energy has reached a significant positive value.
If there is a mechanism for spin–kick alignment, we have clearly not identified it in 3D simulations of neutrino-driven explosion models yet. Again, the impact of moderate progenitor rotation on the dynamics of the explosion phase and the evolution of the PNS spin and kick clearly needs to be investigated as an obvious missing factor in the current models.
5 CONCLUSIONS
In this paper, we have presented a suite of 3D supernova models of low-mass hydrogen-rich and (ultra)-stripped-envelope progenitors obtained with the coconut-fmt code (Müller & Janka 2015). This allowed us to study the distribution of explosion and remnant properties in this mass range and possible correlations among them using self-consistent 3D long-time simulations for the first time. We consider single star models of |$9.6$|, |$11.8$|, |$12$|, and |$12.5 \, \mathrm{M}_\odot$|, and stripped binary star models with initial helium star masses of |$2.8$|, |$3$|, and |$3.5 \, \mathrm{M}_\odot$|. In two cases (|$2.8$| and |$3.5 \, \mathrm{M}_\odot$|), the subsequent binary evolution after the removal of the hydrogen envelope was followed further to stellar death as ultra-stripped progenitors (Tauris et al. 2015).
All of our models explode successfully by the neutrino-driven mechanism. Thanks to the relatively fast drop of the mass accretion rate, shock revival occurs early in most of these low-mass models, but we also find an example of a late explosion about |$0.5\, \mathrm{s}$| after bounce for a |$12.5\, \mathrm{M}_\odot$| single-star progenitor. There is considerable variation in the explosion energies and the mass of iron-group ejecta, which can be taken as a rough proxy for the nickel mass. Explosion energies range from |$10^{50}$| to |$4\times 10^{50}\, \mathrm{erg}$|, although considerable growth may still occur in some of our models beyond the simulated time. The mass of iron-group ejecta falls between |$0.01$| and |$0.04 \, \mathrm{M}_\odot$|. These values are compatible with the more modest explosion energies and nickel masses observed for hydrogen-rich low-mass progenitors (Pejcha & Prieto 2015) as well as for the ultra-stripped supernova candidates SN 2005ek (Drout et al. 2013; Tauris et al. 2013), SN 2010X (Kasliwal et al. 2010; Moriya et al. 2017), and iPTF 14gqr (De et al. 2018). Thus, neutrino-driven explosion models do not appear to be underenergetic compared to observations in this mass range. The detailed comparison of some of the simulations suggests that 3D explosion models retain some degree of stochasticity in the explosion properties due to the complex dynamics of outflows and downflows in the explosion phase. For example, in the |$11.8 \, \mathrm{M}_\odot$| model, the increase of the explosion energy is slowed down by a reconfiguration of the outflow geometry at about |$1\, \mathrm{s}$|. This bears some vague resemblance to the phenomenon of outflow quenching in 2D models (Müller 2015), although these stochastic flow variations still have a much less dramatic impact than in 3D than in 2D.
This element of stochasticity and the small sample size preclude any conclusions on systematic differences in explosion and remnant properties between single- and binary-star progenitors. At present, we have no evidence that single- and binary-star models of neutrino-driven explosion with similar helium core masses differ more than expected from the stochastic variations among single-star models alone. Nonetheless, binary mass transfer of course remains a crucial factor in the evolution of supernova progenitors, since it affects the distribution of key structural parameters like the helium core mass (e.g. Podsiadlowski et al. 2004) and – via the envelope structure – mixing processes during the later phases of the explosion and the observable transients.
For most of our models, we can already determine, or at least extrapolate, the final neutron star properties quite well, barring the possibility of late-time fallback. Except for the |$12.5 \, \mathrm{M}_\odot$| model, mass outflow already dominates over mass accretion on to the PNS, and the PNS mass has practically stabilized at its final value. Correcting for the binding energy of the neutron stars, we obtain gravitational masses between |$1.22 $| and |$1.44 \, \mathrm{M}_\odot$|, which is compatible with the distribution of observed neutron star masses (Özel & Freire 2016; Antoniadis et al. 2016; Tauris et al. 2017). While the neutron star kicks are still growing at the end of the simulations due to the long-range gravitational tug by the asymmetric ejecta, the subsequent acceleration of the neutron star can be smoothly extrapolated to obtain tentative final values in all but one case. The extrapolated kicks range from |$11$| to |$695 \, \mathrm{km}\, \mathrm{s}^{-1}$|. Thus, the most extreme, ECSN-like models with the smallest helium cores can reproduce the very low kicks required to explain some double neutron star systems and pulsars in globular clusters (Tauris et al. 2017), while the models with higher He core masses are compatible with the typical kicks of young pulsars (Arzoumanian, Chernoff & Cordes 2002; Hobbs et al. 2005; Ng & Romani 2007). If the extrapolated kick of |$1236 \, \mathrm{km}\, \mathrm{s}^{-1}$| for the |$18 \, \mathrm{M}_\odot$| model of Müller et al. (2017a) is included, the 3D coconut-fmt models roughly span the full range of observed kick velocities. We see tentative evidence for a correlation of the kick velocity with the explosion energy as proposed by Janka (2017) and Vigna-Gómez et al. (2018, as a refinement of earlier ideas for progenitor-dependent kicks by Bray & Eldridge 2016). Our models suggest that this correlation may not be a tight one, however, and that the kicks may scatter between zero and an upper limit that scales with the explosion energy. Low kicks can be achieved in more energetic explosions if the explosion geometry is bipolar rather than unipolar, as has already been noted in 2D by Scheck et al. (2006). Such a bipolar explosion occurs in one of our seven simulations (the |$12 \, \mathrm{M}_\odot$| model). Although there is some concern that the bipolarity may be connected to the grid geometry, we find unipolar models even in cases where we do not include strong aspherical seed perturbations in the convective O shell that break grid alignment; this suggests that the possibility of bipolar neutrino-driven explosions with low kicks is real in 3D. We also find a loose correlation between the neutron star mass and the kick velocity, which is in line with current observations, and partly theoretical expectations, of double neutron stars (Tauris et al. 2017), but cannot make as strong a case for this correlation based on our simulations. An investigation of a larger suite of supernova simulations of ultra-stripped stars is needed to confirm this hypothesis.
Computing the spin-up of our non-rotating progenitor models by asymmetric accretion during the supernova, we find a range of neutron star birth spin periods from |$2.749 \, \mathrm{s}$| down to |$20 \, \mathrm{ms}$|. Again, the range of spin periods is compatible with observational constraints of young radio pulsars (Faucher-Giguère & Kaspi 2006; Perna et al. 2008; Popov & Turolla 2012; Noutsos et al. 2013; Igoshev & Popov 2013) even without assuming any rotation in the progenitor. This underscores that neutron star birth spin periods are at least as much determined by the spin-up during the supernova itself as by the spin of the progenitor cores. Although this does not render the question of the rotational state of the progenitor cores irrelevant by any means, it poses an obstacle for using neutron star spins as a probe of the intricate problem of angular momentum transport by (magneto-)hydrodynamical processes in the interiors of massive stars (Heger, Langer & Woosley 2000; Maeder & Meynet 2000; Heger et al. 2005; Fuller et al. 2015).
As in parametrized 3D simulations (Wongwathanarat et al. 2013; Gessner & Janka 2018), we do not find any evidence for spin–kick alignment. If spin–kick alignment is indeed prevalent in young neutron stars as suggested by observations (Johnston et al. 2005; Ng & Romani 2007; Noutsos et al. 2012, 2013), some ingredient is still missing in the current 3D models. It is possible that the situation will change when rotation in the progenitors is included, or that other mechanisms such as spin–kick alignment in SASI-driven explosions or non-hydrodynamical mechanisms are needed (see Janka 2017 for current scenarios). On the other hand, it is noteworthy that Bray & Eldridge (2016) found no preference for spin–kick alignment in their binary population synthesis study. Neither did Tauris et al. (2017) find any such correlation based on simulations of the kinematic effects of the second supernova in known double neutron star systems. Close interaction between observations, kinematic studies, and computational modelling is called for to better address the question of spin–kick alignment.
Instead of spin–kick alignment, we find a correlation between the spin frequency and the magnitude of the kick. This is in line with theoretical expectations (Spruit & Phinney 1998), but needs to be squared with the well-established findings of rapidly spinning pulsars with low kicks – such as the Crab pulsar (Kaplan et al. 2008; Hester 2008). In these cases, a sufficiently rapid rotation rate of the progenitor core or late-time fallback would still provide a simple explanation. Long birth spin periods in combination with high kicks would provide a more serious challenge to the current neutrino-driven models. Such a constellation has been inferred for some pulsars (Noutsos et al. 2013), although these are sufficiently old that the applied method to infer their birth spin periods comes with some uncertainty. Again, close interaction between observations and theory is required to determine whether the neutrino-driven models are compatible with the observational evidence.
It is clear that our simulations are only a first step towards understanding the distribution of supernova explosion and remnant properties by means of self-consistent 3D simulations. Work is still required on many fronts. While we can already obtain reasonably safe values for the final neutron star properties (albeit at the cost of a physically motivated extrapolation in case of the kicks), longer simulations are needed to obtain converged values for explosion energies and nickel masses. Especially as far as the nucleosynthesis is concerned, the approximate nature of our neutrino transport is also an issue; long-time models with more sophisticated transport and full, state-of-the-art neutrino interaction rates will be needed in the future. Rotating progenitors have yet to be explored by means of self-consistent long-time simulations, and a broader coverage of progenitor masses is called for. While our results for low-mass progenitors with modest explosion energies are encouraging, we still need to address progenitors with somewhat higher masses and more typical explosion energies. Our work demonstrates, however, that self-consistent 3D simulations are now in a position to explore the distribution of supernova explosion and remnant properties in a systematic way and link up with observations of transients and compact remnants.
ACKNOWLEDGEMENTS
We thank M. Kramer for valuable comments. This work was supported by the Australian Research Council through ARC Future Fellowships FT160100035 (BM), Future Fellowship FT120100363 (AH), and through the Centre of Excellence for Gravitational Wave Discovery (OzGrav) under project number CE170100004 (JP), by STFC grant ST/P000312/1 (BM), and by the US Department of Energy through grant DE-FG02-87ER40328 (YZQ). CC was supported by an Australian Government Research Training Program (RTP) Scholarship. PB was supported in part by the National Natural Science Foundation of China Fund No. 11533006. This material is based upon work supported by the National Science Foundation under Grant No. PHY-1430152 (JINA Center for the Evolution of the Elements).
This research was undertaken with the assistance of resources obtained via NCMAS and ASTAC from the National Computational Infrastructure, which is supported by the Australian Government and was supported by resources provided by the Pawsey Supercomputing Centre with funding from the Australian Government and the Government of Western Australia. This work used the DiRAC Data Centric system at Durham University, operated by the Institute for Computational Cosmology on behalf of the STFC DiRAC HPC Facility (www.dirac.ac.uk); this equipment was funded by a BIS National E-infrastructure capital grant ST/K00042X/1, STFC capital grant ST/K00087X/1, DiRAC Operations grant ST/K003267/1, and Durham University. DiRAC is part of the UK National E-Infrastructure. The authors acknowledge the Minnesota Supercomputing Institute at the University of Minnesota for providing resources that contributed to the research results reported within this paper.
Footnotes
Strictly speaking, the binary progenitors no longer have a helium core at collapse, as the helium shell forms the (tiny) envelope of the star. In case of the binary models, the ‘final helium core mass’ is to be understood as the final mass that is left of the former helium star that was subsequently stripped further by Case BB mass transfer.
Janka (2017) and Gessner & Janka (2018) have also framed the discussion of the explosion dynamics of ECSNe in terms of the progenitor compactness, but compactness is not the ideal basis for understanding the peculiar explosion dynamics and the low kicks in this regime. What is relevant to the explosion dynamics and the kicks is rather the mass within a few hundreds (for ECSN-like models) to thousands of kilometres of the edge of the Si core, whereas the compactness is nothing but a measure of the radius of one specified mass shell.
Note, strictly speaking, ultra-stripped progenitors are defined as exploding stars with an envelope mass of |$\mathord {\lesssim } 0.2\, \mathrm{M}_\odot$| (Tauris et al. 2015).
REFERENCES
APPENDIX: MESH COARSENING AND FILTERING
Spherical polar coordinates are highly useful for core-collapse supernova simulations due to the approximate spherical symmetry of the flow in many regions and the pronounced radial stratification over many orders of magnitude in density. They suffer from one major disadvantage, however, in that the convergence of the grid lines near the polar axis severely constrains the time-step. Aside from giving up the spherical coordinate geometry altogether in favour of Cartesian geometry and adaptive mesh refinement, various approaches have been applied to alleviate the time-step constraints near the axis without sacrificing the advantages of spherical geometry. Overset orthogonal grids (Kageyama & Sato 2004; Wongwathanarat, Hammer & Müller 2010a) and non-orthogonal grids (Wongwathanarat, Grimm-Strele & Müller 2016) are excellent solutions, but add some complexity to the grid geometry. An alternative approach is to retain the basic structure of a spherical polar grid, but to adaptively combine (‘coarsen’) cells to at high latitudes and (optionally) also close to the origin. Such an approach has been implemented by Müller (2015), and in a somewhat different way by Skinner et al. (2018) as a ‘dendritic grid’. Yet another alternative consists in filtering the solution in Fourier space, which has a long tradition in meteorology (Boyd 2001).
The coconut code offers both mesh coarsening and filtering in Fourier space as an option. Since the implementation of these methods in coconut has not been described in detail before, we here provide a brief sketch.
A1 Mesh coarsening
All the conserved and primitives variables remain defined on the entire fine grid, and the conserved variables are updated in the usual manner using the Riemann fluxes. Before the recovery of the primitive variables, we first average all the conserved variables in each supercell, i.e. in the relativistic case, the Eulerian baryonic mass density D, the components Sr, Sθ, and Sφ of the relativistic momentum density in the spherical polar basis, the Eulerian energy density τ, as well as DXi for the mass fractions X of all species. To recover at least second-order accuracy, we then prolongate the averaged values in the supercells back to the fine grid using piecewise linear reconstruction. In principle, higher order conservative reconstruction can be used for this purpose, but we opt for piecewise linear reconstruction (typically using van Leer’s harmonic limiter; van Leer 1974). One reason for this is that the parallelization of slope-limited linear reconstruction in supercells is simpler.
The prolongated solution on the fine grid is then used for the recovery of the primitive variables, for piecewise parabolic method (PPM) reconstruction and the computation of the fluxes, and any other operations other such as the solution of the transport equation.
A2 Filtering in Fourier space
One obvious advantage of filtering in Fourier space is that the filter is gradually pushed to higher wavenumbers and eventually switched off for larger radii without the need to implement a complicated data layout and mpi communication pattern. A potential problem with filtering in Fourier space is the occurrence of Gibbs phenomena, but this does not seem to be of relevance in practice for two reasons. The gradual decrease of the damping factor helps to avoid spurious oscillations, and, furthermore, the radial dependence of the damping term ensure that little filtering is done at the shock radius, where the Gibbs phenomenon would present the most serious problem.
