


ABSTRACT
The Chandra X-ray Observatory’s Cycle 18 Large Program titled ‘Spiral galaxies of the Virgo Cluster’ will image 52 galaxies with the ACIS-S detector. Combined with archival data for an additional 22 galaxies, this will represent the complete sample of 74 spiral galaxies in the Virgo cluster with star formation rates ≳0.3 M⊙ yr−1. Many of these galaxies are expected to have an active nucleus, signalling the presence of a central black hole. In preparation for this survey, we predict the central black hole masses using the latest black hole scaling relations based on the spiral arm pitch angle ϕ, velocity dispersion σ, and total stellar mass M*,galaxy. With a focus on intermediate-mass black holes (IMBHs; 102 < Mbh/M⊙ < 105), we highlight NGC 4713 and NGC 4178, both with Mbh ≈ 103–104 (an estimate that is further supported in NGC 4178 by its nuclear star cluster mass). From Chandra archival data, we find that both galaxies have a point-like nuclear X-ray source, with unabsorbed 0.3–10 keV luminosities of a few times 1038 erg s−1. In NGC 4178, the nuclear source has a soft, probably thermal, spectrum consistent with a stellar-mass black hole in the high/soft state, while no strong constraints can be derived for the nuclear emission of NGC 4713. In total, 33 of the 74 galaxies are predicted to have Mbh < (105–106) M⊙, and several are consistently predicted to have masses of 104–105 M⊙, such as IC 3392, NGC 4294, and NGC 4413. We speculate that a sizeable population of IMBHs may reside in late-type spiral galaxies with low stellar mass (|$M_{\ast }\lesssim 10^{10}\, \mathrm{M}_{\odot }$|).
1 INTRODUCTION
In the young Universe, massive metal-free Population III stars (Schwarzschild & Spitzer 1953; Larson 1998) may have spawned ‘intermediate-mass black holes’ (IMBHs) with masses greater than |$10^2\, \mathrm{M}_{\odot }$| (e.g. Bond, Arnett & Carr 1984; Carr, Bond & Arnett 1984; Madau & Rees 2001; Schneider et al. 2002; but see Umeda & Nomoto (2003) and Fraser et al. (2017), who cap the ‘Pop III’ masses at 120–130 M⊙). Additional mechanisms have also been proposed for the creation of IMBHs (see e.g. Miller & Colbert 2004 and Mezcua 2017), including the runaway merging of stellar-mass black holes and stars (Zel’dovich & Podurets 1965; Larson 1970; Shapiro & Teukolsky 1985; Quinlan & Shapiro 1990; Portegies Zwart & McMillan 2002; Gürkan, Freitag & Rasio 2004); primordial black holes (e.g. Argyres, Dimopoulos & March-Russell 1998; Bean & Magueijo 2002; Carr et al. 2010; Grobov et al. 2011); the direct collapse of massive gas clouds, bypassing the Pop III stage (Doroshkevich, Zel’dovich & Novikov 1967; Umemura, Loeb & Turner 1993; Bromm & Loeb 2003; Mayer et al. 2010); and stunted or inefficient growth of nuclear black holes via gas accretion at the centres of galaxies (e.g. Johnson & Bromm 2007; Sijacki et al. 2007; Alvarez, Wise & Abel 2009; Heckman & Best 2014). In the last of these alternative scenarios, IMBHs are an intermediate step on the way to the maturation of supermassive black holes (SMBHs, |$M_{\rm bh} \gt 10^5\, \mathrm{M}_{\odot }$|; Rees 1984; Shankar et al. 2004; Ferrarese & Ford 2005; Kormendy & Ho 2013; Graham 2016a, and references therein).
In contrast to the plethora of theoretical formation models, direct observational detection of IMBHs remains elusive. There is a long history of disproved suggestions and claims of IMBHs in globular clusters, stretching back to at least the X-ray data from Clark, Markert & Li (1975). Most recently, the presence of an IMBH with a mass of ≈2000 M⊙ in the core of the Milky Way globular cluster 47 Tuc was suggested by a kinematic modelling of its pulsars (Kiziltan, Baumgardt & Loeb 2017), but there is no electromagnetic evidence for its existence, nor proof of any other IMBH in Galactic globular clusters (Anderson & van der Marel 2010; Strader et al. 2012).
In the centre of nearby galaxies, there are only a handful of candidate IMBHs with an X-ray detection, i.e. with a plausible signature of gas accretion on to a compact object. These include NGC 41781 (Satyapal et al. 2009; Secrest et al. 2012); LEDA 87300 (Baldassare et al. 2015; Graham, Ciambur & Soria 2016); NGC 404 (Nguyen et al. 2017); NGC 3319 (Jiang et al. 2018); and possibly NGC 4395 (Iwasawa et al. 2000; Filippenko & Ho 2003; Shih, Iwasawa & Fabian 2003, Nucita et al. 2017; but see den Brok et al. 2015).
Outside of galactic nuclei, IMBH searches initially focused on a rare class of point-like X-ray sources with X-ray luminosities ∼1040–1041 erg s−1 (e.g. Colbert & Mushotzky 1999; Swartz, Soria & Tennant 2008; Sutton et al. 2012; Mezcua et al. 2015; Zolotukhin et al. 2016). This was partly based on the assumption that the X-ray luminosity of an accreting compact object cannot be much in excess of its classical Eddington limit (hence, luminosities |${\gtrsim}10^{40}$| erg s−1 would require BH masses |$\gtrsim$|100 M⊙), and partly on the detection of a low-temperature thermal component (kT ∼ 0.2 keV) that was interpreted as emission from an IMBH accretion disc (Miller et al. 2003). However, most of the sources in this class are today interpreted as super-Eddington stellar-mass black holes or neutron stars (Feng & Soria 2011; Kaaret, Feng & Roberts 2017). To date, the most solid IMBH identification in this class of off-nuclear sources is HLX-1, in the galaxy cluster Abell 2877, and seen in projection near the S0 galaxy ESO 243-49 (Farrell et al. 2009, Soria et al. 2010; Webb et al. 2010; Yan et al. 2015; Webb et al. 2017). HLX-1 has a mass of ∼104 M⊙ (Davis et al. 2011; Godet et al. 2012; Soria et al. 2017) and may reside in the remnant nucleus of a gravitationally captured and tidally stripped satellite galaxy (Mapelli et al. 2013; Farrell et al. 2014), which leads us back to galactic nuclei as the most likely cradle of IMBHs.
In this work, we focus on IMBH candidates in galactic nuclei. Due to their low mass, it is currently impossible to spatially resolve the gravitational sphere of influence of these black holes; therefore, astronomers need to rely on alternative means to gauge their mass. There are now numerous galaxy parameters that can be used to predict the mass of a galaxy’s central black hole, and Koliopanos et al. (2017) report on the consistency of various black hole scaling relations.
The existence, or scarcity, of central IMBHs obviously has implications for theories regarding the growth of supermassive black holes. For example, some have theorized that supermassive black holes started from seed masses |${\gtrsim}10^5\, \mathrm{M}_{\odot }$| – created from the direct collapse of large gas clouds and viscous high-density accretion discs (e.g. Haehnelt & Rees 1993; Loeb & Rasio 1994; Koushiappas, Bullock & Dekel 2004; Regan et al. 2017) – which could potentially bypass the very existence of IMBHs. Therefore, defining the demography of IMBHs has implications for the co-evolution of massive black holes and their host galaxy alike.
For two reasons, spiral galaxies may represent a more promising field to plough than early-type galaxies or dwarf galaxies.2 This is due to their low-mass bulges and discs – and thus low-mass black holes – and the presence of gas, which may result in an active galactic nucleus (AGN) around the central black hole, potentially betraying the black hole’s presence. Until very recently, the largest sample of spiral galaxies, with directly measured BH masses, that had been carefully decomposed into their various structural components, e.g. bar, bulge, and rings, and therefore with reliable bulge parameters, stood at 17 galaxies (Savorgnan & Graham 2016). This has now more than doubled, with a sample of 43 such spiral galaxies3 presented in Davis, Graham & Cameron (2018a), along with revised and notably more accurate Mbh–M*,bulge and Mbh–M*,galaxy relations for the spiral galaxies (Davis, Graham & Cameron 2018b).
Here, we apply three independent, updated, black hole scaling relations to a sample of 74 spiral galaxies in the Virgo cluster. X-ray images already exist for 22 members of this sample, and new images will be acquired for the remaining members during the Chandra X-ray Observatory’s Cycle 18 observing programme (see Section 2). This paper’s tabulation of predicted black hole masses for these 74 galaxies will serve as a reference, enabling two key objectives to be met. First, in the pursuit of evidence for the (largely) missing population of IMBHs, we will eventually be able to say which of the 74 galaxies predicted to have an IMBH additionally contain electromagnetic evidence for the existence of a black hole. We are not, however, just laying the necessary groundwork for this, but we are able to now, and do, explore which of the initial 22 galaxies contain both an AGN and a predicted IMBH. Secondly, by combining the existing and upcoming X-ray data with the predicted black hole masses for the full sample, we will be able to compute the black holes’ Eddington ratios and investigate how the average Eddington-scaled X-ray luminosity scales with BH mass (Soria et al. 2018, in preparation). Gallo et al. (2010) have already attempted this measurement for the early-type galaxies in the Virgo cluster, and in Graham & Soria (2018, hereafter Paper I) we revisit this measurement using updated black hole scaling relations for early-type galaxies, such that in low-mass systems the black hole mass scales quadratically, rather than linearly, with the early-type galaxies’ B-band luminosity (Graham & Scott 2013).
The layout of this current paper is as follows. In Section (2) we briefly introduce the galaxy set that will be analysed. A more complete description will be provided in Soria et al. (2018, in preparation). In Section (3) we explain the measurements of the pitch angle, velocity dispersion, and stellar mass that we have acquired for these 74 galaxies, and we introduce the latest (spiral galaxy) black hole scaling relations involving these quantities, from which we derive the expected black hole masses that are presented in the appendix. In Section (4) we compare the black hole mass predictions from the three independent methods. We additionally take the opportunity to combine the black hole scaling relations by eliminating the black hole mass term and providing revised galaxy scaling relations between the pitch angle, velocity dispersion, and galaxy stellar mass. In Section (5) we pay particular attention to galaxies predicted to have black hole masses less than |$10^5\, \mathrm{M}_{\odot }$|, and we investigate the X-ray properties of those nuclei for which archival X-ray data already exists. Finally, Section (6) provides a discussion of various related issues.
2 GALAXY SAMPLE
Soria et al. (2018, in preparation) selected the complete sample of 74 Virgo cluster spiral galaxies with star formation rates >0.3 M⊙ yr−1 (see the appendix for this galaxy list). This resulted in a mix of (early- and late-type) spiral galaxies, in the inner and outer regions of the cluster, spanning more than 5 mag in absolute B-band magnitude from roughly −18 to −23 mag (Vega). Of these 74 galaxies, just 3 have directly measured black hole masses; they are NGC 4303, |$\log (M_{\rm bh}/\mathrm{M}_{\odot }) = 6.58^{+0.07}_{-0.26}$| (Pastorini et al. 2007); NGC 4388, |$\log (M_{\rm bh}/\mathrm{M}_{\odot }) = 6.90^{+0.04}_{-0.05}$| (Tadhunter et al. 2003); and NGC 4501, |$\log (M_{\rm bh}/\mathrm{M}_{\odot }) = 7.13^{+0.08}_{-0.08}$| (Saglia et al. 2016).
In the X-ray bands, 22 of those galaxies already have archival Chandra X-ray Observatory data, and the rest are currently being observed with the Advanced CCD Imaging Spectrometer (ACIS-S) detector, as part of a 559-ks Chandra Large Project titled ‘Spiral galaxies of the Virgo cluster’ (PI: R. Soria, Proposal ID: 18620568). General results for our X-ray study (including both nuclear and non-nuclear source catalogues, luminosity functions, multiband identifications, and comparisons between the X-ray properties as a function of Hubble type) will be presented in forthcoming work, once the observations have been completed. Here, we only use the archival Chandra data to characterize the nuclear X-ray properties of spiral galaxies that we identify as possible IMBH hosts, based on their black hole scaling relations.
3 PREDICTING BLACK HOLE MASSES
In this section, we introduce the three4 black hole scaling relations that will be used to predict the black hole masses of our Virgo cluster spiral galaxy sample, and we describe where the three associated parameter sets came from.
3.1 Pitch angles
For galaxies whose discs are suitably inclined, such that their spiral pattern is visible, we project these images to a face-on orientation and measure their spiral arm ‘pitch angle’ ϕ, i.e. how tightly or loosely wound their spiral arms are. The mathematical description of the pitch angle, and the method of image analysis, is detailed in Davis et al. (2017), which also presents a significantly updated Mbh–|ϕ| relation (equation 1, below) for spiral galaxies, building on Seigar et al. (2008) and Berrier et al. (2013).
As noted in Davis et al. (2017), a prominent difficulty in pitch angle measurement is the identification of the fundamental pitch angle, which is analogous to the fundamental frequency in the musical harmonic series of frequencies. Pitched musical instruments produce musical notes with a characteristic timbre that is defined by the summation of a fundamental frequency and naturally occurring harmonics (integer multiples of the fundamental frequency). Careful Fourier analysis of the sound will allow discovery of the fundamental frequency and any perceptible harmonics. A synonymous scenario occurs in the measurement of the galactic spiral arm pitch angle via two-dimensional Fourier analysis (Kalnajs 1975; Iye et al. 1982; Krakow, Huntley & Seiden 1982; Puerari & Dottori 1992; Seigar et al. 2005; Davis et al. 2012; Yu et al. 2018). Therefore, pitch angle measurement methods, when performed in haste, can incorrectly select a ‘harmonic’ pitch angle instead of the ‘fundamental’ pitch angle.
Similarly, the Fourier analysis of sound becomes less certain when the source tone is soft, short duration, or blended with contaminating noise. Spiral galaxies also become more difficult to analyse when the resolution is poor, their disc orientation is close to edge-on, their spiral structure is intrinsically flocculent, or the arc length of their spiral segments is short. Whereas the former problems are stochastic and lead to increased uncertainty in pitch angle measurements (i.e. constant mean with an increased standard deviation), the latter problem of short spiral arc segments (i.e. small subtended polar angle) poses a potential systematic bias and can lead one to incorrectly identify a harmonic rather than the fundamental pitch angle. Typically, this problem manifests itself when spiral arc segments subtend polar angles <|$\pi$|/2 radians.
One clear benefit is that the measurement of the galactic spiral arm pitch angle only requires simple imaging that highlights a perceptible spiral pattern, without the need of any photometric calibrations. Therefore, we accessed publicly available imaging from telescopes such as the Galaxy Evolution Explorer (GALEX), Hubble Space Telescope (HST), Spitzer Space Telescope (SST), and Sloan Digital Sky Survey (SDSS). This wide selection of telescopes also implies a wide range of passbands from far-ultraviolet up to mid-infrared wavelengths. Pour-Imani et al. (2016) concluded that the pitch angle is statistically tighter in passbands that reveal young stellar populations, such as ultraviolet filters. The difference between young stellar spiral patterns and old stellar spiral patterns is small, typically less than 4 degrees in pitch angle. Because of this, we preferentially use young stellar passbands when they are available and if the resolution is sufficient to clearly display the spiral pattern. The same preference was applied in the derivation of the Mbh–|ϕ| relation in Davis et al. (2017).
3.2 Velocity dispersions
Homogenized velocity dispersions are available in Hyperleda6 (Paturel et al. 2003) for 39 of the 74 Virgo galaxies. We have assigned a 15 per cent uncertainty to each of these values.
As noted above, in deriving equation (3), four galaxies were excluded from the initial sample of 44 galaxies with directly measured black hole masses. NGC 6926 has no reported velocity dispersion, while Cygnus A is not a (typical) spiral galaxy, but rather an ES galaxy (see the discussion in Graham et al. 2016) with a nuclear, rather than large-scale, bar and spiral pattern. Another such example, albeit in a dwarf ES galaxy, is LEDA 2108986 (Graham et al. 2017). Finally, NGC 4395 and NGC 5055 are outliers that appear to have unusually low velocity dispersions; they were also excluded by Davis et al. (2017) in order to obtain a more robust regression unbiased by outliers.
3.3 Galaxy stellar masses
As revealed by the Mbh–|ϕ| relation in Davis et al. (2017; see also Seigar et al. 2008 and Ringermacher & Mead 2009), the central black hole masses in spiral galaxies are not unrelated to their discs. Furthermore, discs contain the bulk of the stellar mass in spiral galaxies.
We have derived the total galaxy stellar masses for our sample of 74 Virgo cluster galaxies via the K′-band (2.2 |$\mu$|m) total apparent magnitudes (Vega) available in the GOLD Mine7 database (Gavazzi et al. 2003). We had initially explored using the Two Micron All Sky Survey (2MASS8; Jarrett et al. 2000) Ks-band total apparent magnitudes (Vega), but it sometimes underestimates the galaxy luminosities (e.g. Kirby et al. 2008; Schombert 2011), as can be seen in Fig. 1. The GOLD Mine apparent magnitudes were converted to absolute magnitudes using the mean redshift-independent distance moduli provided by the NASA/IPAC Extragalactic Database (NED).9 These absolute magnitudes were converted to solar units using an absolute magnitude for the Sun of |$\mathfrak {M}_{\odot ,K} = 3.28$| mag (Vega), taken from Willmer (2018), and then converted to a stellar mass, or rather a scaled luminosity, using a constant K-band stellar mass-to-light ratio M/LK = 0.62. The uncertainty that we have associated with our (GOLD Mine)-based stellar masses – which are tabulated in the appendix – stems from adding in quadrature: (i) an assumed 10 per cent error on the apparent stellar luminosity; (ii) the standard deviation provided by NED for the mean redshift-independent distance modulus; and (iii) a 15 per cent error on the stellar mass-to-light ratio.
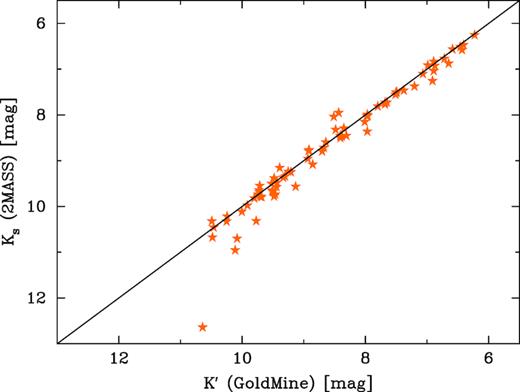
2MASS K-band apparent magnitudes versus the K-band magnitudes from GOLD Mine. Both magnitudes have been corrected for Galactic extinction. At the faint end, some of the 2MASS magnitudes underestimate the galaxy light.
We have been able to verify these stellar masses by using, when available, the published 3.6 |$\mu$|m Spitzer galaxy magnitudes. Using the same redshift-independent distance moduli provided by NED,10 Laine et al. (2014; their table 1) provide absolute galaxy magnitudes (AB, not Vega), at 3.6 |$\mu$|m, for 31 of our 74 galaxies. On average, 25 per cent of a spiral galaxy’s flux at 3.6 |$\mu$|m comes from the glow of dust (Querejeta et al. 2015; their figs 8 and 9). We therefore dim Laine et al.’s magnitudes by 25 per cent before converting them to stellar masses using M⊙,3.6 = 6.02 (AB mag) and a (stellar mass)-to-(stellar light) ratio M/L3.6 = 0.60 (Meidt et al. 2014).11 This (stellar mass)-to-(stellar light) ratio, coupled with the above-mentioned 25 per cent flux reduction due to glowing dust, yields a (stellar mass)-to-(total light) ratio of 0.45, or log (M*/Ltot) = −0.35, which can be seen in fig. 10 of Querejeta et al. (2015) to provide a good approximation for more than 1600 large and bright nearby spiral galaxies. A comparison of these 31 Spitzer-based stellar masses with our (GOLD Mine)-based stellar masses can be seen in Fig. 2. These masses are better thought of as scaled luminosities, and we will return to this issue in the following subsection.
![Galaxy stellar masses based on 2.2 $\mu$m magnitudes (with no dust correction), and using M/LK = 0.62, versus the stellar masses based on the Spitzer 3.6 $\mu$m magnitudes [using a constant (stellar mass)-to-(total light) ratio M*/Ltot = 0.45, from Querejeta et al. (2015)]. For the Virgo sample (orange stars), for which we used the GOLD Mine K-band data, 31 galaxies have Spitzer data. For the 43 galaxies (excluding the Milky Way) with directly measured black hole masses, we used the 2MASS K-band data (open black stars). The K-band data for NGC 2974 is likely contaminated by a foreground star.](https://oup.silverchair-cdn.com/oup/backfile/Content_public/Journal/mnras/484/1/10.1093_mnras_sty3068/1/m_sty3068fig2.jpeg?Expires=1750290585&Signature=kZod6Jg1Rb-80YT51RrveKYaUiBtGnWHdE4Tofm4rRT-1rdyuV3zb011qzy6omQvWD32hOzL6Z-DSTxZqPYfyX9RE7U-IalmaccSEG3KZaT-PMPG02yrCdlWUlZ3Wh1Q~BfalxzpJ~-VguX56YRx90LGwXnwMz70RXMNTO2CNpLLC0hkiOkoFNipqaJtU3W-j2UtAnQkDrwUlhgxUmYNu21pqBazpSwDkDw1rR11aoHlohwpgno7sOMix8f5qqAgA50PJLY61LJi~jE8DhZ71PxYcszC2WrrC2x-6XTLx9nPDbzbzYnIiwXZ7rA31VupLmZNjRP48bVlh0Ko1HpHoQ__&Key-Pair-Id=APKAIE5G5CRDK6RD3PGA)
Galaxy stellar masses based on 2.2 |$\mu$|m magnitudes (with no dust correction), and using M/LK = 0.62, versus the stellar masses based on the Spitzer 3.6 |$\mu$|m magnitudes [using a constant (stellar mass)-to-(total light) ratio M*/Ltot = 0.45, from Querejeta et al. (2015)]. For the Virgo sample (orange stars), for which we used the GOLD Mine K-band data, 31 galaxies have Spitzer data. For the 43 galaxies (excluding the Milky Way) with directly measured black hole masses, we used the 2MASS K-band data (open black stars). The K-band data for NGC 2974 is likely contaminated by a foreground star.
If the stellar mass is wrong by 50 per cent, then the predicted logarithm of the black hole mass will be off by 0.47 dex. Combining this offset with the 1σ intrinsic scatter in equation (4), one could find that the predicted black hole mass is ∼1 dex, i.e. an order of magnitude, different from the actual black hole mass. We therefore place less confidence in the black hole masses predicted from only the galaxy stellar mass. However, readers should be aware that our reported intrinsic and total rms scatters are not error-weighted quantities. That is, they can be dominated by outlying data points with large error bars, and therefore they can give a misleading view of how tightly defined the scaling relations are. The slope and intercept of the scaling relations presented here, and their associated uncertainty, do however take into account the error bars on the data used to define them.
3.3.1 What about colour-dependent M/L ratios?
We have assumed that the previous Mbh–M*,tot relations are log-linear, and we extrapolate this to masses below that which was used to define them. However, given that some of our Virgo cluster spiral galaxies are less massive and bluer than those in Davis et al. (2018b), it may be helpful if we provide some insight into what happens if the scaling that gives the scaled luminosity, i.e. the so-called stellar mass, is not constant.
The 40 spiral galaxies used to define the above Mbh–M*,tot relations have stellar masses greater than |$2\times 10^{10}\, \mathrm{M}_{\odot }$| (and absolute K-band magnitudes brighter than ≈−23 mag), and, therefore, the assumption of a constant 3.6 |$\mu$|m M*/L* ratio of 0.60 (and M*/Ltot ratio of 0.45) – which was used to derive the stellar masses in Davis et al. (2018b) – is likely to be a good approximation. This is because these galaxies’ stellar populations have roughly the same red colour. As such, the Mbh–M*,tot relations from Davis et al. (2018b) can be thought of as a (black hole)–(scaled luminosity) relation. Had the Davis et al. (2018b) sample contained some less massive blue galaxies, then, for the following reason, one may expect the Mbh–luminosity relation not to be log-linear, but to steepen at the faint end.
(RC3 B-band) – (Gold Mine K′-band) colour, and the (B − K′)-dependent K′-band stellar mass-to-light ratio (equation 6), versus the K′-band absolute magnitude. The grey points in the upper panel are based on the observed magnitudes, while the black points have been corrected for dust/inclination dimming using the prescription in Driver et al. (2008).
There is one additional element worthy of some exploration, and it pertains to the ν term seen in equations 4 and 5. We have made use of the SDSS Data Release 12 (Alam et al. 2015) to obtain three additional stellar mass estimates. Taylor et al. (2011) advocated that a (g′ − i′)-dependent i′-band stellar mass-to-light ratio, |$M_*/L_{i^{\prime }}$|, yields reliable stellar masses. Their relation is such that |$\log (M_*/L_{i^{\prime }})=0.70(g^{\prime }-i^{\prime })-0.68$|, and it applies to the observed, i.e. not the dust-corrected, magnitudes. We have also used the relation |$\log (M_*/L_{i^{\prime }})=0.518(g^{\prime }-i^{\prime })-0.152$| from Bell et al. (2003). Reddening due to dust will roughly move galaxies along this relation (see fig. 6 in Bell et al. 2003 and fig. 13 in Driver et al. 2007), and thus the relation can be applied to either the dust-corrected or observed magnitudes; for consistency with Taylor et al. (2011), we have chosen the latter. Finally, based on the stellar population synthesis model of Conroy, Gunn & White (2009), Roediger & Courteau (2015) give the relation |$\log (M_*/L_{i^{\prime }})=0.979(g^{\prime }-i^{\prime })-0.831$|. These three relations for the mass-to-light ratios have given us three more sets of stellar mass estimates for (most of) our 74 spiral galaxies, which are shown in Fig. 4 against the (GOLD Mine K′)-based mass estimates. While small random differences are apparent, due to uncertainties in the magnitudes and simplicities in the stellar population models, the main offsets that are visible can be captured/expressed by the ν term.
![Stellar masses based on the GOLD Mine 2.2-$\mu$m K′-band magnitudes (not dust corrected, and using M/LK = 0.62) versus the stellar masses based on the observed (not dust-corrected) SDSS i′-band 0.62-$\mu$m magnitudes (using a [g′ − i′]-dependent $M_*/L_{i^{\prime }}$ ratio) from Bell et al. (2003; red crosses), Taylor et al. (2011; open blue hexagram), and Roediger & Courteau (2015; black filled stars). The data reveals the need for the ν term in equations 4 and 5.](https://oup.silverchair-cdn.com/oup/backfile/Content_public/Journal/mnras/484/1/10.1093_mnras_sty3068/1/m_sty3068fig4.jpeg?Expires=1750290585&Signature=lQKL92ly7nTmv98WT90EQa2AUVpKu7wj2NXWzrFQtiFIYn1we25Ir7qUjgELNzhJseHTZaPVqTJyxtkV638SmNd1IT-6CVzl~6vHj8U~qik5sN7QDXkf4ynswQUCI0ZmjOujmwmPPJp5z7pcdE3XTcgySJgeQ4VXbwK~RhKn748lplTBjHrlwyZSWrHUgQ7zRNhqJ26CevkIWIQ4o1vxIkqWFoGdyCmyeYZoy0I5sIMsrx-3g7A1Zz3GqKVS3leaNrBzk2cPiL~9wH4zGNLEcoSlzIquAnyS9FHFCqvZZqv6YFOawc0tOXCNWqz6rXqLsNC1bkuqsoMW0xjajxyWLA__&Key-Pair-Id=APKAIE5G5CRDK6RD3PGA)
Stellar masses based on the GOLD Mine 2.2-|$\mu$|m K′-band magnitudes (not dust corrected, and using M/LK = 0.62) versus the stellar masses based on the observed (not dust-corrected) SDSS i′-band 0.62-|$\mu$|m magnitudes (using a [g′ − i′]-dependent |$M_*/L_{i^{\prime }}$| ratio) from Bell et al. (2003; red crosses), Taylor et al. (2011; open blue hexagram), and Roediger & Courteau (2015; black filled stars). The data reveals the need for the ν term in equations 4 and 5.
4 RESULTS
4.1 Pitch angle versus velocity dispersion
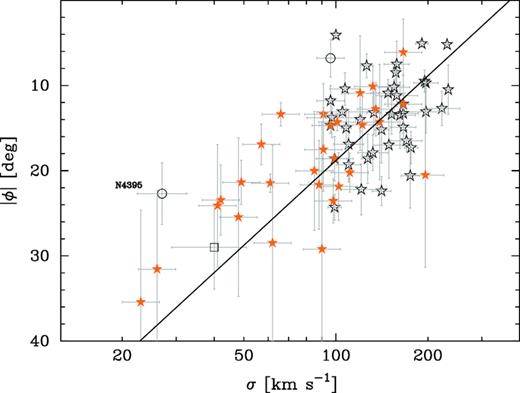
Absolute value of the spiral arm pitch angle, |ϕ|, versus the stellar velocity dispersion σ. The open black stars (and circles) represent spiral galaxies with bulges (and without bulges) that have directly measured black hole masses (see Davis et al. 2017). The line represents equation (7), and is the expected trend based on the Mbh–|ϕ| relation given in equation (1) and the Mbh–σ relation given in equation (3) for galaxies with directly measured black hole masses. The filled orange stars are the Virgo cluster spiral galaxies studied in this work. They appear to follow the line well, as does LEDA 87300 (open square).
The Virgo galaxies appear consistent with the trend (equation 7) defined by the galaxy sample with directly measured black hole masses. Using equations (1) and (3) to predict the black hole masses in these Virgo galaxies, we plot the results in Fig. 6. Of particular interest are NGC 4178 (Secrest et al. 2012) and NGC 4713, the two galaxies in the lower left of the right-hand panel, plus NGC 4294 in the lower section of the left-hand panel. They are predicted here to have black hole masses of 103 to |$10^4 \, \mathrm{M}_{\odot }$| (see the appendix for every galaxies’ predicted BH mass).

4.2 Stellar mass versus velocity dispersion
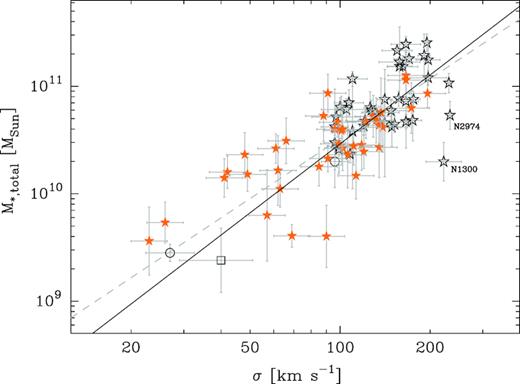
Galaxy stellar mass versus stellar velocity dispersion. Note: Neither LEDA 87300 (open square) nor NGC 4395 (lower left open circle) was used in the linear regression either between Mbh and σ or between Mbh and M*,galaxy for the galaxy set with directly measured black hole masses (open stars and circles). Those regressions (equations 3 and 4, respectively), have been combined to produce equation (8), which is shown here by the solid line which has a slope of 2.13. The bulk of the Virgo cluster spiral galaxies (filled orange stars) appear to follow this line well. Equation (9), constructed from equation (3) and (5), is shown by the dashed grey line and has a slope equal to 1.85.
In Fig. 8, we display the result of using equations (3) and (4) to predict the black hole masses in our Virgo galaxy sample. As before, two galaxies stand out: NGC 4178 and NGC 4713, the two galaxies in the lower left of the right-hand panel of Fig. 8. In addition, we note NGC 4396 and NGC 4299 in the lower section of the left-hand panel of Fig. 8
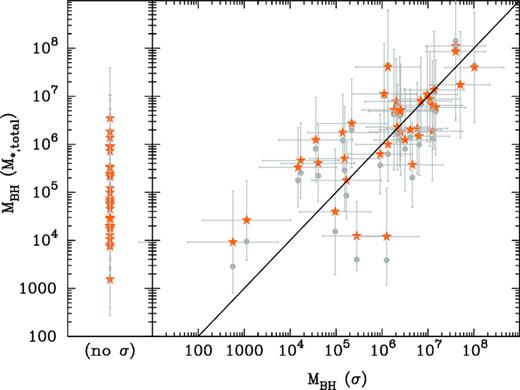
The orange stars show the predicted black hole masses in our Virgo galaxy sample, derived from, when available, the galaxy’s stellar mass M*,galaxy (using equation 4) and the stellar velocity dispersion σ (using equation 3). The grey circles had their (M*,total)-based black hole masses derived using equation (5).
4.3 Pitch angle versus stellar mass

Galaxy stellar mass versus the absolute value of the spiral arm pitch angle. Symbols have the same meaning as in Fig. 5. The solid line represents equation (10), and is the expected trend based on the Mbh–|ϕ| relation given in equation (1) and the Mbh–M*,galaxy relation given in equation (4), defined by galaxies with directly measured black hole masses (which excludes LEDA 87300, denoted by the open square). The dashed grey line is given by equation (11) and was obtained by combining equations (1) and (5).
Fig. 10 displays the result of using equations (1) and (4) to predict the black hole masses in the Virgo spiral galaxies. This time there are many galaxies of interest in regard to potentially harbouring an IMBH. These findings have briefly been summarized in Table 1. Results for all galaxies are shown in the appendix.
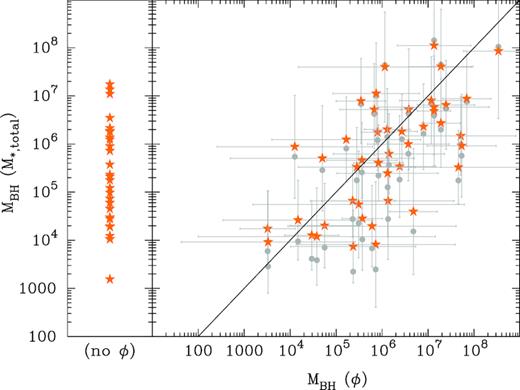
The orange stars show the predicted black hole masses in our Virgo galaxy sample, derived from both the galaxy’s stellar mass M*,galaxy (using equation 4) and, when available, the spiral arm pitch angle |ϕ| (using equation 1). The grey circles show the (M*,total)-based black hole masses derived using equation (5).
Thirty-three spiral galaxies with a potential IMBH.
| Galaxy | Mbh (M*,total) | Mbh (ϕ) | Mbh (σ) |
|---|---|---|---|
| M⊙ | M⊙ | M⊙ | |
| 3 estimates |$\lt 10^5\, \mathrm{M}_{\odot }$| | |||
| N4178 | 3 × 10⁴ | 2 × 10⁴ | 1 × 10³ |
| N4713 | 9 × 10³ | 3 × 10³ | 6 × 10² |
| 2 estimates |$\lt 10^5\, \mathrm{M}_{\odot }$|, no estimate |$\gt 10^5\, \mathrm{M}_{\odot }$| | |||
| IC3392 | 2 × 10⁴ | 6 × 10⁴ | – |
| N4294 | 2 × 10⁴ | 3 × 10³ | – |
| N4413 | 1 × 10⁴ | 3 × 10⁴ | – |
| 2 estimates |$\lt 10^5\, \mathrm{M}_{\odot }$|, 1 estimate |$\ge 10^6\, \mathrm{M}_{\odot }$| | |||
| N4424 | 4 × 10⁴ | 5 × 10⁶ | 1 × 10⁵ |
| N4470 | 1 × 10⁴ | 4 × 10⁴ | 1 × 10⁶ |
| 1 estimate |${\lesssim } 10^5\, \mathrm{M}_{\odot }$|, no estimate |$\gt 10^6\, \mathrm{M}_{\odot }$| | |||
| N4197 | 7 × 10⁴ | 2 × 10⁵ | – |
| N4237 | 5 × 10⁵ | 5 × 10⁴ | 2 × 10⁵ |
| N4298 | 5 × 10⁵ | 4 × 10⁵ | 2 × 10⁴ |
| N4299 | 7 × 10³ | 2 × 10⁵ | – |
| N4312 | 1 × 10⁴ | – | 3 × 10⁵ |
| N4313 | 2 × 10⁵ | – | 2 × 10⁵ |
| N4390 | 8 × 10³ | 7 × 10⁵ | – |
| N4411b | 3 × 10⁴ | 4 × 10⁵ | – |
| N4416 | 9 × 10⁵ | 1 × 10⁴ | – |
| N4498 | 2 × 10⁴ | 6 × 10⁵ | – |
| N4519 | 6 × 10⁴ | 3 × 10⁵ | – |
| N4647 | 4 × 10⁵ | 8 × 10⁵ | 4 × 10⁴ |
| N4689 | 3 × 10⁵ | 3 × 10⁵ | 2 × 10⁴ |
| 1 estimate |${\lesssim } 10^5\, \mathrm{M}_{\odot }$| | |||
| IC3322 | 1 × 10⁴ | – | – |
| N4206 | 5 × 10⁴ | – | – |
| N4222 | 7 × 10⁴ | – | – |
| N4330 | 6 × 10⁴ | – | – |
| N4356 | × 105 | – | – |
| N4396 | 2 × 10³ | – | – |
| N4405 | 6 × 10⁴ | – | – |
| N4445 | 2 × 10⁴ | – | – |
| N4451 | 1 × 10⁵ | – | – |
| N4522 | 2 × 10⁴ | – | – |
| N4532 | 1 × 10⁴ | – | – |
| N4606 | 3 × 10⁴ | – | – |
| N4607 | 3 × 10⁴ | – | – |
5 IMBH TARGETS OF INTEREST
From the previous section, we can identify five primary targets of interest: NGC 4178 and NGC 4713 (with three black hole mass estimates less than |$10^5\, \mathrm{M}_{\odot }$|) and IC 3392, NGC 4294, and NGC 4413 (with two black hole mass estimates less than |$10^5\, \mathrm{M}_{\odot }$| but no velocity dispersion to provide a third black hole mass estimate). Table 1 lists these 5 galaxies along with an additional 28 galaxies that may have a central black hole mass of less than |$10^5\hbox{--}10^6\, \mathrm{M}_{\odot }$|.
The next step is to determine which of the candidate IMBH hosts harbours a point-like nuclear X-ray source, which is likely evidence of an accreting nuclear black hole. We use Chandra data as the primary resource for our search, because Chandra is the only X-ray telescope that can provide accurate sub-arcsecond localizations of faint point-like sources (down to ≲10 counts), thanks to the low instrumental background of its Advanced CCD Imaging Spectrometer (ACIS). In the absence of Chandra data, we inspected archival XMM–Newton European Photon Imaging Camera (EPIC) data, particularly in cases when a long EPIC exposure partly made up for the much lower spatial resolution and much higher instrumental and background noise. For the five primary targets identified above, two (NGC 4178 and NGC 4713) have archival Chandra/ACIS X-ray data already available and one (NGC 4294) has XMM–Newton/EPIC data. The other two (IC 3392 and NGC 4413) have recently been observed as part of our ongoing Chandra survey of the Virgo cluster; the results of the new observations will be presented in a separate paper.
We reprocessed and analysed the archival Chandra X-ray data using the Chandra Interactive Analysis of Observations (ciao) Version 4.9 software package (Fruscione et al. 2006). For sources with a sufficient number of counts, we extracted spectra and built response and auxiliary response files with the ciao task specextract, and fitted the spectra with xspec version 12.9.1 (Arnaud 1996). For sources with fewer counts, we converted between count rates and fluxes using the Portable, Interactive Multi-Mission Simulator (pimms) software version 4.8e, available online14 within the Chandra X-ray Observatory Proposal Planning Toolkit. X-ray contour plots, aperture photometry, and other imaging analysis was done with the DS9 visualization tool, part of NASA’s High Energy Astrophysics Science Archive Research Center (HEASARC) software. For the archival XMM–Newton data, we used standard pipeline products (event files, images, and source lists), downloaded from the HEASARC archive; we also used DS9 for aperture photometry and pimms for flux conversions.
5.1 NGC 4178
From the previous sections, we have three predictions for the black hole mass in NGC 4178, and they all point towards a black hole in the mass range |$10^3\hbox{--}10^4\, \mathrm{M}_{\odot }$|. This galaxy was observed by Chandra/ACIS-S for 36 ks on 2011 February 19 (Cycle 12). We downloaded the data from the public Chandra archives, and reprocessed them with the ciao task chandra_repro. We confirm the detection of an X-ray source consistent with both the dynamical centre of the galaxy (Fig. 11) and a nuclear star cluster (Satyapal et al. 2009; Secrest et al. 2012, 2013). We extracted the source counts from a circle of radius 2 arcsec and the background counts from an annulus between radii of 3 and 9 arcsec. As discussed by Secrest et al. (2012), this source is unusually soft for an AGN. We measured a net count rate of (2.8 ± 0.9) × 10−4 ct s−1 in the 0.3–1.0 keV band, (6.2 ± 1.3) × 10−4 ct s−1 in the 1.0–2.0 keV band, and (1.0 ± 0.6) × 10−4 ct s−1 in the 2.0–7.0 keV band. With only ≈36 ± 6 net counts, it is clearly impossible to do any proper spectral fitting, and certainly any fitting based on the χ2 statistics (which requires |$\gtrsim$|15 counts per bin). None the less, we can fit the data with the Cash statistics (Cash 1979), generally used for sources with a small number of counts, and constrain some simple models. Power-law fitting based on the hardness ratio was carried out and discussed in detail by Secrest et al. (2012). We refitted the spectrum in xspec, with the Cash statistics, after rebinning to 1 count per bin; we confirm that the power law is steep; i.e., it is a soft spectrum, with photon index |$\Gamma = 3.4^{+1.7}_{-1.2}$|, with an intrinsic absorbing column density |$N_{\rm H} = 5^{+5}_{-4} \times 10^{21}$| cm−2 (C-statistics of 34.2 for 31 degrees of freedom). Such a steep slope, moderately high absorption, and large uncertainty on both parameters make it difficult to constrain the 0.3–10 keV unabsorbed luminosity: Formally we obtain a 90 per cent confidence limit of |$L_{0.3-10} = 9^{+105}_{-6} \times 10^{38}$| erg s−1, consistent with the estimates of Secrest et al. (2012).
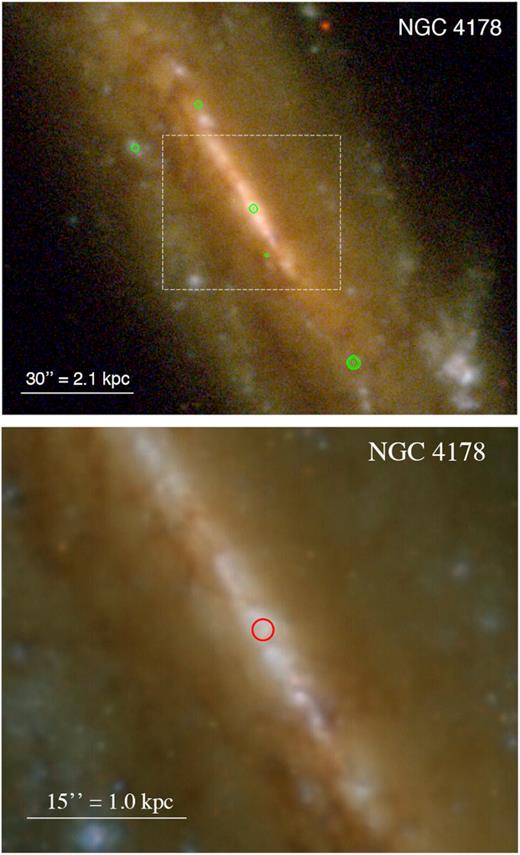
Top panel: SDSS image of NGC 4178 (red = i filter; green = g filter; blue = u filter), with Chandra/ACIS-S contours (0.3–7.0 keV band) overlaid in green. North is up; east is to the left. Bottom panel: zoomed-in view of the nuclear region, from the Next Generation Virgo-cluster Survey, with the position of the Chandra nuclear source overlaid as a red circle (radius 1 arcsec).
However, when we look at the individual detected energy of the few counts, rather than simply considering the hardness ratio, we find that the power-law model is inadequate. The decline in the number of detected counts above 2 keV is very sharp (Fig. 12), consistent with the Wien tail of an optically thick thermal spectrum. We therefore fit the same spectrum with an absorbed diskbb model: We obtain a C-statistic of 31.5/31 (an improvement at the 90 per cent confidence level, with respect to the power-law fit). The best-fitting parameters are |$N_{\rm H} = 1.5^{+3.3}_{-1.5} \times 10^{21}$| cm−2 for the intrinsic absorption, |$kT_{\rm in} = 0.56^{+0.35}_{-0.19}$| keV for the peak disc temperature, |$r_{\rm in} = 94^{+212}_{-62} \, (\cos \theta)^{-1/2}$| km for the apparent inner-disc radius, where θ is the viewing angle. The unabsorbed luminosity is |$L_{0.3-10} = 1.9^{+1.9}_{-0.7} \times 10^{38}$| erg s−1. The luminosity, temperature, and inner-disc radius are self-consistent for a stellar-mass black hole in the high/soft state. The temperature is too high, and the radius too small, for a supermassive black hole or even an IMBH. Invoking Occam’s razor, we argue that the most likely interpretation of the X-ray source at the nuclear location of NGC 4178 is a stellar-mass X-ray binary.
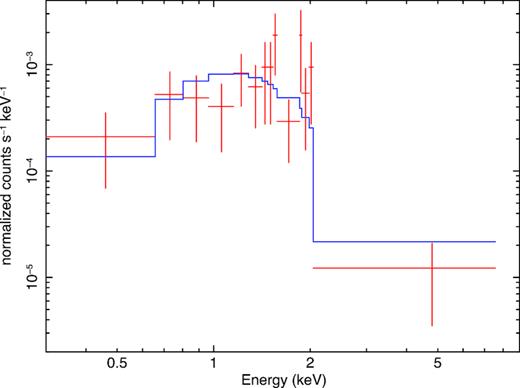
Chandra/ACIS-S spectrum of the nuclear source in NGC 4178, fitted with a disc–blackbody model. The datapoints have been grouped to a signal to noise >1.5 for plotting purposes only. The fit was done on the individual counts, using Cash statistics. See Section 4.1 for the fit parameters. The sharp drop of detected counts above 2 keV disfavours a power-law model.
What to make, then, of the strong mid-IR emission in [Ne v] (Satyapal et al. 2009; Secrest et al. 2012), which is usually a signature of strong X-ray photoionization and was the strongest argument in favour of a hidden AGN in this galaxy? It is always possible to postulate a Compton-thick AGN, powerful enough to supply the required luminosity; we simply argue that this hypothesis is untestable with the available Chandra data. Alternatively, the nuclear black hole may have been more active in the recent past (producing the highly ionized gas around it), but is currently in a low state. The optical line ratios do not require an AGN, either: NGC 4178 is classified as an H ii nucleus (Ho, Filippenko & Sargent 1997; Decarli et al. 2007; Secrest et al. 2012).
The uncertainty on the current luminosity, and indeed on the detection of X-ray emission from the nuclear black hole, makes it impossible to constrain its mass via fundamental-plane relations (Merloni, Heinz & di Matteo 2003; Miller-Jones et al. 2012; Plotkin et al. 2012). For these relations, Secrest et al. (2013) assumed an intrinsic 0.5–10 keV X-ray luminosity ≈1040 erg s−1, a bolometric correction factor κ ∼ 103, and an upper limit of 84.9 |$\mu$|Jy for the 5-GHz flux density; from these values, they predicted a black hole mass <8.4 |$\times 10^4 \, \mathrm{M}_{\odot }$|. Instead, we argue that the X-ray luminosity is pure guesswork, with no empirical constraint. Moreover, if the nuclear black hole was indeed an IMBH, the bolometric correction should be much lower than 103, more likely |$\kappa \lesssim 10$|, assuming a peak disc temperature |$kT \gtrsim 0.1$| keV for a black hole mass |$\lesssim 10^5$| M⊙. In summary, NGC 4178 may host an IMBH but neither the X-ray spectrum of the nuclear source nor the fundamental plane relations can be used to support this hypothesis.
5.2 NGC 4713
For NGC 4713 (SDSS J124957.86+051841.0), we again have three predictions for the black hole mass, spanning (0.6–9)|$\times 10^3)\, \mathrm{M}_{\odot }$|.
Based on a 4.9-ks Chandra/ACIS-S observation taken on 2003 January 28 (Cycle 4), Dudik et al. (2005) reported on the lack of a nuclear X-ray source in this dwarf galaxy, with a 0.3–10 keV upper limit of ≈4 × 10⁻⁴ ct s−1; looking in the mid-IR, Satyapal et al. (2009) also excluded an active nucleus. However, Nagar et al. (2002) had included it in their list of BPT (Baldwin, Phillips & Terlevich 1981) ‘composite galaxies’, as did Reines, Greene & Geha (2013). Furthermore, Terashima et al. (2015) found an X-ray source at the nuclear position in a 52.2-ks XMM–Newton European Photon Imaging Camera observation, part of the XMM–Newton Serendipitous Source Catalog Data Release 3 (Watson et al. 2009). The unabsorbed 0.3–10 keV flux is reported as ≈5 × 10⁻¹⁴ erg cm−2 s−1, with the addition of a ‘weak hint’ of an Fe-K line at 6.4 keV. Based on the ratios between the far-infrared luminosities at 18 and 90 |$\mu$|m (from the AKARI survey; Kawada et al. 2007; Ishihara et al. 2010) and the X-ray luminosity, Terashima et al. (2015) classified the nucleus of NGC 4713 as an unobscured transition object between LINERS and H ii nuclei. The lower spatial resolution of XMM–Newton makes it impossible to determine whether the faint nuclear X-ray emission is point-like, from an AGN, or extended, from hot gas in a star-forming region.
We reprocessed and re-examined the 4.9-ks Chandra/ACIS-S observation. In contrast to the conclusions of Dudik et al. (2005), we do find a point-like X-ray nucleus (see Fig. 13), located within 0.2 arcsec of the optical nucleus as defined by SDSS-DR12 (Alam et al. 2015) and Gaia Data Release 2 (Gaia Collaboration 2018). We measure a net count rate in the 0.3–7.0 keV band of |$2.0^{+1.3}_{-0.9} \times 10^{-3}$| ct s−1, i.e. 10 raw counts and 0.2 background counts. The errors reported here are 90 per cent confidence limits calculated from the tables of Kraft, Burrows & Nousek (1991), suitable for sources with a low number of counts. Source counts are detected in all three standard bands (soft, 0.3–1 keV; medium, 1–2 keV; hard, 2–7 keV), which is consistent with a power-law spectrum. Assuming a power-law spectrum with photon index Γ = 1.7, and line-of-sight column density NH = 2 × 1020 cm−2, we find with pimms that the net count rate corresponds to a 0.3–10 keV unabsorbed flux of |$(1.4^{+0.9}_{-0.6}) \times 10^{-14}$| erg cm−2 s−1 (slightly lower than the XMM –Newton flux, which may include a hot-gas contribution). At the distance of 13.2 Mpc for NGC 4713, this implies a luminosity |$L_{0.3-10} = 3.0^{+1.9}_{-1.4} \times 10^{38}$| erg s−1. We also obtained an essentially identical estimate of L0.5 − 7 ≈ 3.1 × 1038 erg s−1 using the ciao task srcflux within DS9, with the same input spectral model and column density.
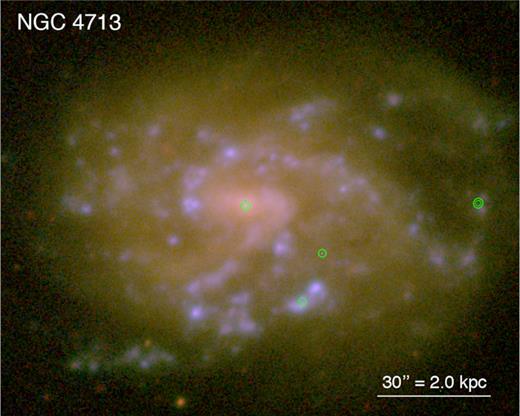
SDSS image of NGC 4713, with Chandra/ACIS-S contours overlaid in green. North is up; east is to the left.
5.3 Galaxies with two BH mass estimates <105 M⊙
NGC 4294 was observed by XMM–Newton/EPIC (European Photon Imaging Camera) on 2016 June 10, for 46 ks. We found no sources at the nuclear position, in the stacked EPIC pn and MOS (Metal Oxide Semi-conductor) image. The nearest point source is located ≈9 arcsec from the optical nuclear position, way beyond the possible astrometric uncertainty of the EPIC image. We estimate a 90 per cent confidence limit for the 0.3–10 keV nuclear luminosity of L0.3 − 10 < 1 × 1038 erg s−1, for a distance of 17.0 Mpc.
Among the other four galaxies with two black hole mass estimates <105 M⊙ (Table 1), three (IC 3392, NGC 4413, and NGC 4424) have been observed by Chandra this year for our Virgo survey, and we will present the results in a separate paper. The fourth galaxy, NGC 4470, was observed by Chandra several times between 2010 and 2016: twice with ACIS-I and four times with ACIS-S. However, in all cases, it was not the primary target of the observation, and was located several arcmin away from the aimpoint, with a resulting degradation of the point spread function at its location. Moreover, in three of the four ACIS-S observations, the nuclear position of NGC 4470 fell on to the less sensitive S2 chip, rather than the S3 chip. Of all the available data sets, the most useful one for our investigation is from a 20-ks observation taken on 2010 November 20 (Cycle 12): It is the only observation in which NGC 4470 is on the S3 chip, only ≈4 arcmin from the aimpoint. From this observation, we found excess emission centred at ≈1 arcsec of the SDSS and Gaia optical nuclear positions (smaller than the positional uncertainty of the X-ray source at that off-axis position and for the small observed number of counts), with a net count rate of (5 ± 2) × 10−4 ct s−1 (i.e., ≈ 10 net counts) in the 0.3–7.0 keV band. For an absorbing column density NH = 1.7 × 1020 cm−2, a power-law photon index Γ = 1.7, and a distance of 18.8 Mpc, this corresponds to an unabsorbed luminosity |$L_{0.3-10} = 2.2^{+1.9}_{-1.2} \times 10^{38}$| erg s−1.
5.4 Galaxies with one BH mass estimate ≲105 M⊙
Finally, we examined the 26 galaxies with one black hole mass estimate ≲105 M⊙ (Table 1). Twenty of them have been observed as part of our Virgo survey, and we will report on them elsewhere. The other three, NGC 4299, NGC 4647, and NGC 4689, already had archival Chandra data.
NGC 4299 was observed by Chandra/ACIS-S on 2007 November 18, for 5.0 ks. We do not find any significant emission at the nuclear position (see Fig. 14); we place a 90 per cent upper limit of 8 × 10⁻⁴ count s−1 in the 0.3–7 keV band, using the tables of Kraft et al. (1991). Assuming line-of-sight Galactic absorption NH = 2.5 × 1020 cm−2 and a power-law spectrum with photon index Γ = 1.7, this corresponds to a luminosity L0.3−10 < 7 × 1038 erg s−1 at the distance of 21.9 Mpc.
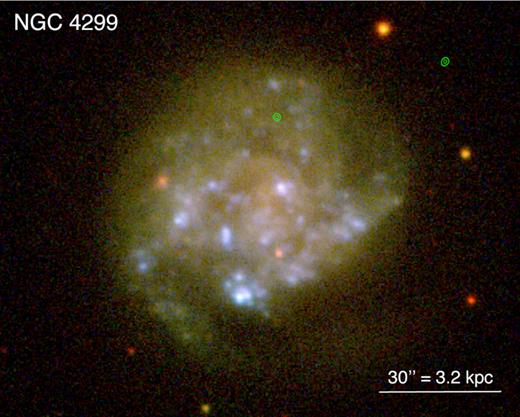
SDSS image of NGC 4299, with Chandra/ACIS-S contours overlaid in green (seen to the right of the galaxy). North is up; east is to the left.
NGC 4647 was observed by Chandra/ACIS-S on six visits between 2000 and 2011 (2000 April 20: 38 ks; 2007 January 30: 52 ks; 2007 February 01: 18 ks; 2011 August 08: 85 ks; 2011 August 12: 14 ks; 2011 February 24: 101 ks), for a total of ≈308 ks. On all occasions, the aimpoint was located at the main target of the observation, the nearby E galaxy NGC 4649; however, NGC 4647 is only ≈2.5 arcmin away, and falls within the S3 chip in all six data sets. We inspected each observation individually, and we then used the ciao script merge_obs to create a stacked, exposure-corrected image. We used point-like optical/X-ray associations to align the Chandra image on to the SDSS optical image so that the two frames coincide within ≲0.3 arcsec. There is no point-like X-ray source at the nuclear location, defined by SDSS (also in agreement with Gaia’s nuclear position within the same uncertainty). The nearest point-like X-ray source (most likely an X-ray binary) is located ≈3 arcsec to the west of the nuclear location, well above its positional uncertainty. The 90 per cent upper limit of the (undetected) nuclear source is 3.6 × 10⁻⁵ ct s−1 in the 0.3–7 keV band. To convert this upper limit to a luminosity limit, we took a weighted average of the contributions over the different observation cycles, to take into account the change in the response of the ACIS detector; we also assumed, as usual, a line-of-sight Galactic absorption (in this case, NH = 2.1 × 1020 cm−2) and a power-law spectrum with photon index Γ = 1.7. We conclude that the nuclear X-ray luminosity is L0.3–10 < 1 × 1037 erg s−1, at the distance of 17.6 Mpc.
NGC 4689 was observed by Chandra/ACIS-S for 5 ks on 2007 May 7 (Cycle 8). We do not detect any net emission at the nuclear position; the Bayesian 90 per cent confidence limit on the net count rate is ≈5 × 10⁻⁴ ct s−1. For a line-of-sight Galactic absorption NH = 2.0 × 1020 cm−2 and a photon index Γ = 1.7, we obtain an upper limit to the nuclear black hole luminosity of L0.3–10 < 1.2 × 1038 erg s−1, at the distance of 16.4 Mpc.
A summary of the X-ray observation exposure times, count rates, and luminosities is provided in Table 2.
Summary of the X-ray observations used for this work and of their respective nuclear X-ray properties.
| Galaxy | Observatory | Date | Exp. time | Count ratea | L0.3–10 |
|---|---|---|---|---|---|
| (ks) | (ct s−1) | (erg s−1) | |||
| NGC 4178 | Chandra | 2011-02-19 | 36 | |$\left(1.0^{+0.2}_{-0.2}\right) \times 10^{-3}$| | |$\left(1.9^{+1.9}_{-0.7}\right) \times 10^{38}$| |
| NGC 4713 | Chandra | 2003-01-28 | 4.9 | |$\left(2.0^{+1.3}_{-0.9}\right) \times 10^{-3}$| | |$\left(3.0^{+1.9}_{-1.4}\right) \times 10^{38}$| |
| NGC 4294 | XMM–Newton | 2006-06-10 | 46 | <1 × 10⁻³ | <1 × 1038 |
| NGC 4470 | Chandra | 2010-11-20 | 20 | |$\left(0.5^{+0.2}_{-0.2}\right) \times 10^{-3}$| | |$\left(2.2^{+1.9}_{-1.2}\right) \times 10^{38}$| |
| NGC 4299 | Chandra | 2007-11-18 | 5.0 | <0.8 × 10⁻³ | <7 × 1038 |
| NGC 4647 | Chandra | 2000-04-20 | 38 | ||
| 2007-01-30 | 52 | ||||
| 2007-02-01 | 18 | ||||
| 2011-02-24 | 101 | ||||
| 2011-08-08 | 85 | ||||
| 2011-08-12 | 14 | ||||
| (stacked) | 308 | <0.036 × 10⁻³ | <0.1 × 1038 | ||
| NGC 4689 | Chandra | 2007-05-07 | 5.0 | <0.5 × 10⁻³ | <1.2 × 1038 |
aFor Chandra observations: observed ACIS-S count rate in the 0.3–7 keV band; for XMM-Newton: observed EPIC-pn count rate in the 0.3–10 keV band.
6 DISCUSSION
Observational evidence for ∼12, 30, and 60 solar-mass black holes already exists (Reid et al. 2014; Abbott et al. 2016, 2017). It is also understood that in today’s Universe, the end product of a massive star will be a ‘stellar-mass’ black hole less than 80–100 M⊙, but near this limit if the star’s metallicity was low (10−2–10−3 solar) and the mass loss from its stellar wind was low (Belczynski et al. 2010; Spera, Mapelli & Bressan 2015; Spera & Mapelli 2017). While some authors have advocated that the seed masses that gave rise to the supermassive black holes at the centres of galaxies started out with masses of |$10^5 - 10^6\, \mathrm{M}_{\odot }$| (e.g. Turner 1991; Loeb & Rasio 1994), and many AGNs are known to have 105–106 M⊙ black holes (e.g. Graham & Scott 2015, and references therein), the assumption that there are not black holes with masses of 102–105 M⊙ need not hold. The perceived need for massive seeds was originally invoked because, under the assumption of spherical accretion, there was not sufficient time to grow the massive quasars observed in the early Universe. However, it is possible to grow black holes at a much faster rate than the idealized and restrictive Eddington accretion rate (e.g. Nayakshin, Power & King 2012; Alexander & Natarajan 2014). Moreover, even if the massive quasars did form from massive seeds (Pacucci et al. 2016), there may still be a continuum of BH masses, perhaps with today’s IMBHs born from Pop III and II.5 stars, or from other processes, as noted in Section 1. There are, therefore, reasons to expect that IMBHs with 102 < Mbh/M⊙ < 105 should exist.
Just as initial searches for exoplanets found the larger ones first, and surveys of galaxies found the bright Hubble–Jeans sequence (Jeans 1919, 1928; Hubble 1926, 1936) prior to the detection of low-surface-brightness galaxies, sample selection effects hinder the detection of IMBHs in galactic nuclei. Their gravitational spheres of influence are too small to be spatially resolved with our current instrumentation. Furthermore, ambiguity also arises because the energy levels of their current low-accretion activity overlap with those of highly accreting stellar-mass black holes in X-ray binaries. There is, however, no obvious physical reason why these IMBHs should not exist, and a small number of candidates are known, including the already-mentioned |${\sim }10^4 \, \mathrm{M}_{\odot }$| black hole near/inside ESO 243-49 (Farrell et al. 2009; Yan et al. 2015; Soria et al. 2017; Webb et al. 2017), plus the nuclear black holes in LEDA 87300 (Baldassare et al. 2015; whose mass estimate was halved in Graham et al. 2016; see also Baldassare et al. 2017) and in NGC 404 (with a 3σ upper limit on its black hole mass of |$1.5\times 10^5\, \mathrm{M}_{\odot }$|: Nguyen et al. 2017).
There is also a series of studies (Pardo et al. 2016; Mezcua et al. 2016, 2018) that have estimated the masses of distant low-mass black holes using a near-linear Mbh–M*tot relation for AGNs from Reines & Volonteri (2015). However, it should be noted that Reines & Volonteri (2015) appear unaware of, or reject, the bend in the Mbh–M*spheroid diagram (see Graham & Scott 2015), and the associated bend in the Mbh–M*tot diagram which is evident in the data they present. Fitting a log-linear relation to galaxies that they consider to contain a classical bulge rather than a pseudo-bulge, the right-hand panel of fig. 10 in Reines & Volonteri (2015) reveals that all galaxies with |$M_{\rm bh} \lesssim 10^8\, \mathrm{M}_{\odot }$| (except for the stripped compact elliptical galaxy M 32, which should be down-weighted in this diagram due to its rare nature relative to normal galaxies) reside below their Mbh –M*tot relation for classical bulges and elliptical galaxies. Many more galaxies with directly measured black hole masses also reside below their relation, but they were labelled ‘pseudo-bulges’ and excluded by Reines & Volonteri (2015). Given that the bulge-to-total mass ratio tends to decrease as one progresses to lower mass spiral galaxies, the Mbh–M*tot relation for spiral galaxies (Davis et al. 2018b) is steeper than the near-quadratic relation for the bulges of spiral galaxies (e.g. Scott et al. 2013; Savorgan et al. 2016; Davis et al. 2018a). Reines & Volonteri (2015) instead suggest that their AGN sample – used to define their near-linear Mbh–M*tot relation for AGN – resides in pseudo-bulges that have an Mbh/M*,tot ratio of ≈0.03 per cent at |$M_{\rm *tot} = 10^{11}\, \mathrm{M}_{\odot }$|. However, their distribution of AGN data does not match the distribution of spiral galaxies (also alleged to contain pseudo-bulges) with directly measured black hole masses and stellar masses derived from space-based infrared images. As such, while the dwarf galaxies studied by Pardo et al. (2016) and Mezcua et al. (2016, 2018) may contain IMBHs, it may be worthwhile revisiting their black hole masses.
A growing number of alleged and potential IMBHs, not located at the centre of their host galaxy, are also known (e.g. Colbert & Mushotzky 1999; Farrell et al. 2009, 2014; Soria et al. 2010; Webb et al. 2010, 2014; Liu, Orosz & Bregman 2012; Secrest et al. 2012; Sutton et al. 2012; Kaaret & Feng 2013; Miller et al. 2013; Pasham, Strohmayer & Mushotzky 2014; Cseh et al. 2015; Mezcua et al. 2015; Pasham et al. 2015; Oka et al. 2016). It has been theorized that some of these may have previously resided at the centre of a galaxy: perhaps from a stripped and digested satellite galaxy or minor merger (e.g. Drinkwater et al. 2003), or perhaps they were dynamically ejected from the core of their current host galaxy (e.g. Merritt, Schnittman & Komossa 2009). This latter phenomenon may occur due to the gravitational recoiling of a merged black hole pair (e.g. Bekenstein 1973; Favata, Hughes & Holz 2004; Herrmann et al. 2007; Nagar 2013). Alternatively, or additionally, IMBHs may have formed in their off-centre location. Such speculation should, however, be tempered at this point because, as noted in Section 1, many such past IMBH candidates can be explained as super-Eddington accretion on to stellar-mass compact objects (Feng & Soria 2011; Kaaret et al. 2017).
There are many methods, beyond those already employed here, that can be used to identify, and probe the masses of, black holes. This includes reverberation mappings of AGNs (e.g. Bahcall, Kozlovsky & Salpeter 1972; Blandford & McKee 1982; Netzer & Peterson 1997), the ‘fundamental plane of black hole activity’ (Merloni et al. 2003; Falcke, Körding & Markoff 2004), spectral modelling of the high-energy X-ray photon coming from the hot accretion discs around IMBHs (Pringle & Rees 1972; Narayan & Yi 1995), high-ionization optical emission lines (Baldwin et al. 1981; Kewley et al. 2001), and high-spatial-resolution observations of maser emission using radio and millimetre/submillimetre interferometry (e.g. Miyoshi et al. 1995; Greenhill et al. 2003; Humphreys et al. 2016; Asada et al. 2017). In addition, the merging of black holes is now quite famously known to produce gravitational radiation during their orbital decay (Abbott et al. 2016). The merging of galaxies containing their own central IMBH is similarly expected to result in the eventual merging of these black holes. The Kamioka Gravitational Wave Detector (KAGRA; Aso et al. 2013) will be a 3-km-long underground interferometer in Japan capable of detecting the gravitational radiation emanating from collisions involving black holes with masses up to 200 M⊙ (Tápai, Zoltán & László 2015). The planned Deci-Hertz Interferometer Gravitational wave Observatory (DECIGO; Kawamura et al. 2011) and the European, Laser Interferometer Space Antenna (LISA) Pathfinder mission15 (Anza et al. 2005; McNamara 2013), with their greater separation of mirrors, will be able to detect longer wavelength gravitational waves and thus better reach into the domain of intermediate-mass and supermassive black hole mergers, the latter of which are currently being searched for via ‘pulsar timing arrays’ (PTAs) (e.g. Hobbs et al. 2010; Kramer & Champion 2013; Shannon et al. 2015). A key constraint to the expected detection threshold of such signals from PTAs – in particular the background of cosmic ripples from the merger of massive black holes (themselves arising from the merger of galaxies) – is the (black hole)-to-(host galaxy/bulge) mass ratio (see equation 4 for spiral galaxies). An additional source of long-wavelength gravitational radiation will arise from the inspiral of compact stellar-mass objects, such as neutron stars and black holes, around these IMBHs (Mapelli et al. 2012). It is reasonable to expect that the densely packed nuclear star clusters, which coexist with low-mass SMBHs (e.g. González Delgado et al. 2008; Seth et al. 2008; Graham & Spitler 2009), will similarly surround many IMBHs. Gravitational radiation and the gravitational tidal disruption of ill-fated stars that venture too close to these black holes (Komossa et al. 2009, Komossa 2013, and references therein; Zhong, Berczik & Spurzem 2015; Stone & Metzger 2016; Lin et al. 2018) are therefore expected from these astrophysical entities. There is, therefore, an array of future observations that could yield further confidence and insight into the realm of IMBHs.
In the pursuit of galaxies that may harbour (some of) the largely missing population of IMBHs, we have predicted the black hole masses in 74 spiral galaxies in the Virgo cluster that will be imaged with the ACIS-S detector on the Chandra X-ray Observatory. Previously, Gallo et al. (2008) performed a complementary investigation looking at 100 early-type galaxies in the Virgo cluster. However, they only used two global properties of the galaxies (σ and M*,galaxy) to predict the black hole masses, and their predictions differed systematically and significantly from each other (Gallo et al. 2008, their fig. 4), revealing that either one, or both, of their black hole scaling relations was in error. That offset, which reached 3 orders of magnitude at the low-mass end, is investigated and reconciled in Paper I. Here, we have used three global properties of spiral galaxies (σ, M*,galaxy and spiral arm pitch angle ϕ) to predict the black hole masses in our spiral galaxy sample. Moreover, our updated scaling relations are internally consistent with each other and do not contain any dramatic systematic bias. Table 3 provides a sense of what galaxy parameter values are associated with a given set of black hole masses. Based on our estimates of these galaxies’ stellar masses, 33 of the 74 galaxies are predicted to have a black hole mass less than |$10^5 - 10^6\, \mathrm{M}_{\odot }$| (see Table 1).
Black hole calibration points.
| Mbh | M*,total | ϕ | σ |
|---|---|---|---|
| M⊙ | M⊙ | [deg] | km s−1 |
| 109 | 2.9 × 10¹¹ (2.4 × 10¹¹) | 3.0 | 293 |
| 108 | 1.2 × 10¹¹ (1.1 × 10¹¹) | 9.1 | 195 |
| 107 | 5.1 × 10¹⁰ (5.3 × 10¹⁰) | 15.2 | 130 |
| 106 | 2.1 × 10¹⁰ (2.5 × 10¹⁰) | 21.3 | 86 |
| 105 | 8.9 × 10⁹ (1.2 × 10¹⁰) | 27.4 | 57 |
| 104 | 3.7 × 10⁹ (5.5 × 10⁹) | 33.5 | 38 |
| 103 | 1.6 × 10⁹ (2.6 × 10⁹) | 39.6 | 25 |
| 102 | 6.6 × 10⁸ (1.2 × 10⁸) | 45.7 | 17 |
The black hole mass estimates presented here shall be used in a number of forthcoming papers once imaging from the new Chandra Cycle 18 Large Project ‘Spiral galaxies of the Virgo cluster’ (Proposal ID: 18620568) is completed. Given the low degree of scatter about the Mbh–|ϕ| relation, it appears to be the most promising relation to use in the search for IMBHs in late-type galaxies. In future work, we intend to identify those late-type spiral galaxies with open, loosely wound spiral arms, i.e. those expected to have the lowest mass black holes at their centre, and then check for the signature of a hot accretion disc heralding the presence of potentially further IMBHs.
ACKNOWLEDGEMENTS
This research was supported under the Australian Research Council’s funding scheme DP17012923. Part of this research was conducted within the Australian Research Council’s Centre of Excellence for Gravitational Wave Discovery (OzGrav), through project number CE170100004. Support for this work was provided by the National Aeronautics and Space Administration through Chandra Award Number 18620568. This research has made use of the NASA/IPAC Extragalactic Database (NED). This publication makes use of data products from the Two Micron All Sky Survey. We acknowledge use of the HyperLeda database (http://leda.univ-lyon1.fr). This research has made use of the Galaxy OnLine Database Milano Network (GOLDMine).
Footnotes
For NGC 4178, the prediction that |$M_{\rm bh} \lt 10^5\, \mathrm{M}_{\odot }$| is simply based on the assumption that the nuclear BH mass is less than 20 per cent of this galaxy’s nuclear star cluster mass.
With a central rather than global spiral pattern, we exclude the ES galaxy Cygnus A from the list of 44 galaxies in Davis, Graham & Seigar (2017), who, we note, reported that three of these remaining 43 galaxies appear to be bulgeless.
There is also a scaling relation between Mbh and the bulge Sérsic index n (Graham & Driver 2007; Savorgnan 2016; Davis et al. 2018a). However, we do not use that relation for this work, partly because of the steepness at low masses and partly to avoid the need for bulge/disc decompositions of our Virgo sample.
Davis et al. (2017) reported that excluding Cygnus A from the linear regression between black hole mass and spiral arm pitch angle did not have a significant effect.
We note that NGC 4276 only has one redshift-independent distance estimate; and we hereafter use the (Virgo + Great-Attractor + Shapley)-infall adjusted distance from NED for this galaxy.
Based on a Chabrier (2003) initial stellar mass function.
This involves taking the bisector of the ‘forward’ and ‘inverse’ regressions.
REFERENCES
in
in
in
, in
APPENDIX A: GALAXY SAMPLE AND PREDICTED BLACK HOLE MASSES
Predicted black hole masses.
| Galaxy | Type | Dist. mod. | |ϕ| (band) | log Mbh(|ϕ|) | σ | log Mbh(σ) | log M*,gal | log Mbh(M*,gal) |
|---|---|---|---|---|---|---|---|---|
| (deg) | (dex) | (km s−1) | (dex) | (dex) | (dex) | |||
| IC3322 | SAB(s)cd | 31.7 ± 0.2 | – | – | – | – | 9.6 ± 0.1 | 4.0 ± 0.7 (3.5 ± 0.8) |
| IC3322A | SB(s)cd | 31.9 ± 0.4 | – | – | – | – | 10.1 ± 0.2 | 5.4 ± 0.8 (5.1 ± 0.9) |
| IC3392 | SAb | 30.7 ± 0.5 | 28.2 ± 3.9 (GALEX/FUV) | 4.8 ± 0.8 | – | – | 9.7 ± 0.2 | 4.3 ± 0.9 (3.8 ± 1.0) |
| N4178 | SB(rs)dm | 30.7 ± 0.4 | 31.6 ± 9.3 (Spitzer/IRAC3) | 4.2 ± 1.6 | 26.0 ± 3.9 | 3.1 ± 0.9 | 9.7 ± 0.2 | 4.4 ± 0.8 (4.0 ± 0.9) |
| N4192 | SAB(s)ab | 30.7 ± 0.4 | – | – | 129.0 ± 19.4 | 7.0 ± 0.7 | 10.7 ± 0.2 | 7.0 ± 1.0 (7.0 ± 1.0) |
| N4197 | Sd | 32.2 ± 0.3 | 24.6 ± 5.0 (SDSS/g) | 5.4 ± 0.9 | – | – | 9.9 ± 0.1 | 4.8 ± 0.8 (4.4 ± 0.8) |
| N4206 | SA(s)bc | 31.3 ± 0.4 | – | – | – | – | 9.8 ± 0.2 | 4.7 ± 0.8 (4.2 ± 0.9) |
| N4212 | SAc | 31.3 ± 0.3 | 21.5 ± 1.1 (Spitzer/IRAC2) | 5.9 ± 0.4 | 61.0 ± 9.2 | 5.1 ± 0.8 | 10.4 ± 0.1 | 6.2 ± 0.8 (6.1 ± 0.9) |
| N4216 | SAB(s)b | 31.0 ± 0.3 | 20.5 ± 10.8 (Spitzer/IRAC2) | 6.1 ± 1.9 | 196.0 ± 29.4 | 8.0 ± 0.6 | 10.9 ± 0.1 | 7.6 ± 1.1 (7.6 ± 1.1) |
| N4222 | Sd | 31.8 ± 0.4 | – | – | – | – | 9.9 ± 0.2 | 4.9 ± 0.8 (4.5 ± 0.9) |
| N4237 | SAB(rs)bc | 31.4 ± 0.8 | 28.5 ± 11.5 (CFHT/u) | 4.7 ± 2.0 | 62.0 ± 9.3 | 5.2 ± 0.8 | 10.2 ± 0.3 | 5.7 ± 1.1 (5.5 ± 1.2) |
| N4254 | SA(s)c | 30.9 ± 0.3 | 23.6 ± 2.6 (GALEX/FUV) | 5.5 ± 0.5 | 98.0 ± 14.7 | 6.3 ± 0.7 | 10.7 ± 0.1 | 6.9 ± 0.9 (6.8 ± 0.9) |
| N4276 | SBc | 33.1 ± 0.8 | 18.7 ± 4.3 (SDSS/g) | 6.4 ± 0.8 | – | – | 10.2 ± 0.3 | 5.5 ± 1.1 (5.3 ± 1.2) |
| N4293 | SB(s)0/a | 30.8 ± 0.6 | – | – | 118.0 ± 17.7 | 6.8 ± 0.7 | 10.5 ± 0.2 | 6.3 ± 1.0 (6.2 ± 1.0) |
| N4294 | SB(s)cd | 31.1 ± 0.4 | 35.5 ± 2.6 (CFHT/z) | 3.5 ± 0.6 | – | – | 9.7 ± 0.2 | 4.2 ± 0.8 (3.8 ± 0.9) |
| N4298 | SA(rs)c | 31.0 ± 0.3 | 23.5 ± 4.1 (Spitzer/IRAC2) | 5.6 ± 0.8 | 42.0 ± 6.3 | 4.2 ± 0.8 | 10.2 ± 0.2 | 5.7 ± 0.8 (5.4 ± 0.9) |
| N4299 | SAB(s)dm | 31.7 ± 0.3 | 24.6 ± 7.8 (CFHT/u) | 5.4 ± 1.4 | – | – | 9.5 ± 0.1 | 3.9 ± 0.8 (3.3 ± 0.8) |
| N4302 | Sc | 31.4 ± 0.7 | – | – | – | – | 10.5 ± 0.3 | 6.5 ± 1.1 (6.4 ± 1.2) |
| N4303a | SAB(rs)bc | 30.6 ± 0.9 | 14.7 ± 0.9 (GALEX/NUV) | 6.6 ± 0.2 | 96.0 ± 14.4 | 6.3 ± 0.7 | 10.6 ± 0.4 | 6.7 ± 1.3 (6.6 ± 1.4) |
| N4307 | Sb | 31.7 ± 0.3 | – | – | – | – | 10.3 ± 0.1 | 6.0 ± 0.8 (5.7 ± 0.9) |
| N4312 | SA(rs)ab | 30.2 ± 0.2 | – | – | 69.0 ± 10.4 | 5.4 ± 0.7 | 9.6 ± 0.1 | 4.1 ± 0.7 (3.6 ± 0.8) |
| N4313 | SA(rs)ab | 30.8 ± 0.4 | – | – | 63.0 ± 9.5 | 5.2 ± 0.8 | 10.0 ± 0.2 | 5.2 ± 0.8 (4.9 ± 0.9) |
| N4316 | Scd? | 32.2 ± 0.3 | – | – | – | – | 10.3 ± 0.1 | 5.9 ± 0.8 (5.6 ± 0.9) |
| N4321 | AB(s)bc | 31.0 ± 0.4 | 13.4 ± 3.6 (SDSS/g) | 7.3 ± 0.7 | 91.0 ± 13.7 | 6.1 ± 0.7 | 10.9 ± 0.2 | 7.6 ± 1.2 (7.7 ± 1.1) |
| N4330 | Scd | 31.4 ± 0.1 | – | – | – | – | 9.9 ± 0.1 | 4.8 ± 0.7 (4.4 ± 0.8) |
| N4343 | SA(rs)b | 32.1 ± 0.3 | – | – | – | – | 10.4 ± 0.1 | 6.1 ± 0.8 (6.0 ± 0.9) |
| N4356 | Scd | 31.7 ± 0.6 | – | – | – | – | 10.0 ± 0.3 | 5.1 ± 1.0 (4.7 ± 1.1) |
| N4380 | SA(rs)b | 31.4 ± 0.4 | 20.0 ± 7.0 (Spitzer/IRAC4) | 6.2 ± 1.2 | 85.0 ± 12.8 | 6.0 ± 0.7 | 10.3 ± 0.2 | 5.8 ± 0.8 (5.6 ± 0.9) |
| N4388a | SA(s)b | 31.4 ± 0.5 | 18.6 ± 2.6 (KPNO 2.3m/Ks) | 6.9 ± 0.1 | 99.0 ± 14.9 | 6.3 ± 0.7 | 10.5 ± 0.2 | 6.4 ± 0.9 (6.2 ± 1.0) |
| N4390 | SAB(s)c | 31.6 ± 1.0 | 21.7 ± 9.9 (CFHT/u) | 5.9 ± 1.7 | – | – | 9.5 ± 0.4 | 3.9 ± 1.3 (3.4 ± 1.5) |
| N4394 | SB(r)b | 31.2 ± 0.3 | 10.9 ± 6.7 (SDSS/g) | 7.7 ± 1.2 | 120.0 ± 18.0 | 6.8 ± 0.7 | 10.4 ± 0.2 | 6.2 ± 0.8 (6.0 ± 0.9) |
| N4396 | SAd | 30.7 ± 0.3 | – | – | – | – | 9.3 ± 0.1 | 3.2 ± 0.8 (2.6 ± 0.8) |
| N4402 | Sb | 30.8 ± 0.5 | – | – | – | – | 10.1 ± 0.2 | 5.3 ± 0.9 (5.0 ± 1.0) |
| N4405 | SA(rs)0/a | 31.2 ± 0.4 | – | – | – | – | 9.9 ± 0.2 | 4.8 ± 0.8 (4.4 ± 0.9) |
| N4411b | SAB(s)cd | 31.7 ± 0.8 | 23.4 ± 1.6 (CFHT/u) | 5.6 ± 0.4 | – | – | 9.7 ± 0.3 | 4.5 ± 1.1 (4.0 ± 1.2) |
| N4412 | SB(r)b | 32.8 ± 0.8 | 10.8 ± 3.9 (SDSS/u) | 7.7 ± 0.8 | – | – | 10.3 ± 0.3 | 6.0 ± 1.1 (5.8 ± 1.2) |
| N4413 | SB(rs)ab | 31.0 ± 0.2 | 29.8 ± 2.7 (GALEX/FUV & NUV) | 4.5 ± 0.6 | – | – | 9.6 ± 0.1 | 4.1 ± 0.7 (3.6 ± 0.8) |
| N4416 | SB(rs)cd | 33.1 ± 0.8 | 32.0 ± 9.7 (SDSS/u) | 4.1 ± 1.7 | – | – | 10.3 ± 0.3 | 5.9 ± 1.1 (5.7 ± 1.2) |
| N4419 | SB(s)a | 31.0 ± 0.5 | – | – | 102.0 ± 15.3 | 6.4 ± 0.7 | 10.4 ± 0.2 | 6.3 ± 0.9 (6.1 ± 1.0) |
| N4424 | SB(s)a | 30.6 ± 1.0 | 16.9 ± 2.4 (SDSS/r) | 6.7 ± 0.5 | 57.0 ± 8.6 | 5.0 ± 0.8 | 9.8 ± 0.4 | 4.6 ± 1.3 (4.2 ± 1.5) |
| N4429 | SA0(r) | 31.0 ± 0.6 | – | – | 173.0 ± 26.0 | 7.7 ± 0.6 | 10.8 ± 0.2 | 7.2 ± 1.1 (7.2 ± 1.1) |
| N4430 | SB(rs)b | 31.2 ± 0.9 | 20.1 ± 8.2 (SDSS/g) | 6.1 ± 1.4 | – | – | 9.9 ± 0.4 | 4.8 ± 1.2 (4.4 ± 1.4) |
| N4438 | SA(s)0/a | 30.2 ± 0.7 | – | – | 135.0 ± 20.2 | 7.1 ± 0.7 | 10.4 ± 0.3 | 6.3 ± 1.0 (6.1 ± 1.1) |
| N4445 | Sab | 31.2 ± 0.5 | – | – | – | – | 9.7 ± 0.2 | 4.3 ± 0.8 (3.8 ± 0.9) |
| N4450 | SA(s)ab | 30.8 ± 0.5 | 10.1 ± 2.4 (Spitzer/IRAC4) | 7.8 ± 0.5 | 132.0 ± 19.8 | 7.0 ± 0.7 | 10.7 ± 0.2 | 6.9 ± 1.0 (6.9 ± 1.0) |
| N4451 | Sbc | 32.0 ± 0.4 | – | – | – | – | 9.9 ± 0.2 | 5.0 ± 0.8 (4.6 ± 0.9) |
| N4457 | SAB(s)0/a | 30.3 ± 0.5 | – | – | 113.0 ± 17.0 | 6.7 ± 0.7 | 10.2 ± 0.2 | 5.6 ± 0.9 (5.3 ± 1.0) |
| N4469 | SB(s)0/a | 31.1 ± 0.8 | – | – | 106.0 ± 15.9 | 6.5 ± 0.7 | 10.4 ± 0.3 | 6.1 ± 1.1 (5.9 ± 1.2) |
| N4470 | Sa | 31.2 ± 0.7 | 29.2 ± 14.9 (SDSS/gri) | 4.6 ± 2.6 | 90.0 ± 13.5 | 6.1 ± 0.7 | 9.6 ± 0.3 | 4.1 ± 1.0 (3.6 ± 1.1) |
| N4480 | SAB(s)c | 33.0 ± 0.2 | 18.4 ± 0.9 (Spitzer/IRAC2) | 6.4 ± 0.3 | – | – | 10.4 ± 0.1 | 6.3 ± 0.8 (6.1 ± 0.8) |
| N4498 | SAB(s)d | 31.0 ± 0.5 | 22.2 ± 10.5 (GALEX/NUV) | 5.8 ± 1.8 | – | – | 9.7 ± 0.2 | 4.3 ± 0.8 (3.8 ± 0.9) |
| N4501a | SA(rs)b | 31.2 ± 0.5 | 12.2 ± 3.4 (GALEX/NUV) | 7.1 ± 0.8 | 166.0 ± 24.9 | 7.6 ± 0.6 | 11.1 ± 0.2 | 8.0 ± 1.6 (8.2 ± 1.4) |
| N4519 | SB(rs)d | 31.6 ± 0.8 | 23.9 ± 13.4 (GALEX/FUV) | 5.5 ± 2.3 | – | – | 9.9 ± 0.3 | 4.7 ± 1.1 (4.4 ± 1.2) |
| N4522 | SB(s)cd | 31.1 ± 0.5 | – | – | – | – | 9.7 ± 0.2 | 4.3 ± 0.9 (3.8 ± 1.0) |
| N4527 | SAB(s)bc | 30.7 ± 0.4 | 12.8 ± 3.1 (Spitzer/IRAC2) | 7.4 ± 0.6 | 135.0 ± 20.2 | 7.1 ± 0.7 | 10.6 ± 0.2 | 6.8 ± 0.9 (6.7 ± 1.0) |
| N4532 | IBm | 30.6 ± 0.5 | – | – | – | – | 9.6 ± 0.2 | 4.0 ± 0.9 (3.5 ± 1.0) |
| N4535 | SAB(s)c | 30.9 ± 0.5 | 21.9 ± 4.0 (Spitzer/IRAC2) | 5.8 ± 0.8 | 102.0 ± 15.3 | 6.4 ± 0.7 | 10.6 ± 0.2 | 6.7 ± 1.0 (6.6 ± 1.0) |
| N4536 | SAB(rs)bc | 30.9 ± 0.4 | 20.2 ± 2.3 (Spitzer/IRAC2) | 6.1 ± 0.5 | 111.0 ± 16.7 | 6.6 ± 0.7 | 10.4 ± 0.2 | 6.3 ± 0.9 (6.1 ± 0.9) |
| N4548 | SB(rs)b | 31.0 ± 0.3 | 14.6 ± 3.6 (SDSS/u) | 7.1 ± 0.7 | 122.0 ± 18.3 | 6.8 ± 0.7 | 10.7 ± 0.2 | 6.9 ± 0.9 (6.8 ± 0.9) |
| N4567 | SA(rs)bc | 31.8 ± 0.5 | 13.4 ± 1.4 (SDSS/g) | 7.3 ± 0.4 | 66.0 ± 9.9 | 5.3 ± 0.7 | 10.5 ± 0.2 | 6.4 ± 0.9 (6.3 ± 1.0) |
| N4568 | SA(rs)bc | 31.5 ± 0.6 | 21.7 ± 5.2 (Spitzer/IRAC1) | 5.9 ± 0.9 | 88.0 ± 13.2 | 6.0 ± 0.7 | 10.7 ± 0.2 | 7.0 ± 1.1 (7.0 ± 1.1) |
| N4569 | SAB(rs)ab | 30.4 ± 0.6 | 14.3 ± 6.8 (SDSS/g) | 7.1 ± 1.2 | 139.0 ± 20.9 | 7.2 ± 0.7 | 10.6 ± 0.2 | 6.8 ± 1.0 (6.7 ± 1.1) |
| N4571 | SA(r)d | 31.0 ± 0.3 | 11.2 ± 7.4 (HST/F555W) | 7.7 ± 1.3 | – | – | 10.1 ± 0.1 | 5.5 ± 0.8 (5.2 ± 0.8) |
| N4579 | SAB(rs)b | 31.3 ± 0.4 | 6.1 ± 3.9 (Spitzer/IRAC4) | 8.5 ± 0.8 | 166.0 ± 24.9 | 7.6 ± 0.6 | 11.1 ± 0.2 | 7.9 ± 1.4 (8.0 ± 1.3) |
| N4580 | SAB(rs)a | 31.4 ± 1.1 | 20.2 ± 6.2 (SDSS/griz) | 6.1 ± 1.1 | – | – | 10.1 ± 0.4 | 5.4 ± 1.3 (5.1 ± 1.5) |
| N4606 | SB(s)a | 31.0 ± 0.5 | – | – | – | – | 9.8 ± 0.2 | 4.5 ± 0.9 (4.0 ± 1.0) |
| N4607 | SBb? | 31.0 ± 0.9 | – | – | – | – | 9.7 ± 0.4 | 4.4 ± 1.2 (4.0 ± 1.3) |
| N4639 | SAB(rs)bc | 31.8 ± 0.2 | 17.5 ± 4.9 (SDSS/g) | 6.6 ± 0.9 | 91.0 ± 13.7 | 6.1 ± 0.7 | 10.3 ± 0.1 | 6.0 ± 0.8 (5.8 ± 0.8) |
| N4647 | SAB(rs)c | 31.2 ± 0.3 | 21.4 ± 2.6 (Spitzer/IRAC2) | 5.9 ± 0.5 | 49.0 ± 7.4 | 4.6 ± 0.8 | 10.2 ± 0.2 | 5.6 ± 0.8 (5.3 ± 0.9) |
| N4651 | SA(rs)c | 31.7 ± 0.8 | 14.3 ± 1.0 (CFHT/u) | 7.1 ± 0.4 | 101.0 ± 15.2 | 6.4 ± 0.7 | 10.6 ± 0.3 | 6.7 ± 1.1 (6.6 ± 1.3) |
| N4654 | SAB(rs)cd | 30.8 ± 0.5 | 25.5 ± 9.3 (Spitzer/IRAC3) | 5.2 ± 1.6 | 48.0 ± 7.2 | 4.6 ± 0.8 | 10.4 ± 0.2 | 6.1 ± 0.9 (5.9 ± 1.0) |
| N4689 | SA(rs)bc | 31.0 ± 0.4 | 24.1 ± 7.2 (Spitzer/IRAC2) | 5.4 ± 1.3 | 41.0 ± 6.2 | 4.2 ± 0.8 | 10.1 ± 0.2 | 5.5 ± 0.8 (5.2 ± 0.9) |
| N4698 | SA(s)ab | 31.6 ± 0.8 | – | – | 137.0 ± 20.6 | 7.1 ± 0.7 | 10.8 ± 0.3 | 7.1 ± 1.2 (7.1 ± 1.3) |
| N4713 | SAB(rs)d | 30.6 ± 0.8 | 35.4 ± 10.8 (HST F606W) | 3.5 ± 1.9 | 23.0 ± 3.5 | 2.8 ± 1.0 | 9.6 ± 0.3 | 4.0 ± 1.1 (3.5 ± 1.2) |
aDirectly measured black hole masses exist for these three galaxies (see Section 2). The galaxy and black hole masses in this table are in units of solar masses. The three sets of predicted black hole mass are based on: the spiral arm’s pitch angle ϕ using equation (2); the galaxy’s central velocity dispersion σ using equation (3); and the galaxy’s stellar mass M*,galaxy derived using equation (4) (and equation 5).
