


ABSTRACT
We consider active galactic nucleus (AGN) photoionization of gas in companion galaxies (cross-ionization) as a way to sample the intensity of AGN radiation in both direction and time, independent of the gas properties of the AGN host galaxies. From an initial set of 212 AGN+companion systems, identified with the help of Galaxy Zoo participants, we obtained long-slit optical spectra of 32 pairs that were a priori likely to show cross-ionization based on projected separation or angular extent of the companion. From emission-line ratios, 10 of these systems are candidates for cross-ionization, roughly the fraction expected if most AGNs have ionization cones with 70° opening angles. Among these, Was 49 remains the strongest nearby candidate. NGC 5278/9 and UGC 6081 are dual-AGN systems with tidal debris, complicating identification of cross-ionization. The two weak AGNs in the NGC 5278/9 system ionize gas filaments to a projected radius 14 kpc from each galaxy. In UGC 6081, an irregular high-ionization emission region encompasses both AGNs, extending more than 15 kpc from each. The observed AGN companion galaxies with and without signs of external AGN photoionization have similar distributions in estimated incident AGN flux, suggesting that geometry of escaping radiation or long-term variability controls this facet of the AGN environment. This parallels conclusions for luminous QSOs based on the proximity effect among Lyman α absorbers. In some galaxies, mismatch between spectroscopic classifications in the common BPT diagram and the intensity of weaker He ii and [Ne v] emission lines highlights the limits of common classifications in low-metallicity environments.
1 INTRODUCTION
Important aspects of active galactic nuclei (AGNs) can be studied through the properties of surrounding gas on scales up to kiloparsecs, providing information otherwise inaccessible due to the small size of the central regions or the time-scales involved. This is especially true for AGN with extended emission-line regions (EELRs), which span tens of kiloparsecs in radial distance and often occur over broad angular ranges about the central source (Stockton, Fu & Canalizo 2006). The frequent occurrence of (double) ionized clouds with triangular shapes (‘ionization cones’) was a key piece of evidence for some form of geometric unification involving Seyfert galaxies of types 1 and 2 (Antonucci 1993). Recently, the discovery of the 45-kpc cloud known as Hanny’s Voorwerp (Lintott et al. 2009; Schawinski et al 2010; Keel et al. 2012b; Schawinski et al 2015; Sartori et al. 2016) highlighted what had earlier been an abstract possibility: using EELRs to trace the history of radiation from AGN across the light-travel times to distant gas clouds. In this object, the gas is so highly ionized that it must be illuminated by a luminous quasar, 2 orders of magnitude brighter than the observed galaxy nucleus; a former quasar has faded dramatically within the ≈105-yr light-travel time between the central AGN and the cloud edge. A tailored search by Galaxy Zoo participants led to confirmation of 19 less luminous examples (Keel et al. 2012a), while later studies have identified analogous candidates for fading AGN detected via such ionization echoes at both lower and higher luminosity (Schirmer et al. 2013; Schweizer et al. 2013; Watkins et al. 2018).
The use of EELR gas to determine properties of the AGN is restricted by the distribution of the gas around the AGN host galaxy. The escape of radiation may suffer from biases due to both the relative orientations of the disc and AGN absorbing torus (whose axes are essentially uncorrelated; Schmitt et al. 2003) and to obscuration from dust in the galaxy disc; there must be distant gas in directions where the AGN radiation is not blocked by material in the host. Indeed, in Hanny’s Voorwerp and its fainter Galaxy Zoo analogues, the EELRs are part of tidal debris (Keel et al. 2015). In this study, we explore a kind of EELR that is not directly related to the AGN host - gas in companion galaxies. EELRs of this kind would not suffer the same biases in illumination, and would also not have the kind of radial density structure that might be found in gas associated with the AGN host itself; the distribution of gas in the companion would still control where it could be ionized, but now in a way not correlated with the AGN’s structure. These kinds of decoupling from the AGN host structure might allow more secure measurements of the angular pattern of escaping radiation, and its time history, than are possible from ionization of gas within the AGN host itself. While the details of triggering AGN by galaxy interactions remain contentious, many AGNs are certainly located in close (and often-interacting) galaxy pairs, so we can use companion galaxies as screens to view the emerging radiation from their active neighbors, which for convenience we will call cross-ionization.
The conditions needed for cross-ionization in galaxy pairs to occur were set out as early as Filippenko (1982), and have been briefly considered again in connection with growing interest in dual-AGN systems (Liu et al. 2011). In spectra with large apertures, cross-ionization could mimic a relatively low-luminosity AGN (as was noted by Liu et al. 2011), while ionized gas from a companion could generate velocity asymmetries in survey spectra of the kind studied by Comerford & Greene (2014). One of the best candidates, Was 49ab, was observed in detail by Moran et al. (1992), who discussed the possibility of cross-ionization.
Parallel scientific issues – lifetime of AGN luminous episodes and the solid angle over which ionizing radiation escapes – have been addressed for QSOs by seeking changes in the ionization level implied by absorption lines from dense parts of the intergalactic medium (IGM), above all the H i and He ii Lyman α forests (Furlanetto & Lidz 2011). A local source of hard radiation, above the mean background at a QSO’s redshift, decreases the strength of these absorption features within a radius depending on the local AGN flux. This has been measured as the proximity effect – originally in the spectrum of the QSOs themselves, with redshift mapping to distance in front of the AGN, and later in the transverse proximity effect (Adelberger 2004; Schirber et al. 2004; Gonçalves, Steidel & Pettini 2008; Kirkman & Tytler 2008), as the line of sight to the AGN observed passes close to a foreground AGN. Mismatch between these two kinds of proximity effect could result from episodic luminous AGN phases (Visbal & Croft 2008) or anisotropic escape of the ionizing radiation.
Our approach complements studies of both proximity effects; close companion galaxies can probe smaller separations and lower AGN luminosities than are feasible with the usually statistical nature of absorption-line studies. We rely on an analogous process: detection of ionization in excess of what sources other than the AGN can produce, in this case through changes in emission-line ratios as the AGN contribution becomes comparable to, or exceeds, that from star formation in a companion galaxy.
We have conducted an extensive search for AGN cross-ionization candidates. In Section 2 we describe our sample selection, with participation from Galaxy Zoo volunteers, the choice of observational priorities among these based on physical properties, narrowband imaging of a subset, and spectroscopic observations. In Section 3 we identify a set of candidates for cross-ionization between AGN and companion galaxies, as well as noting instances both of AGN potentially missed in the most common diagnostics due to low gas metallicity, and of close companions showing no influence by luminous AGN. Finally, we compare our subsets of AGN companions with and without spectroscopic evidence of cross-ionization. In quoting luminosities and sizes, we adopt |$\rm H_0= 70$| km s−1 Mpc−1 and flat geometry.
2 SAMPLE SELECTION AND OBSERVATIONS
2.1 Sample criteria
For detectable cross-ionization of the ISM in a companion galaxy, both the impinging intensity of ionizing radiation from the AGN and the chances of the companion intercepting the pattern of emerging radiation (i.e. ionization cones) are relevant. Our criteria are shown schematically in Fig. 1. Here, r is the projected distance from the AGN to the centre of the companion, and θ is the angle the companion subtends in projection around the AGN. These are largely independent criteria (although for constant galaxy size, larger θ occurs at small r), and we consider both in selecting the most promising targets. Galaxy size is not well-defined, particularly when images overlap so that standard photometric procedures may not separate galaxies properly; operationally we take the extent detected in composite images from the Sloan Digital Sky Survey (SDSS; Abazajian et al. 2009; Alam et al. 2015) for a consistent way to compare different systems. Examination of a variety of our systems shows that this extends to a projected distance from the nucleus roughly equal to the SDSS quantity petroR90_r, and about 1.3 times the Petrosian radius petroRad_r.
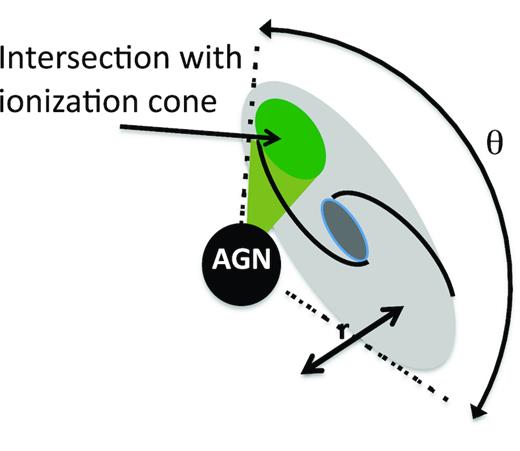
Schematic diagram of an AGN illuminating a large companion galaxy, showing the selection parameters r and θ. The projected separation r, combined with the AGN luminosity, predicts the strength of ionization expected at the companion, while its angular extent θ with respect to the AGN predicts the probability of ionization cones actually intersecting the companion galaxy. Both r and θ are subject to projection effects.
Observed ionization cones have projected full opening angles of typically 70° (Wilson 1996; Keel et al. 2012a), half-angle ≈35°. Ignoring projection effects that are poorly known for most objects, this implies that ionizing radiation emerges over a fraction (1 − cos 35° = 0.18) of the sky around a typical AGN, and suggests that we could expect roughly this fraction of companions to show cross-ionization if they are close enough for the incident AGN radiation to be suitably intense. This is a very crude estimate, since there is such a wide range of observed opening angles and projection factors will enter, but helps to guide our expectations.
Both r and θ are subject to projection effects due to the (essentially unknown) line-of-sight separation between the galaxy centres. Since there is no control over these factors in sample selection, we simply take the observed quantities. However, it may be of interest to estimate the expected projection factors for galaxy separation, and hence in ambient AGN flux predicted based on this separation, for companion galaxies. For this purpose, we carried out a simple Monte Carlo simulation based the slope ζ of the galaxy–galaxy correlation function slope (which is consistent across the separations of galaxy pairs and groups), using a cut in projected radius (whose value is arbitrary since the correlation function is a power law) to model the selection of a sample on projected separation. Using 104 Monte Carlo trials for pairs of points separating according to ζ ∝ r−1.6, the mean projection effect is poorly defined because of the long tail of widely separated galaxies, but the median projection factor between projected and physical radii is stable at 1.52 (decreasing the inferred intensity of incident AGN radiation by a factor of 2.3).
Ideally, we would seek companion galaxies with the rare combination of being rich in neutral gas to trace ionizing radiation, and poor in ongoing star formation that dilutes the emission lines of AGN-ionized gas. A selection on companion optical colours could eliminate ‘red and dead’ systems on the red sequence that are very gas-poor, but this could also, in principle, eliminate some galaxies with enough gas for observable line emission if they have low rates of star formation (or, for example, H i clouds on the periphery of quiescent galaxies).
When both galaxy redshifts are known, we can filter many line-of-sight projections from candidates for genuine companion galaxies. We required ∣Δcz∣ < 400 km s−1 to reject line-of-sight companions that are not physically associated; as it turned out, a smaller Δ|$v$| threshold would have given virtually the same selection. Among all pairs we observed spectroscopically, the median ∣Δcz∣ is 93 km s−1. All objects we observed with tidal disturbances have component redshifts matching within our selection threshold.
2.2 Sample construction
We compiled a finding list of AGNs with companion galaxies based on the redshift and geometric criteria in Section 2.1, largely through the efforts of volunteer participants in the Galaxy Zoo project (Lintott et al. 2008). A post on the project forum setting out the desired kinds of galaxy pairs led to responses beginning both from objects seen in the normal course of classification for Galaxy Zoo and from SQL queries of the SDSS photometric and spectroscopic catalogs.1 This initial query selected object pairs projected within 15 arcsec with both redshifts in SDSS DR8, where one had an AGN spectroscopic class and the other had a non-AGN galaxy spectroscopic class. The cut-off in projected separation corresponds to 17.5 kpc at the median sample redshift |$z$| = 0.060. To this we added additional pairs found by Galaxy Zoo volunteers that satisfied the same criteria except for not having both redshifts available from the SDSS, or fulfilling the linear separation criterion at lower redshifts. In some cases the missing redshift had been measured and was available from sources referenced in NED, and in others, tidal structure made physical association between the galaxies virtually certain (which was confirmed by our spectroscopy). Similarly, we also included nearby systems passing these tests, previously known outside the SDSS imaging region (i.e. Keel 1996 building on the catalogue by Lipovetsky, Neizvestny & Neizvestnaya 1988): NGC 2992, NGC 6786, Kaz 63, and Kaz 199.
This set of pairs was further refined by our inspection of spectra to confirm the clear presence of a spectroscopic AGN. We required a Seyfert nucleus; originally we started compiling LINER AGN as well, but as their inferred ionizing luminosities all fell below our threshold for observation, we ceased collecting them for this program. When only the AGN redshift is known, tidal distortion was taken as secondary evidence that two galaxies are physically associated. These factors led us to a finding list of 212 AGN/companion pairs (Appendix A), incorporating Galaxy Zoo forum postings between 2012 January 16 and 2014 March 15.
From this finding list of 212 AGN/companion pairs, we used large θ and small r as in Fig. 1 to prioritize them for spectroscopic observations. We estimate the ionizing luminosity based on the nuclear [O iii] flux. We use [O iii] rather than Hα or Hβ, since the broad-line components can suffer obscuration in at least some Sy 2 nuclei; the [O iii] luminosity is a nearly isotropic luminosity indicator based on its relation to mid- and far-IR selection (e.g. Keel et al. 1994). The [O iii] fluxes are taken mainly from the SDSS spectra, augmented where necessary by published data from other sources. We used these values only in a relative sense here, for ranking priorities; a conversion to absolute values is needed to predict individual values and ask what threshold in ionizing flux should lead to observable ionization consequences. For this, we used the conversion between [O iii] and bolometric luminosity from Heckman et al. (2004), namely a ratio of 3500 between bolometric and observed [O iii] output, and the mean radio-quiet spectral energy distribution (SED) from the QED project (Elvis et al. 1994), where the ionizing luminosity is about 0.14 of the bolometric value. These give predictions of the incident ionizing flux Fion on companion galaxies from the AGN [O iii] flux and companion geometry, which can suggest likely ionization parameters for a particular ISM density. This estimate applies to the projected location of the companion nucleus; in some systems the range between near and far sides of a companion disc is very large. The diffuse phase of the ISM is important here; at its typically low density, relatively few AGN photons will suffice to shift its ionization balance, in contrast to H ii regions with higher densities of both particles and stellar ionizing photons. The contributions of these phases differ considerably among galaxies. For this reason, we use the expected ionizing flux from AGN at companion locations only as a relative guide to prioritize our observations.
For each spectroscopic observing session, we selected accessible pairs with either the highest predicted ionizing flux at the companion, or close pairs with the largest projected angle θ spanned by the companion (translated to expected solid angle spanned by the companion as seen from the AGN). Selection for highest incident ionizing flux will restrict this study to luminous AGN in galaxy pairs; these will be a small subset, given evidence that AGN in dense environments (including close pairs) are predominantly of low luminosity (Martínez et al. 2010; Bitsakis et al. 2015), with additional differences between interacting pairs and dense compact groups (Sabater, Best & Argudo-Fernández 2013). Furthermore, AGNs that remain at low luminosity for long periods are unlikely to be able to produce radiatively driven outflows that could contribute to extended emission (Elitzur & Shlosman 2006).
When the companion spectrum is available (from SDSS or other sources as listed by NED), we omitted those with strong line emission from star formation, since weaker contributions from AGN-ionized gas become progressively more difficult to distinguish in composite systems. Previous dual-AGN candidates were retained in our list, since some of these may be instances of cross-ionization where the nucleus and surrounding ISM are blended in the SDSS spectrum (Liu et al. 2011). We note in discussing individual candidates below where a second AGN is clearly present, and how its luminosity affects the likelihood of cross-ionization from the brighter AGN.
Mkn 177 and its close, compact companion object fit our selection criteria, but Koss et al. (2014) find no resolved line emission around the putative AGN, whose long-term variability suggests that it may instead be a very luminous, unusual variable star, or more speculatively, an ejected supermassive black hole leaving the site of interaction.
2.3 Observations: long-slit spectra
Cross-ionization should give spectroscopic signatures such as extended ionized gas with AGN-like line ratios across the companion, and ionization behaviour not symmetric about the companion nucleus. We have carried out a spectroscopic study of candidate AGN in galaxy pairs to isolate a subset with these features.
We obtained spectra of 32 candidate pairs, some multiple times for confirmation or at different position angles, using the Kast double spectrograph (Miller & Stone 1992) at the 3-m Shane telescope of Lick Observatory during 13 nights from 2013 to 2015. For each session, the D46 dichroic beamsplitter separated light into blue and red optical paths, with a nominal split centred at 4600 Å. The wavelength settings were roughly 3400–4600 Å in the blue side and 4600–7400 Å on the red side. The slit width was 2.0 arcsec. Flux calibration used observations of 1–3 standard stars per night. Clouds prohibited observing standards on 2015 April 23, so we used the response curve derived for April 26, and scaled line fluxes in the case of SDSS 1354+1327 to match earlier data where the slits crossed at the nucleus. Observations on each night are listed in Table 1, and descriptions of the spectral characteristics of spatially resolved, extended line emission are given in Table 2. The initial slit orientation crossed both galaxy nuclei, unless SDSS images suggested strong off-nuclear line emission (in tidal tails) via unusual gri colours, with further slit orientations in some cases when suggested by system structure or results of a first observation. The data-reduction pathway includes bias subtraction, flat-field correction, resampling to linear wavelength scales, sky subtraction, and flux calibration using nightly standard-star data; these were done using tasks from the iraf (Tody 1986) twodspec package.
Spectroscopic observations.
| UT Date | Galaxies observed |
|---|---|
| 2013 Jan 15 | 0057+0120,0848+3515 |
| 2013 Jan 16 | 0029+0010,0848+3515, 1214+2931 |
| 2013 Jan 17 | 0029+0010 compn,0757+3511,0848+3515,1200+147 |
| 2013 Jan 18 | 0057+0120,0841+0101,0905+3237,1010+0612,1352+2528 |
| 2013 Mar 10 | 0838+0407,0847+3445,0904+5536,1138+1412,1201-0153,1303-0306,1354+1327 |
| 2013 Mar 11 | 0904+5536,1213+5138,1243+3738,1342+1839,1347+1734,1354+1327 |
| 2013 Mar 12 | 1050+2329,1219+1326, 1414-0000 |
| 2013 Mar 13 | 1042+0502,1101+1017,1132+5257,1142+3251, Kaz 199 |
| 2014 Feb 4 | 0839+4707, UGC 6081, NGC 5279 |
| 2014 Feb 5 | 0838+0407, UGC 6081,NGC 5279 |
| 2015 April 23 | 0848+3515, 1354+1327, NGC 3341, Was 49, NGC 5279 |
| 2015 April 24 | NGC 3341, 1354+1327 |
| 2015 April 26 | 1201-0153, NGC 3341, NGC 5279, UGC 6081, Was 49 |
Spectroscopic summary.
| AGNs | Type | |$z$| | PA° | Description |
|---|---|---|---|---|
| Candidate cross-ionization systems | ||||
| SDSS J002944.89+001011.1 | Sy 2 | 0.0598 | 49 | Line emission extended across pair. Compn [O iii]/Hβ drops to ≈ 2.5 (UM 246) |
| SDSS J005754.03+012013.8 | Sy 2 | 0.0567 | 168 | UM 293. Extended high-ionization emission from AGN to companion |
| SDSS J083902.96+470756.3 | Sy 2 | 0.0524 | 56 | Extended high-ionization emission |
| SDSS J084810.11+351534.3 | Sy 2 | 0.0573 | 72, 107 | KUG 0845+354. 2nd Sy 2 or cross-ionization, AGN line ratios across extended region |
| SDSS J104232.05+050241.9 | Sy 2 | 0.0272 | 98, 212 | NGC 3341. Extended emission into companion |
| SDSS J110019.10+100250.7 | Sy 2 | 0.0361 | 133, 134 | UGC 6081; 2 AGNs, AGN-ionized cloud |
| SDSS J120149.74-015327.5 | Sy 1 | 0.0907 | 139,142 | AGN is Sy 1.9, ionized tail opposite star-forming companion |
| SDSS J121418.25+293146.7 | Sy 2 | 0.0632 | 60, 147 | Was 49; 2nd AGN or cross-ionization |
| SDSS J134143.75+554025.5 | Sy 2 | 0.0251 | 98 | NGC 5278/9; 2 AGNs, high [O iii]/Hβ, He ii in filaments |
| SDSS J135429.05+132757.2 | Sy 2 | 0.0633 | 84, 186, 194 | Both galaxies have similar line ratios; [O iii] in tail opposite companion |
| Other systems: | ||||
| SDSS J075729.04+351105.9 | Sy 2 | 0.1117 | 99 | Double spatial/spectral line profiles |
| SDSS J080004.05+232616.2 | Sy 2 | 0.0292 | 118 | Velocity structure in small emission region around AGN |
| SDSS J083848.14+040734.0 | Sy 2 | 0.0476 | 96 | AGN emission extended 5 arcsec toward H ii compn |
| SDSS J084135.08+010156.2 | Sy 2 | 0.1106 | 48 | Two AGN, extended [O iii] beyond each |
| SDSS J084742.44+344504.4 | QSO | 0.0640 | 20 | PG 0844+349. Companion has resolved rotation curve, lacks [O iii] |
| SDSS J090436.92+553602.9 | Sy 1 | 0.0372 | 7 | Emission around AGN extended by 15 arcsec more toward absorption-ine companion |
| SDSS J101043.36+061201.4 | Sy 1 | 0.0978 | 58 | [O iii] resolved over 8 arcsec. Weak emission in companion, no [O iii] |
| SDSS J105030.47+232931.4 | Sy 1.8 | 0.0604 | 117 | AGN unresolved. Star-forming companion |
| SDSS J110157.90+101739.3 | Sy 1.5 | 0.0341 | 138 | Extended rotation curve over 29 arcsec star-forming line ratios |
| SDSS J113240.25+525701.3 | Sy 2 | 0.0266 | 75 | Mkn 176. AGN emission extended to 6 arcsec opposite from 2 companions |
| SDSS J113858.89+141253.2 | Sy 2 | 0.0805 | 10 | Companion has resolved line emission, star-forming ratios |
| SDSS J114252.83+325124.2 | Sy 2 | 0.0666 | 165 | Companion has extended emission, star-forming ratios |
| SDSS J120041.39+314746.2 | Sy 2 | 0.1159 | 33 | AGN emission spans 14 arcsec blends w/companion |
| SDSS J121303.34+513854.9 | Sy 2 | 0.0849 | 118 | AGN unresolved. Star-forming companion emission resolved |
| SDSS J121943.13+132659.9 | Sy 2 | 0.0647 | 50 | AGN em unresolved, companion has [N ii] and Balmer absorption |
| SDSS J124322.55+373858.0 | Sy 2 | 0.0859 | 120 | LINER-like AGN em to 8 arcsec opposite star-forming companion |
| SDSS J130354.71-030631.8 | Sy 2 | 0.0778 | 166 | AGN emission not well resolved |
| SDSS J134203.48+183901.5 | Sy 1.8 | 0.0845 | 102 | AGN em (low-ion NLR) to 8 arcsec opposite star-forming companion |
| SDSS J134736.39+173404.6 | Sy 2 | 0.0447 | 108 | AGN-ionized knot at 18 arcsec opposite star-forming companion |
| SDSS J135255.67+252859.6 | Sy 1.5 | 0.0636 | 176 | Strong lines like starbursts, but He ii/Hβ ≈ 0.2 and broad Hα |
| SDSS J141447.15-000013.1 | Sy 2 | 0.0475 | 65 | Sy 2 plus transition nucleus w/[O iii]/Hα ≈ 2. Emission unresolved |
| Kaz 199 | — | 0.0155 | 5, 54 | NGC 6636. [O i]/Hα ≈ 0.03, may not be AGN |
The NGC 5278/9 system was also observed on 2018 February 10 in the long-slit mode of the SCORPIO-2 multimode focal reducer (Afanasiev & Moiseev 2011) at the prime focus of the 6-m telescope (BTA) of the Special Astrophysical Observatory, Russian Academy of Sciences. The slit width was 1 arcsec, and the spectral coverage was about 3500–7200 Å with a typical resolution ∼5 Å . Slit positions and orientations were selected to include some of the near-radial emission-line features outside the galaxy discs, through NGC 5278 at PA 100° and NGC 5279 at PA 91°. Each slit position was observed for 3600 s. After standard reduction, the BTA spectra were flux-calibrated using a standard star observed on the same night. These data were obtained using 1 × 2-pixel binning during readout, for a scale of 0.356 arcsec per pixel along the slit, which we summed by a further factor of 3 to get sets of line measures every 1|${^{\prime\prime}_{.}}$|07 along the slit. This provides enough surface-brightness sensitivity to detect He ii λ4686 emission in some of the extended features at levels indicating AGN photoionization, independent of issues with the stronger line ratios at low metallicity.
We estimate errors on the emission-line ratios measured in our spectra using the same Gaussian-fitting procedure as used to derive their radial velocity and fluxes, the deblending option in the IRAF routine splot. This was done by adding an emission-line position at an arbitrary wavelength where no line is expected, in the red and blue regions, and adopting the flux statistics of the resulting fictitious lines as the error distribution. We examined the behaviour of this error distribution with local flux, finding no significant trend (i.e. the effects of Poisson noise from the galaxy continuum are weak) in the Lick spectra. The deeper BTA spectra do show an error increasing with line flux, so we include this factor for the BTA spectra. These estimated errors are propagated into the emission-line ratios used to infer ionizing mechanisms.
To assess the dominant ionizing mechanism in our spectra, we rely on the approach pioneered by Baldwin, Phillips & Terlevich (1981), widely known as BPT diagrams. In particular, star-forming objects and AGNs are generally well separated in a diagram comparing the ratios of strong emission lines [O iii] λ5007/Hβ and [N ii] λ6583/Hα. Specifically, we use the updated boundaries specified by Kewley et al. (2006). This single diagram, while relying on the spectral lines most easily detected in the optical, can become ambiguous at low metal abundances (as in some of the EELRs examined by Keel et al. 2012a). He ii or [Ne v], when seen over large areas, are virtually certain indicators of photoionization by AGN radiation, but our data are only rarely sensitive enough to reveal these in the outskirts of the galaxies. Further, the wavelength range around He ii λ4686 at redshifts |$z$| = 0.02−0.04 (typical of the bright objects in this sample) is compromised by a night-sky emission line in spectra from Lick Observatory.
Of the 32 systems we observed, 10 show evidence of extended AGN-ionized gas in companion galaxies or tidal tails. The long-slit results for the 10 objects with possible AGN ionization in the companion galaxies (or tidal tails) are presented in Fig. 2. Spectral properties were evaluated using Gaussian fits to 2-pixel (1|${^{\prime\prime}_{.}}$|5 for Lick data) or 3-pixel (1|${^{\prime\prime}_{.}}$|07 for BTA data) sums along the slit. The top panels show the slit locations in these systems superimposed on composite SDSS gri images. The middle panel for each spectrum shows the redshift behaviour (heliocentric cz) along the slit as well as intensity slices in [O iii], Hα, and their adjacent continuum regions. The bottom panels show the strong-line BPT diagram with the star-forming/AGN boundary from Kewley et al. 2006; the colours of points match between the velocity plots and BPT diagrams to show where the AGN-ionized regions occur along the slit. The effects of underlying stellar absorption drive us to estimate Hβ from Hα, since the absorption correction is both smaller and less variable with stellar population for Hα. The greater strength of Hα further reduces this effect, and the equivalent widths are small enough in many instances to make the uncertain absorption correction relatively large in spectra with insufficient signal-to-noise to model the local stellar populations. We therefore estimate the flux of Hβ from that of (narrow-line components of) Hα and a Balmer decrement of 2.85. A key virtue of the BPT diagram is that it is almost completely reddening-independent. However, using Hα data to estimate Hβ, as we do, introduces a reddening dependence, in the sense that [O iii]/Hβ will be underestimated in reddened systems, since the standard Balmer decrement will lead to an overestimate of the Hβ flux. We can tolerate this effect, since in all parts of the strong-line BPT diagram, reddening correction will move data points further into the AGN region. This approach is thus conservative with regard to identifying AGN-photonized regions.
![Results of long-slit spectroscopy of candidate AGN cross-ionization systems. For each object, the top panel shows the slit position on an SDSS DR12 gri composite image spanning 100 × 100 arcsec. The middle panel shows the heliocentric radial-velocity profile along the slit, with error bars based on agreement among multiple lines measured at each position, and colour coding of points to indicate position. Below the velocity profiles are intensity traces of Hα (black) and [O iii] (green, full lines), with the adjacent continuum (dashed in matching colour) for each, on arbitrary linear vertical scales, to show the alignment between intensity and velocity features. The bottom panels show the strong-line BPT classification diagram with the starburst/AGN dividing curve from Kewley et al. (2006); point colors here show where along the slit AGN-ionized regions occur in comparison with the middle panels. The Hβ flux was estimated from Hα and an intrinsic Balmer decrement 2.85; additional reddening correction would move data points upward and toward (or further into) the AGN-ionized region above the curves. Regions appear in this panel only if Hα, [O iii] and [N ii] are all detected.](https://oup.silverchair-cdn.com/oup/backfile/Content_public/Journal/mnras/483/4/10.1093_mnras_sty3332/1/m_sty3332fig2a.jpeg?Expires=1750426165&Signature=Pa5X7JMogInSZqH6tNFmiSxv7g0IN6onxpYbcHoDHW6-~9ZpaGTW3z1Pxvjg56C9tPPtJIj45Ee4FPgLB0nuYtr8eGHSDVpI5vbuMM~rssKMOqcRdwP9kv~eBo1YTpfIcUknDhZL992e5Kawarm1DNrl5RrqW6ku7IHz-s1ADlqhH3G7sZ-RuqFxE5pkzCL4tZgGnPnD~qIaM0BKe5FGNbNNrGpCDA3~OGrivmcUvcaoNzcHxL9zaNFumAPR3Sl3fDucnQM2TZLl3tuPyytdFxeY2muhAcq7o7-kSlndSQvgyN08DC2iTF2Tgdei8mG4xD~HkZrTNdNfzXJuiZCM~Q__&Key-Pair-Id=APKAIE5G5CRDK6RD3PGA)
![Results of long-slit spectroscopy of candidate AGN cross-ionization systems. For each object, the top panel shows the slit position on an SDSS DR12 gri composite image spanning 100 × 100 arcsec. The middle panel shows the heliocentric radial-velocity profile along the slit, with error bars based on agreement among multiple lines measured at each position, and colour coding of points to indicate position. Below the velocity profiles are intensity traces of Hα (black) and [O iii] (green, full lines), with the adjacent continuum (dashed in matching colour) for each, on arbitrary linear vertical scales, to show the alignment between intensity and velocity features. The bottom panels show the strong-line BPT classification diagram with the starburst/AGN dividing curve from Kewley et al. (2006); point colors here show where along the slit AGN-ionized regions occur in comparison with the middle panels. The Hβ flux was estimated from Hα and an intrinsic Balmer decrement 2.85; additional reddening correction would move data points upward and toward (or further into) the AGN-ionized region above the curves. Regions appear in this panel only if Hα, [O iii] and [N ii] are all detected.](https://oup.silverchair-cdn.com/oup/backfile/Content_public/Journal/mnras/483/4/10.1093_mnras_sty3332/1/m_sty3332fig2b.jpeg?Expires=1750426165&Signature=fpQmAknEhRx82~bVQXNcPLR8EFyt5SsyhM7PqP2dywb-rq13o6hrLzXBfLtFCbij7oPYyfRcq5oxfs1IqnH1sPJNpnrbPBaOAOF-x6wxw6N2tch31hLqhP9CzGvouh4Mk~rVc~g3q0iQYYTCXjUOKp5TpnDvIoXCKgqoIO1Zj5wieytuwcc8M2RQFi03-5y0kVWUryMCQbRxlZD6Ty~PJZ1rLobVd1SLr7DQ97PGr4tAkSnOfhkBCKYRbpby~T7J5lMeEcj72q2RmnrT-9-HRFbbHZQg2ndHtd1fhuJ8riJObbaYVVzYgseQhFbGtsLDGYF7qsiH5lW91eQMPDaenQ__&Key-Pair-Id=APKAIE5G5CRDK6RD3PGA)
Results of long-slit spectroscopy of candidate AGN cross-ionization systems. For each object, the top panel shows the slit position on an SDSS DR12 gri composite image spanning 100 × 100 arcsec. The middle panel shows the heliocentric radial-velocity profile along the slit, with error bars based on agreement among multiple lines measured at each position, and colour coding of points to indicate position. Below the velocity profiles are intensity traces of Hα (black) and [O iii] (green, full lines), with the adjacent continuum (dashed in matching colour) for each, on arbitrary linear vertical scales, to show the alignment between intensity and velocity features. The bottom panels show the strong-line BPT classification diagram with the starburst/AGN dividing curve from Kewley et al. (2006); point colors here show where along the slit AGN-ionized regions occur in comparison with the middle panels. The Hβ flux was estimated from Hα and an intrinsic Balmer decrement 2.85; additional reddening correction would move data points upward and toward (or further into) the AGN-ionized region above the curves. Regions appear in this panel only if Hα, [O iii] and [N ii] are all detected.
The strong-line BPT diagrams, while allowing examination of the most extensive areas, may be misleading when low-metallicity gas is involved, such as is encountered in tidal debris and the outer discs of spirals (Groves, Heckman & Kauffmann 2006; Kawasaki et al. 2017). AGN photoionization models with varying abundances (oxygen and nitrogen having the strongest signatures) show that nitrogen abundances below solar can move AGN-ionized gas into parts of the usual BPT diagrams occupied by star-forming regions (Storchi-Bergmann et al. 1998; Castro et al. 2017); in particular, [N ii] and [S ii] weaken at fixed [O iii]/Hβ. So, while AGN-ionized gas may be securely identified if its strong-line ratios place it in the ‘AGN’ region of the BPT diagrams, lower-metallicity counterparts may require additional information for secure classification. Significant He ii or [Ne v] emission can play such a role, but these lines are comparatively weak in AGN narrow-line regions, and would not be detected outside the nuclei in most of our Lick spectra. The [O i] λ6300 line is detected in some of our spectra and can help resolve this ambiguity, since this line is very weak in normal H ii regions.
An additional ionizing process – shocks – is found to be important around the jets and in high-velocity outflows of AGN, particularly radio-loud AGN. Recognizing their role has proven to be subtle from only the strong optical emission lines. When the Baldwin et al. (1981) classification was initially formulated, what became known as LINERs were broadly identified as shock-ionized. As additional data have accumulated, showing that some LINERs are indeed photoionized by AGN (at lower ionization parameters than Seyfert nuclei) while others represent shocked gas in merging systems, and still others are photoionized by hot evolved stars (Stasińska et al. 2008; Johansson et al. 2016), integrated strong-line ratios by themselves are seen to give little discrimination on this question. Weaker lines, especially [O iii] λ4363 and [O i] λ6300, provide more diagnostic power (but are not uniformly detected in the extended clouds in our data). On the broader question of separating LINERs from Seyfert nuclei, Kewley et al. (2006) find that either [S ii]/Hα or [O i]/Hα gives more consistent results than [N ii]/Hα when compared to [O iii]/Hβ (the ‘standard’ strong-line diagram). However, especially at lower metallicity, these more diagnostic lines become weak and their use becomes less powerful. Pending data of higher signal-to-noise ratio, we note that important shock contributions around AGNs are largely associated with radio-loud objects, which are relatively rare both in the overall AGN population and in our sample.
In addition to line ratios, one might often (although not always) expect kinematic disturbances or broad lines where shock ionization is important. In the extended emission regions in our sample, we do not see any lines with the typical FWHM > 300 km s−1 or velocity jumps of similar amplitude that are comparable to the shock velocities needed to give the observed excitation level in [O iii]/Hβ.
2.4 Observations: narrowband imaging
Our spectroscopy is supplemented by narrowband imaging for eight systems, summarized in Table 3. For seven of the objects with the highest priority for spectroscopic observations in the redshift range |$z$| = 0.008−0.027, where [O iii] falls in the band of an available filter, we obtained images in redshifted [O iii] and the V-band continuum using the SARA 1-m remote telescope at Kitt Peak, Arizona, and the 1-m Jacobus Kapteyn telescope at La Palma, now operated by SARA (Keel et al. 2017a). Narrowband exposures in a filter of 100-Å FWHM were 1–2 h total, with 15–30 min in V. Among these, we recover the well-known ionization cones in NGC 2992 (Wehrle & Morris 1988; Allen et al. 1999; Veilleux, Shopbell & Miller 2001) perpendicular to its disc plane (but not oriented toward either its tidal tail or companion). We find only nuclear emission from Mkn 176. NGC 3786/8 and UGC 3995 A/B show [O iii] emission only from the nuclei and knots in the spiral arms, as is typical for spirals. On this basis, we did not obtain new long-slit spectroscopy of Mkn 176, NGC 2992, NGC 3788, or UGC 3995.
Narrowband imaging.
| Object | |$z$| | Bands | Exposure [min] | Telescope | UT date |
|---|---|---|---|---|---|
| Kaz 199 | 0.0155 | V/510 | 20/30 | SARA-KP | 2012 Feb 25 |
| Kaz 199 | 0.0155 | V/514 | 10/30 | KPNO 2.1m | 2013 Apr 13 |
| Kaz 199 | 0.0155 | R/6653 | 10/45 | KPNO 2.1m | 2012 May 29 |
| Mkn 176 | 0.0274 | V/510 | 20/60 | SARA-KP | 2013 Mar 12 |
| NGC 2992 | 0.0077 | V/510 | 15/120 | SARA-KP | 2013 Feb 2 |
| NGC 3341 | 0.0273 | V/510 | 30/120 | SARA-KP | 2013 Feb 2 |
| NGC 3341 | 0.0273 | V/510 | 20/60 | SARA-KP | 2014 Dec 29 |
| NGC 3341 | 0.0273 | B/V | 30/30 | SARA-JKT | 2017 Feb 4 |
| NGC 3786 | 0.0089 | V/510 | 20/60 | SARA-KP | 2013 Apr 4 |
| NGC 5278/9 | 0.0251 | 6000/6693 | 10/20 | KPNO 2.1m | 1985 May 18 |
| NGC 5278/9 | 0.0251 | V/510 | 10/60 | SARA-KP | 2015 Mar 27 |
| UGC 3995 | 0.0158 | V/510 | 20/60 | SARA-KP | 2013 Dec 31 |
| UGC 6081 | 0.0361 | Hα/continuum | 33/33 | CMO 2.5m | 2018 Apr 16 |
| UGC 6081 | 0.0361 | [O iii]/continuum | 33/33 | SAI 2.5m | 2018 Apr 16 |
NGC 3341 shows a potential morphological signature of cross-ionization. The AGN here is in a small galaxy projected against the disc of a much larger spiral. In [O iii], there is a triangular region of emission crossing the large disc at a skew angle with its apex at the AGN (Fig. 3), which we tentatively interpret as an ionization cone of gas in the large galaxy. The slit location for spectroscopy was selected to sample this region, rather than crossing the nucleus of the large companion galaxy.
![[O iii] structure (linearly spaced contours) superimposed on the matched-resolution V-band continuum of NGC 3341, with a higher-resolution V image from the JKT also shown for comparison of the inner structure. The Seyfert nucleus in this system is in the small companion galaxy to the east (indicated by tick marks in the right-hand panel); the [O iii] structure may represent an ionization cone composed of material mainly in the disc of the large galaxy. Stellar residuals result from colour differences between foreground stars and the galaxies; two bright-star charge trails are seen on the southern side. The area shown is 167 × 201 arcsec, with north at the top. The intensity mapping in V uses a logarithmic scale offset from zero to avoid amplifying noise around the sky level.](https://oup.silverchair-cdn.com/oup/backfile/Content_public/Journal/mnras/483/4/10.1093_mnras_sty3332/1/m_sty3332fig3.jpeg?Expires=1750426165&Signature=fiBJTDa11QYtXIZ2n0~s1sQv9iXFVlXn77oc1vpc7lDgRgiX1qVsRGH89W8u~T91l6Vr0TtD~z4UW-3I5rXpfAvHg66wa6B4MWLazRyClXPZMR0JFP5lf3RJ5aT1XIu8JW5nWFHDI6z1rwXRHzvY9x3WRjuqiUZ0WPr5cCSgzT0hZyFVhX7YLVUqHhkyy3R4Nw9XFWLFk6V1eLYzrqZCXlLcDvVfeqhLU5RUekNmEpTlgCK~CUf1XvqVcvQ1XMye45OpJotccXznlvECyqkR4IO5WIoUkBJBdZ1QAsjjQnz4x~iLBjQQsDZhITxt-8B43-axAwR3f4xfjr-qUuyFiA__&Key-Pair-Id=APKAIE5G5CRDK6RD3PGA)
[O iii] structure (linearly spaced contours) superimposed on the matched-resolution V-band continuum of NGC 3341, with a higher-resolution V image from the JKT also shown for comparison of the inner structure. The Seyfert nucleus in this system is in the small companion galaxy to the east (indicated by tick marks in the right-hand panel); the [O iii] structure may represent an ionization cone composed of material mainly in the disc of the large galaxy. Stellar residuals result from colour differences between foreground stars and the galaxies; two bright-star charge trails are seen on the southern side. The area shown is 167 × 201 arcsec, with north at the top. The intensity mapping in V uses a logarithmic scale offset from zero to avoid amplifying noise around the sky level.
Motivated by extended [O iii] structure in our SARA images of Kaz 199, we obtained more detailed images with the KPNO 2.1-m telescope. [O iii] was isolated with a filter of 174 Å FWHM centred at 5142 Å and Hα with a filter of 68 Å FWHM centred at 6653. V and R were used for continuum subtraction.
For NGC 5278/9, we also analyse the Hα and continuum images from the KPNO 2.1-m telescope described by Kennicutt et al. (1987), which guided our slit placement on noting that this pair was included in the AGN/companion sample. Our spectroscopic data, designed to encompass three of these near-radial filaments, help interpret the nature of the emission filaments mentioned by Keel et al. (1989). Additional images in [O iii] were obtained with the SARA system.
Emission-line mapping of UGC 6081 was carried out on 2018 April 16 at the 2.5-m telescope of the Sternberg Astronomical Institute (SAI) of the Caucasus Mountain Observatory (CMO) on Mt. Shatdzhatmaz (Kornilov et al. 2014) with the Mapper of Narrow Galaxy Lines (MaNGaL). MaNGaL (Moiseev & Perepelitsyn, in preparation) is a tunable–filter imager based on a scanning Fabry-Perot interferometer with low interference order.2 The peak of filter transmission (FWHM≈15Å) was centred on the wavelength corresponding to the redshifted [OIII]λ5007 and Hα emission lines. Continuum images were consecutively exposed at wavelengths shifted by ∼50 Å and subtracted to produce net emission-line images.
For galaxies or regions with large enough equivalent width in the [O iii] lines, we can produce [O iii] images from linear combinations of the SDSS survey images (as shown by Keel et al. 2012a, and addressed systematically by Sun et al. 2018). We do this for Was 49 (Fig. 5), revealing extensions from the AGN in opposite directions, possibly including gas in the large companion disc.
3 CROSS-IONIZATION (AND MISSING-IONIZATION) CANDIDATE SYSTEMS
Several of the systems in Table 2 show evidence of cross-ionization. Others show no such evidence despite high a priori odds of seeing it from the system properties. We discuss some of their individual properties here.
SDSS 0029+00 (UM 246): A second spectrum of the companion galaxy to the south shows a potential AGN signature on the northern side of its disc. The spectrum crossing the AGN itself shown in Fig. 2 includes tidal arms, whose emission-line ratios indicate a dominant role for local star formation.
SDSS 0057+01 (UM 293): AGN-ionized line ratios extend over most of the region sampled in both galaxies. The outermost parts at both ends of the slit are kinematically distinct from the rotational signature of the AGN host itself.
SDSS 0839+47: Our spectrum across the AGN host shows that the AGN ionizes gas across the galaxy, with increasing ionization in the outer parts. The SDSS spectrum of the companion galaxy shows line ratios indicating star formation, albeit with [O i] rather strong at about 0.07 × Hα, broadly consistent with mixed ionization sources. This system was flagged by Comerford & Greene (2014) for showing velocity asymmetries in both Balmer and forbidden emission lines.
SDSS 1201+01: The companion galaxy shows line ratios indicating ionization by hot stars. Gas in the tidal tail on the opposite side of the Sy 1.9 AGN is photoionized by the AGN.
UGC 6081: This pair has two heavily reddened Sy 2 nuclei and shows AGN ionization along an extent of 58 arcsec (41 kpc). The extended emission might fall in the same category of radial extent >10 kpc as the ‘Voorwerpjes’ (Keel et al. 2012a), depending on which of the AGN lights it up. We do not have the three-dimensional information to tell which is responsible (if indeed one dominates in the tidal debris seen at large radii). We do have the information for a rough ionization-balance calculation as done above for NGC 5278/9. These nuclei are more luminous and much more heavily reddened than in NGC 5278/9; applying a single foreground-screen reddening correction based on the nuclear Balmer decrements suggests that the NW AGN, in the smaller galaxy (UGC 6081 NED01), is twice as luminous in [O iii]. Our estimates (Table 4, listing dereddened values in this system) show that the energy balance makes it plausible for the SE AGN (in UGC 6081 NED02) to power the most distant gas we observe spectroscopically along the slit to its southeast, although whether this works in detail depends critically on the fine structure of the gas (since the peak surface brightness we observe places the strongest limits on the incident flux, and is strongly dependent on image quality). Much of the reddening toward each nucleus may take place close to our line of sight rather than as surrounding ‘cocoons’ covering large solid angles; the WISE data suggest that in neither one does the MIR component of the SED dominate over ionizing radiation reaching surrounding gas. Using our conservative fine-structure correction (a factor of 3 as noted above), the case for AGN fading in this system is weak (energy shortfall 1.7–2.0 times depending on which AGN is responsible, and no shortfall if both contribute to the ionization of the extended cloud).
Recombination-balance analysis.
| Quantity | NGC 5278 | NGC 5279 | UGC 6081 SE | UGC 6081 NW |
|---|---|---|---|---|
| Hα flux, nucleus (er g cm−2 s−1) | 2.17 × 10⁻¹⁵ | 2.20 × 10⁻¹⁵ | 5.09 × 10⁻¹⁴ | 2.86 × 10⁻¹³ |
| [O iii] λ5007 flux, nucleus (er g cm−2 s−1) | 9.7 × 10⁻¹⁵ | 1.2 × 10⁻¹⁴ | 1.6 × 10⁻¹⁴ | 1.44 × 10⁻¹³ |
| L(ion) from [ O iii] (erg s−1) | 4.9 × 1042 | 6.2 × 1042 | 9.4 × 1043 | 1.9 × 1044 |
| Q(ion) from [ O iii] (photons s−1) | 1.1 × 1053 | 1.4 × 1053 | 2.2 × 1054 | 4.4 × 1054 |
| F(MIR) (8–25 μm) (er g cm−2 s−1) | 1.5 × 10⁻¹¹ | 8.5 × 10⁻¹² | 2.2 × 10⁻¹¹ | 3.0 × 10⁻¹¹ |
| L(MIR) (erg s−1) | 1.5 × 1043 | 8.8 × 1042 | 6.3 × 1043 | 8.6 × 1043 |
| Max L(ion) (erg s−1) | 2.0 × 1043 | 1.5 × 1043 | 1.6 × 1044 | 2.8 × 1044 |
| Extended region needs: | ||||
| L(ion) (erg s−1) | >4.2 × 1043 | >1.4 × 1043 | >9.4 × 1043 | >1.9 × 1044 |
| 3 × structure correction (erg s−1) | 1.3 × 1045 | 4.2 × 1044 | 2.8 × 1044 | 5.7 × 1044 |
The tunable-filter data are compared in Fig. 4. They reveal rich structure around both galaxies, with emission extending 25 arcsec (18 kpc) from both AGNs. The emission regions occur within the tidal debris and loop seen in the starlight continuum, fitting with a common pattern of kinematically quiescent EELRs as photoionized tidal tails. Within the host galaxy discs, Hα dominates over [O iii] emission, which is reversed outside the galaxy discs; there are distinct bright knots of higher [O iii]/Hα within the extended clouds. The structure we see does not make clear to what extent each AGN contributes to the overall ionization, except that it occurs on only one side of the NW AGN and more symmetrically about the SE one.
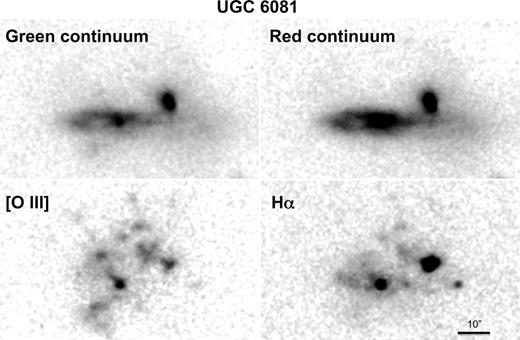
The SAI 2.5m tunable-filter data for UGC 6081. Continuum images are offset by 50 Å from the redshifted line wavelengths, and bottom images show net line emission after continuum subtraction. North is at the top and east to the left; each panel spans 50 × 82 arcsec. The nucleus of the southeastern disc is bright in all these bands and gives a convenient reference point for comparison. Emission regions appear projected as far as 25 arcsec from each nucleus, so that even if the nearer one is solely responsible for the photoionization at these locations, the radial extent from the ionizing source is at least 18 kpc. The intensity scales are similar to Sloan image products, changing gradually from linear at low intensities to logarithmic at bright levels.
SDSS 1354+13: Both galaxies show similar line ratios, marking a possible dual AGN system flagged by Liu et al. (2011) from the SDSS spectrum, and with a velocity asymmetry in the SDSS spectrum noted by Comerford & Greene (2014). AGN-ionized gas is more extended than the starlight continuum, notably in the tidal tail to the south, where it is detected out to a radius of 22 arcsec (27 kpc) along two adjacent slit positions. Comerford et al. (2017) recently presented a suite of spectroscopic data showing both an EELR and a spatially resolved outflow, with implied time-scales suggesting recurrent episodes of nuclear activity in which the AGN has turned ‘off’ and ‘on’ again within 105 yr. Their EELR detection south of the nucleus overlaps with our data along the N–S slit position; our detection extends slightly farther from the AGN. Both their data set and ours indicate that the EELR is part of a tidal tail.
SDSS 0848+35: There is an isolated region of AGN-ionized gas at a projected radius 21 arcsec (23 kpc).
Was 49: Identified in this context by Moran et al. (1992), this may remain the best low-redshift cross-ionization candidate. Detailed study of the AGN by Secrest et al. (2017) stresses its high luminosity and implied black hole mass relative to the very modest stellar mass of the host galaxy. The [O iii] structure around the AGN is elongated perpendicular to the line between the galaxies (Fig. 5); the images in Secrest et al. (2017) show that part of this emission is in a single bright discrete source just north-west of the AGN. All the locations along our spectroscopic slits in this pair are AGN-ionized except the nucleus of the large companion galaxy; the AGN emission is largely continuous with the portion of the large galaxy’s rotation curve sampled in our data. Integral-field spectroscopy with high angular resolution could show whether the gas seen surrounding the AGN on arcsecond scales kinematically matches either its own radial velocity or the rotation pattern of the larger disc. In the latter case, the ionization pattern in the disc might reflect its intersection with the pattern of escaping ionizing radiation.
![[O iii] structure (contours) superimposed on the r-band image of Was 49, from SDSS data using the difference between g and r data to trace line emission. The Seyfert nucleus in this system is in the small companion galaxy to the west, superimposed on the large companion disc and centred in the contours; the [O iii] structure may represent an ionization cone The area shown is 26 × 45 arcsec, with north at the top.](https://oup.silverchair-cdn.com/oup/backfile/Content_public/Journal/mnras/483/4/10.1093_mnras_sty3332/1/m_sty3332fig5.jpeg?Expires=1750426165&Signature=J0hNa97xfuPcU5u1Ki75hJBK6XIjXKPjKqQHA5hgTBZ9GBjsBz19EgRZVDIKKW~FdjTD5lVjasXjgWgYOZI1GU~TwhHX5ZW~V2oWfZ-MHhcPVwhJ-J-8gIPe3RrpFN6frT5f8xjzIOE02jQHQdpWxGHjltdJfMBvIH9cL-uxN4ZZ9zhQdIB771tUeB8teQWmn4x~IpIsm8AZblJ3xX59IV1Ur-yZ7iNLL06n~PH3Dyq4O04S50QxY~kbzS~D9olhePouigH60HYTVu~f4kZnGu4m7ZROUlsQhKw8W4c~PPEwsiuPH~R5BaSoNuTCGmZE~eiivj-3hnbZLYoyvSg6Bw__&Key-Pair-Id=APKAIE5G5CRDK6RD3PGA)
[O iii] structure (contours) superimposed on the r-band image of Was 49, from SDSS data using the difference between g and r data to trace line emission. The Seyfert nucleus in this system is in the small companion galaxy to the west, superimposed on the large companion disc and centred in the contours; the [O iii] structure may represent an ionization cone The area shown is 26 × 45 arcsec, with north at the top.
NGC 3341: This pair has nearly the ideal geometry from Fig. 1, with an AGN hosted in a compact galaxy close to a much larger spiral (Barth et al. 2008). In a multiwavelength study, Bianchi et al. (2013) set very low limits on AGN in the other components of this system. Our emission-line imaging (Fig. 3) shows a possible ionization cone in [O iii] southward from the AGN across the larger disc. However, the spectroscopic data show AGN ionization dominant only close to the AGN, so this structure may be an accident of the spiral pattern and location of star-forming regions. On the other hand, the spectrum shows unusually strong [O i] emission for pure stellar photoionization across much of this region, with [O i] λ6300/Hα ≈ 0.03. More detailed data and modeling would be needed to tell whether this is low-metallicity gas ionized by an AGN, a composite of both ionization sources blended along the slit, or something yet more complex.
NGC 5278/9: This pair has two low-luminosity AGNs, near the Sy 2/LINER boundary in line-ratio diagrams depending on aperture size. The system shows extensive filaments or plumes in line emission, some almost radial (Keel et al. 1989, Fig. 6). Our spectroscopy in the BPT diagram shows AGN-ionized gas across the pair, including one of these plumes to the east. This may suggest that the AGNs either are heavily obscured along our line of sight or have faded over the light traveltime from the nucleus to the extended emission regions. Because gas in each disc may be largely shielded from its own AGN, this pair is a potential instance of cross-ionization.
![The NGC 5278/9 system in the V band (top), continuum-subtracted [O iii] (middle), and continuum-subtracted Hα+[N ii] (bottom). The field shown is 141 arcsec across with north at the top. PSF mismatches between on-band and continuum images give artefacts at the locations of bright stars and the galaxy nuclei. At least three partly radial emission features are present without significant continuum counterparts; our spectrograph slits crossed the nuclei both of NGC 5279, included much of the emission feature extending to its east, and NGC 5278, covering the two oppositely directed emission filaments to the ESE and WNW. The intensity scales are logarithmic starting at levels slightly offset from zero.](https://oup.silverchair-cdn.com/oup/backfile/Content_public/Journal/mnras/483/4/10.1093_mnras_sty3332/1/m_sty3332fig6.jpeg?Expires=1750426165&Signature=4x7fumwlXl--0Ek7HL986ScRUNZpz4L8R42NYSsVBqCLb~O--Zud8Ps9hhHrtrzCTWjm984uEL8OUYyPp9F8U6EkHEQ-u0CyDLJ93IrJpwnREIandVNNGzvXewJC~QO2zfSgZ59wakbRTynYTVQshJPyKtAI~8scmjPP9FL5zkM78H9eTAyby~8VvdpXOadQEyU0YWcRYKSKqDDb-EB-ABUMm2WsNJFGFrGjRATRgtFriuA1jmHLrXNgpO13Y0uAjy7HrddRp3qad3uXv64aJH~R7fM4CBpUSqNB~abi60n5asjsNScMYdDfmujr2yn-bWcgn9Pwi~4IoBJJqLlWTQ__&Key-Pair-Id=APKAIE5G5CRDK6RD3PGA)
The NGC 5278/9 system in the V band (top), continuum-subtracted [O iii] (middle), and continuum-subtracted Hα+[N ii] (bottom). The field shown is 141 arcsec across with north at the top. PSF mismatches between on-band and continuum images give artefacts at the locations of bright stars and the galaxy nuclei. At least three partly radial emission features are present without significant continuum counterparts; our spectrograph slits crossed the nuclei both of NGC 5279, included much of the emission feature extending to its east, and NGC 5278, covering the two oppositely directed emission filaments to the ESE and WNW. The intensity scales are logarithmic starting at levels slightly offset from zero.
In this system, we have the data to estimate both the nuclear luminosities and the ionizing-flux requirement at various points in the extended emission, to see whether the nuclear output has changed dramatically over the relevant light traveltime, and how important obscuration of the AGN is along our line of sight. Since these nuclei were not observed spectroscopically in the SDSS, we use the optical emission-line data within 4|${^{\prime\prime}_{.}}$|7 apertures reported by Keel et al. (1985). For mid-infrared nuclear properties, we take the PSF-fitting WISE fluxes (Wright et al. 2010), using the ‘compromise’ spectral slope conversions from Cutri et al. (2012) and bearing in mind the potential non-nuclear contribution within the WISE PSF. Conversion from Hα surface brightness in extended regions to required luminosity in the ionizing continuum followed Keel et al. (2012a). To be conservative, we take the distance from extended cloud regions to each nucleus to be in the plane of the sky, minimizing the ionizing-luminosity requirements. The quantities involved in this comparison are given in Table 4.
This kind of estimate gives only a lower bound to the required ionizing luminosity of the AGN at the relevant time, both because a given parcel of gas is unlikely to be optically thick at the Lyman edge, and because we measure spatially averaged surface brightness in structures that are likely to be very patchy. For example, Gagne et al. (2014) and Keel et al. (2017b), working at a linear resolution of ≈150 pc from HST imaging of the ‘Teacup’ AGN, find that this calculation for the brightest regions underestimates the ionizing continuum by about a factor of 3 over a wide range in radius. For NGC 5278/9, we average over a yet larger region, roughly 2 kpc in size. Lacking more detailed information on the fine structure in NGC 5278/9, we consider that the multiplication factor will be at least 3. However, with the evidence from He ii emission that the extended features from both galaxies are AGN-ionized, a fading scenario would be plausible only if one of the AGNs dominates the ionizing output, since it would be unlikely for both AGNs to have behaviour synchronized at the 104-yr level, much faster than dynamical time-scales associated with the galaxy encounter.
The deep BTA spectra, centred on each nucleus and aligned along the near-radial filaments, not only extend the radial range over which we can locate feature on the BPT diagram, but add key new information – in three of these filaments, extending outside the detected stellar discs, the He ii/Hβ ratio is so high that it must arise from photoionization by an AGN continuum (Table 5). The regions in NGC 5278 fall near the boundary between stellar and AGN photoionization in the BPT diagram, illustrating the effects of low metallicity as this primarily reduces the strength of [N ii].
Emission-line ratios in extended filaments of NGC 5278/9.
| Ratio | NGC 5278, PA 100, 22-29″ E | NGC 5278, PA100, 20-27″ W | NGC 5278, PA100, 19-28″ E |
|---|---|---|---|
| He ii λ4686/Hβ | 0.24 ± 0.05 | 0.54 ± 0.15 | 0.043 ± 0.08 |
| [O iii] λ5007/Hβ | 4.69 ± 0.25 | 6.11 ± 0.75 | 10.69 ± 0.75 |
| [O iii] λ5007/Hα | 1.44 ± 0.05 | 1.87 ± 0.08 | 3.24 ± 0.07 |
| [N ii] λ6583/Hα | 0.47 ± 0.05 | 0.18 ± 0.03 | 0.43 ± 0.03 |
Among galaxies that our spectroscopic data suggested are pairs of AGNs rather than instances of cross-ionization, HST images recently presented by Storchi-Bergmann et al. (2018) indicate that SDSS J084135.04+010156.3 may instead show cross-ionization. Their [O iii] and Hα images show that the outer part of the 10-kpc ionization cone from the AGN coincides with the companion galaxy in structure and brightness enhancement, suggesting that at the limited spatial resolution of our data, that emission masquerades as a second AGN.
NGC 6636 = Kaz 199: The small northeastern component of this pair (outside the SDSS footprint) has been catalogued as a Seyfert galaxy. We are unaware of a previously published spectrum of the AGN. In our new data, the strong lines would classify both galaxies as star-forming, but [O i] has intensity ≈0.05 × Hα across a large region, at the very high end of values seen in disc H ii regions and potentially a sign of composite ionization sources. In our [O iii] images, the small galaxy (with reported AGN) is surrounded by an arc of emission-line knots (Fig. 7), in addition to the region tracing the tidally distorted arms of the larger galaxy. The sizes of these knots are consistent with unresolved H ii regions, rather than the filamentary appearance often seen in giant AGN-ionized clouds (Keel et al. 2012a; Keel et al. 2015).
![V-band continuum (left) and subtracted [O iii] (right) images of Kaz 199 = NGC 6636 from the KPNO 2.1m telescope. A saturated star produced artefacts at lower left, and the colour changes associated with the dust lane in front of the bulge give negative residuals near the nucleus of the larger galaxy. The reported AGN is in the small companion galaxy to the northeast (upper left). The field in each panel is 86 × 119 arcsec showing north to the top and east to the left.](https://oup.silverchair-cdn.com/oup/backfile/Content_public/Journal/mnras/483/4/10.1093_mnras_sty3332/1/m_sty3332fig7.jpeg?Expires=1750426165&Signature=orD~JayakSKsogzx3CNivaLmdbKICIfcD8XFcP2YahhKtXbctzR8NUQ4yAIJb6SjaCqTwfGjRZT7wiwY0Plfn0bVkQqNQlHauZUP26-vv1c1ZVLY12I-w3-17qKXL77sJnDdL9Cpb~yOLV4HTbEgeWKpd3R1m8Q-Ym6vqz7wxzFaIsu1b3vl4heMeqEE5GTKNtiXyAGWQWeRGnJwcuXv~0cs1tpnfMCV8uTU93YCLCTr7I1fHH98kwMt0vMm1Npoe803vSt3SBiFTvDIf4CpMoqrITgJFOHfoYs91qz0SrOqg4ZOBatSnh~p7tBLZMy5RdMaY8uzHRcTC2ljinAYYg__&Key-Pair-Id=APKAIE5G5CRDK6RD3PGA)
V-band continuum (left) and subtracted [O iii] (right) images of Kaz 199 = NGC 6636 from the KPNO 2.1m telescope. A saturated star produced artefacts at lower left, and the colour changes associated with the dust lane in front of the bulge give negative residuals near the nucleus of the larger galaxy. The reported AGN is in the small companion galaxy to the northeast (upper left). The field in each panel is 86 × 119 arcsec showing north to the top and east to the left.
Some systems attract attention because of what we don’t see. The best example is SDSS J084742.44+344504.4, also catalogued as PG 0844+349, a QSO with a nearby large spiral companion galaxy projected 25″ away (32 kpc). Its Fion and projected separation would be very favorable for cross-ionization, but our spectrum shows no evidence of this. Fig. 8 shows the velocity structure of this companion galaxy to the southwest, along its projected major axis. [O iii] is detected only at the two positions in its disc where the slit crosses the spiral arms, weaker than Hα, so there is no evidence of external AGN ionization. An HST archival image (from program 9763, with Barth as principal investigator) shows this to be a very symmetric, inclined grand-design spiral, similar in scale to the QSO host galaxy itself (Fig. 9). The outer arms are so open in comparison to the inner structure that they may be tidally induced; the dust lanes on the northern side of the arms plus our velocity measurements show that the spiral pattern is trailing. The slit spectroscopy by Hutchings & Crampton (1990) shows only weak emission in the southern spiral arm of the QSO host, without an obvious enhancement as the slit crosses its western arc, so this feature more likely consists of star-forming knots rather than AGN photoionization that fits as well with its very knotty structure compared to the more diffuse and filamentary appearance of EELRs, as in Keel et al. (2017b). These data, and our results on the spiral companion, support either a picture of ionization cones directed near the line of sight and out of the plane of the host galaxy, or one of intermittent high-luminosity accretion phases, perhaps combined with a large physical separation between the pair members. While there remains substantial uncertainty in the line-of-sight separation, this galaxy pair may furnish an emission-line version of the same issues encountered in comparing IGM ionization via the direct and transverse proximity effects (as summarized in the Introduction section).
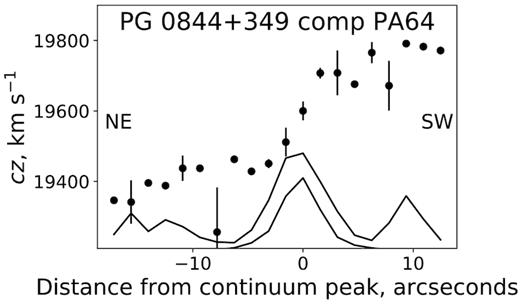
Spectroscopic results on the southern companion to PG 0844+349, shown as in Fig. 2. The traces across the bottom compare the continuum (lower, more compact) and (upper and more spatially extended) Hα intensities along the slit.
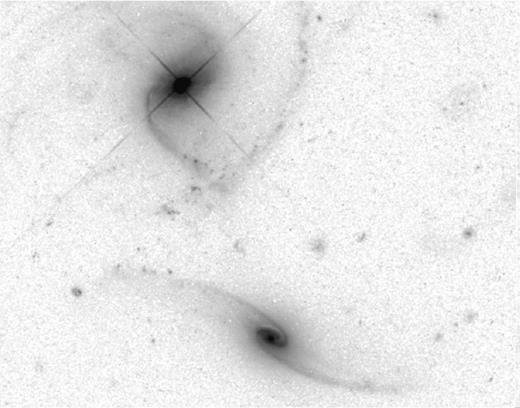
Archival HST image of PG 0844+349 and companion galaxy to its south (from program HST-GO-9763, PI Barth). This is part of an ACS WFC image in the F625W filter, smoothed with a 3-pixel median for cosmetic reasons. The redshifts are a close match, with the companion at |$z$| = 0.0652 compared to the luminous AGN at |$z$| = 0.0643 for a projected velocity difference near 270 km s−1. As expected for trailing spiral arms and the visible dust on the north side, the NE side of the disc is approaching. The area shown spans 38 × 49 arcsec with north at the top.
3.1 Low-metallicity ‘hidden’ AGN-ionized gas
Our primary tool for recognizing AGN-ionized gas is the set of strong emission-line ratios in the ‘classical’ BPT diagram (Baldwin et al. 1981), based on [O iii]/Hβ and [N ii]/Hα, incorporating the revised class boundaries from Kewley et al. (2006). These diagnostics become less certain at lower metallicity as [N ii] and [S ii] become weaker. In this sample, for example, the BPT diagram would classify both SDSS J134203.48+183901.5 and SDSS J135255.67+252859.6 as star-forming galaxies, but broad Hα in the first case, and strong and narrow He ii λ4686 in both, mark them as AGN.
4 CONCLUSIONS
Beginning with candidate pairs selected largely from the SDSS archive with the assistance of Galaxy Zoo volunteer participants, we have surveyed a sample of close companion galaxies to AGN for evidence of ionization of their interstellar medium by the external AGN (which we have termed cross-ionization). Such cases can help define the typical cone angles for escape of ionizing radiation, and the typical radiative history of AGN over time-scales ≈105 yr. Chosen on the basis of predicted intensity of incident AGN radiation and fraction of solid angle around the AGN covered by the companion, we observed the 32 most promising systems spectroscopically, of which 10 show spectroscopic evidence for AGN ionization in the companion galaxy or tidal structures and are candidates for cross-ionization. This fraction (10/32 = 0.31) compares reasonably well with our simple geometric estimate ≈18 per cent, based on typical ionization cone opening angles 70°. A larger sample could, for example, place limits on rapid precession of ionization cones, if it were faster than the local recombination time-scales.
Since objects were selected for spectroscopy without prior knowledge of whether we would find evidence of cross-ionization, we can compare the categories with and without such evidence with regard to our selection parameters r and θ to see whether any difference emerges, such as would be expected in the simple case where the local intensity of isotropic AGN radiation controls the amount of excess ionization. Among objects with spectra, the ranges and median values of Fion are similar for the subsets with and without evidence for cross-ionization; for example, the Kolmogorov–Smirnov test suggests rejection of the hypothesis that the Fion distributions are identical only at significance levels well below 90 per cent. This could mean that preferential escape of ionizing radiation or long-term variability are indeed important in determining the ionization environment of AGN. Our data cannot yet distinguish which might have the dominant role, again parallel to studies of the Lyman α proximity effect (Oppenheimer & Schaye 2013, Khrykin et al. 2016; Schmidt et al. 2018).
We illustrate this comparison, extended to both selection parameters, in Fig. 10. The subsamples of our observed galaxies with and without signs of cross-ionization occupy the same regions of the ionizing flux-angle diagram, showing that these two parameters alone do not determine when this effect will be seen. The clustering of observed objects to the top and right reflects our observational priorities.
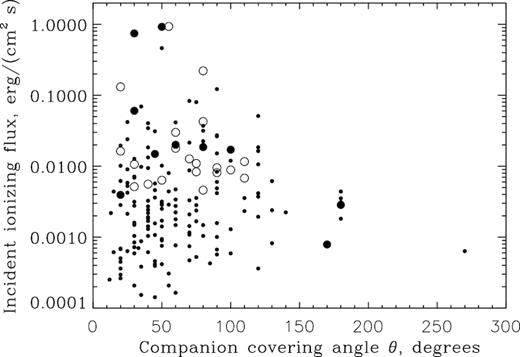
Comparison of subsamples with and without spectroscopic evidence for cross-ionization. The companion covering angle θ is shown as in Fig. 1, while the incident ionizing radiation from the AGN is estimated as in the text, using the median projection correction from Monte Carlo simulations. Small filled circles show all objects in the initial finding list with ionizing flux above 10−4 erg cm−2 s−1 that we did not observe. Large filled circles indicate galaxies with evidence for cross-ionization as in Table 2, while open circles show systems observed spectroscopically and not satisfying our criteria for cross-ionization.
The systems with the best-attested EELRs in our spectroscopic sample, NGC 5278/9 and NGC 6081, each host dual AGNs of roughly comparable luminosity, and highlight the ambiguities introduced in such pairs. Both AGNs may contribute to the extended ionization; untangling their roles in the likely presence of structured obscuration will require more detailed information on kinematics and the three-dimensional layout of each system.
At this point, our results largely provide a candidate list for detecting cross-ionization. Further work in this direction could be pursued fruitfully with integral-field spectroscopy or narrowband emission-line imaging. Such data could define the regions within which AGN ionization is important. Emission-line imaging at high angular resolution would provide a more sensitive probe for the role of external AGN in companion galaxies, allowing separation of the low-density diffuse ISM (whose ionization balance would be more strongly altered by external radiation) from high-surface-brightness star-forming regions.
ACKNOWLEDGEMENTS
This work would not have been possible without the contributions of citizen scientists as part of the Galaxy Zoo project. Among the Galaxy Zoo volunteers, particularly extensive contributions were made by users zutopian and Blue_Crew. Other contributors to the sample compilation were Alice, Blackprojects, Budgieye, ElisabethB, Hanny van Arkel, Jean Tate, Kiske, LankyYankee, Lightbulb50, LynnSeguin, Ranny44, egalaxy, elizabeth, fatha731, graham d, joinpep, planetaryscience, and stellar190.
The work is partly based on observations obtained with the 6-m telescope of the Special Astrophysical Observatory of the Russian Academy of Sciences. The analysis of ionized gas in the systems NGC 5278/9 and UGC 6081 was supported by the grant of Russian Science Foundation project 17-12-01335 ‘Ionized gas in galaxy discs and beyond the optical radius’. The work of CMO was supported by the M. V. Lomonosov Moscow State University Program of Development.
Galaxy Zoo was made possible by funding from a Jim Gray Research Fund from Microsoft and The Leverhulme Trust. We thank the Lick Observatory staff for their assistance in obtaining the data. VNB acknowledges assistance from National Science Foundation (NSF) Research at Undergraduate Institutions (RUI) grant AST-1312296. Findings and conclusions do not necessarily represent views of the NSF.
Funding for the creation and distribution of the SDSS Archive has been provided by the Alfred P. Sloan Foundation, the Participating Institutions, the National Aeronautics and Space Administration, the National Science Foundation, the U.S. Department of Energy, the Japanese Monbukagakusho, and the Max Planck Society. The SDSS website is http://www.sdss.org/. The SDSS is managed by the Astrophysical Research Consortium (ARC) for the Participating Institutions. The Participating Institutions are The University of Chicago, Fermilab, the Institute for Advanced Study, the Japan Participation Group, The Johns Hopkins University, Los Alamos National Laboratory, the Max-Planck-Institute for Astronomy (MPIA), the Max-Planck-Institute for Astrophysics (MPA), New Mexico State University, Princeton University, the United States Naval Observatory, and the University of Washington.
This research has made use of the NASA/IPAC Extragalactic Database (NED), which is operated by the Jet Propulsion Laboratory, Caltech, under contract with the National Aeronautics and Space Administration. iraf is distributed by the National Optical Astronomy Observatory, which is operated by the Association of Universities for Research in Astronomy (AURA) under a cooperative agreement with the National Science Foundation. The authors are honored to be permitted to conduct astronomical research on Iolkam Du’ag (Kitt Peak), a mountain with particular significance to the Tohono O’odham Nation.
Footnotes
REFERENCES
APPENDIX A: FINDING LIST: LOW REDSHIFT AGN/COMPANION GALAXY PAIRS
For completeness, Table A1 gives relevant properties of all 212 AGN/galaxy pairs considered. Selection properties were projected angle subtended by the companion galaxy around the AGN (θ) and predicted ionizing flux from the AGN at the projected distance of the companion galaxy (Fion). Fion was estimated as was done in Section 2.1, using the [O iii] λ5007 fluxes calculated, where possible, from the SDSS spectra (based on tabulated line equivalent width EW in Å and local continuum flux Fcont, as tabulated in SDSS DR7). Objects are identified both by coordinate designation, with initial J indicating designations used in the Sloan surveys (Alam et al. 2015); and, for SDSS objects, by the Data Release 12 (Alam et al. 2015) numerical ObjID for ease of data retrieval. For compactness, Fcont is listed in units 10−17 er g cm−2 s−1 Å−1. Fion is given in arbitrary units, since the quantity has systematic uncertainties as well as projection effects and was used only to rank objects for spectroscopic observation.
Finding list.
| Coord ID | SDSS ObjID | Type | |$z$|(AGN) | |$z$|(compn) | r″ | θ° | Fcont | [O iii] EW | Fion | Notes |
|---|---|---|---|---|---|---|---|---|---|---|
| J001707.95+011506.2 | 1237678617419710603 | 2 | 0.1057 | 0.1074 | 11 | 40 | 19.90 | 32.10 | 22 | |
| J002228.37 − 005830.6 | 1237657189833900309 | 1.5 | 0.1060 | 0.1060 | 12 | 70 | 9.00 | 25.80 | 6.8 | |
| J002944.89+001011.1 | 1237663784200634427 | 2 | 0.0598 | 0.0594 | 5 | 30 | 28.7 | 114.3 | 552 | |
| J005754.03+012013.8 | 1237678617424166953 | 2 | 0.0567 | 9 | 30 | 325 | 402 | 6800 | UM 293 | |
| J011309.59+021716.5 | 1237680100234887247 | 1.9 | 0.0462 | 72 | 28 | UGC 768 | ||||
| J011448.67 − 002946.0 | 1237666338653012001 | 1 | 0.0338 | 0.0349 | 17 | 45 | 52.00 | 12.90 | 9.8 | UGC 793 |
| J011659.06+001933.3 | 1237666339727015947 | 1 | 0.0782 | 0.0077 | 9 | 55 | 19.20 | 2.80 | 2.8 | |
| J013037.75+131252.0 | 1237649918432116906 | 2 | 0.0722 | 0.0726 | 16 | 100 | 14.00 | 23.30 | 5.4 | |
| J020436.76 − 115943.4 | 1237676674463826080 | 1.5 | 0.0726 | 24 | 45 | |||||
| J021209.23+072127.5 | 1237670016730333231 | 2 | 0.1424 | 6 | 45 | 4.20 | 5.00 | 2.5 | ||
| J022226.11 − 085701.3 | 1237652900226596935 | 1 | 0.1666 | 3 | 70 | 15.20 | 106.60 | 759 | ||
| J022909.70+010043.0 | 1237678617434128461 | 2 | 0.1283 | 0.1288 | 8 | 30 | 8.60 | 11.60 | 6.6 | |
| J024222.87 − 011009.0 | 1237660024521556048 | 2 | 0.0372 | 0.0376 | 23 | 20 | 17.20 | 17.80 | 2.4 | |
| J025445.35+010308.4 | 1237678437018108063 | 2 | 0.1367 | 0.1366 | 9 | 20 | 8.70 | 7.40 | 3.3 | |
| J025740.83 − 163046.0 | 1237667244870008884 | 1 | 0.0679 | 5 | 80 | |||||
| J030858.44 − 001549.0 | 1237660240312467582 | 2 | 0.2064 | 0.2069 | 3 | 80 | 5.50 | 80.00 | 206 | |
| J033213.20+001546.7 | 1237666301093675376 | 1 | 0.0861 | 0.0875 | 8 | 100 | 26.40 | 6.80 | 11.8 | |
| J072612.51+412233.7 | 1237673706650796616 | 1 | 0.1324 | 4 | 70 | 11.50 | 6.30 | 19.1 | ||
| J073402.62+433236.9 | 1237663916261703871 | 1 | 0.0831 | 0.0823 | 8 | 45 | 23.00 | 15.00 | 23 | |
| J073906.17+442409.9 | 1237663915725357374 | 2 | 0.1345 | 0.1408 | 4 | 80 | 12.50 | 4.10 | 13.5 | |
| J074408.20+435935.6 | 1237663530254663877 | 2 | 0.1331 | 0.1348 | 5 | 70 | 7.00 | 9.00 | 10.6 | |
| J074429.85+284721.9 | 1237657119477989769 | 2 | 0.1015 | 0.1025 | 4 | 110 | 12.00 | 10.30 | 33 | |
| J074547.87+265537.9 | 1237657630578376999 | 1.8 | 0.1148 | 8 | 40 | 29.00 | 88.10 | 168 | ||
| J075433.27+204635.2 | 1237661087490441736 | 1.8 | 0.1146 | 0.1146 | 8 | 50 | 8.00 | 40.00 | 21 | |
| J075648.78+501016.6 | 1237663915728175471 | 1 | 0.2366 | 0.2364 | 6 | 45 | 9.00 | 13.60 | 14.3 | |
| J075729.04+351105.9 | 1237654626788704563 | 2 | 0.1117 | 3 | 110 | 16.1 | 14.1 | 106 | ||
| J080059.77+343412.0 | 1237674290219450784 | 2 | 0.0823 | 0.0811 | 8 | 40 | 20.00 | 22.60 | 30 | |
| J080435.27+363711.5 | 1237654652024390067 | 2 | 0.0913 | 11 | 40 | 15.00 | 22.80 | 11.9 | ||
| J080514.10+364942.9 | 1237654652024521006 | 2 | 0.0841 | 16 | 20 | 14.00 | 11.60 | 2.7 | ||
| J080647.76+282512.8 | 1237658192145744217 | 2 | 0.1426 | 8 | 75 | 10.70 | 6.80 | 4.8 | ||
| J081411.26+144735.4 | 1237667253453521141 | 2 | 0.1572 | 9 | 30 | 9.50 | 10.88 | 5.4 | ||
| J082017.99+465125.3 | 1237651250946244661 | 2 | 0.0524 | 8 | 50 | 12.00 | 29.00 | 23 | ||
| J082034.78+153111.2 | 1237667253454241925 | 1 | 0.1438 | 8 | 90 | 14.30 | 6.50 | 6.1 | ||
| J082913.59+264009.9 | 1237661087494766877 | 2 | 0.0574 | 0.0571 | 18 | 20 | 26.00 | 50.00 | 16.9 | |
| J083049.39+102712.5 | 1237671262269997354 | 2 | 0.0727 | 0.0720 | 17 | 33 | 18.20 | 24.20 | 6.4 | |
| J083116.14+351707.4 | 1237657629510271237 | 1.9 | 0.1601 | 3 | 90 | 10.00 | 53.20 | 249 | ||
| J083202.71+093759.1 | 1237671261196255490 | 2 | 0.0750 | 4 | 130 | 21.00 | 10.20 | 56 | ||
| J083224.28+355135.9 | 1237657775539945655 | 2 | 0.1368 | 6 | 60 | 15.00 | 14.30 | 25 | ||
| J083728.08+391723.7 | 1237657401878708344 | 2 | 0.1147 | 20 | 30 | 17.50 | 41.80 | 7.7 | ||
| J083848.14+040734.0 | 1237658423540580569 | 2 | 0.0476 | 0.0484 | 9 | 20 | 72.00 | 39.70 | 149 | |
| J083902.96+470756.3 | 1237654381974716589 | 2 | 0.0524 | 0.0534 | 18 | 20 | 38 | 71 | 36 | |
| J084135.08+010156.2 | 1237650797286850905 | 2 | 0.1106 | 4 | 80 | 19.2 | 400.1 | 2020 | ||
| J084742.44+344504.4 | 1237658191076720756 | 1 | 0.0640 | 0.0653 | 22 | 30 | 850 | 3.1 | 97 | PG 0844+349 |
| J084810.11+351534.3 | 1237664871356891234 | 2 | 0.0573 | 0.0570 | 4 | 80 | 19.5 | 33.2 | 170 | |
| J085152.62+522833.0 | 1237651190821617882 | 1 | 0.0645 | 11 | 70 | 14.00 | 20.40 | 9.9 | ||
| J085820.50+642048.4 | 1237663917882802416 | 1 | 0.1158 | 5 | 30 | 11.50 | 59.70 | 116 | ||
| J090128.46+352030.1 | 1237664871894941906 | 2 | 0.1053 | 7 | 40 | 30.10 | 46.90 | 121 | ||
| J090134.48+180943.0 | 1237667429554585733 | 2 | 0.0665 | 0.0665 | 9 | 40 | 32.00 | 14.90 | 25 | |
| J090317.39+100100.5 | 1237661069779009763 | 2 | 0.0619 | 12 | 130 | 31.12 | 24.10 | 22 | UGC 4748 | |
| J090436.92+553602.9 | 1237651252024836118 | 1 | 0.0372 | 12 | 75 | 80.0 | 32.3 | 76 | ||
| J090604.60+170120.0 | 1237667485918429442 | 2 | 0.1007 | 8 | 45 | 15.00 | 52.80 | 52 | ||
| J090743.49+013327.9 | 1237660670347706621 | 1 | 0.1643 | 5 | 75 | 18.70 | 6.90 | 22 | ||
| J090810.33+500923.1 | 1237654653642801161 | 1 | 0.0981 | 0.1073 | 13 | 50 | 44.00 | 23.80 | 26 | |
| J091029.08+203401.9 | 1237667210510336112 | 2 | 0.0289 | 0.0280 | 25 | 270 | 75.00 | 11.40 | 5.8 | |
| J091141.65+370204.1 | 1237660635988492309 | 1 | 0.0865 | 0.0862 | 14 | 30 | 30.00 | 39.20 | 25 | |
| J091319.00+532958.4 | 1237654383052062933 | 1.9 | 0.2549 | 3 | 20 | 13.00 | 9.30 | 57 | ||
| J091449.05+085321.1 | 1237660670347706621 | 1 | 0.1399 | 3 | 75 | 10.10 | 6.90 | 33 | ||
| J091540.88+155639.7 | 1237667735026532578 | 2 | 0.1434 | 9 | 40 | 11.00 | 35.00 | 20 | ||
| J091930.42+133258.7 | 1237671125373485313 | 1 | 0.2291 | 0.2297 | 8 | 120 | 55.00 | 9.40 | 34 | |
| J093044.15+084929.7 | 1237661064413249768 | 2 | 0.1304 | 0.1300 | 4 | 40 | 11.00 | 108.40 | 314 | |
| J093811.95+045356.5 | 1237658298454180052 | 1.8 | 0.1626 | 4 | 180 | 12.00 | 10.20 | 32 | ||
| 094542.04 − 141934.8 | 2 | 0.0077 | 0.0081 | 87 | 20 | NGC 2992 | ||||
| J094716.12+534944.8 | 1237655108368597025 | 2 | 0.0383 | 15 | 90 | 16.20 | 47.60 | 14.4 | ||
| J094741.58+633939.2 | 1237651540315930774 | 2 | 0.1390 | 3 | 50 | 16.00 | 12.40 | 93 | ||
| J095847.90+144526.2 | 1237671261742694538 | 2 | 0.0767 | 7 | 60 | 15.50 | 10.10 | 13.5 | ||
| J095958.22+030232.7 | 1237654599952760951 | 2 | 0.0907 | 0.0906 | 17 | 40 | 20.00 | 44.70 | 13.0 | |
| J100531.67+183939.0 | 1237667782284017791 | 2 | 0.0779 | 0.0780 | 7 | 70 | 14.00 | 10.90 | 13.1 | |
| J100534.70+392852.8 | 1237660772882907153 | 1 | 0.1408 | 12 | 25 | 22.00 | 9.00 | 5.8 | ||
| J100602.50+071131.8 | 1237658300604743843 | 2 | 0.1205 | 0.1218 | 5 | 80 | 25.00 | 80.50 | 339 | |
| J101043.36+061201.4 | 1237658423550607494 | 1 | 0.0978 | 4 | 20 | 39.3 | 116.1 | 1200 | ||
| J101202.59+301303.0 | 1237665097393963129 | 1 | 0.0498 | 12 | 70 | 55.00 | 49.60 | 80 | ||
| J101439.55 − 004951.2 | 1237654669200326683 | 2 | 0.0491 | 0.0483 | 19 | 20 | 41.00 | 13.20 | 6.3 | UGC 5528 |
| J101653.82+002857.0 | 1237654670811201558 | 2 | 0.1163 | 2 | 50 | 20.90 | 191.70 | 4220 | ||
| J101932.86 − 032014.9 | 1237650803195248686 | 1 | 0.0500 | 0.0492 | 37 | 35 | Mkn 1253 | |||
| J102027.52+135530.1 | 1237661070861140238 | 2 | 0.1449 | 6 | 15 | 16.00 | 21.40 | 40 | ||
| J102250.45+495936.5 | 1237657858213871668 | 2 | 0.1155 | 16 | 55 | 11.70 | 9.70 | 1.9 | ||
| J102536.43+371317.1 | 1237664669509550195 | 2 | 0.0608 | 5 | 180 | 34.00 | 7.00 | 40 | ||
| J102850.92+163917.9 | 1237671262819713088 | 2 | 0.1720 | 5 | 75 | 5.40 | 16.80 | 15.3 | ||
| J102940.71+015555.1 | 1237651753463578759 | 2 | 0.0412 | 0.0418 | 40 | 50 | 37.50 | 38.00 | 3.8 | UGC 5694 |
| J103000.93+085202.6 | 1237660583909720086 | 2 | 0.0522 | 20 | 35 | 63.00 | 12.00 | 8.0 | ||
| J103011.81+035410.7 | 1237654604787745026 | 2 | 0.0510 | 11 | 50 | 22.00 | 11.20 | 8.6 | ||
| J103216.14+505120.0 | 1237657589242396682 | 1 | 0.1737 | 3 | 120 | 22.40 | 16.10 | 169 | ||
| J103600.37+013653.5 | 1237651752927363244 | 2 | 0.1068 | 7 | 25 | 42.00 | 105.90 | 382 | ||
| J103607.13+191048.1 | 1237667781213421682 | 2 | 0.1117 | 10 | 70 | 14.00 | 7.30 | 4.3 | ||
| J103655.60+380321.4 | 1237662226206228529 | 2 | 0.0507 | 0.0500 | 29 | 40 | 48.60 | 23.20 | 5.6 | |
| J103734.22+140120.5 | 1237661070326104198 | 2 | 0.2060 | 5 | 20 | 23.00 | 46.00 | 178 | ||
| J103819.51+161445.1 | 1237671261746888940 | 2 | 0.1359 | 3 | 35 | 13.00 | 14.70 | 89 | ||
| J103825.16 − 002331.1 | 1237654669739819119 | 2 | 0.0963 | 4 | 180 | 14.00 | 4.50 | 16.6 | ||
| J104232.05+050241.9 | 1237654602104897626 | 2 | 0.0272 | 0.0273 | 9 | 180 | 26.0 | 19.4 | 26 | NGC 3341 |
| J104519.45+123839.3 | 1237661068179406916 | 2 | 0.0394 | 0.0398 | 8 | 60 | 45.00 | 14.50 | 43 | |
| J105030.47+232931.4 | 1237667538012602552 | 1.8 | 0.0604 | 5 | 50 | 18 | 19.2 | 58 | ||
| J105128.41+335850.8 | 1237665129609691296 | 1 | 0.1828 | 5 | 55 | 9.00 | 17.30 | 26 | ||
| J105143.89+335926.7 | 1237665129609756690 | 1 | 0.1671 | 0.1670 | 4 | 40 | 81.00 | 17.30 | 369 | PG 1048+342 |
| J105203.60+060349.4 | 1237658422481387583 | 1.8 | 0.1281 | 0.1285 | 11 | 15 | 18.00 | 9.00 | 5.6 | |
| J105222.48+180711.1 | 1237668288550076449 | 1 | 0.1322 | 2 | 120 | 26.00 | 17.00 | 466 | ||
| J105418.31+181344.7 | 1237668288550273059 | 2 | 0.0811 | 10 | 30 | 16.00 | 20.90 | 14.1 | ||
| J105434.78+302211.7 | 1237665329844322346 | 2 | 0.1055 | 13 | 20 | 16.00 | 15.50 | 6.2 | ||
| J105503.48+425136.8 | 1237661850925793371 | 2 | 0.0592 | 0.0590 | 11 | 50 | 35.00 | 22.40 | 27 | |
| J105505.07+414944.8 | 1237661871322955907 | 2 | 0.1077 | 2 | 120 | 8.20 | 17.30 | 149 | ||
| J105521.02+291849.3 | 1237667212668895318 | 2 | 0.1408 | 3 | 30 | 6.50 | 40.00 | 122 | ||
| J105738.07+082007.5 | 1237671930135445716 | 2 | 0.0371 | 0.0366 | 26 | 60 | 15.00 | 7.90 | 0.7 | |
| J110017.99+100256.8 | 1237671932283322446 | 2 | 0.0360 | 0.0361 | 20 | 170 | 40.00 | 17.10 | 7.2 | UGC 6081 |
| J110157.90+101739.3 | 1237658493883711561 | 1.5 | 0.0341 | 0.0347 | 31 | 80 | 48.3 | 198.5 | 42 | Tol 1059+105 |
| J110301.26+120543.0 | 1237661950246322306 | 2 | 0.1184 | 6 | 45 | 16.00 | 22.40 | 42 | ||
| J110427.30+381232.2 | 1237662224597909569 | 0 | 0.0302 | 0.0313 | 12 | 20 | Mkn 421 | |||
| J110525.11+215229.6 | 1237667783364051073 | 2 | 0.1475 | 4 | 80 | 11.80 | 93.00 | 289 | ||
| J110544.44+195746.3 | 1237668294982500461 | 2 | 0.1043 | 4 | 90 | 16.00 | 13.00 | 55 | ||
| J110550.53+205113.3 | 1237667734501326907 | 2 | 0.1015 | 8 | 25 | 22.00 | 26.70 | 39 | ||
| J110612.16+061347.6 | 1237658422482895003 | 2 | 0.0979 | 0.0986 | 17 | 20 | 12.00 | 23.20 | 4.1 | |
| J110639.11+433620.9 | 1237661872934682808 | 2 | 0.1185 | 0.1186 | 5 | 110 | 23.40 | 5.40 | 21 | |
| J110816.45+293210.5 | 1237667255082745989 | 2 | 0.0466 | 0.0467 | 9 | 60 | 25.00 | 12.50 | 16 | |
| J111118.04+352308.3 | 1237664817671438525 | 2 | 0.0250 | 9 | 45 | 45.00 | 14.10 | 33 | ||
| J111159.48+013643.4 | 1237651752931360818 | 1.9 | 0.1108 | 0.1099 | 7 | 30 | 13.00 | 25.80 | 29 | |
| J111545.61+065143.2 | 1237661971178586191 | 1 | 0.1492 | 9 | 25 | 12.00 | 85.30 | 53 | ||
| J111623.16+532413.3 | 1237657589782413395 | 2 | 0.1123 | 0.1125 | 2 | 100 | 17.00 | 6.10 | 109 | |
| J111943.34+451612.6 | 1237661852538568731 | 2 | 0.2036 | 0.2030 | 6 | 60 | 10.00 | 323.60 | 379 | |
| J112336.17+521810.0 | 1237657857681260680 | 2 | 0.1579 | 11 | 30 | 12.00 | 32.50 | 13.6 | ||
| J112353.48+655133.5 | 1237651537636032650 | 2 | 0.1326 | 7 | 50 | 8.80 | 10.90 | 8.2 | ||
| J112525.71+533344.4 | 1237658800960700483 | 2 | 0.0804 | 0.0808 | 17 | 50 | 26.00 | 18.30 | 6.9 | |
| J112602.45+343448.1 | 1237665025437139019 | 1.5 | 0.1113 | 0.1115 | 11 | 140 | 21.00 | 27.90 | 20 | |
| J112949.25+172020.2 | 1237668585971253453 | 1 | 0.1571 | 4 | 45 | 12.00 | 41.60 | 132 | ||
| J113003.10+655629.3 | 1237651271361495049 | 1 | 0.1326 | 4 | 90 | 19.60 | 26.80 | 138 | ||
| J113215.11+244516.8 | 1237667550885314686 | 1 | 0.1711 | 4 | 50 | 7.40 | 6.60 | 12.9 | ||
| J113240.25+525701.3 | 1237657630599872600 | 2 | 0.0266 | 0.0271 | 34 | 30 | 180 | 71.4 | 47 | Mkn 176 |
| J113321.04+373944.3 | 1237664819821019315 | 2 | 0.1754 | 6 | 30 | 7.90 | 10.30 | 9.5 | ||
| J113323.97+550415.8 | 1237658802571968533 | 1 | 0.0085 | 0.0078 | 8 | >120 | 1.30 | 11.90 | 1.0 | Mkn 177 |
| J113342.78+353135.4 | 1237665026511601678 | 1 | 0.2018 | 0.2036 | 4 | 90 | 31.00 | 29.50 | 241 | |
| J113443.24+153848.0 | 1237661070869069974 | 2 | 0.0698 | 0.0693 | 12 | 50 | 30.00 | 30.80 | 27 | |
| J113800.25+482623.2 | 1237658611445530792 | 1 | 0.1000 | 0.1002 | 4 | 120 | 15.00 | 24.50 | 97 | |
| J113858.89+141253.2 | 1237664289924055180 | 2 | 0.0805 | 8 | 75 | 22.6 | 67.3 | 100 | ||
| J113942.52+315433.7 | 1237665368509710424 | 1.5 | 0.0089 | 0.0090 | 84 | 30 | 50.00 | 1.00 | NGC 3786 | |
| J114154.76+465656.9 | 1237660635464466499 | 2 | 0.0728 | 4 | 90 | 1.60 | 12.40 | 5.2 | ||
| J114252.83+325124.2 | 1237665369583779929 | 2 | 0.0666 | 0.0661 | 15 | 40 | 27 | 101.8 | 51 | |
| J114719.94+075243.1 | 1237661972255736072 | 2 | 0.0826 | 0.0821 | 15 | 30 | 27.00 | 28.90 | 14.6 | |
| J115112.99+064105.9 | 1237661970645581860 | 1 | 0.0768 | 0.0807 | 13 | 80 | 25.00 | 15.30 | 9.5 | |
| J115535.35+125253.9 | 1237661813346009111 | 1 | 0.1216 | 8 | 25 | 57.00 | 5.20 | 19.5 | ||
| J120041.39+314746.2 | 1237665226229940236 | 2 | 0.1159 | 4 | 55 | 80 | 400 | 8530 | ||
| J120149.74 − 015327.5 | 1237650762390765695 | 1 | 0.0907 | 5 | 50 | 18.0 | 147.2 | 8426 | ||
| J120235.97+372157.8 | 1237664818749767887 | 2 | 0.1975 | 6 | 75 | 12.00 | 18.40 | 26 | ||
| J120336.87+200629.2 | 1237668298202415270 | 2 | 0.2121 | 3 | 90 | 11.40 | 209.00 | 1115 | ||
| J120349.20+020556.9 | 1237651753473867953 | 1.5 | 0.0812 | 8 | 40 | 23.50 | 10.90 | 17 | ||
| J120655.62+501737.4 | 1237658205047488538 | 1.5 | 0.0621 | 0.0633 | 50 | 35 | 35.50 | 22.90 | 1.4 | |
| J120712.57+165809.6 | 1237668623548022885 | 2 | 0.0723 | 0.0737 | 13 | 85 | 24.00 | 6.51 | 3.9 | |
| J120836.75+223934.3 | 1237667782833602610 | 1 | 0.1997 | 3 | 90 | 18.30 | 8.90 | 76 | ||
| J121015.67+262837.4 | 1237667441896390838 | 2 | 0.1041 | 8 | 20 | 38.00 | 37.00 | 93 | ||
| J121151.12+443327.6 | 1237661850395017428 | 2 | 0.1003 | 15 | 120 | 16.00 | 11.00 | 3.3 | ||
| J121155.63+372113.4 | 1237664818750619663 | 2 | 0.0838 | 0.0834 | 8 | 90 | 14.00 | 41.30 | 38 | |
| J121303.35+513855.2 | 1237657855537053802 | 2 | 00849 | 7 | 100 | 22.0 | 42.6 | 81 | ||
| J121418.25+293146.7 | 1237667253478424610 | 2 | 00632 | 0.0640 | 7 | 100 | 31. | 58.5 | 156 | Was 49 |
| J121522.77+414620.9 | 1237661966355988618 | 1 | 0.1963 | 5 | 45 | 17.00 | 99.10 | 284 | ||
| J121749.78+354449.6 | 1237665025978663019 | 2 | 0.0881 | 0.0880 | 4 | 120 | 14.00 | 10.30 | 38 | |
| J121943.13+132659.9 | 1237661813885436022 | 2 | 0.0647 | 0.0645 | 11 | 110 | 25 | 71 | 62 | |
| J121953.10+554506.8 | 1237658918529925220 | 1 | 0.1075 | 11 | 25 | 19.50 | 70.90 | 48 | ||
| J122026.09+044631.9 | 1237655125009498294 | 2 | 0.0811 | 0.0803 | 45 | 12 | 8.00 | 200.00 | 3.3 | |
| J122157.16+080515.1 | 1237661972259537090 | 2 | 0.0718 | 12 | 45 | 30.20 | 47.60 | 42 | ||
| J122500.80+014401.8 | 1237651752939290772 | 2 | 0.0897 | 0.0898 | 25 | 45 | 28.00 | 20 | 3.8 | |
| J122744.56 − 015140.2 | 1237650371558703219 | 1 | 0.1484 | 5 | 40 | 22.60 | 22.60 | 86 | ||
| J123152.05+450443.1 | 1237661872941367322 | 1 | 0.0622 | 0.0621 | 20 | 60 | 55.00 | 12.00 | 7.0 | |
| J123351.61+195311.6 | 1237667915421778099 | 2 | 0.0737 | 0.0735 | 7 | 50 | 15.00 | 12.10 | 16 | |
| J123507.49+171509 | 1237668589724631143 | 2 | 0.0894 | 0.0898 | 11 | 40 | 19.30 | 26.00 | 17 | |
| J124214.47+141147.0 | 1237662524694462694 | 2 | 0.1574 | 15 | 20 | 14.00 | 17.60 | 4.6 | ||
| J124322.55+373858.0 | 1237664819290177687 | 2 | 0.0859 | 0.0865 | 6 | 90 | 37 | 17.3 | 74 | |
| J124406.59+652925.5 | 1237654610679955615 | 2 | 0.1071 | 4 | 75 | 21.50 | 129.00 | 730 | ||
| J130116.09 − 032829.0 | 1237650369414889508 | 2 | 0.0864 | 0.0867 | 11 | 70 | 34.80 | 24.90 | 30 | |
| J130240.41+514644.4 | 1237661958293028932 | 2 | 0.0539 | 0.0550 | 110 | 12 | 28.20 | 57.70 | 0.6 | UGC 8151 |
| J130354.71 − 030631.8 | 1237650760786903297 | 2 | 0.0778 | 6 | 60 | 36.2 | 38.6 | 163 | ||
| J130600.68+000125.0 | 1237648704582844527 | 2 | 0.1379 | 0.1377 | 13 | 20 | 11.00 | 94.60 | 26 | |
| J131135.65+142447.1 | 1237662525234479221 | 1 | 0.1140 | 9 | 45 | 60.00 | 42.10 | 131 | ||
| J131318.92+504001.7 | 1237661957220139201 | 2 | 0.1585 | 6 | 55 | 13.20 | 26.10 | 40 | ||
| J131517.26+442425.5 | 1237661851473739819 | 2 | 0.0355 | 0.0355 | 37 | 90 | 110.00 | 27.20 | 9.2 | |
| J131639.74+445235.0 | 1237661852010676264 | 2 | 0.0906 | 0.0915 | 12 | 25 | 45.00 | 166.50 | 219 | |
| J131854.19+221825.5 | 1237667783377551471 | 2 | 0.1818 | 3 | 90 | 8.20 | 11.60 | 45 | ||
| J132751.63+330638.1 | 1237665127476428926 | 2 | 0.1412 | 2 | 70 | 13.70 | 13.60 | 196 | ||
| J133920.85+393224.3 | 1237662305112293614 | 2 | 0.2240 | 3 | 90 | 39.00 | 200.00 | 3650 | ||
| J134143.75+554025.5 | 1237661387065786478 | 2 | 0.0251 | 0.0253 | 38 | 45 | 3100.00 | 15.00 | 136 | NGC 5278/9 |
| J134203.48+183901.5 | 1237668271899738298 | 1.8 | 0.0845 | 5 | 80 | 17.6 | 134.4 | 399 | ||
| J134234.31+191338.9 | 1237668272436674636 | 1 | 0.0866 | 0.0866 | 9 | 180 | 49.00 | 11.10 | 28 | |
| J134730.70+603743.1 | 1237655369829580934 | 1 | 0.1433 | 0.1438 | 5 | 30 | 15.20 | 25.40 | 65 | |
| J134736.39+173404.6 | 1237668316456288331 | 2 | 0.0447 | 00451 | 10 | 90 | 40 | 51.9 | 87 | |
| J134955.48+084039.6 | 1237662236939256056 | 2 | 0.0670 | 10 | 30 | 220.00 | 6.80 | 63 | ||
| J135255.67+252859.6 | 1237665531709554737 | 1 | 0.0636 | 5 | 60 | 40.00 | 40.70 | 274 | ||
| J135429.05+132757.2 | 1237662529526890706 | 2 | 0.0633 | 9 | 60 | 8.4 | 420 | 183 | ||
| J135713.88+115951.0 | 1237662199886184522 | 2 | 0.0205 | 0.0205 | 85 | 30 | 97.30 | 4.60 | 0.3 | |
| J140944.19+100429.7 | 1237662239088836793 | 2 | 0.0958 | 0.0951 | 26 | 12 | 12.40 | 30.40 | 2.3 | |
| J141041.49+223337.0 | 1237667911678099640 | 1 | 0.1725 | 3 | 35 | 31.50 | 43.00 | 634 | ||
| J141104.81 − 001906.6 | 1237648704053051635 | 2 | 0.1387 | 0.1390 | 5 | 60 | 11.50 | 16.00 | 31 | |
| J141447.15 − 000013.1 | 1237648721245503521 | 2 | 0.0475 | 0.0474 | 5 | 70 | 24.0 | 28.8 | 116 | |
| J141946.07+650353.2 | 1237674479196242084 | 1 | 0.1479 | 4 | 70 | 25.00 | 50.00 | 329 | ||
| J142255.49 − 001711.4 | 1237648704054362331 | 2 | 0.1302 | 5 | 40 | 5.00 | 200.00 | 168 | ||
| J142755.36 − 003341.8 | 1237648720710074546 | 2 | 0.0795 | 0.0792 | 7 | 50 | 15.00 | 22 | 29 | |
| J142802.22+062619.5 | 1237655744015368412 | 2 | 0.1155 | 13 | 45 | 8.90 | 18.80 | 4.2 | ||
| J143454.21+334934.5 | 1237662661597659257 | 2 | 0.0578 | 0.0587 | 14 | 35 | 30.00 | 5.4 | 3.5 | |
| J143515.65+023221.6 | 1237651754564190252 | 1 | 0.3048 | 6 | 25 | 46.70 | 15.10 | 82 | ||
| J144213.96+231844.6 | 1237665532251406538 | 1 | 0.1830 | 9 | 30 | 6.10 | 5.90 | 1.9 | ||
| J144248.27+120040.3 | 1237662529532133399 | 0 | 0.1631 | 2 | 120 | 42.00 | 0.40 | 18 | ||
| J144733.17 − 013844.3 | 1237655499209310386 | 2 | 0.0428 | 0.0427 | 73 | 26 | 28.70 | 3.90 | 0.1 | |
| J144937.71+184159.5 | 1237667783386988590 | 2 | 0.0321 | 0.0320 | 29 | 45 | 89.40 | 3.00 | 1.3 | |
| J145002.97+255441.2 | 1237665178450788549 | 1.8 | 0.0604 | 7 | 60 | 15.00 | 15.80 | 20.4 | ||
| J145051.51+050652.1 | 1237651822714028249 | 2 | 0.0275 | 0.0282 | 21 | 55 | 100.00 | 76.40 | 73 | NGC 5765 |
| 174659.8 +683637 | 1 | 0.0630 | 0.0623 | 7 | 120 | Kaz 163 | ||||
| 182205.11+663719.2 | 2 | 0.0155 | 0.0146 | 24 | 150 | Kaz 199 NGC 6636 | ||||
| 191152.98+731929.5 | 2 | 0.0250 | 0.0252 | 85 | 10 | 13.30 | NGC 6786 | |||
| J220041.34+103308.0 | 1237678859532566564 | 2 | 0.0266 | 3 | 120 | Mkn 520 | ||||
| J220555.01 − 000755.2 | 1237663543146643720 | 2 | 0.0945 | 0.0939 | 13 | 60 | 13.30 | 4.40 | 1.5 | |
| J220701.98+101400.8 | 1237678876177072140 | 2 | 0.0266 | 0.0266 | 13 | 75 | NGC 7212 | |||
| J225057.27 − 085410.8 | 1237652600111366327 | 1.8 | 0.0650 | 0.0644 | 6 | 30 | 35.00 | 23.50 | 96.3 | |
| J225452.22+004631.3 | 1237663445442691192 | 1 | 0.0909 | 0.0912 | 11 | 40 | 57.50 | 7.70 | 15.4 | |
| J225823.29+001603.8 | 1237663444906213507 | 2 | 0.1542 | 0.1543 | 10 | 45 | 16.10 | 5.30 | 3.6 | |
| J230315.61+085226.0 | 1237679034548551752 | 1 | 0.0163 | 0.0160 | 71 | 50 | 0.00 | 0.0 | NGC 7469 | |
| J230443.47 − 084108.6 | 1237653438155128872 | 1 | 0.0470 | 0.0473 | 63 | 13 | 172.00 | 109.80 | 20 | Mkn 926 |
| J232756.70+084644.3 | 1237679034014367754 | 2 | 0.0289 | 0.0295 | 45 | 80 | NGC 7674 | |||
| J234428.33+010829.7 | 1237656909037699193 | 2 | 0.1206 | 0.1167 | 11 | 40 | 13.90 | 19.60 | 9.5 |
In a few cases we used additional sources for emission-line data: Petrov, Kovachev & Mineva (1985) for NGC 6786, Heckman et al. (1984) for the companion of PG 1048+342, and Keel et al. (1985) for NGC 5278/9.
‘Type’ indicates the AGN type 1 for broad-line objects (as in Sy 1), 2 for narrow-line objects, and 0 for BL Lac objects.
Author notes
Einstein Fellow.
CCAPP Fellow.
