-
PDF
- Split View
-
Views
-
Cite
Cite
S González-Gaitán, R S de Souza, A Krone-Martins, E Cameron, P Coelho, L Galbany, E E O Ishida, COIN collaboration, Spatial field reconstruction with INLA: application to IFU galaxy data, Monthly Notices of the Royal Astronomical Society, Volume 482, Issue 3, January 2019, Pages 3880–3891, https://doi.org/10.1093/mnras/sty2881
Close - Share Icon Share
ABSTRACT
Astronomical observations of extended sources, such as cubes of integral field spectroscopy (IFS), encode autocorrelated spatial structures that cannot be optimally exploited by standard methodologies. This work introduces a novel technique to model IFS data sets, which treats the observed galaxy properties as realizations of an unobserved Gaussian Markov random field. The method is computationally efficient, resilient to the presence of low-signal-to-noise regions, and uses an alternative to Markov Chain Monte Carlo for fast Bayesian inference – the Integrated Nested Laplace Approximation. As a case study, we analyse 721 IFS data cubes of nearby galaxies from the CALIFA and PISCO surveys, for which we retrieve the maps of the following physical properties: age, metallicity, mass, and extinction. The proposed Bayesian approach, built on a generative representation of the galaxy properties, enables the creation of synthetic images, recovery of areas with bad pixels, and an increased power to detect structures in data sets subject to substantial noise and/or sparsity of sampling. A snippet code to reproduce the analysis of this paper is available in the COIN toolbox, together with the field reconstructions of the CALIFA and PISCO samples.
1 INTRODUCTION
Astrophysical processes span a rich hierarchy of physical scales through time and space, making the evolutionary histories of the smallest and largest structures closely connected. This interplay between local and global dynamics is manifest in the observed morphologies of extended astronomical sources, most notably galaxies (e.g. de Zeeuw et al. 2002; Bershady et al. 2010; Cappellari et al. 2011; Blanc et al. 2013; Brodie et al. 2014). These objects have been studied in ever growing detail thanks to the advent of Integral-Field Units (IFUs). IFUs combine simultaneous spectral and spatial information, enabling novel ways to probe the spatial structure of galaxy properties, such as chemical abundances and star formation histories. Indeed, IFU observations have become an integral component of large surveys at both low and high redshifts (e.g. SAURON, Bacon et al. 2001; SINS, Förster Schreiber et al. 2006; SAMI, Croom et al. 2012; MANGA, Bundy et al. 2015; AMUSING, Galbany et al. 2016a).
Stellar population properties are traditionally obtained from IFU cubes using spectrum fitting codes in which each spaxel1 is treated independently (e.g. Cappellari & Emsellem 2004; Cid Fernandes et al. 2005; Ocvirk et al. 2006; Walcher et al. 2006; Koleva et al. 2009; Sánchez et al. 2016a; Leja et al. 2017). The integrated spectrum is modelled as a combination of simple stellar population libraries (Bruzual & Charlot 2003; Coelho et al. 2007; Walcher et al. 2009; Conroy & Gunn 2010; Maraston & Strömbäck 2011; Vazdekis et al. 2015), enabling to retrieve a set of astrophysical parameters, e.g. ages, chemical abundances, global metallicities, and other element ratios, or stellar masses and reddening (see Walcher et al. 2011, for a recent review).
But by underestimating astrophysical and/or instrumental correlations2 between measured values at nearby locations, these approaches may fail to extract the complete signal from its noisy background. This problem has been recognized before and several attempts to include spatial information have been made. These include global parametric models of the spatial distribution of physical quantities – adopted, for instance, in kinematic studies (e.g. Krajnović et al. 2006; Watkins et al. 2013) – or the introduction of automatic spatial segmentations. The latter consists of using adaptive binning algorithms to form groups of contiguous spaxels over which measurements may be averaged to increase the signal-to-noise (S/N) ratio of the spectral information (Sanders & Fabian 2001; Cappellari & Copin 2003; Diehl & Statler 2006; Sánchez et al. 2016a). The most common of these adaptive binning techniques is Voronoi tessellation (Aurenhammer 1991), although variations based on intensity or isocontours have also been explored (Sanders 2006; Sánchez et al. 2012b). Most recently, Casado et al. (2017) introduced a statistical segmentation technique that groups neighbouring regions by similarity across multiple properties. Although segmentation approaches boost the statistical confidence of the spectral analysis, by averaging the signal over larger partitions, they do so at the expense of spatial precision (e.g. Cid Fernandes et al. 2014). This may lead to biased estimates if the averaged regions are inhomogeneous.
To mitigate the limitations of current segmentation-based approaches in astronomy, we introduce a tool to take advantage of the spatial information encoded in IFU spectra. This algorithm profits from the presently available spectral synthesis and fitting codes and at the same time avoids the complexity and computational cost of performing a fully spatially resolved spectral synthesis and IFU fitting. The method relies on the use of Gaussian Markov Random Fields (GMRFs) to estimate the unobserved spatial field. GMRF is a common approach for spatial modelling due to its simplicity, since it is completely determined through its mean and covariance structure. The conceptual motivation for the use of GMRF is to treat the data as a discrete and noisy sampling of an underlying continuous field, which the spatial model aims to reconstruct (see Section 3). For fast Bayesian inference, the model is implemented using the Integrated Nested Laplace Approximation (INLA; Rue et al. 2017) framework embedded in the r-inla package.3 To make the approach seamlessly adaptable to traditional spectral synthesis codes, we apply it here to the existing maps of stellar population properties previously obtained through pixel-wise spectral fitting.
The structure of this paper is as follows. In Section 2 we describe the IFU data from CALIFA and PISCO, and the respective stellar population fits with starlight. Section 3 introduces the underlying spatial statistical methodology, and in Section 4 we discuss its application to the IFU data. Section 5 compares our approach to the previous literature, Section 6 shows some applications, and we summarize our results in Section 7.
2 OPTICAL IFU DATA: CALIFA AND PISCO
We retrieved data from the Calar Alto Legacy Integral Field Area survey (CALIFA;4 Sánchez et al. 2012a; Husemann et al. 2013; García-Benito et al. 2015; Sánchez et al. 2016b), composed of data cubes and science data products of 667 nearby (|$z$| < 0.03) galaxies taken with the Potsdam Multi Aperture Spectrograph (PMAS; Roth et al. 2005) in the PPak mode (Verheijen et al. 2004; Kelz et al. 2006). To this set, we add a sample of 104 galaxies from the PMAS/PPak Integral-field Supernova hosts COmpilation (PISCO; Galbany et al. 2018) observed with the same instrumental configuration. All spectra cover the wavelength range 3745–7500 Å with a resolution of R ∼ 850 (V500 mode) and a fraction with R ∼ 1650 (V1200 mode) in the blue (3400–4840 Å). The CALIFA sample has been characterized in Walcher et al. (2014) and covers galaxies between 109 and 1011.5 M⊙, with a peak between 1010 and 2 × 10¹¹M⊙ (see their fig. 14). The morphologies are diverse, ranging from elliptical to late-type spirals, with a dominance of Sb and Sbc Hubble types. A large fraction of the galaxies (about 60 per cent; ∼450) show some emission lines, and Walcher et al. (2014) estimated that the majority of those (43 per cent) are dominated by star formation (while 29 per cent are LINERs, 5 per cent are Seyferts, and the remaining lie in between the star formation and active galactic nucleus branches).
For the current analysis, we make use of the following stellar population parameters: age (t[yr]), metallicity (Z), mass (M[M⊙]), and extinction in the visual band (AV [mag]). Following Galbany et al. (2014, 2016b), we estimated these parameters with the spectral synthesis package starlight (Cid Fernandes et al. 2005, 2009) by fitting the spectrum at each spaxel with a linear combination of 248 simple stellar population (SSP) models from the ‘Granada-Miles’ (GM) basis (González Delgado et al. 2015). The GM consists of a regular grid of 62 ages spanning t = 0.001–14 Gyr and four metallicities (Z/Z⊙ = 0.2, 0.4, 1, and 1.5), which are consistent with other commonly adopted bases such as Bruzual (2007), as discussed in Cid Fernandes et al. (2014). The final pixel-by-pixel age and metallicity are calculated from either the luminosity-weighted average of all SSPs entering each fit: 〈logL(t[yr])〉 and 〈logL(Z)〉, or the mass-weighted average: 〈logM(t[yr])〉 and 〈logM(Z)〉. We only considered spectra for which the S/N ratio in the continuum lay above 5 (estimated over the wavelength range of 4580–4640 Å). Additionally, we also retrieved information from the H α equivalent width (EW).
As a case in point, we illustrate the analysis on the CALIFA galaxies, Scd NGC 0309, and E1 NGC 0741, throughout the paper. The complete analysis of 721 galaxies observed with PMAS is presented in the COIN toolbox.
2.1 Diagnostic of IFU spatial correlation
To illustrate the presence of spatial correlations in IFU cubes, this section provides an exploratory analysis using as an example the metallicity maps for the galaxies NGC 0741 and NGC 0309 from CALIFA. A simple approach to quantify the degree of spatial correlation is given by the Moran autocorrelation coefficient (Moran 1950). This coefficient can be seen as an extension of the standard Pearson correlation (Pearson 1895) for spatial data.
Fig. 1 shows the Moran-I test statistic for the metallicity maps of NGC 0741 and NGC 0309 as a function of pixel distances. The upper horizontal axis depicts approximate projected physical distance without taking into account galaxy inclination. The Moran-I statistic suggests that the level of correlation, as expected, is larger for nearby pixels and decreases as one moves away. The origin of this correlation can be either instrumental or physical but most likely a combination of both. But regardless of its origin, this simple example indicates that proper analysis of IFU cubes should account for the additional spatial dimension at all steps of the data analysis and of the physical properties inference process. By profiting from such additional information it should be possible to reconstruct the underlying scalar field of the data, and to infer if any fluctuations of this reconstruction are statistically significant.
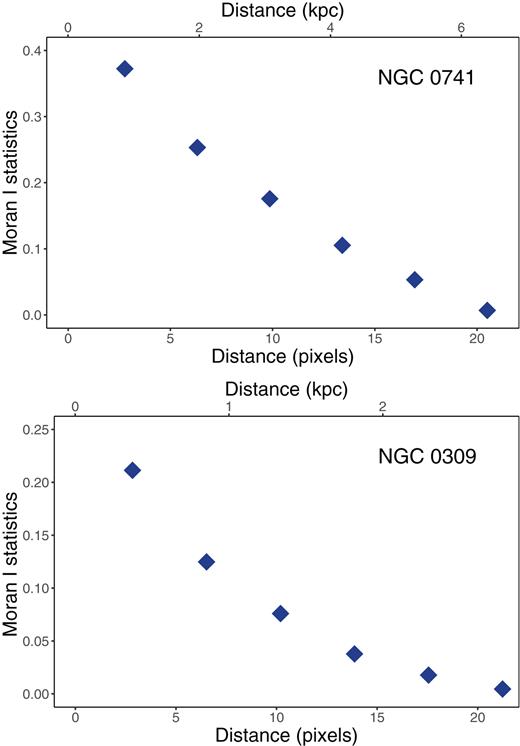
Moran-I statistics as a function of pixel separation for metallicity maps of NGC 0741 and NGC 0309. The approximate physical distance displayed in the upper horizontal axis.
3 SPATIAL MODELS VIA INTEGRATED NESTED LAPLACE APPROXIMATION
This section introduces few concepts of Bayesian inference and spatial modelling to motivate its application to image/field reconstruction. For more details on Bayesian models, see e.g. Andreon & Weaver (2015), Blangiardo & Cameletti (2015), Hilbe, de Souza & Ishida 2017, and Sharma 2017.

which is reflected in the relation f(xi, xj, xk)f(xk) = f(xi, xk)f(xj, xk), where f is a given probability density distribution. Intuitively it gives more strength to the neighbours, i.e. knowing xk renders xj less relevant for predicting xi. This is also a type of partial pooling, i.e. the information is shared among nearby pixels to estimate the summary statistics within each pixel. The radius of influence of each pixel and its weight is encoded by the spatial kernel.
The final layer of the hierarchical model denotes completion of the Bayesian framework with appropriate priors – given for now the notation for a place holder distribution, π – on the hyper-parameters of the GMRF and the parameters of the parametric component. It is well known for Gaussian process regressions that the values these hyper-parameters can take have a strong influence on the smoothness of the resulting image estimates, yet they will often be poorly constrained by the likelihood function for the observed data (e.g. Zhu & Zhang 2006). Hence, the importance of (i) careful prior choice and sensitivity analysis, and (ii) integration (or ‘marginalization’) over the posteriors for the hyper-parameters to propagate these uncertainties through to the predictive distribution. An efficient computational implementation of this model structure and uncertainty analysis is facilitated by the r-inla package.
r-inla6 is an r package designed for modelling spatial data. It has strong computational gains relative to a direct MCMC sampling strategy achieved over three fronts. First, its use of an effective Laplace approximation (Tierney & Kadane 1986; Rue, Martino & Chopin 2009) for estimation of the marginal likelihood of the high dimensional random field component, given the observed data, and a vector of trial hyper-parameters (see appendix A for a brief definition). Secondly, the use of grid-based integration over the low dimensional space of hyper-parameters rather than Monte Carlo exploration (Rue et al. 2009, see also recent work in this direction on sequential quasi Monte Carlo; Gerber & Chopin 2015). Both of these steps trade a degree of bias for computational speed ups, their suitability being generally well regarded for the class of models targeted by the INLA approach.7 Lastly, the sparse precision structure of the GMRF component allows for much faster matrix operations than those for an equivalent dense matrix.
The INLA methodology is very popular in a number of fields, and has been successfully applied to build spatio-temporal disease mapping models (Schrödle et al. 2011), to modelling fish populations in the Northwest Atlantic Ocean (Boudreau, Shackell & Carson 2017), to probe population size dynamics from molecular data (Palacios & Minin 2012), for mapping the global ozone levels (Bolin & Lindgren 2011), air pollution (Cameletti et al. 2013), and forest fires in Portugal (Natário, Oliveira & Marques 2014), and predicting extreme rainfall events in space and time (Opitz et al. 2018), just to cite a few. Therefore, the case study herein employed – spatial maps from IFU cubes – represents just a glimpse of the potential of these spatial models with INLA, and we advocated for their use in other astronomical problems.
A final note on the modelling strategy adopted here is as follows. Due to the so-called ‘shrinkage’ (Copas 1983)8 effect, the spatial representation in our approach allows for a sharing of information between nearby pixels. We expect this to yield more accurate predictions (in a mean squared error sense) than what is achievable through a pixel-by-pixel analysis. This well-studied effect targeted by hierarchical Bayesian models (Efron & Morris 1973) occurs naturally in high dimensional problems where a degree of correlation is anticipated a priori, but (remarkably) can even occur when no such correlation holds under the true underlying model (Stein 1956, i.e. ‘Stein’s phenomenon’). As will be shown later, a fortunate side effect is a more reader-friendly visual representation of the data.
Our full hierarchical model structure composed of a GMRF, and optimized via INLA, under the r-inla framework, will henceforth be referred to simply as ‘INLA’ for the sake of simplicity.
4 SPATIAL ANALYSIS OF IFU MAPS
This section discusses the application of our statistical framework to the CALIFA galaxies, NGC 0309, a spiral galaxy, and NGC 0741, an elliptical galaxy. The first four raw (i.e. non-spatially modelled) quantities luminosity-weighted age and metallicity, mass, and extinction were extracted individually and independently by starlight runs on each spaxel of the IFU cubes, while the H α EW measurements were obtained from independent Gaussian profile line fits. INLA was then used to estimate the underlying spatial distribution of the latent parameters as per the hierarchical model structure described above.
In Fig. 2 we present side-by-side comparisons of the original and resulting (INLA reconstructed) maps for each of those quantities. It is evident that both global and local structures in these galaxies are more easily seen in the reconstructed images than from the simple spatial plots of the (noisy) individually determined parameters. Furthermore, these results illustrate the predictive capability of the model to interpolate over empty spots in the galaxy original IFU data or in the outskirts of the instrument field-of-view, at positions where no individual starlight fits were obtained due to excessively low signal-to-noise. This would also be the case if some region of the focal plane was missing coverage due to either instrumental defects (e.g. broken fibres) or to instrumental design (e.g. fibre gaps). We stress that this type of prediction is only possible because the physical information is not purely random: it is spatially correlated.
![From top to bottom: luminosity-weighted age: 〈log (tL[yr])〉, metallicity: 〈log (ZL)〉, mass: 〈log (M[M⊙])〉, reddening: AV, and H α EW(Å) maps obtained by directly plotting the results from the independent spaxel fits (left) and the INLA reconstructed parameter field (right). NGC 0741 (CALIFA K0068) in the left-most figures. NGC 0309 (CALIFA K0034) in the right-most figures.](https://oup.silverchair-cdn.com/oup/backfile/Content_public/Journal/mnras/482/3/10.1093_mnras_sty2881/2/m_sty2881fig2.jpeg?Expires=1750378954&Signature=UDJR9mqs4Ldz~UtZZXMxtEKEMg3lnjJnyMKfWY0az1MsfLeJOEW1BOyeRd4-h6k0Km7B~gtWYPSPm23e5RcciGEJjXN4~d2wiiaBfkGQBsEG-pVtQmA7lC2NqckApfGcK5o4FyHmsDDLi1TLQJW6SXEejRJuKRlA7nM~ze56wqVPioG86LWZvCQ-KvlEesJi4hxNH2S0HtofiCDU5pWLjKLdLsWE4xhagTDZw46teA8RW~XiLQHtL38I0cqI9Mfgn7jk8KUn3eb2QZi--nTsD8cmBTNa4RFqGNRoAZjxwnVO~GSjB3C~WQspgyLD-Aq96WzYIUzQHQIwk8l~eNYhEQ__&Key-Pair-Id=APKAIE5G5CRDK6RD3PGA)
From top to bottom: luminosity-weighted age: 〈log (tL[yr])〉, metallicity: 〈log (ZL)〉, mass: 〈log (M[M⊙])〉, reddening: AV, and H α EW(Å) maps obtained by directly plotting the results from the independent spaxel fits (left) and the INLA reconstructed parameter field (right). NGC 0741 (CALIFA K0068) in the left-most figures. NGC 0309 (CALIFA K0034) in the right-most figures.
Furthermore, given the multiple dithering observations of the CALIFA cubes, if these are taken under different observing conditions, a known systematic spatial pattern can sometimes be present. The AV input maps show best this artificial structure which is then greatly reduced with INLA. Even though INLA is heavily dependent on the input data, large-scale systematics will be carried on to the INLA prediction but small enough systematics that are non-correlated will be safely ignored.
It is important to emphasize that the INLA prediction is not a smoothing convolution of the original data; if there are spatial correlations in the data, it takes this information into account while predicting the underlying field. Nor does it degrade unnecessarily the image resolution by prior binning of the maps to increase the signal.
Another considerable advantage of INLA is that it approximates the full posterior distribution – accordingly, it is possible to assess the statistical significance of the results. The INLA maps shown in Fig. 2 represent the mean value of the posterior distributions at each pixel. Fig. 3 shows the maps for the estimated standard deviation from the resulting posteriors. This information can be used as a first proxy for the prediction error, since the posterior distributions are approximately normal in the present case. For all properties of both galaxies, the predicted dispersion maps are consistent with expectations: larger uncertainties are obtained at lower signal-to-noise data. The regions of the input map that are most uncertain, usually due to lack of data (e.g. no starlight fit was obtained), consistently have larger dispersions. This can be observed, for instance, in the outskirts of the maps, where the posteriors are being predicted beyond the original boundaries. It is also seen in the estimate for the H α EW(Å) map of NGC 0741, which shows posteriors that are statistically compatible with null in a large fraction of the reconstructed scalar field. A possibly false emission is inferred in the centre of this galaxy, where there is no data. None the less, the INLA error tells us that this is not significant and is consistent with zero. We checked that this feature disappears with a different input radial component [h(·) in equation 3]. We therefore caution that one should never interpret the results beyond what properly estimated errors allow.
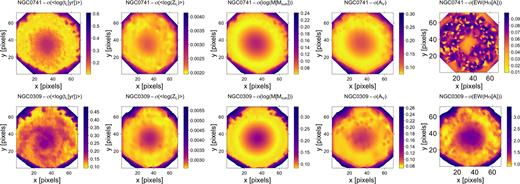
Map of the reconstruction uncertainty estimates derived by INLA for the age, metallicity, mass, reddening, and H α EW (from left to right) maps shown in Fig. 2. NGC 0741 (CALIFA K0068) in the top. NGC 0309 (CALIFA K0034) in the bottom.
A note on the computation of input uncertainties, the σi of our hierarchical model (equation 3). While the starlight code by itself does not estimate uncertainties for the fitted parameters, Cid Fernandes et al. (2014), with the help of extensive simulations, estimated the uncertainties for different signal-to-noise values. This is the approach we adopt here although we have also tested an alternative strategy of allowing the uncertainties to be learnt entirely within the r-inla code. In both cases, we obtained similar results indicating that the addition of the starlight estimated uncertainty maps following the aforementioned technique is not an essential component here for effective inference.
We also note that the predicted maps from INLA have in fact a higher correlation at neighbouring pixels than the input maps (calculated with Moran statistics – see Section 2.1) showing that the underlying covariance structure is lessened by the random noise introduced when relying in the pixel-by-pixel estimate. Having said that, one should always be careful with the choice of kernel in order to avoid undesired levels of smoothness.
5 COMPARISON TO OTHER TECHNIQUES
To contextualize our technique we show here a qualitative comparison to alternative mapping approaches used in the literature. The most adopted procedures to analyse IFU data are based on segmentation of the space by aggregating neighbouring spaxels into larger regions to optimize the signal-to-noise (e.g. de Amorim et al. 2017). This happens prior to some model fit (e.g. using starlight) that is performed inside each segmented region. INLA, on the other hand, is drastically different: it builds a full spatial map of a given property generally after an initial model fit has been performed. Accordingly, INLA does not require to first degrade the spatial resolution of the original data.
Fig. 4 shows age maps of the galaxy NGC 0309. The left-most panel is a representation of starlight result fits, pixel-by-pixel. The second panel is the starlight fit obtained on the raw data pre-processed with Voronoi tessellation to account for low S/N spaxels from PyCASSO9 (de Amorim et al. 2017). Voronoi tessellation is a division of the space into cells that contain all points equidistant to the nearest sites. The third and fourth panels are two results from BaTMAn (Casado et al. 2017). BaTMAn is a more general Bayesian segmentation approach that partitions a plane based on similarities in one or more characteristics. Here we use it in its simplest form by finding similarities in the starlight age maps. So, as opposed to the PyCASSO example, the segmentation is performed after the fit. Finally, the last column shows INLA’s prediction on the output age map of starlight.
The traditional approaches, such as the PyCASSO tessellation prior to the fit, erase a significant fraction of the spatial information and average the physical properties over large areas. INLA, on the other hand, does not a priori reduce the spatial resolution, since it constructs a model based on the data. In the case of the segmentation-based fit with BaTMAn, the number of the resulting cells of the spatial map can vary depending on user-selected parameters (we show two examples in Fig. 4); but we note that it can never reach a resolution as high as the original pixel-to-pixel starlight fit; and it does not have the capacity of estimating values in regions without data. An innovation of BaTMAn is its capability to include more than one dimension (i.e. one parameter) in the partition of cells. Although not addressed in this work, given the hierarchical structure of our model (equation 3), it can be easily extended to include multiple covariates, and the correlations among them.

Comparison of different spatial algorithms for NGC 0309 (CALIFA K0034) age maps. From left to right: starlight map obtained pixel-by-pixel, PyCASSO (i.e. starlight on a previous tessellated input image), BaTMAn segmentation with two different priors affecting the tessellation regions (1781 and 3626 cells) after the starlight fit, a Gaussian smoother with an RBF kernel, and INLA model after the age fit.
Fig. 4 clearly indicates qualitatively that traditional segmentation techniques are not capable of including spatial correlations consistently. They operate on a trade-off between a gain in S/N at a significant cost of lowering the spatial resolution of the data. In contrast, INLA generates a self-consistent spatial model that interrelates neighbouring information by considering a spatial correlation matrix. In principle, one could envisage extreme scenarios where it could become advantageous to use both types of algorithms: if there are very large regions where no fit is feasible because of extremely low S/N, a preliminary segmentation could be beneficial for a first fit to constrain the prior distributions; these would then be used during the posterior reconstruction of the final fit with INLA. However, given the loss of spatial information in the binning algorithms, this type of procedure should only be recommended in the most extreme cases. In addition, we also provide a comparison against a simple Gaussian smoother with an RBF kernel using the r package fields (Nychka et al. 2015). A visual inspection confirms that our approach outperforms a naive interpolation.
6 FURTHER POTENTIAL
Although it is out of the scope of this work to provide an exhaustive list of the model capabilities, we discuss below some scenarios in which these techniques can be valuable. This section provides three potential applications of our approach: (i) construction of probabilistic maps of galaxy properties; (ii) prediction of undersampled or missing regions (inpainting); (iii) shared reconstruction of multiple fields.
6.1 Probabilistic maps
The probabilistic nature of the Bayesian spatial model enables the production of credible maps of galaxy properties for a given range of astrophysical interest. This is simply done by integrating the posterior over the interval of choice. Fig. 5 highlights three regimes of ages for NGC 0309: log (t[yr]) ≥ 9.5, 9.3 > log (t[yr]) ≥ 9.0, and log (t[yr] < 8.9, which are chosen to match regions between three quantiles of the mean age map shown in Fig. 2.
![Probability maps of NGC 0309 for three ranges of age, log (t[yr]), arranged anticlockwise: log (t[yr]) > 9.5, 9.3 > log (t[yr]) > 9.0, and log (t[yr] < 8.9. The bins were chosen to represent bottom ($\lt 2.5{{\ \rm per\ cent}}$), middle ($32\!-\! 68{{\ \rm per\ cent}}$), and top ($\gt 97.5{{\ \rm per\ cent}}$) quantiles of the reconstructed population age map (see Fig. 2).](https://oup.silverchair-cdn.com/oup/backfile/Content_public/Journal/mnras/482/3/10.1093_mnras_sty2881/2/m_sty2881fig5.jpeg?Expires=1750378954&Signature=062H7PhGYbymZDVGaF9VfDm2aYMQSbx2BGm4a6f73tT2htK2Z~PBnuWgwMTthHgkKpyxmF9ZQN3H48hM2pNvZHXPmh4WOQ~SJMp9SKYJn4wfCFQcnBH-spyn0BV0sH~3zN65JWm2l6lBx3efxbQvtxL2CSJKa1pGCSkD18MHpzJdLhnrZOfq9nHybp6KNcUC~AgpnbPq6OKLlsVjSbffh~VM8Ye47IqwBZtUvi0o9fLR5HINsbTXhuXED7fIZHEZRFn~aMfJSZTtyPv3sn2R~okAD6FgGVsVCCsxUGAOlCi1ItzcldwFbo2BWjLLvuNn4iRMQ5MDrcVyRLgD7UHsWA__&Key-Pair-Id=APKAIE5G5CRDK6RD3PGA)
Probability maps of NGC 0309 for three ranges of age, log (t[yr]), arranged anticlockwise: log (t[yr]) > 9.5, 9.3 > log (t[yr]) > 9.0, and log (t[yr] < 8.9. The bins were chosen to represent bottom (|$\lt 2.5{{\ \rm per\ cent}}$|), middle (|$32\!-\! 68{{\ \rm per\ cent}}$|), and top (|$\gt 97.5{{\ \rm per\ cent}}$|) quantiles of the reconstructed population age map (see Fig. 2).
A visual inspection clearly discriminates the locus of higher probability to find old stellar populations, concentrated around the bulge of the galaxy, in contrast to younger populations, more likely to be found as one moves radially outwards from the centre. Although expected, the formalism allows us to place probabilistic intervals on this physical statement. For instance, that stellar populations within 500 pc (∼5 pixels) from the centre are older than 109.5 yr with a 95 per cent probability.
6.2 Missing data
The presence of missing data is ubiquitous in astronomical data sets, either due to data corruption or due to the impossibility of acquiring a large number of telescope-time expensive observations.
One common scenario of data corruption is the presence of bad pixels in photon detectors. Other common situations are the need to interpolate over regions under the presence of contaminant signals: cosmic rays; foreground stars; the Milky Way foreground emission; artificial satellite and space-debris tracks; complex background patterns, etc. Inpainting methods are widely adopted to address these issues, from simple local interpolation (e.g. van Dokkum 2001) or averaging over multiple exposures (e.g. Gruen, Seitz & Bernstein 2014; Desai et al. 2016) to sparsity-based signal reconstructions (e.g. Rassat, Starck & Dupé 2013; Wallis, Wiaux & McEwen 2017). A key advantage of hierarchical Bayesian models is the natural handling of missing data.10
Another important missing data scenario emerges when obtaining spatially resolved data as high-resolution spectra or kinematic measurements for resolved objects (e.g. Local Group galaxies, molecular clouds, and star-forming regions, Solar system planets, etc.) is telescope-time expensive. In such situations only a few parts of the object are usually observed and analysed, and thus some kind of spatial interpolation of the derived properties is performed (e.g. van der Marel & Sahlmann 2016). In another scenario it may be necessary for an astronomer or near-future semi-autonomous instruments or surveys to take on-the-fly decisions during the night about which region of a given object needs more observations, or even if a given observation should continue based on incomplete and noisy information.
Here we exemplify a result of the application of INLA to inpainting missing data, up to very sparse data regimes, by considering spatial correlations. To emulate this scenario we first randomly remove 25, 50, 75, and 95 per cent of the information from the starlight analysis of the individual IFU spaxels. Afterwards we adopt INLA to infer the underlying field, in the worst-case scenario, preserving only 5 per cent of the original property map pixels. Figs 6 and 7 show the input data and results obtained from the field reconstructions for the age and EW(H α) fields of NGC 0309. The figures clearly show that since the physical processes are spatially correlated in the observed galaxies, the INLA model is capable of reconstructing most structures of the underlying fields even when the vast majority of the data are missing. It is remarkable that in the case of both properties the majority of the large-scale structures, and also a considerable fraction of the small-scale structures, were reconstructed even in the worst-case scenarios considered. Fig. 8 indicates that INLA reconstructions become less accurate (with respect to the reconstruction using 100 per cent of the data) with more missing data, as expected. However, the associated estimated uncertainties also increase, therefore the method provides conservative predictions.
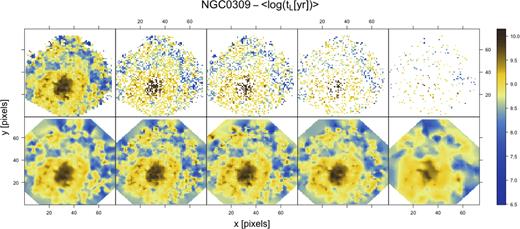
Predictions from INLA for input starlight age of NGC 0309 when 100, 75, 50, 25, and 5 per cent of the data are used. Upper panels show the starlight input and the bottom panels the INLA prediction.
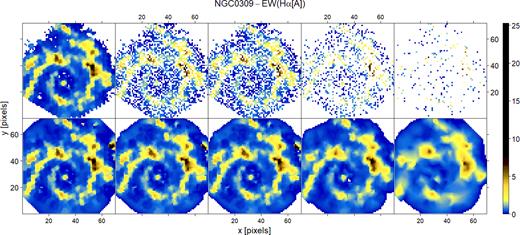
Same as Fig. 6, but for H α EW retrieved from Gaussian line profile fits.
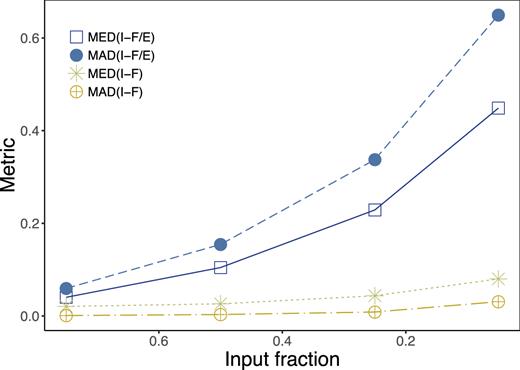
Comparison of INLA predictions between full and fractional input age maps of NGC 0309 for different metrics: (a) the median of the squared differences between full and fractional prediction divided by the variance estimated by INLA (open square), (b) the median absolute deviation (MAD) of the squared differences divided by the error (solid circle), (c) the median of the raw squared difference without dividing by the error (asterisk), and (d) the MAD of the raw squared difference without dividing by the error (crossed circle).
We also perform a test of the INLA reconstruction at low signal-to-noise data. For this, we disturb the original H α map of NGC 0309 according to a decreasing S/N ratio of 10, 2, 1, 0.5, and 0.3. Fig. 9 shows the input maps and the corresponding predicted INLA maps. These are reasonably consistent with the original high-signal map, recovering many features even at very low S/N regimes, and without the need for spatial binning.
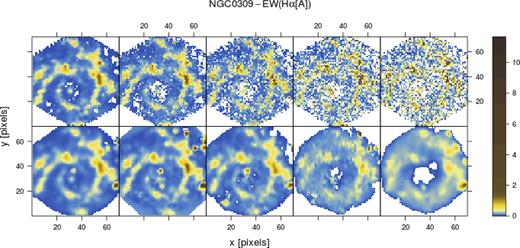
Predictions from INLA for H α EW map of NGC 0309 with S/N of 10, 2, 1, 0.5, and 0.3 (left to right). Upper panels show input and bottom panels INLA predictions. Note that the white pixels in the input data represent cases where the perturbed values in the simulation go below zero (i.e. these are points where the fitting procedure would not have converged).
6.3 Multiple pointings
In many cases the astronomical object of interest is larger than the instrument field of view. This is the case of nearby extragalactic objects (e.g. Boyce et al. 2017), galaxy clusters (e.g. Guérou et al. 2015), galaxy mergers (e.g. Consolandi et al. 2017), and of the wide-field IFU surveys (e.g. Bacon et al. 2017; Herenz et al. 2017). More locally, multiple-pointing and individual observations are also used to study the interstellar medium (e.g. Wendt et al. 2017), molecular clouds and star-forming regions (e.g. Mc Leod et al. 2016; Großschedl et al. 2017; Meingast, Alves & Lombardi 2018), and correlated stellar structures within the Milky Way, as arms and other large structures like stellar streams encompassing several degrees. At the limit case, if the data are spatially correlated in the object under study it would be possible to adopt multiple pointings of a normal spectrograph, and not an IFU, to acquire non-spatially resolved spectral data and afterwards adopt INLA to infer the spatially resolved map – this is in fact an extreme state of missing data.
If the data are spatially correlated, the reconstruction of the properties maps for such objects observed using multiple pointings of an instrument can gain significantly from the use of the INLA method. Fig. 10 shows as an example the age map of the M82 galaxy. The observations were obtained from three independent PMAS pointings due to the galaxy’s large angular size. The INLA reconstructed mean field shows a morphologically coherent estimation of the age map across the regions of data overlap, and that also even at extrapolated regions between pointings (the upper corners of the hexagonal FoVs). Naturally, the field of estimated uncertainties from the INLA posteriors also shows that the inference suffers at regions that are distant from the data, since the inference process lacks constraints. Moreover, this reconstruction exemplifies that INLA can provide a methodology for situations where only piecewise observations/data are available. In this particular case, instead of performing independent stellar population analysis for each pointing, it is possible to join the information into a single spatially resolved study of the object.
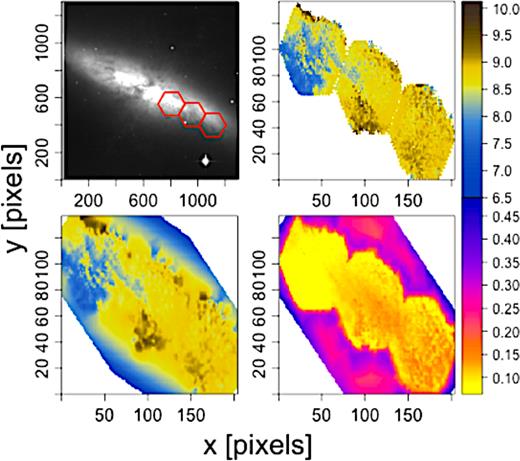
Image of M82 in R band (Dale et al. 2009) with three PMAS pointings superimposed in red (top left) from which starlight ages were obtained (top right), the respective INLA reconstruction (bottom left), and the INLA standard error of the posterior mean estimate (bottom right).
7 DISCUSSION AND CONCLUSIONS
Making reliable inferences from IFU data is paramount for better exploitation of the spatial information encoded on these data sets. Regardless if these correlations are physical or caused by instrumental effects.
Hierarchical Bayesian models provide the means to model these spatial properties conveying information about the probability distribution of the variable under study combined with their spatial structure. An immediate advantage is the possibility to predict undersampled pixel locations, thereby naturally accommodating missing data, bad pixels, and irregular sampling.
This work introduces the potential of spatial models via INLA for astronomers through the analysis of IFU cube data. The methodology assumes the galaxy properties as realizations of a random field. The model is implemented into a spatial Bayesian framework, in which INLA is used for fast inference.11
We analysed the entire CALIFA and PISCO samples by first running a pixel-by-pixel starlight fit, from which we obtained the following parameters: luminosity- and mass-weighted age and metallicity, stellar mass, and extinction.
We focused on two example galaxies: one elliptical and one spiral. We show that by taking into account the spatial correlations of the data in the reconstructions of spatial maps of galaxy physical properties, it is possible to recover structures in the output maps that are hidden or barely distinguishable in simple renderings of the individually fitted properties.
We provided a comparison of our approach against existing techniques that treat spatial information in IFU cubes, namely segmentation techniques like Voronoi binning used in PyCASSO and the multidimensional cell partition of BaTMAn, for the same galaxy. Although different in nature, we find clear advantages of using spatial modelling via INLA if spatial correlation exists in the data, which is expected to be the case for any spatially resolved astronomical object.
The model is capable of dealing with highly sparse regimes. We challenged the method to analyse data-sparse regimes where up to 95 per cent of the information was missing. The method was capable of reconstructing most of the underlying large-scale spatial structure of the galaxy properties.
Although the main focus of this work was to provide a smooth representation of galaxy properties over an irregular and noisy grid, the potential of spatial models is much wider. More complex structures can be seamlessly adapted including spatio-temporal dependences, multivariate maps, non-Gaussian properties (e.g. Nelder & Wedderburn 1972; de Souza et al. 2015a; Elliott et al. 2015; de Souza et al. 2016), and so forth. Examples of potential follow-ups are: probing the prevalence of active black holes in terms of local environment; the connection of supernova properties and their host galaxies and surroundings; to test spatial systematics in Gaia data; or for fast generation of mock data sets of spatially resolved galaxies for specific instrumental/observing conditions and redshifts of interest.
This work provides a glimpse of broad field of Bayesian spatial modelling and takes a step forward in the statistical analysis of astronomical IFU data. It provides a contemporary approach for field reconstruction of galaxy properties, and a test bed for other applications (interferometry, cosmic microwave background, N-body simulations), in which spatial information cannot be neglected.
ACKNOWLEDGEMENTS
We thank the referee for the thorough comments. This work is a product of the |$\rm 4{th}$| COIN Residence Program (CRP#4). We thank Emmanuel Gangler for encouraging the accomplishment of this event. CRP#4 was held in Clermont Ferrand, France on 2017 August, with support from the Université Clermont Auvergne and the Région Auvergne-Rhône-Alpes. SGG and AKM acknowledge the support from the Portuguese Strategic Programme UID/FIS/00099/2013 for CENTRA and the FCT projects PTDC/FIS-AST/31546/2017. RSS acknowledges the support from NASA under the Astrophysics Theory Program Grant 14-ATP14-0007. AKM acknowledges the support from the Portuguese Fundação para a Ciência e a Tecnologia (FCT) through the grant SFRH/BPD/74697/2010 and the ESA contract AO/1-7836/14/NL/HB. EEOI acknowledges support from CNRS as part of its MOMENTUM programme over the 2018–2020 period. LG is supported in part by the US National Science Foundation under Grant AST-1311862. The starlight project is supported by the Brazilian agencies CNPq, CAPES and FAPESP and by the France-Brazil CAPES/Cofecub program. This work has made use of the computing facilities of the Laboratory of Astroinformatics (IAG/USP, NAT/Unicsul), whose purchase was made possible by the Brazilian agency FAPESP (grant 2009/54006-4) and the INCT-A. This project has been supported by a Marie Skłodowska-Curie Innovative Training Network Fellowship of the European Commission’s Horizon 2020 Programme under contract number 675440 AMVA4NewPhysics. The Cosmostatistics Initiative12 (COIN) is a non-profit organization whose aim is to nourish the synergy between astrophysics, cosmology, statistics, and machine learning communities. COIN thanks the support from Overleaf13 collaborative platform.
Footnotes
A spaxel is a spectral pixel, i.e. every spatial pixel has an associated spectrum. In this work we use the terms pixel and spaxel interchangeably.
From an instrumental viewpoint, fibre-bundle IFUs normally have gaps between fibres, so that usually 2–3 dithered observations are carried out to cover the gaps. Each reduced spaxel therefore contains data from different fibres, thus inducing an instrumental correlation among contiguous spaxels (García-Benito et al. 2015).
The OU process is the continuous analogue of the discrete autoregressive model (see e.g. Hilbe et al. 2017, chapter 10.10), and is a particular case of a Gaussian process with bounded variance and stationary probability distribution.
Although this is not a universal consensus; see Taylor & Diggle 2012 for a dissenting view with regard to modelling Poisson processes.
Intuitively, it assumes that a raw estimate (within pixel) can be improved by combining it with other information (inter-pixel).
Also applicable to data-sparse regimes due to shrinkage effects (e.g. de Souza et al. 2015b).
To the authors' best knowledge this is the first utilization of INLA in astronomy.


