


ABSTRACT
We have determined the H α emission line radial profiles for a sample of 86 face-on galaxies observed in the Calar Alto Legacy Integral Field Area (CALIFA) survey and analysed with the pipe3d pipeline. From a visual analysis we propose a two-step classification of these profiles. Initially, they were divided in two classes with respect to the maximum of the H α emission: C (for central) profiles have the maximum line emission at the galaxy centre, whereas EX (for extended) profiles have the maximum H α emission outside the galaxy centre. After, we divided the C galaxies in two classes, CE and CL (where E and L stand here for ‘early’ and ‘late’), through the value of cr, the concentration index in the r band. We analysed the profile class dependence of several galaxy parameters, as well as examined the nature of line emission through the Baldwin–Phillips–Terlevich (BPT) diagram. We notice that almost 75 per cent of the sample is in the C class. Elliptical and S0 galaxies dominate the CE class, with spiral galaxies being found mostly in the CL and EX classes. We also notice that spirals in each of these classes have different properties, with CL objects seeming less evolved than those in the EX class.
1 INTRODUCTION
The study of emission lines provides a powerful way to investigate a large variety of physical processes occurring in galaxies. This is particularly true for H α, which is often one of the most prominent lines in the optical interval. Indeed, star formation may produce a powerful H α line emission from recombination in nebular regions ionized by the radiation field of young, massive stars (e.g. Osterbrock & Ferland 2006), and the flux of this line is often used as an indicator of the star formation rate (Kennicutt 1998; Cid Fernandes et al. 2005; Calzetti 2013; Madau & Dickinson 2014). But other sources than star formation can also ionize the gas and lead to H α emission, like nuclear activity driven by active galactic nuclei (AGNs), where the ionizing photons are produced in an accretion disc around a massive black hole (Véron-Cetty & Véron 2000), or shocks in the gas (Dopita 1995; Alatalo et al. 2016).
In some cases the origin of the emission is not clear, as is the case of the low-ionization nuclear emission-line regions (LINERs). This terminology was introduced by Heckman (1980) for objects with emission lines with widths similar to that found in Seyfert galaxies but showing lower excitation when compared to those galaxies. Later, Trinchieri & di Serego Alighieri (1991) and Binette et al. (1994) proposed that, instead, the LINER emission could originate through ionization by evolved stars, like post-asymptotic giant branch (AGB) stars or white dwarfs. Cid Fernandes et al. (2010) have argued that many galaxies with weak LINER-like emission lines could be retired galaxies, where the star formation ceased and that are now being ionized by old stars. The introduction of integral field studies helped to clarify this issue by showing that the LINER emission in some galaxies is actually extended and cannot be produced by nuclear activity alone (e.g. Singh et al. 2013; Ricci, Steiner & Menezes 2014; Belfiore et al. 2016).
Many studies on the morphology of the H α emission were carried out aiming to derive structural or kinematical properties of the galaxies or of the gas emission. Karachentsev & Kaisin (2010) investigated the H α emission for the Local Volume, finding evidence of stellar formation in early-type objects both in knots and in the central regions, interpreting it as indication of accretion of intergalactic gas. Nelson et al. (2012) compared spatially resolved maps in H α with maps of the continuum in the R band for a sample of |$z$| ∼ 1 star-forming galaxies, showing that although both the maps are quite similar, H α emission is more extended and more clumpy than the continuous emission. Gavazzi et al. (2018) analysed a sample of 147 early-type galaxies (ETGs) from the ATLAS3D survey (Cappellari et al. 2011) and found that 37 per cent of them exhibited some emission in H α, with about 14 per cent of them exhibiting relatively strong emission, produced mainly by low-mass S0 with stellar and gaseous fast rotating discs.
Since H α emission (and its luminosity) is an important proxy for both nuclear activity and formation of stars, spatially resolved maps of H α may provide important information about ionization mechanisms, star formation rates, mass assembly, and other galaxy properties. The advent of integral field spectroscopy surveys, like ATLAS3D (Cappellari et al. 2011), Sydney-AAO Multi-Object Integral Field Spectrograph (SAMI) Galaxy Survey (Croom et al. 2012), Calar Alto Legacy Integral Field Area (CALIFA; Sánchez et al. 2012), and Mapping Nearby Galaxies at Apache Point Observatory (MaNGA; Bundy et al. 2015), enabled the investigation of the spatially resolved properties of galaxies and their relation to processes influencing the formation and evolution of galaxies, like quenching. With spatially resolved data it is possible to study the radial dependence of star formation histories (Pérez et al. 2013; de Amorim et al. 2017; García-Benito et al. 2017; Goddard et al. 2017; González Delgado et al. 2017) or evaluate star formation rates inside galaxies, both locally and globally (Cano-Díaz et al. 2016; González Delgado et al. 2016; Kokusho et al. 2017; Medling et al. 2018).
The morphology of the H α has often being addressed via the distribution within a galaxy of the star formation rate or other star formation indicators. As part of a series of studies on the star formation morphology in galaxies of the Virgo Cluster, Koopmann, Kenney & Young (2001) analysed Rband and H α images, radial profiles, integrated fluxes, and concentration indices to establish links between the H α morphologies of Virgo Cluster spiral galaxies and the types of interaction(s) that may have affected them. These authors proposed a set of classes (combinations of normal, enhanced, anaemic, and truncated) to describe the global galaxy star formation morphology. Analysing a small sample of galaxies in the MaNGA prototype run (P-MaNGA), Li et al. (2015) classified the radial profiles of their three diagnostic parameters (Dn4000), EW(Hδ), and EW(H α)) as either ‘centrally quiescent’ or ‘centrally star forming’. Recently, Spindler et al. (2018) investigated the spatial distribution of star formation in a large sample of galaxies of the MaNGA survey (Bundy et al. 2015), revealing the existence of two groups of galaxies, which they named ‘centrally suppressed’ and ‘unsuppressed’ regarding the radial distribution of their specific star formation rates. Analogously, Medling et al. (2018) studied the resolved star formation of a sample of galaxies in the SAMI survey, also finding a split between galaxy populations with centrally concentrated star formation and those with flatter star formation profiles.
In this paper, we consider the classification of H α emission radial profiles for a sample of 86 almost face-on CALIFA survey galaxies. We focus on H α to avoid, in the classification stage, discriminating between emission due to star formation, AGN, or old stars. We propose an objective procedure where we first divide galaxies in two classes – those where the peak of the H α emission is in the galaxy centre and those where this peak is outside the centre and, after, we divide the galaxies in the first group in two by using the light concentration in the r band to take in to account in this classification the bimodal nature of the galaxy population. Indeed, in the local Universe, a bimodality is present in many galaxy properties, such as colours and stellar formation rates (Strateva et al. 2001; Baldry et al. 2006; Martínez, O’Mill & Lambas 2006; Zibetti et al. 2017; Nelson et al. 2018), by which they can be separated into two large groups, early-types and late-types. Early-types comprise essentially elliptical and lenticular galaxies with old stellar populations, red colours, high masses, and almost none star formation (Trager et al. 2000; Conselice 2006; van Dokkum & van der Marel 2007). In contrast, late-type galaxies are mostly spirals (with and without bars) and irregulars galaxies, characterized by younger populations, blue colours, lower stellar masses, and active star formation, when compared to early-type galaxies (Bell et al. 2003; Mateus et al. 2006). We also investigate whether our profile classification is correlated with other galaxy parameters or properties, in particular those inferred from population synthesis. The analysis of stellar populations through galaxy spectral synthesis (e.g. Tinsley & Gunn 1976; Tinsley 1980; Leitherer et al. 1999; Bruzual & Charlot 2003; Cid Fernandes et al. 2005) allows to determine properties such as mean stellar ages, metallicity, stellar mass, and star formation history that are useful to characterize the galaxies. Additionally, morphological types, brightness profiles (de Vaucouleurs 1948; Sérsic 1963), and also concentration parameters have been shown to relate to many physical features of galaxies or of their galaxy populations (Okamura, Kodaira & Watanabe 1984; Graham, Trujillo & Caon 2001; Strateva et al. 2001; Abraham, van den Bergh & Nair 2003; Conselice 2014).
This paper begins with a description of our sample in Section 2. There we describe some relevant details of the CALIFA survey, the pipe3d pipeline, and how we deal with the dust extinction. In Section 3, we explain the structural and physical parameters used here, as well as the procedure to determine and classify the radial H α profiles. Section 4 presents a comparative study between the profile classes and other physical parameters. In Section 5, we discuss these results, making clear the relations between profile classes and galaxy properties. Section 6 summarizes the work presented here.
2 DATA
The galaxies analysed in this work were selected from the CALIFA survey, with data cubes treated by the pipe3d pipeline, both briefly described below. Additionally, we present our procedure to correct the H α emission for dust attenuation, as well as the criteria adopted to select the final sample.
2.1 The CALIFA sample
The CALIFA (Sánchez et al. 2012) survey, in its second release (García-Benito et al. 2015), observed 200 galaxies of all Hubble types in the nearby Universe. The galaxy sample of this survey was selected from the Sloan Digital Sky Survey (SDSS) Data Release 7 (DR7) photometric catalogue (Abazajian et al. 2009), with constraints on isophotal diameter (45 < D25 < 80 arcsec) and on the redshift range (0.005 < |$z$| < 0.03).
The objects were observed with the integral field spectrograph (IFS) Potsdam Multi-Aperture Spectrophotometer (PMAS)/PPak mounted on the 3.5-m telescope at the Calar Alto Observatory and with two different spectral set-ups for each galaxy: a V500 grating with low resolution (λ/Δλ = 850 in 5000 Å) in the wavelength range 3745–7500 Å, and a V1200 grating with medium resolution (λ/Δλ = 1650 in 4500 Å) in the wavelength range 3400–4750 Å. A more complete description of the CALIFA survey can be found in Walcher et al. (2014).
2.2 PIPE3D
pipe3d (Sánchez et al. 2016a,b) is an analysis pipeline developed to extract information from IFS data cubes of surveys like CALIFA, MaNGA, and SAMI (Croom et al. 2012; Sánchez et al. 2012; Bundy et al. 2015).
pipe3d depends on a spectral synthesis tool (fit3d; Sánchez et al. 2016a) and comprises the GSD156 library of simple stellar populations (Cid Fernandes et al. 2013), with 156 templates covering 39 stellar ages (from 1 Myr to 14.1 Gyr), and four metallicities (Z/Z⊙ = 0.2, 0.4, 1, and 1.5). All the steps used to obtain the data products are well explained in Sánchez et al. (2016a,b).
In this work we have started by using the results of pipe3d for 200 galaxies from CALIFA/DR2 (García-Benito et al. 2015), with the V500 set-up. From the many data products obtained with pipe3d, we used in our analysis the Hβ, [O iii] λ5007, H α, and [N ii] λ6583 emission lines maps, all of them in units of 10−16 erg s−1 cm−2.
2.3 H α maps: source and dust attenuation
2.4 Our sample
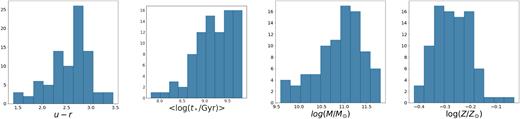
From the 200 galaxies observed in CALIFA/DR2, we selected nearly face-on objects, i.e. those with ellipticity ε < 0.35 in the V band (see next section). Our final sample contains 86 galaxies of different morphological types, which we divided in three morphological classes as shown in Table 1. This sample covers a range of physical properties typical of those found in bright galaxies in the local Universe: it has colours in the interval 1.4 < u − r < 3.4, mean stellar ages in ∼107.8 < t* (yr) < 109.8, stellar masses in ∼109.5 < M*/M⊙ < 1011.8, and metallicities in −0.4 < log (Z/Z⊙) < −0.03. Fig. 1 shows the distribution of these properties for the 86 galaxies in the sample. Table B1, in Appendix B, summarizes relevant properties for each galaxy.
Some properties of the galaxy sample discussed in this paper, composed of face-on galaxies from CALIFA/DR2.
Morphological classes of our sample, with the respective Hubble types and number of objects.
| Morph. class | Hubble type | # |
|---|---|---|
| ES0 | E0–E7, S0 | 30 |
| Searly | Sa, Sab, Sb | 23 |
| Slate | Sbc, Sc, Scd, Sd | 33 |
| Morph. class | Hubble type | # |
|---|---|---|
| ES0 | E0–E7, S0 | 30 |
| Searly | Sa, Sab, Sb | 23 |
| Slate | Sbc, Sc, Scd, Sd | 33 |
3 ANALYSIS
In this section, we describe some morphological estimators for the V-band emission and our definitions of the concentration of the H α emission. We also show how we measured the H α emission profiles and present a procedure for their classification.
3.1 Morphological and structural parameters
Image moments are useful for obtaining the major and minor semi-axes a and b, the ellipticity ε, the inclination angle θ, and the mean radius |$\bar{R}$| of the ellipse that fits the image of a galaxy. We apply the moments of the image in the V-band map reconstructed by pipe3d of each galaxy, so that the flux F(xi, yi) and all the derived (ellipse) parameters are in V band. The moments were calculated using all pixels with positive fluxes.
Since we have galaxies of different sizes, it is convenient to normalize the scales (and in particular the major semi-axis) of each galaxy by its effective radius, Re(V), which is defined as the radius that comprises half of the V-band galaxy’s flux.
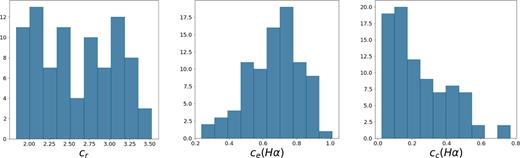
Distribution of the concentrations cr, ce(H α), and cc(H α) for the galaxies in the sample.
3.2 Radial profiles of H α
In this section, we discuss, initially, our procedure to obtain radial H α profiles and, after, the criteria we adopted to classify them in to three classes.
We sorted these radii and binned them in 50 radial bins with approximately the same number of pixels, and computed for each of these bins the mean value of the H α emission. We then built the H α radial profile of each galaxy by plotting the mean flux in each bin as a function of the bin radius.
The resulting profiles are shown in Figs A1–A3 in Appendix A. From visual inspection, we first point out that they can be divided in two broad classes with respect to the maximum H α emission: those with maximum emission at the galaxy centre, which we designate as C (for central) profiles, and those where the peak of the emission is outside the galaxy centre, which we designate as EX (for extended) profiles. This is somewhat analogous to the two classes centrally quiescent and centrally star-forming of Li et al. (2015) or the unsuppressed and centrally suppressed classes discussed by Spindler et al. (2018). Fig. 3 shows the distribution of the radius of maximum emission RME for our sample. There are 63 and 23 galaxies of our sample in classes C and EX, respectively.
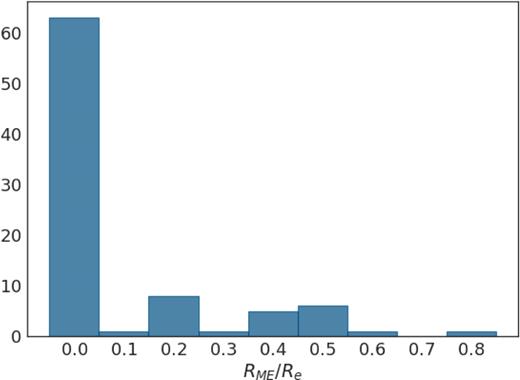
The distribution of the radius of maximum H α emission, RME, for our sample. For almost 3/4 of our sample the maximum emission is in the galaxy centre.
A visual examination of C profiles shows that they comprise a variety of behaviours, from those where most of the H α emission indeed comes from the centre, to those where a significant fraction of this emission comes from more external regions of the galaxy. Fig. 4 shows the distribution of the concentrations ce(H α), cc(H α), and cr for the C and EX profile classes. From the examination of this and other figures, we decided to divide the C profiles in two subclasses, with respect to the cr concentration. Indeed, Strateva et al. (2001) have shown that this quantity is useful to discriminate between the red and blue galaxy populations, with cr = 2.63 providing a divisory line. We then define the CE class as that containing early-type objects with C profiles, i.e. those with cr > 2.63, whereas the CL class comprises late-type galaxies (cr < 2.63) with C profiles. From several tests, we verified that subclassification of C profiles with cr provides a more sensible classification than using the other concentrations, ce(H α) and cc(H α). Our sample has 36 and 27 galaxies in classes CE and CL, respectively.
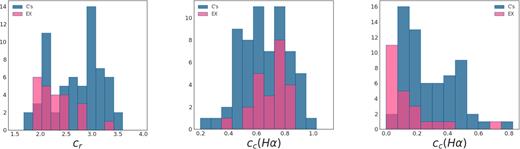
Distribution of the concentrations cr, ce(H α), and cc(H α) for the galaxies in the sample.
Fig. 5 shows the result of this profile morphological analysis. The figure shows H α profiles separated by these three classes, as well as the profile with median cr of each class. In general, CE profiles present most of the emission coming from the galaxy centre, without relevant emission outside the central region; CL profiles tend to be more extended, indicating H α emission spread over larger radii. For type EX profiles, by definition most of the emission comes from regions outside the galaxy centre, in one or more bumps.
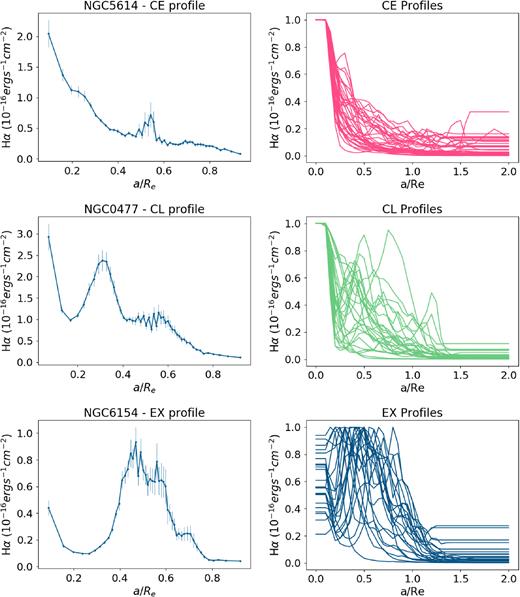
Examples of the three H α profile types. From top to bottom: CE, CL, and EX profiles. The left-hand panels show a typical profile (that with the class median cr), whereas the right-hand panels show all profiles of a given type together, normalized by their maximum H α emission.
4 RESULTS
In this section, we present some consequences of our profile classification, arguing that it is indeed meaningful, by examining relations between the profile types and other galaxy parameters: morphological classes, concentration measurements, and stellar population parameters. Finally, we use diagnostic diagrams to determine the origin of the H α emission.
4.1 Relations with morphological types and concentrations
We start by investigating whether the profile types are related to the galaxy morphological classes. A simple χ2 test of the contingency table of morphological classes and profile types, Table 2, leads to χ2 ≃ 53, with a p-value = 8.5 × 10⁻¹¹, indicating that the profiles and the morphological classes are not independent. Fig. 6 shows the proportion of each morphological class for each profile type. Considering C profiles, our two classes discriminate well between the ES0 (mostly in the CE class) and S groups (mostly in the CL class). EX profiles are mostly composed of spiral galaxies. On the other side, the S_early and S_late groups are both numerous in CL and EX profile types.
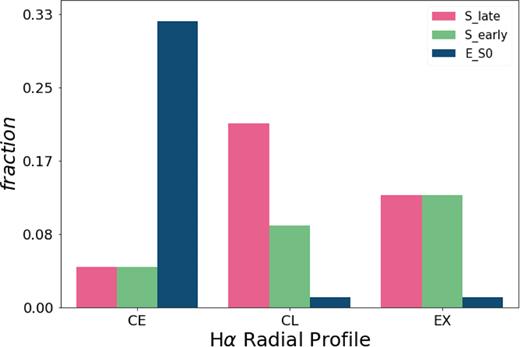
Fraction of morphological classes in each of the H α profiles’ type.
Contingency table for the H α profiles and morphological classes, where we show the number of galaxies in each profile and morphological class.
| CE | CL | EX | |
|---|---|---|---|
| ES0 | 28 | 1 | 1 |
| Searly | 4 | 8 | 11 |
| Slate | 4 | 18 | 11 |
| CE | CL | EX | |
|---|---|---|---|
| ES0 | 28 | 1 | 1 |
| Searly | 4 | 8 | 11 |
| Slate | 4 | 18 | 11 |
By analysing the CL profiles in Fig. A2 individually, it may be noticed that |${\sim }75{{\ \rm per\ cent}}$| of the objects have at least a second H α emission peak along the galaxy’s extension, probably coming from star formation in the disc of these objects. Since CL profiles are dominated by spiral galaxies, both Searly and Slate, it is reasonable to associate these secondary H α emission peaks to star-forming arms or rings in the body of the galaxy. In contrast, when we examine ES0 objects classified as CL and EX (NGC 1349 and NGC 5784, respectively), we notice that they also have emission peaks outside the centre. As Gomes et al. (2016) argue, these early-type galaxies present evidence of recent stellar activity, showing that not all early-type galaxies are actually quenched.
The relation between concentrations and the three types of H α profiles is shown in Fig. 7 using violin diagrams (which depict the range of values and the probability of variables). The mean value of the concentration cr is larger for type CE than for CL, by construction, and CL and EX types have similar cr values, corresponding approximately to the blue peak seen in the bimodal cr distribution in Fig. 2. The mean value of the central H α concentration decreases from CE to CL and to EX profiles. The effective concentration, which is in fact measuring how extended is the line emission in the galaxy, increases from CE to CL to EX. Table 3 presents the mean values of the concentration measurements for each profile type.
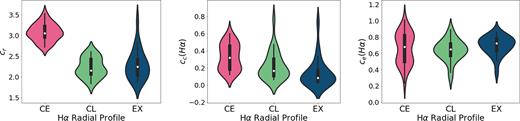
Distribution of concentrations cr, cc(H α), and ce(H α) with their mean value shown as a white dot inside the violin plot.
Mean value and standard deviation for the concentrations and stellar population parameters for the three types of H α profiles.
| Profile | cr | cc(H α) | ce(H α) | log(t*/Gyr) | log(Z/Z⊙) | log(M*/M⊙) |
|---|---|---|---|---|---|---|
| CE | 3.07 ± 0.03 | 0.33 ± 0.02 | 0.66 ± 0.03 | 9.49 ± 0.05 | −0.23 ± 0.01 | 11.15 ± 0.07 |
| CL | 2.22 ± 0.04 | 0.22 ± 0.03 | 0.64 ± 0.02 | 8.90 ± 0.07 | −0.29 ± 0.01 | 10.61 ± 0.10 |
| EX | 2.29 ± 0.07 | 0.14 ± 0.03 | 0.70 ± 0.02 | 9.12 ± 0.07 | −0.31 ± 0.01 | 10.80 ± 0.09 |
4.2 Stellar population properties
To investigate the relations of the H α profiles with the properties of stellar populations, we have also used the mean values of some stellar population properties – age, metallicity, and stellar mass – obtained from pipe3d, since these quantities are good tracers of other properties of galaxies (see Gallazzi et al. 2005, 2008; Peletier 2013; González Delgado et al. 2014; Zibetti et al. 2017, for some examples). The mean values for these quantities for each type of profile are shown in Table 3, whereas their violin diagrams, by H α profile types, are shown in Fig. 8.
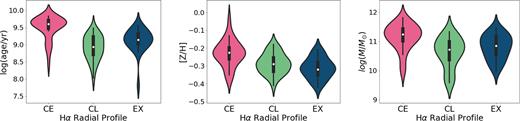
The violin plot for the stellar age, metallicity, and stellar mass and for each type of H α profile.
Considering only C types, the mean ages, metallicities, and masses are larger for galaxies with CE than with CL profiles; comparing CL and EX types, we notice that the latter seems to represent a population less evolved than the former, in the sense that their mean ages and metallicities are smaller for CL than for EX classes. Stellar masses in our sample are larger for CE than for CL types, and are larger for EX than CL types.
4.3 The source of H α emission
The next step in our analysis is to investigate the nature of the H α emission associated with each type of profile, if star formation, some kind of nuclear activity or both. For this we have made use of the Baldwin, Phillips & Terlevich (1981) BPT diagram. Fig. 9 presents BPT diagrams for each profile type. In the left-hand panels of this figure we show the mean BPT diagram for each galaxy of a given profile type, whereas in the right-hand panels we show this diagram separately for the internal (r < 0.2a, in red) and external (r > 0.2a, in blue) regions of galaxies, again separated by profile type. This figure also shows the empirical line proposed by Kauffmann et al. (2003) (where galaxies below it are classified as pure star-forming objects), the model line proposed by Kewley et al. (2001) (where galaxies above it are considered AGNs), and the line proposed by Schawinski et al. (2007) to discriminate between LINERs (below the line) and Seyfert galaxies (above the line). Any object between Kauffmann’s line and Kewley’s line is considered as an object in transition, with emission characteristics of both stars and AGNs.
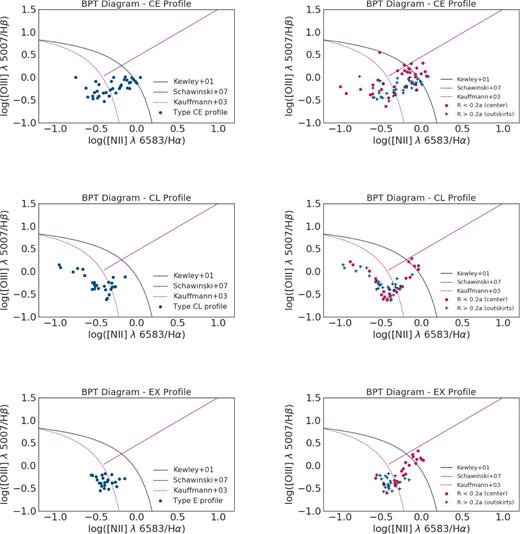
BPT diagram for galaxies in the sample. Left-hand panels show the diagram for galaxy mean emission line ratios of each type of H α profile. Right-hand panels present the BPT diagram for the different profile types separated by inner (in blue) and outer (in pink) regions, respectively.
The BPT diagram for the galaxies as a whole shows interesting trends with the H α profile. CE objects present emission coming from both the star-forming and transition regions, with just one galaxy in the LINER region of the diagram. The fraction of galaxies in the transition region decrease from type CE to EX to CL and, at the same time, the proportion of objects in the star-forming region increase. Galaxies with H α profiles of type EX in this panel are all close to the line proposed by Kauffmann et al. (2003), showing less scatter than the other profiles.
Panels at the right-hand side of Fig. 9 tell a more interesting story. Considering the central region of the galaxies (r < 0.2a, in red), type CE profiles have most of their galaxies, |${\sim } 47{{\ \rm per\ cent}}$|, in the transition region, |${\sim } 36 {{\ \rm per\ cent}}$| in the star formation region, and the other |$17{{\ \rm per\ cent}}$| coming from the LINER region of the BPT diagram. Profiles of type CL have |$63$|, |$22$|, and |$15{{\ \rm per\ cent}}$| of central region emission coming from star-forming, transition, and LINER regions, respectively. Galaxies with CL profiles in the star-forming region are distributed forming a tail towards low values of [N ii]/H α, suggesting that these objects have lower metallicity than the others in CE and EX classes. EX galaxies present a larger homogeneity in the distribution of central emission, with |$30$|, |$39$|, and |$30{{\ \rm per\ cent}}$| of their members in star-forming, transition, and LINER regions, respectively.
5 DISCUSSION
The H α emission is by far one of the most important tools to investigate galaxy properties. In this paper, through an analysis of a sample of CALIFA galaxies, we present a classification of the H α radial profile in three classes: CE, CL, and EX. The central profiles CE and CL have the peak of the line emission in the galaxy centre, whereas in EX profiles, the maximum H α emission is outside the centre. We found useful to distinguish two classes of central profiles (CE and CL), dominated by early- or late-type populations, accordingly with the value of the cr concentration (Strateva et al. 2001). The profiles’ types exhibit good relation with some structural and physical parameters such as concentrations and stellar population properties.
The first aspect to point out is that the large majority of our sample, ∼75 per cent, has central (C) profiles. Dividing this group by the cr value in early, CE, and late, CL, subtypes, we noticed that CE profiles are dominated by early-type galaxies, E and S0. Spiral galaxies in the CL class are mostly blue objects (in terms of the cr criterion), while the EX class contains the same fraction of blue and red late-type galaxies. In other words, most of the spirals with central profiles are blue galaxies, whereas those with an extended profile have a mix of red and blue objects. ES0 galaxies are less than 4 per cent of the CL and EX profile classes; early-type galaxies in these classes are probably objects still forming stars, not quenched yet (e.g. Gomes et al. 2016).
Concerning the H α concentration parameters, we have shown that the central concentration cc is indeed useful to describe the emission profiles: for central profiles, CE objects tend to have more H α emission in the central region than the CLs and EXs. The effective concentration does not show strong trends with the profile types, although it tends to be larger for EX profiles than for the others.
Stellar population properties also show trends with the profile types. Stellar populations are older for CE profiles. Comparing mean stellar ages for CL to EX profiles, we can verify that the latter presents older populations than the former. Mean metallicities decrease from CE to CL and to EX. These results indicate that CE profiles are more likely to be associated with early-type objects than CE and EX profiles.
The BPT diagram also presents significant differences between the three classes. Considering the mean value of the line ratios (left-hand panels of Fig. 9), the most striking difference is the large fraction of transition objects for CE profiles compared to the others, which have most of their galaxies in the star-forming part of the diagrams. When we consider the internal and external BPT diagrams, several interesting features appear. For all profiles the number of galaxies with LINER central emission increases. The same is true for objects in the transition region, at least for late types. For these galaxies, the large majority of the emission in the external regions seems to be due to star formation.
Indeed, the second aspect we consider important to highlight here is the difference in the properties of late-type galaxies in the CL and EX classes. EX objects have a significant fraction with central emission in the transition region, whereas for CL objects, the fraction where the emission can be ascribed to star formation is larger. Also, CL galaxies seem to have a larger range of physical properties (e.g. nebular abundances) than late types in the EX class. This seems to indicate that EX objects are more evolved than CL galaxies.
Our results support the findings of Li et al. (2015) and Spindler et al. (2018). The latter authors analysed star formation rate profiles from the SDSS-IV MaNGA survey, showing that they can be divided in ‘centrally suppressed’ and ‘unsuppressed’ star formation, in close association with our C and EX profiles. Our conclusions are in general agreement with theirs; they found that both centrally suppressed and unsuppressed galaxies have a bimodal distribution, whereas our EX galaxies are mostly blue. This is probably a consequence of our small sample size.
The classification procedure adopted here is objective and can be extended to other IFU-like observational data. We are interested in using this approach to investigate galaxy samples in the local Universe observed by the surveys Southern Photometric Local Universe Survey (S-PLUS; Mendes de Oliveira et al., in preparation), Javalambre Photometric Local Universe Survey (J-PLUS; Cenarro et al. 2018), and Javalambre Physics of the Accelerating Universe Astrophysical Survey (J-PAS; Benitez et al. 2014). Despite being photometric surveys, they are imaging large areas of the sky with a large number of narrow- and broad-band filters (12 for S-PLUS and J-PLUS, and 59 for J-PAS). They contain narrow filters centred on H α and it has been shown that the H α emission can indeed be reliably determined for nearby objects with the observational set-up of these surveys (Vilella-Rojo et al. 2015; Logroño-García et al. 2018).
6 SUMMARY
We have determined the radial profile of the H α emission for a sample of 86 face-on galaxies from the CALIFA survey. After visual examination, we classified these profiles in three classes, CE, CL, and EX, taking in to account the position of the maximum H α emission (in the galaxy centre or not), and for galaxies where the maximum of H α emission comes from the galaxy centre, if the dominant population is red or blue, by using the light concentration in the r-band, cr. Our results show that, for ∼75 per cent of the sample, the peak of the emission is in the galaxy centre.
Galaxy properties, like morphology, mean stellar ages, and metallicities, and the nature of the line emission, correlate well with these three classes. For example, most of the objects in the CE class are early-type galaxies. Late-type galaxies are spread between the CL and EX classes, with CL objects presenting features of a less evolved population when compared to the EX class.
The classification presented here helps to highlight the diversity of H α emission in the galaxies of the local Universe and its close links with properties usually adopted to describe the galaxy population.
ACKNOWLEDGEMENTS
PMN thanks the financial support from Brazilian funding agency CNPq (grant 142436/2014-3). She also thanks Rosa González Delgado, Enrique Perez, and Ruben García-Benito for useful comments. PMN also thanks the Instituto de Astrofísica de Andalucía (IAA/CSIC) and the Instituto de Astronomia, Geofísica e Ciências Atmosféricas (IAG/USP) for their warm scientific environment that made this work possible. LSJ acknowledges support of CNPq (304819/2017-4) and FAPESP (2017/237666-0) to his work.
REFERENCES
APPENDIX A: H α PROFILES
Figs A1–A3 show the H α profiles for each galaxy in each profile type. The profiles are normalized by the H α maximum, in units of |$10^{-16}\,\mathrm{ erg} \, \mathrm{ s}^{-1}\, \mathrm{ cm}^{-2}$|.
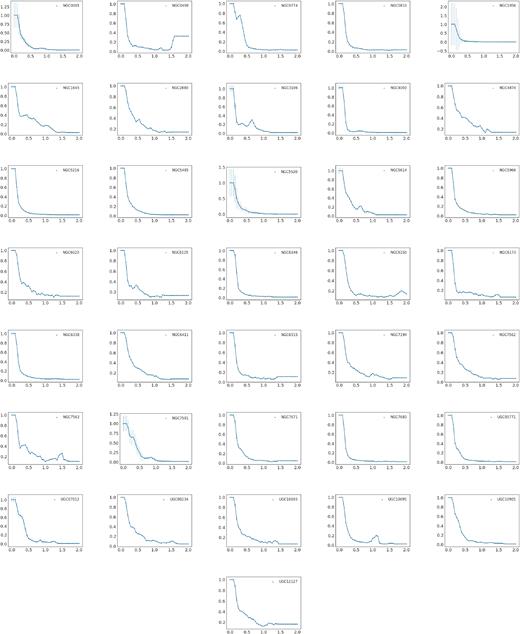
CE profiles, in units of |$10^{-16}\,\mathrm{ erg}\, \mathrm{ s}^{-1}\, \mathrm{ cm}^{-2}$|, for the H α emission.
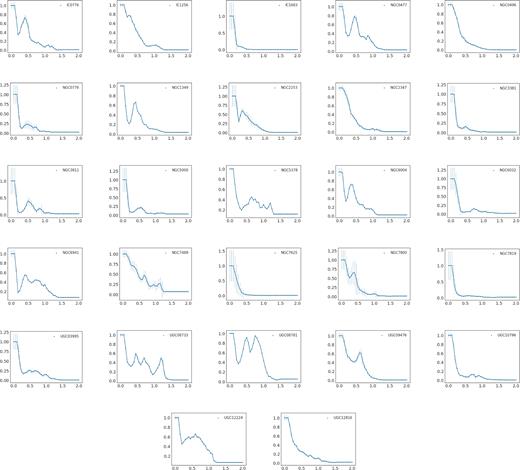
CL profiles, in units of |$10^{-16}\,\mathrm{ erg}\, \mathrm{ s}^{-1}\, \mathrm{ cm}^{-2}$|, for the H α emission.
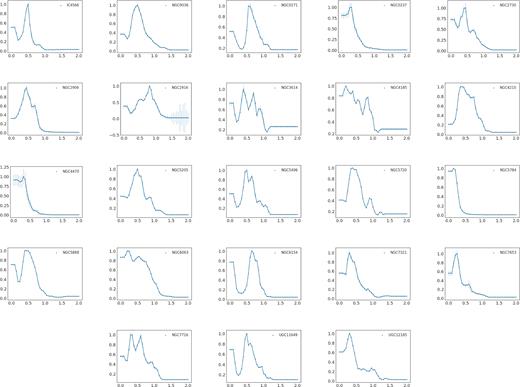
EX profiles, in units of |$10^{-16}\, \mathrm{ erg}\, \mathrm{ s}^{-1}\, \mathrm{ cm}^{-2}$|, for the H α emission.
APPENDIX B: GALAXIES PROPERTIES
Table B1 shows the list of galaxies in our sample and some global properties, like Mr magnitude, colour |$u - r$|, mean stellar age, mean metallicity, mean stellar mass, and Hubble type. In addition, the table also shows the classification of the H α profile, the concentrations, and the ellipticity for each object.
Properties of the galaxies sample: absolute magnitude |$M_r$|, colour |$u-r$|, mean age (log(age/yr)), metallicity (Z), stellar mass (|$\log(M/\mathrm{ M}_{\odot})$|), Hubble type, morphological classes, H α profile, light concentration, effective concentration, central concentration, and ellipticity.
| Galaxy | Mr | |$u-r$| | log(t*/Gyr) | log(Z*/Z⊙) | log(M*/M⊙) | H. type | M. class | H α profile | cr | ce (H α) | cc (H α) | ε |
|---|---|---|---|---|---|---|---|---|---|---|---|---|
| IC 0776 | −18.69 | 1.94 | 8.34 | −0.27 | 9.59 | Sd | Slate | CL | 1.95 | 0.55 | 0.20 | 0.28 |
| IC 1256 | −20.81 | 2.21 | 9.08 | −0.29 | 10.72 | Sb | Searly | CL | 2.19 | 0.57 | 0.22 | 0.20 |
| IC 1683 | −20.75 | 2.54 | 9.31 | −0.24 | 10.76 | Sb | Searly | CL | 2.59 | 0.30 | 0.77 | 0.28 |
| IC 4566 | −21.51 | 2.88 | 9.30 | −0.26 | 11.01 | Sb | Searly | E | 2.24 | 0.63 | 0.08 | 0.26 |
| NGC 0001 | −21.11 | 2.24 | 8.89 | −0.35 | 10.82 | Sbc | Slate | CE | 3.04 | 0.52 | 0.40 | 0.25 |
| NGC 0036 | −21.86 | 2.48 | 9.30 | −0.34 | 11.22 | Sb | Searly | E | 2.49 | 0.72 | 0.05 | 0.25 |
| NGC 0171 | −21.24 | 2.59 | 9.18 | −0.21 | 10.93 | Sb | Searly | E | 1.98 | 0.81 | 0.04 | 0.11 |
| NGC 0237 | −20.75 | 1.84 | 8.79 | −0.33 | 10.59 | Sc | Slate | E | 2.42 | 0.55 | 0.33 | 0.27 |
| NGC 0477 | −20.79 | 2.39 | 8.89 | −0.33 | 10.89 | Sbc | Slate | CL | 2.15 | 0.69 | 0.11 | 0.30 |
| NGC 0496 | −21.12 | 2.32 | 8.74 | −0.31 | 10.84 | Sc | Slate | CL | 2.03 | 0.47 | 0.43 | 0.34 |
| NGC 0499 | −21.88 | 2.83 | 9.69 | −0.17 | 11.34 | E | ES0 | CE | 2.96 | 0.65 | 0.37 | 0.16 |
| NGC 0774 | −21.12 | 2.65 | 9.59 | −0.20 | 11.02 | S0 | ES0 | CE | 3.01 | 0.51 | 0.53 | 0.18 |
| NGC 0776 | −21.46 | 2.67 | 9.26 | −0.30 | 11.08 | Sb | Searly | CL | 2.10 | 0.66 | 0.13 | 0.09 |
| NGC 0810 | −22.17 | 2.81 | 9.59 | −0.21 | 11.48 | E | ES0 | CE | 2.98 | 0.45 | 0.51 | 0.16 |
| NGC 1056 | −19.17 | 2.49 | 8.96 | −0.38 | 10.20 | Sa | Searly | CE | 3.17 | 0.37 | 0.50 | 0.27 |
| NGC 1349 | −22.15 | 2.75 | 9.20 | −0.21 | 11.33 | E | ES0 | CL | 2.59 | 0.71 | 0.10 | 0.10 |
| NGC 1645 | −21.45 | 2.65 | 9.11 | −0.19 | 11.03 | S0 | ES0 | CE | 3.23 | 0.86 | 0.15 | 0.34 |
| NGC 2253 | −21.20 | 2.37 | 8.80 | −0.36 | 10.80 | Sbc | Slate | CL | 2.14 | 0.66 | 0.13 | 0.22 |
| NGC 2347 | −21.60 | 2.15 | 8.64 | −0.33 | 11.04 | Sbc | Slate | CL | 2.57 | 0.58 | 0.30 | 0.29 |
| NGC 2730 | −20.40 | 1.89 | 7.81 | −0.36 | 10.13 | Sc | Slate | E | 1.88 | 0.62 | 0.11 | 0.20 |
| NGC 2880 | −20.24 | 2.65 | 9.70 | −0.25 | 10.55 | E | ES0 | CE | 3.26 | 0.81 | 0.17 | 0.21 |
| NGC 2906 | −20.56 | 2.96 | 9.42 | −0.31 | 10.58 | Sbc | Slate | E | 2.08 | 0.64 | 0.17 | 0.38 |
| NGC 2916 | −21.17 | 2.18 | 8.94 | −0.31 | 10.96 | Sbc | Slate | E | 2.16 | 0.87 | 0.02 | 0.31 |
| NGC 3106 | −22.16 | 2.96 | 9.49 | −0.23 | 11.40 | Sa | Searly | CE | 3.06 | 0.84 | 0.12 | 0.10 |
| NGC 3381 | −19.32 | 1.84 | 8.81 | −0.33 | 9.88 | Sd | Slate | CL | 2.03 | 0.59 | 0.20 | 0.07 |
| NGC 3614 | −19.96 | 2.52 | 9.22 | −0.42 | 10.31 | Sbc | Slate | E | 2.18 | 0.77 | 0.04 | 0.10 |
| NGC 3811 | −20.76 | 2.30 | 8.93 | −0.35 | 10.64 | Sbc | Slate | CL | 2.14 | 0.76 | 0.09 | 0.18 |
| NGC 4003 | −21.71 | 2.68 | 9.59 | −0.15 | 11.12 | S0 | ES0 | CE | 2.77 | 0.24 | 0.60 | 0.38 |
| NGC 4185 | −21.32 | 3.11 | 9.41 | −0.28 | 10.85 | Sbc | Slate | E | 1.96 | 0.77 | 0.08 | 0.16 |
| NGC 4210 | −20.38 | 2.51 | 9.09 | −0.32 | 10.50 | Sb | Searly | E | 1.87 | 0.73 | 0.03 | 0.18 |
| NGC 4470 | −20.44 | 1.50 | 9.01 | −0.38 | 10.23 | Sc | Slate | E | 2.01 | 0.51 | 0.43 | 0.25 |
| NGC 4874 | −22.68 | 2.98 | 9.83 | −0.21 | 11.66 | E | ES0 | CE | 2.72 | 0.76 | 0.13 | 0.05 |
| NGC 5000 | −21.36 | 2.39 | 9.08 | −0.18 | 10.94 | Sbc | Slate | CL | 2.19 | 0.70 | 0.17 | 0.13 |
| NGC 5205 | −19.34 | 2.38 | 8.99 | −0.33 | 9.98 | Sbc | Slate | E | 2.42 | 0.74 | 0.06 | 0.25 |
| NGC 5216 | −20.28 | 2.66 | 9.56 | −0.22 | 10.58 | E | ES0 | CE | 2.95 | 0.43 | 0.52 | 0.12 |
| NGC 5378 | −20.60 | 2.85 | 9.48 | −0.27 | 10.61 | Sb | Searly | CL | 2.42 | 0.86 | 0.09 | 0.15 |
| NGC 5406 | −22.03 | 2.81 | 9.33 | −0.29 | 11.26 | Sb | Searly | E | 2.31 | 0.79 | 0.03 | 0.10 |
| NGC 5485 | −20.72 | 2.78 | 9.78 | −0.20 | 10.74 | E | ES0 | CE | 2.79 | 0.50 | 0.38 | 0.13 |
| NGC 5520 | −19.50 | 2.24 | 8.71 | −0.33 | 10.07 | Sbc | Slate | CE | 3.03 | 0.52 | 0.45 | 0.37 |
| NGC 5614 | −22.04 | 2.79 | 9.61 | −0.37 | 11.22 | Sa | Searly | CE | 3.05 | 0.71 | 0.19 | 0.08 |
| NGC 5720 | −21.90 | 2.40 | 9.12 | −0.32 | 11.19 | Sbc | Slate | E | 2.36 | 0.73 | 0.06 | 0.24 |
| NGC 5784 | −21.96 | 2.84 | 9.56 | −0.29 | 11.32 | S0 | ES0 | E | 3.36 | 0.36 | 0.73 | 0.13 |
| NGC 5888 | −22.51 | 2.82 | 9.44 | −0.22 | 11.47 | Sb | Searly | E | 2.07 | 0.69 | 0.08 | 0.36 |
| NGC 5966 | −21.43 | 2.77 | 9.70 | −0.25 | 11.12 | E | ES0 | CE | 2.83 | 0.59 | 0.43 | 0.22 |
| NGC 6004 | −21.14 | 3.46 | 9.29 | −0.34 | 10.86 | Sbc | Slate | CL | 1.97 | 0.61 | 0.10 | 0.05 |
| NGC 6020 | −21.29 | 2.98 | 9.59 | −0.26 | 11.04 | E | ES0 | CE | 3.03 | 0.88 | 0.16 | 0.13 |
| NGC 6032 | −20.72 | 2.99 | 8.94 | −0.20 | 10.65 | Sbc | Slate | CL | 1.96 | 0.64 | 0.27 | 0.44 |
| NGC 6063 | −20.02 | 2.35 | 9.04 | −0.38 | 10.36 | Sbc | Slate | E | 1.89 | 0.74 | 0.14 | 0.36 |
| NGC 6125 | −22.01 | 2.74 | 9.78 | −0.24 | 11.35 | E | ES0 | CE | 3.19 | 0.80 | 0.14 | 0.06 |
| NGC 6146 | −22.94 | 2.73 | 9.59 | −0.09 | 11.71 | E | ES0 | CE | 3.36 | 0.50 | 0.47 | 0.14 |
| NGC 6150 | −22.28 | 2.86 | 9.65 | −0.15 | 11.42 | E | ES0 | CE | 2.91 | 1.01 | 0.33 | 0.29 |
| NGC 6154 | −21.60 | 2.73 | 9.48 | −0.28 | 11.14 | Sa | Searly | E | 2.27 | 0.83 | 0.03 | 0.22 |
| NGC 6173 | −23.11 | 2.91 | 9.81 | −0.22 | 11.81 | E | ES0 | CE | 3.15 | 0.87 | 0.15 | 0.21 |
| NGC 6338 | −22.76 | 3.18 | 9.72 | −0.22 | 11.67 | E | ES0 | CE | 2.81 | 0.58 | 0.37 | 0.17 |
| NGC 6411 | −21.61 | 3.10 | 9.66 | −0.21 | 11.15 | E | ES0 | CE | 3.00 | 0.76 | 0.22 | 0.22 |
| NGC 6515 | −22.11 | 2.73 | 9.44 | −0.26 | 11.37 | E | ES0 | CE | 3.13 | 0.78 | 0.26 | 0.16 |
| NGC 6941 | −21.87 | 2.76 | 9.27 | −0.28 | 11.21 | Sb | Searly | CL | 2.12 | 0.80 | 0.07 | 0.26 |
| NGC 7194 | −22.35 | 2.79 | 9.67 | −0.13 | 11.56 | E | ES0 | CE | 3.27 | 0.88 | 0.24 | 0.29 |
| NGC 7321 | −22.07 | 2.48 | 9.04 | −0.32 | 11.30 | Sbc | Slate | E | 2.39 | 0.63 | 0.18 | 0.28 |
| NGC 7489 | −21.47 | 1.86 | 8.03 | −0.27 | 11.18 | Sbc | Slate | CL | 2.28 | 0.66 | 0.15 | 0.14 |
| NGC 7562 | −21.88 | 2.86 | 9.76 | −0.15 | 11.31 | E | ES0 | CE | 3.07 | 0.75 | 0.21 | 0.21 |
| NGC 7563 | −21.16 | 2.99 | 9.74 | −0.03 | 11.13 | Sa | Searly | CE | 3.52 | 0.93 | 0.20 | 0.27 |
| NGC 7591 | −21.31 | 2.38 | 8.99 | −0.33 | 10.95 | Sbc | Slate | CE | 2.97 | 0.53 | 0.28 | 0.33 |
| NGC 7625 | −19.12 | 2.37 | 9.14 | −0.41 | 10.22 | Sa | Searly | CL | 2.61 | 0.37 | 0.48 | 0.12 |
| NGC 7653 | −21.11 | 2.12 | 8.84 | −0.40 | 10.82 | Sb | Searly | E | 2.73 | 0.64 | 0.18 | 0.12 |
| NGC 7671 | −21.28 | 2.73 | 9.40 | −0.23 | 11.03 | S0 | ES0 | CE | 3.22 | 0.63 | 0.38 | 0.25 |
| NGC 7683 | −21.14 | 2.89 | 9.66 | −0.21 | 11.01 | S0 | ES0 | CE | 3.16 | 0.46 | 0.50 | 0.29 |
| NGC 7716 | −20.29 | 2.49 | 9.13 | −0.37 | 10.65 | Sb | Searly | E | 2.73 | 0.81 | 0.05 | 0.12 |
| NGC 7800 | −18.37 | 1.41 | 8.49 | −0.33 | 9.67 | Sd | Slate | CL | 2.44 | 0.52 | 0.31 | 0.35 |
| NGC 7819 | −20.57 | 2.30 | 8.68 | −0.29 | 10.61 | Sc | Slate | CL | 2.11 | 0.57 | 0.39 | 0.29 |
| UGC 03995 | −21.72 | 3.37 | 9.29 | −0.30 | 11.15 | Sb | Searly | CL | 2.43 | 0.73 | 0.12 | 0.33 |
| UGC 05771 | −21.91 | 2.72 | 9.61 | −0.24 | 11.27 | E | ES0 | CE | 3.35 | 0.46 | 0.57 | 0.22 |
| UGC 07012 | −19.34 | 1.42 | 8.41 | −0.26 | 9.90 | Sc | Slate | CE | 2.72 | 0.48 | 0.45 | 0.33 |
| UGC 08234 | −22.41 | 2.35 | 9.10 | −0.17 | 11.39 | S0 | ES0 | CE | 3.32 | 0.83 | 0.28 | 0.30 |
| UGC 08733 | −18.73 | 1.63 | 8.75 | −0.27 | 9.61 | Sd | Slate | CL | 2.14 | 0.75 | 0.12 | 0.22 |
| UGC 08781 | −22.09 | 2.69 | 9.29 | −0.19 | 11.27 | Sb | Searly | CL | 2.47 | 0.89 | 0.06 | 0.33 |
| UGC 09476 | −20.35 | 2.09 | 9.02 | −0.36 | 10.43 | Sbc | Slate | CL | 1.84 | 0.65 | 0.19 | 0.26 |
| UGC 10693 | −22.66 | 2.94 | 9.74 | −0.28 | 11.61 | E | ES0 | CE | 3.28 | 0.77 | 0.19 | 0.13 |
| UGC 10695 | −22.09 | 2.73 | 9.57 | −0.27 | 11.38 | E | ES0 | CE | 2.80 | 0.88 | 0.31 | 0.37 |
| UGC 10796 | −18.90 | 1.75 | 8.54 | −0.23 | 9.77 | Sc | Slate | CL | 2.41 | 0.63 | 0.42 | 0.34 |
| UGC 10905 | −22.32 | 2.78 | 9.53 | −0.26 | 11.45 | S0 | ES0 | CE | 3.47 | 0.48 | 0.52 | 0.35 |
| UGC 11649 | −20.60 | 2.88 | 9.22 | −0.22 | 10.75 | Sa | Searly | E | 2.12 | 0.79 | 0.04 | 0.15 |
| UGC 12127 | −22.49 | 3.31 | 9.71 | −0.31 | 11.65 | E | ES0 | CE | 3.05 | 0.80 | 0.15 | 0.09 |
| UGC 12185 | −21.26 | 2.60 | 9.14 | −0.25 | 10.99 | Sb | Searly | E | 2.83 | 0.68 | 0.25 | 0.38 |
| UGC 12224 | −19.92 | 2.51 | 8.83 | −0.27 | 10.41 | Sc | Slate | CL | 1.84 | 0.74 | 0.09 | 0.09 |
| UGC 12816 | −20.28 | 1.85 | 8.38 | −0.23 | 10.34 | Sc | Slate | CL | 2.37 | 0.63 | 0.31 | 0.32 |
