


ABSTRACT
We investigate the cosmological information contained in the cross-correlation between the integrated Sachs–Wolfe (ISW) of the cosmic microwave background (CMB) anisotropy pattern and galaxy clusters from future wide surveys. Future surveys will provide cluster catalogues with a number of objects comparable with galaxy catalogues currently used for the detection of the ISW signal by cross-correlation with the CMB anisotropy pattern. By computing the angular power spectra of clusters and the corresponding cross-correlation with CMB, we perform a signal-to-noise ratio (SNR) analysis for the ISW detection as expected from the eROSITA and the Euclid space missions. We discuss the dependence of the SNR of the ISW-cluster cross-correlation on the specifications of the catalogues and on the reference cosmology. We forecast that the SNRs for ISW-cluster cross-correlation are slightly smaller compared to those which can be obtained from future galaxy surveys but the signal is expected to be detected at high significance, i.e. more than |$\gt\! 3\, \sigma$|. We also forecast the joint constraints on parameters of model extensions of the concordance Λ cold dark matter (ΛCDM) cosmology by combining CMB and the ISW-cluster cross-correlation.
1 INTRODUCTION
One of the key predictions of the recent accelerated expansion is the late integrated Sachs–Wolfe (ISW) effect (Sachs & Wolfe 1967) in the cosmic microwave background (CMB) anisotropy pattern. The ISW effect is caused by the time evolution of the gravitational potentials encountered by CMB photons during their journey from the last scattering surface to the observer. The change of the gravitational potentials on large scales is caused by the accelerated expansion of the Universe driven by dark energy (Kofman & Starobinsky 1985) and is therefore correlated with density fluctuations at low redshifts.
The late ISW effect is just a small fraction of the CMB temperature anisotropy signal for a Λ cold dark matter (ΛCDM) concordance cosmology and is maximum at largest angular scales (Kofman & Starobinsky 1985), where cosmic variance is dominant. An extraction of the ISW effect was predicted as feasible by cross-correlating CMB with large-scale structure (LSS) tracers of the matter distribution (Crittenden & Turok 1996). Several measurements of the ISW-LSS cross-correlation have been reported since the release of the WMAP first-year data (Nolta et al. 2004) by using different dark matter (DM) tracers. These measurements have been performed by using different estimators in different domains (e.g. Afshordi, Loh & Strauss 2004; Boughn & Crittenden 2004; Fosalba & Gaztanaga 2004; Vielva, Martinez-Gonzalez & Tucci 2006; McEwen et al. 2007; Giannantonio et al. 2008; Ho et al. 2008; Hernandez-Monteagudo 2010; Schiavon et al. 2012; Bianchini, Renzi & Marinucci 2016; Stölzner et al. 2017). See Dupe et al. (2011) and references therein for a review of pre-Planck ISW measurements.
A detection at 2.9|$\, \sigma$| level of the ISW effect has beeen obtained by Planck Collaboration XXI (2016) by cross-correlating the Planck temperature map with a compilation of publicly available galaxy surveys (see Planck Collaboration XIX 2014 for the results based on the nominal mission). This cross-correlation measurement of the ISW effect is compatible with the predictions of a concordance ΛCDM model with |$\Omega _\Lambda \sim 0.7$| (Planck Collaboration XXI 2016). Cross-correlation between CMB lensing and matter tracers improve the significance of the ISW detection (see Manzotti & Dodelson 2014; Ferraro, Sherwin & Spergel 2015; Planck Collaboration XXI 2016; Shajib & Wright 2016). Note also that the ISW could be targeted by using its cross-correlation with CIB (Ilic et al. 2011) or tSZ (Taburet et al. 2011).
Future LSS experiments, such as DESI1 (Levi et al. 2013; Aghamousa et al. 2016a,b), Euclid2 (Laureijs et al. 2011; Amendola et al. 2013), LSST3 (Abell et al. 2009), and SKA4 (Maartens et al. 2015), will provide surveys with a larger number of objects and sky fraction probing a larger volume, then allowing a better determination of the ISW signal. The next generation of LSS surveys will not only lead to an improvement in the ISW measurement with matter tracers already employed for this purpose but could also provide different catalogues of matter tracers suitable for novel detections of the ISW effect (Raccanelli et al. 2015, 2016; Pourtsidou, Bacon & Crittenden 2017).
Current cluster surveys are not optimal for the detection of the ISW effect since photometric catalogues are limited to small redshift |$z$| ≲ 0.4 (Rozo et al. 2010) and X-ray catalogues cover small patches of the sky (Mantz et al. 2015).5
Otherwise, the cluster catalogues from the next generation of LSS surveys are indeed expected to contain a higher number of clusters over a wider redshift range. These future catalogues will allow precision cosmology with clusters, as from the cosmological parameter forecasts from the Euclid cluster survey (Sartoris et al. 2016). It is therefore interesting to study the potential for an ISW detection by a cross-correlation with future cluster catalogues as matter tracers.
In this paper, by computing the angular power spectra of cluster counts and of their cross-correlation with CMB, we perform a signal-to-noise ratio (SNR) analysis for the ISW detection with two representative examples for future cluster catalogues, as those expected from the eROSITA (Predehl et al. 2010) and Euclid (Laureijs et al. 2011) space missions and we forecast how ISW-cluster cross-correlation could improve the constraints on cosmological parameters for different extended models. This analysis is complementary to the stacking of CMB data in correspondence of superclusters (Granett et al. 2008; Papai, Szapudi & Granett 2011; Ilic et al. 2011; Planck Collaboration XIX 2014; Planck Collaboration XXI 2016), whose theoretical interpretation is more difficult, although consistent with ΛCDM.
Our paper is organized as follows. In Section 2, we review the angular power spectrum of the cross-correlation between CMB and a generic matter tracer, such as clusters or galaxies. In Section 3, we review the calculations of the bias and the number density distribution for cluster catalogues. In Section 4, we describe the future surveys considered in our work: eROSITA and Euclid for clusters, Euclid photometric and spectroscopic surveys for galaxies. In Section 5, we compute the auto- and CMB cross-correlation angular power spectra for these surveys and perform an SNR analysis. In Section 6, we present forecasted constraints on cosmological parameters of extensions of the concordance ΛCDM model by combining CMB and the CMB-LSS cross-correlation. We draw our conclusions in Section 7.
Throughout this work, we adopt a fiducial cosmological model compatible with the most recent Planck data (Aghanim et al. 2016), corresponding to |$\omega _\textrm{b}\equiv \Omega _\textrm{b}\, h^2=0.02214$|, |$\omega _\textrm{c}\equiv \Omega _\textrm{c}\, h^2=0.1206$|, H0 = 66.89, τ = 0.0581, ns = 0.9625, and log (1010 As) = 3.053.
2 CROSS-CORRELATION OF ISW EFFECT WITH NUMBER COUNTS
3 CLUSTER NUMBER DENSITY
3.1 Halo mass function
3.2 Halo bias function
3.3 Survey characteristic function
4 FUTURE SURVEYS
In this section, we describe two future cluster catalogues suitable for the ISW detection by cross-correlation with CMB, i.e. those expected from eROSITA (Predehl et al. 2010) and Euclid (Laureijs et al. 2011). For comparison, we also present the specifications for the photometric and spectroscopic galaxy surveys expected from Euclid, which are expected to improve on the current statistical significance of the ISW detection with galaxy surveys.
4.1 eROSITA cluster survey
eROSITA6 (Predehl et al. 2010) is the primary science instrument onboard the Spectrum Roentgen-Gamma (SRG) satellite,7 launched in 2017.
eROSITA is expected to perform an X-ray all-sky survey with a sensitivity ∼30 times better than ROSAT and to cover a redshift range of 0 ≤ |$z$| ≤ 1.5 with a sky coverage of 27 000 deg2. We consider the eROSITA cluster selection function presented in Pillepich, Porciani & Reiprich (2012), computed for a mass at Δc = 500 with an exposure time of 1.6 × 10³ s and a detection threshold of 50 photons. In addition, we adopt as lower cut for the minimum mass |$5\times 10^{13}\ \mathrm{M}_\odot \, h^{-1}$|.
The resulting specifications of the eROSITA cluster catalogue (hereafter referred eR_cl) are summarized in Table 1, leading to a total number of clusters ∼8.1 × 10⁴. The corresponding redshift density distribution and the linear bias for eROSITA are shown in Fig. 1.
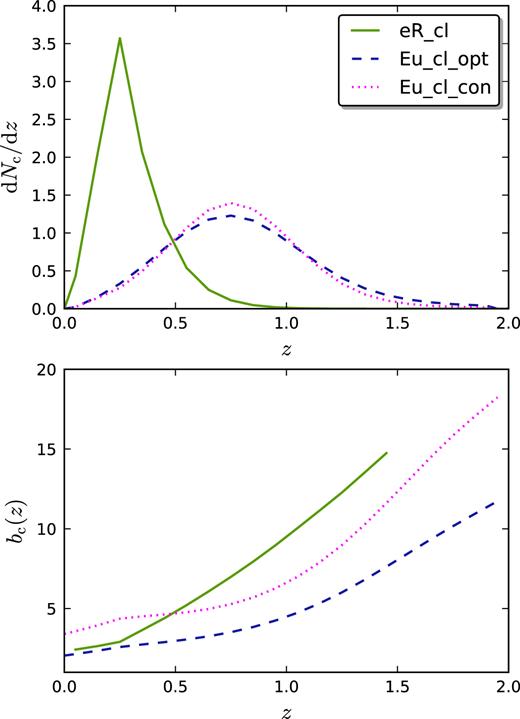
In the top panel, we plot the normalized cluster redshift distributions adopted for each survey: eROSITA (solid green), optimistic Euclid (dashed blue), and conservative Euclid (dotted magenta). In the bottom panel, we plot the corresponding linear bias.
Summary of the characteristics of the surveys studied in this paper: fraction of the sky available fsky and surface density of tracer |$\bar{n}_\textrm{X}$|.
| fsky (deg2) | |$\bar{n}_\textrm{X}$| (deg−2) | |
|---|---|---|
| eR_cl | 27 000 | 2.9 |
| Eu_cl_opt | 15 000 | 72 |
| Eu_cl_con | 15 000 | 10.8 |
| Eu_gal_sp | 15 000 | 3960 |
| Eu_gal_ph | 15 000 | 108 000 |
| fsky (deg2) | |$\bar{n}_\textrm{X}$| (deg−2) | |
|---|---|---|
| eR_cl | 27 000 | 2.9 |
| Eu_cl_opt | 15 000 | 72 |
| Eu_cl_con | 15 000 | 10.8 |
| Eu_gal_sp | 15 000 | 3960 |
| Eu_gal_ph | 15 000 | 108 000 |
4.2 Euclid cluster survey
The European Space Agency (ESA) Cosmic Vision mission Euclid (Laureijs et al. 2011) is scheduled to be launched in 2021, with the goal of exploring the dark sector of the Universe.
As selection function for the expected Euclid cluster catalogue we consider the one presented in Sartoris et al. (2016) computed for a mass at Δc = 200 with a threshold for the significance of the clusters detection of 3 in terms of the ratio between the cluster galaxy number counts and the field rms (hereafter referred Eu_cl_opt) with a sky coverage of 15 000 deg2 over a redshift range of 0.2 ≤ |$z$| ≤ 2. We also consider a detection threshold of 5 as a more conservative case (hereafter referred Eu_cl_con). This selection function was obtained following a phenomenological approach. In summary, the number of cluster galaxies is obtained by integration of observed cluster luminosity function down to the H-band magnitude limit of the Euclid survey, and the variance in the field counts takes into account both Poisson noise and cosmic variance (see Sartoris et al. (2016) for more details). Even if the galaxy cluster mass selection function used for the Euclid photometric survey is not constant (see Sartoris et al. 2016), a mass limit of |$8\times 10^{13}\ \mathrm{M}_\odot \, h^{-1}$| and |$3\times 10^{14}\ \mathrm{M}_\odot \, h^{-1}$| approximately mimics the counts of Eu_cl_opt and of Eu_cl_con, respectively.
The resulting specifications of the optimistic and conservative Euclid expected cluster catalogues are summarized in Table 1, leading to a total number of clusters 1.3 × 10⁶ and 2.0 × 10⁵, respectively. See also Fig. 1 for the corresponding redshift density distribution and the linear bias.
4.3 Euclid galaxy surveys
Euclid will measure the galaxy clustering in a spectroscopic survey of tens of millions of H α emitting galaxies and the cosmic shear in a photometric survey of billions of galaxies.
For the Euclid wide spectroscopic survey (hereafter referred Eu_gal_sp), we consider an area of 15 000 deg2. According to the updated predictions obtained by Pozzetti et al. (2016), the Euclid wide single-grism survey will reach a flux limit of FH α > 2 × 10⁻¹⁶ erg cm−2 s−1 and will cover a redshift range of 0.9 ≤ |$z$| ≤ 1.8.
As specifications for the Euclid photometric survey (hereafter referred Eu_gal_ph), we adopt dN/d|$z$| ∝ |$z$|2exp[−(|$z$|/|$z$|0)3/2], with |$z$|0 = |$z$|mean/1.412 the peak of the distribution and |$z$|mean the median (Amendola et al. 2013). We choose |$z$|mean = 0.9, a surface density |$\bar{n}_\mathrm{g}=30$| per arcmin2 and a bias |$b_\textrm{g}(z)=\sqrt{1+z}$| (Amendola et al. 2013).
The specifications for the Euclid spectroscopic and photometric galaxy surveys are summarized in Table 1. In Fig. 2, we plot the normalized redshift density distribution and the effective bias.
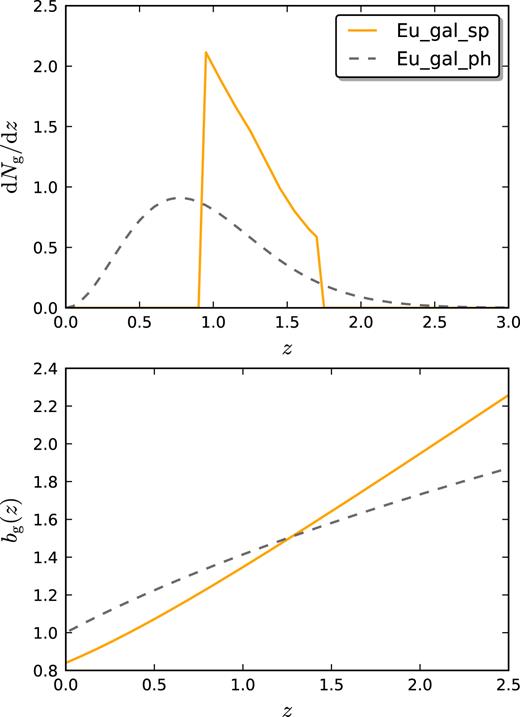
In the top panel, we plot the normalized galaxy redshift distribution adopted for each survey: spectroscopic Euclid (solid orange) and photometric Euclid (dashed grey). In the bottom panel, we plot the corresponding linear bias.
5 AN SNR ANALYSIS
We show in Figs 3 and 4 the angular power spectra and the noises, for cluster and galaxy surveys respectively, calculated with the assumed fiducial cosmology and used in the SNR analysis.
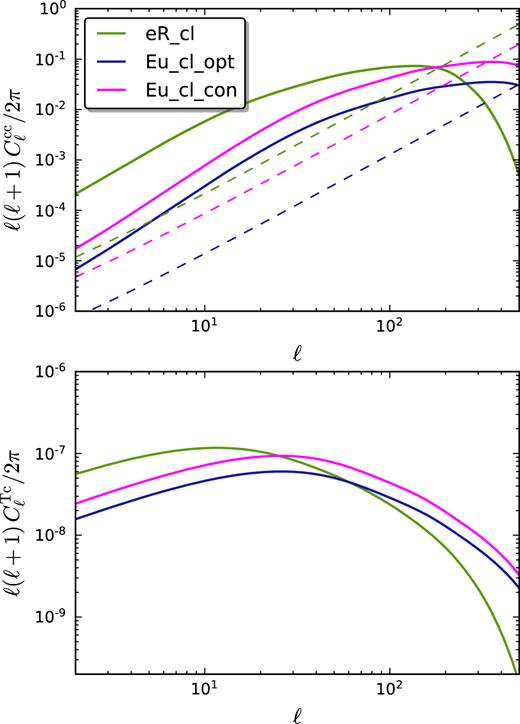
Cluster angular power spectra |$C_\ell ^\textrm{cc}$| (top panel) and cross-correlation angular power spectra |$C_\ell ^\textrm{Tc}$| (bottom panel) for the three surveys of clusters: eROSITA (solid green), optimistic Euclid (solid blue), and conservative Euclid (solid magenta). In the top panel, the corresponding shot-noise (dashed lines) is also shown.
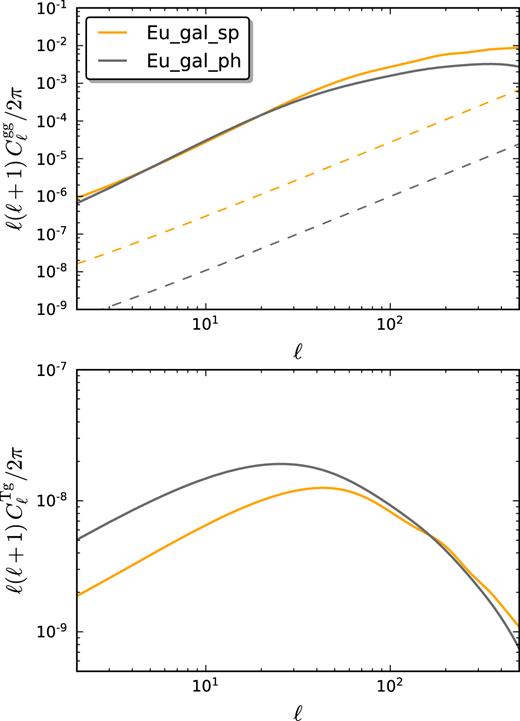
Galaxy angular power spectra |$C_\ell ^\textrm{gg}$| (top panel) and cross-correlation angular power spectra |$C_\ell ^\textrm{Tg}$| (bottom panel) for two surveys of galaxies: spectroscopic Euclid (solid orange) and photometric Euclid (solid grey). In the top panel, the corresponding shot-noise (dashed lines) is also shown.
We summarize in Table 2 the SNR for the cluster and galaxy catalogues introduced in Section 2 with the estimators in equations (17) and (21). Future cluster catalogues from eROSITA and Euclid could lead to a detection of the ISW effect at high significance |$\gt 3\, \sigma$| thanks to the high number of clusters detected, i.e. a small noise level. We find that the SNR for these two cluster surveys will be comparable to the one obtainable from future galaxy surveys. In particular, for a Euclid survey, the SNR from clusters is smaller than the one expected from the photometric survey, but it is still larger than the SNR forecasted for the spectroscopic survey. The reason resides in the high bias expected for clusters that compensate the larger shot-noise in the observed cluster maps. The inclusion of CMB polarization information in the analysis increases the SNR by approximately 18 per cent as compared to the temperature only, with a weak dependence of the type of survey considered; this is fully consistent with Frommert & Enßlin (2009); Giannantonio et al. (2012). We find the possibility of detecting the ISW effect at |$4\, \sigma$| both the cluster and the galaxy Euclid photometric surveys by adding the CMB polarization information. A comparison between the two SNR calculated from the two estimators is also shown in Fig. 5.

| eR_cl | Eu_cl_opt | Eu_cl_con | Eu_gal_sp | Eu_gal_ph | |
|---|---|---|---|---|---|
| T | 2.3 | 3.5 | 3.3 | 2.2 | 3.7 |
| T,E | 2.8 | 4.1 | 3.9 | 2.5 | 4.3 |
| eR_cl | Eu_cl_opt | Eu_cl_con | Eu_gal_sp | Eu_gal_ph | |
|---|---|---|---|---|---|
| T | 2.3 | 3.5 | 3.3 | 2.2 | 3.7 |
| T,E | 2.8 | 4.1 | 3.9 | 2.5 | 4.3 |
| eR_cl | Eu_cl_opt | Eu_cl_con | Eu_gal_sp | Eu_gal_ph | |
|---|---|---|---|---|---|
| T | 2.3 | 3.5 | 3.3 | 2.2 | 3.7 |
| T,E | 2.8 | 4.1 | 3.9 | 2.5 | 4.3 |
| eR_cl | Eu_cl_opt | Eu_cl_con | Eu_gal_sp | Eu_gal_ph | |
|---|---|---|---|---|---|
| T | 2.3 | 3.5 | 3.3 | 2.2 | 3.7 |
| T,E | 2.8 | 4.1 | 3.9 | 2.5 | 4.3 |
5.1 Robustness from the specifications of the survey and cosmology
We now test the dependence of the SNR obtainable for clusters on some of the specifications of the surveys, namely the smallest multipoles ℓmin, the covered sky fraction |$f_\textrm{sky}^\textrm{X}$|, the maximum redshift |$z$|max, and the minimum detectable mass Mmin; for the sake of brevity, we present this analysis for the optimistic Euclid cluster (Eu_cl_opt) survey only and considering the inclusion of polarization in the SNR estimation.
Given the possibility to lose the first multipoles because of some mask effects and possible systematics on the largest scales, we show in Fig. 6 (top left-hand panel) the dependence of SNR on ℓmin. The SNR remains approximately constant when removing the first few multipoles and is decreased approximately by |$0.5\, \sigma$| cutting the first 10 multipoles.
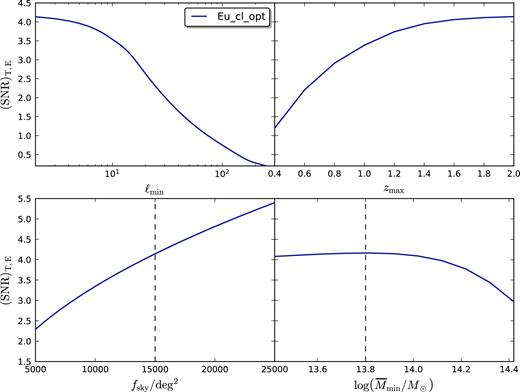
We plot the SNR for the optimistic Euclid cluster survey (Eu_cl_opt) as a function of ℓmin (top left), the maximum redshift probed by the survey (top right), the area of the sky survey (bottom left), and the minimum observed mass as over the redshift range 0.2 ≤ |$z$| ≤ 2 (bottom right). Dashed line represents the expected SNR for the Eu_cl_opt specifications. All the SNR take into account of the contribution from CMB E-mode polarization according to equation (21).
Bottom left-hand panel of Fig. 6 shows the SNR as a function of the observed sky fraction, which does not affect just equation (21) as SNR|$\ \propto \sqrt{f_\textrm{sky}^\textrm{X}}$|, but it changes also the amount of total clusters observed, i.e. the shot-noise error.
The SNR is sufficiently robust to a reduction of |$z$|max; the forecast SNR remains above a |$4\, \sigma$| detection for |$z$|max ≳ 1.4 for the optimistic Euclid cluster survey when the CMB polarization is added.
We finally study the dependence of the SNR when changing Mmin. We vertically shift a redshift independent selection function around 8 × 10¹³ M⊙, as representative of the selection function from (Sartoris et al. 2016) for the photometric Euclid cluster survey. The results in Fig. 6 (bottom left-hand panel) show that the expected selection function for Euclid would be optimal in terms of SNR.
We can conclude that for the ISW detection is more important to have wide surveys, covering a large fraction of the sky, than deeper ones, since the surveys analysed are already signal dominated on the scales relevant for the ISW.
We now briefly discuss the dependence of the SNR on the underlying cosmology. The cross-correlation power spectrum is sensitive to the total matter density Ωm and to the dark energy equation of state |$w$|0. They both change the amplitude of |$C_\ell ^\mathrm{TX}$| (since for a flat universe an increased amount of matter density corresponds to have a smaller amount of dark energy density). Moreover, the peak of |$C_\ell ^\mathrm{TX}$| is shifted according to a different matter-dark energy equivalence. We show the dependence of the SNR on these two parameters in Fig. 7 by keeping fixed all the other cosmological parameters (note that we change σ8 according to the variation of Ωm and |$w$|0). The SNR varies less than |$0.2\, \sigma$| when we change Ωm up to |$3\, \sigma$| away from the Planck best fit (Aghanim et al. 2016). We find a stronger effect on the dark energy parameter of state |$w$|0. Even a small shift of Δ|$w$|0 ≃ 0.2 would lead to a difference larger than |$0.5\, \sigma$| on the SNR. In particular, by assuming a fiducial cosmology with a smaller value of |$w$|0 leads to a higher SNR.
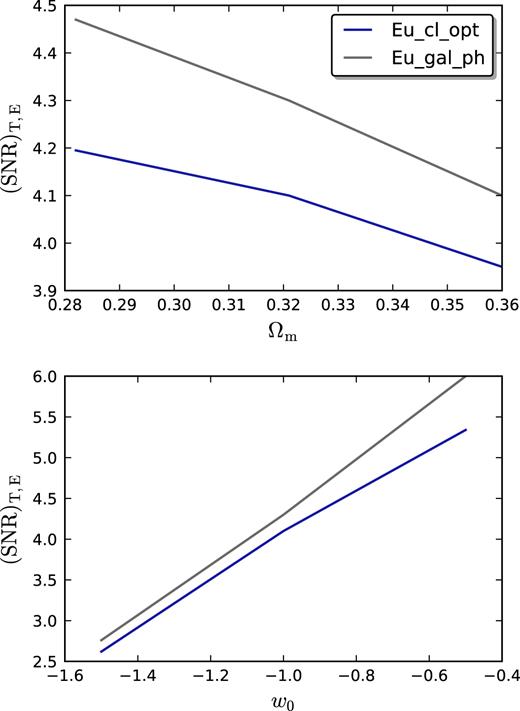
Top panel: dependence on Ωm of the SNR for the ISW detection with clusters (optimistic Euclid cluster survey, blue line) and with galaxies (photometric Euclid galaxy survey, grey line). Bottom panel: dependence on the dark energy equation of state |$w$|0 of the SNR for the ISW detection.
5.2 Combining clusters with galaxies
Different LSS surveys can be combined to increase the significance of the ISW detection. The best improvement comes for uncorrelated LSS surveys for which the SNR squared can be simply added. In this case, we would obtain for the ISW detection an SNR of 3.2/4.1/4.0 for the combination of Eu_gal_sp and 4.3/5.1/5.0 for the combination of Eu_gal_ph with eR_cl, Eu_cl_opt, Eu_cl_con, respectively. However, this ideal case is usually reached for surveys that cover different redshifts or for distributions of tracers which peak at different redshifts.
The Euclid’s cluster catalogue will be extracted from the photometric galaxy survey. Thus, they will trace by construction the same cosmological information mostly, having a similar redshift distribution and covering the same redshift range.
The combination of the two Euclid cluster surveys with Eu_gal_sp brings a little improvement of |$+$| 0.2 in the SNR.
Finally, we find that for eROSITA the combination of cluster survey with the galaxy survey from Euclid will be more promising in order to raise the SNR thanks to the low-z coverage from eROSITA. We find a SNR of 3.2/4.1 by combining and cross-correlating eR_cl with Eu_gal_sp and Eu_gal_ph.
Also in this case the addition of the CMB polarization information increases the SNR by a further 18 per cent for all the combinations.
6 COSMOLOGICAL FORECASTS WITH CMB-CLUSTER CROSS-CORRELATION
In this section, we use the Fisher matrix technique (Tegmark, Taylor & Heavens 1997) to compute the joint CMB and cross-correlation forecast constraints on few extensions of the ΛCDM cosmological concordance model.
6.1 Methodology
As representative specifications for CMB we consider the Planck 143 GHz channel full mission sensitivity and angular resolution as given in Adam et al. (2016) and used in Ballardini et al. (2016). These correspond to θFWHM = 7.3 arcmin, σT = 33 arcmin|$\, \mu$|K and σE = 70.2 arcmin|$\, \mu$|K. For cluster and galaxy specifications, we use those listed in Table 1.
We consider as set of cosmological parameters in our forecast analysis the six standard ΛCDM parameters ωb, ωc, H0, τ, ns, and log (1010 As), plus some extra parameters described in the following subsection. We also consider the bias as a nuisance parameter marginalizing over it.
In the case of clusters, in addition to the variation on all the cosmological parameters we consider the dependence on four nuisance parameters |$B_\rm{M,\, ~0},\alpha ,\sigma ^2_{\log \, M,0},\, \beta$| introduced in Section 3.3, as sources of uncertainties on the cluster selection function, as in Sartoris et al. (2016), by marginalizing over them.
6.2 Results
In this paper, we restrict ourselves to forecast the joint CMB and ISW-cluster cross-correlation constraints on few relevant cosmological models as in Douspis et al. (2008). With this setting, the impact of ISW-cluster cross-correlation can be easily evaluated, whereas it would be hardly visible if we were considering the full combination of CMB and cluster cosmological information. As for the SNR in the previous section, we compare these results with those obtained by the joint CMB and ISW-galaxy cross-correlation expected from the Euclid spectroscopic and photometric surveys.
We first forecast the constraints on the redshift-independent parameter of state of dark energy |$w$|0. Fig. 8 shows how the CMB-cluster cross-correlation improves on the CMB results alone. Our results show that CMB-cluster cross-correlation could lead to constraints similar to the one expected from the CMB-galaxy one, improving the constraints on |$w$|0 obtained from CMB data alone by around 20–30 per cent.
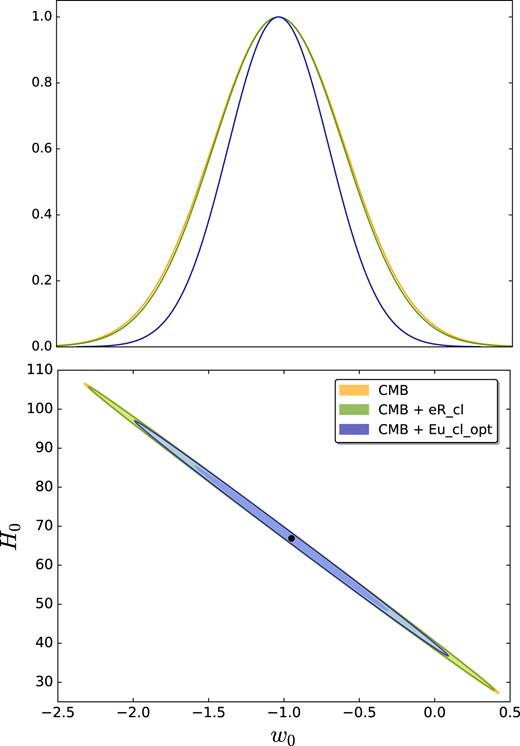
In the bottom panel, we show the joint constraints on (|$w$|0, H0) at the 68 per cent and 95 per cent CL. We show forecasts for the combination of the CMB and the CMB-LSS cross-correlation from eROSITA (green) and from the optimistic Euclid photometric cluster survey (blue). We show also the results for the CMB alone (yellow). In the top panel, we show the corresponding posterior distributions for |$w$|0.
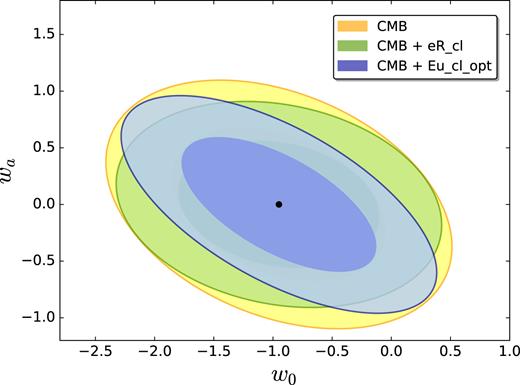
Joint constraints on (|$w$|0, |$w$|a) at the 68 per cent and 95 per cent CL. We show forecasts for the combination of the CMB and the CMB-LSS cross-correlation from eROSITA(green) and from the optimistic Euclidphotometric cluster survey (blue). We show also the results for the CMB alone (yellow).
Note that in our calculations we have taken into account the dependence of both the halo mass and bias functions on the underlying cosmology through the variance of the fractional density fluctuation σ2(M, |$z$|). We consider this dependence when varying the angular power spectra |$C_\ell ^\textrm{cc}$| and |$C_\ell ^\textrm{Tc}$| around the fiducial cosmology in the calculation of the Fisher matrix (27). The effect of neglecting this dependence would lead to an increase in the uncertainties on the cosmological parameters of about 10 per cent for the most significant parameters such as |$w$|0, and |$w$|a.
As a semi-idealized case, we also consider the constraints on the |$w$|0–|$w$|a plane by assuming perfect knowledge of the scaling relation between the true and the observed cluster mass, i.e. by fixing all the corresponding nuisance parameters: this semi-idealized case would cast the cluster case at the same footing of the galaxy one, in which no nuisance parameter is considered. In Fig. 10, we show the comparison of the constraints in the |$w$|0–|$w$|a parameters space between the CMB-cluster cross-correlation from Eu_cl_opt, with and without perfect knowledge of the scaling relation, and the CMB-galaxy cross-correlation from Eu_gal_ph. Assuming a perfect knowledge of the nuisance parameters connected to the cluster selection function leads to an improvement in the constraints obtainable with the help the CMB-cluster cross-correlation. In particular, we found an improvement of 10 per cent for |$w$|0, of 20 per cent and 40 per cent for |$w$|0 and |$w$|a, of 5 per cent for kc and λc.
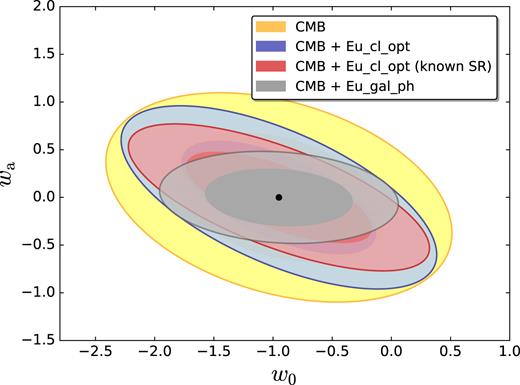
Joint constraints on (|$w$|0, |$w$|a) at the 68 per cent and 95 per cent CL. We show forecasts for the combination of the CMB and the CMB-LSS cross-correlation from the optimistic Euclid photometric cluster survey with (red) and without (blue) assuming a perfect knowledge of the scaling relation, and from the photometric Euclid galaxy survey (grey). We also show the results for the CMB alone for comparison (yellow).
7 CONCLUSIONS
Cosmology with clusters is a rapidly evolving field, thanks to improvements in observations. Current catalogues are already sufficient to obtain an accurate measurement of the baryon acoustic oscillation with galaxy clusters as from the Sloan Digital Sky Survey leading to a distance-redshift relation in full agreement with Planck observations and with uncertainties similar to the one obtained by galaxy surveys (Veropalumbo et al. 2014, 2016). In the perspective of future surveys in several wavelengths which will provide catalogues with a higher number of clusters over a wider redshift range, we have studied the capabilities to detect the ISW effect by a CMB-cluster cross-correlation. Note that this ISW-cluster cross-correlation is not internal to CMB as the previously studied ISW-tSZ cross-correlation (Taburet et al. 2011). In this perspective, it will be essential to control the SZ cluster residuals in CMB maps that could bias the cross-correlation measurements between clusters and CMB (Chen, Remazeilles & Dickinson 2018).
As two representative cases, we have considered the specifications of the cluster catalogues as expected from two coming space missions, i.e. eROSITA (Predehl et al. 2010) and Euclid (Laureijs et al. 2011). We have found that the CMB-cluster cross-correlation could be used for a statistically significant detection of the ISW effect. As two general remarks, we have found that (1) the SNR of the CMB-cluster cross-correlation benefits of the large cluster bias that balances the larger shot-noise in cluster catalogues compared to galaxy surveys; (2) the dependence of the cluster bias on cosmology needs to be taken into account to extract the full information from the cross-correlation with CMB. Whereas for eROSITA the cross-correlation with CMB would be an added value for the legacy of its cluster catalogue, for Euclid it would constitute a sort of coarse graining of the CMB galaxy cross-correlation and a key verification of the structure formation process. Nevertheless, the CMB-cluster would be another valuable cross-correlation within the Euclid probes and would add useful information on the bias for the cluster catalogue. The cross-correlation studied here would be of interest for other surveys as well, as LSST (Abell et al. 2009) and SKA (Maartens et al. 2015).
ACKNOWLEDGEMENTS
We thank Nabila Aghanim and Carlo Baccigalupi for useful comments to the paper. We acknowledge financial contribution from the agreement ASI n.I/023/12/0 ‘Attività relative alla fase B2/C per la missione Euclid’. The support by the ‘ASI/INAF Agreement 2014-024-R.0 for the Planck LFI Activity of Phase E2’ is also acknowledged. MB, DP, FF, and LM acknowledge the support from the grant MIUR PRIN 2015 ‘Cosmology and Fundamental Physics: illuminating the Dark Universe with Euclid’. MB was supported by the South African Radio Astronomy Observatory, which is a facility of the National Research Foundation, an agency of the Department of Science and Technology and the Claude Leon Foundation. BS acknowledges financial support from the University of Trieste through the program ‘Finanziamento di Ateneo per progetti di ricerca scientifica – FRA 2015’, a grant from ’Consorzio per la Fisica – Trieste’ and from the PRIN 2015W7KAWC project, funded by the Italian Minister for University and Research.
Footnotes
The only analysis of the late ISW using clusters has been performed by Granett, Neyrinck & Szapudi (2008) stacking WMAP data behind 50 superclusters (and 50 supervoids) to study the residual signal from the detection of the thermal SZ effect.
Extended ROentgen Survey with an Imaging Telescope Array, http://www.mpe.mpg.de/erosita/.
