


Abstract
We report deep imaging of a 15 × 150 kpc tail in the Hickson Compact Group 98 (HCG 98) observed with a 28-inch telescope at the Wise Observatory and confirmed with additional observations with a similar 28-inch at the Polaris Observatory and with archival and public observations. The tail extends from the general region of the two brightest galaxies of the group to the South-East; it is actually not connected to these galaxies but is linked with an extended low surface brightness envelope or halo around the two main galaxies of the group, approximately opposite to the tail, forming a tadpole-like entity which we assume is at the same distance as the galaxy group. The group is approximately centred on this halo, whose dimensions are 170 kpc (major axis) by 69 kpc (minor axis). We used the co-added Sloan Digital Sky Survey images from the IAC Stripe 82 Legacy Project (with the HCG 98 group shown in Román & Trujillo); these are 2--3 mag deeper than the regular Sloan Digital Sky Survey images. We measure the brightness and colours of these features, and study the morphology of the galaxies connected with them and of the diffuse features. We propose that our findings can be understood as a stage of a triple dry merger by the two brightest galaxies of the group with a gas-poor dwarf galaxy (Mr ≃ −16.7 mag; the ‘victim’), with the tail and head nebulous features originating from its disrupted stars. The fate of the group, once all three objects complete their merging, is probably to form a gE or cD galaxy with Mr ≈ −22.1 mag, stressing that this merging process into a giant galaxy need not take place at the centre of a rich cluster of galaxies.
1 INTRODUCTION
Deep imaging, beyond what is currently available in public data bases e.g. the Sloan Digital Sky Survey (SDSS), has the potential of revealing signs of galaxy interactions, such as low surface brightness (LSB) stellar streams, ‘heated’ galaxy discs and extended galaxy haloes (e.g. Purcell, Kazantzidis & Bullock 2009; Cooper et al. 2010; Purcell, Bullock & Kazantzidis 2010). Such searches have generally been restricted to resolved-star studies of the Milky Way and M31 (e.g. the Pan-Andromeda Archaeological Survey = PandAS; Ibata et al. 2013; Martin et al. 2013), since extending them to more distant objects requires significant detection capability for very LSB extended features. If Λ cold dark matter (ΛCDM) is correct, then dark matter (DM) haloes of galaxy-size should be constructed from the steady accretion of smaller, dwarf-galaxy sized bits of DM and regular matter (e.g. Fakhouri, Ma & Boylan-Kolchin 2010, based on the Millennium simulation). Traces of such accretion events should be detectable, if deep imaging is available.
Outside the cores of relaxed galaxy clusters, the regions with the highest galaxy density are the so-called compact groups (CGs) of galaxies. These were first catalogued by Hickson (1982), who identified 100 CGs by searching the Palomar Observatory Sky Survey (POSS) red prints. Hickson selected the objects to be included in his list by combining the number of group members of comparable luminosity (≥4) with the degree of isolation of the group and the total magnitude of these galaxies averaged over the covered area. The last two criteria were intended to exclude clusters of galaxies, while still selecting high-galaxy-density regions. These galaxy assemblies are called ‘Hickson Compact Groups’ (HCGs).
The HCGs show a very high projected galaxy density, sometimes up to 10|$^8 \, h^{-2}$| gal Mpc−2 (Hickson et al. 1992), thus allowing the study of the formation and evolution of galaxies in a very dense environment that is not a galaxy cluster. In particular, tidal features should appear quickly in HCGs since they have a median crossing time of the order of 1 per cent of a Hubble time (Hickson et al. 1992). Thus HCGs might be the nearby-Universe analogues of rare high-density environments in the young Universe (Amram et al. 2002). Given the high galaxy densities in HCGs, the galaxies within one such group should merge within a few dynamical times (e.g. Bode, Cohn & Lugger 1993).
Hickson Compact Group 98 (HCG 98) is described schematically in fig. 1 of Hickson (1982) and included originally four members, two larger galaxies called a and b, and two smaller and more distant from these two, called c and d. Hickson classified HCG 98 as a type EII CG, meaning that the brightest galaxy was classified as elliptical and the second brightest was fainter by 0.5 to 1.0 mag than the brightest one of the group.
Table 1 presents NED1 data on the group members and their neighbours, as indicated by the ‘environment search’ function of NED, i.e. all objects within 24 arcmin = 750 kpc and 500 km s−1 of the group centre. The search revealed 11 galaxies that could be considered neighbours; extending the search to 36 arcmin and 750 km s−1 added just one more object, implying that HCG 98 and its neighbours are relatively isolated in 3D space, in a rather low galaxy-density neighbourhood.
Neighbourhood of HCG 98.
| HCG 98 ID | Name | (α, δ) J2000.0 | cz (km s−1) | r | Mr | (g − r) |
|---|---|---|---|---|---|---|
| 98 c | N 7783C | 23:54:13.8 + 00:21:25 | 8145 ± 33 | 15.16 | −19.97 | 0.81 |
| 98 b | PGC 72808 | 23:54:12.1 + 00:22:37 | 7959 ± 26 | 13.94 | −21.19 | 0.89 |
| - | SDSS J235411.11 + 002249.6 | 23:54:11.1 + 00:22:50 | 7942 ± ? | 14.89 | −20.24 | 0.91 |
| 98 a | PGC 72810 | 23:54:10.1 + 00:22:58 | 7947 ± 17 | 15.16 | −20.00 | 0.72 |
| - | SDSS J235407.12 + 001618.0 | 23:54:07.1 + 00:16:18 | 7838 ± 27 | 17.17 | −17.96 | 0.72 |
| - | SDSS J235402.45 + 002723.7 | 23:54:02.4 + 00:27:24 | 8273 ± 17 | 17.45 | −17.71 | 0.50 |
| - | SDSS J235408.26 + 001430.0 | 23:54:08.2 + 00:14:30 | 8017 ± 15 | 17.95 | −17.18 | 0.32 |
| - | SDSS J235335.69 + 002623.3 | 23:53:35.7 + 00:26:23 | 8042 ± 21 | 17.41 | −17.72 | 0.70 |
| - | SDSS J235444.26 + 000909.7 | 23:54:44.2 + 00:09:10 | 7887 ± 02 | 20.90* | −14.23* | −0.74* |
| - | SDSS J235517.09 + 001954.7 | 23:55:17.1 + 00:19:55 | 8187 ± 02 | 18.12 | −17.01 | 0.14 |
Notes. HCG 98 and its neighbours, from the NED ‘environmental search’. The original members carry the designator letter from the original paper of Hickson (1982). HCG 98d is a background object, as explained in the text, thus is not listed in this table. The r and (g − r) magnitudes are SDSS cModel AB from NED, except the one marked with an asterisk (*) that was read directly from the SDSS entry. The absolute magnitudes were obtained by assuming a distance modulus of 35.13 for all objects.
N7783 (HCG 98 a) is described as an S0+ galaxy in NED and its SDSS spectrum is that of an evolved stellar population. PGC 72808, which is HCG 98 b, has r = 13.9 mag (SDSS Model) and is classified E?. Its SDSS spectrum does not show emission lines but is very similar to that of component a. Note that even though these galaxies present absorption-line stellar spectra in SDSS, both are GALEX MIS UV sources with more than 4000 s exposure (a: FUV=22.89 ± 0.87; NUV = 19.37 ± 0.13 and b: FUV>21.0; NUV = 20.31 ± 0.21, both as Kron flux in elliptical apertures). The c component, PGC 72810, also carries the E? classification, has r=15.1 mag and GALEX FUV>21.17; NUV = 21.15 ± 0.31, while its SDSS spectrum is rather similar to that of components a and b. The UV emission is extended and might signify that either some star formation took place in the last few 100 Myr, or that the UV emission originates from a population of hot evolved stars. HCG 98a has (NUV-r) = + 4.21 while galaxy b has (NUV-r) = + 5.15, implying that, with the listed Mr, galaxy a belongs to the ‘green valley’ while galaxy b is closer to the ’red cloud‘. These two terms refer to the galaxy colour--magnitude diagram, where the red sequence is populated by late-type red galaxies, the blue cloud consists of star-forming galaxies, and the green valley is the area between these regions, occupied by the so-called transition galaxies, as shown from the SDSS analyses of Strateva et al. (2001) and Wyder et al. (2007).
SDSS J235444.26 + 000909.7 has no SDSS photometry in NED, but the SDSS entry itself gives its magnitudes in the survey bands. It is a diffuse, elongated, possibly spiral object, and the SDSS finding chart indicates that it is strongly affected by the diffraction pattern of the bright star about three arcmin south of it. This is probably why the (g − r) = −0.74 listed in Table 1 is so odd. Finally, component d = PGC 72806, which is ∼1.4 arcmin North of the two main galaxies and is not listed in Table 1, has r = 16.3 mag, is classified as an S0+?. and is not listed in NED as a GALEX source, but from galexview2 it has FUV=19.4 and NUV = 19.4. Interestingly, its SDSS b-band image posted in NED shows a small appendix emerging from its Southern end to the NW, which could be part of a spiral arm. Its SDSS fibre spectrum slopes to the blue, shows strong Hα, [Nii], [Sii] emission, while Hβ shows a sharp emission line in a wide absorption. SDSS notes it as a ‘star-forming galaxy’. However, with a redshift of 14 950 km s−1 this is clearly a background object and does not belong to HCG 98. This is why we give no further information on it.
Table 1 allows locating the HCG 98 members in a Mr versus (g − r) diagram, basing the comparison with the general galaxy population on the plot given as fig. 18 in Zehavi et al. (2011). This indicates that most objects fall in the red sequence area, with three falling in the ‘bluer’ region with (g − r) ≤0.50. These three are small and rather blue objects, for which NED carries no morphological classification. The 10 galaxies listed in Table 1 have a velocity distribution peaked at <cz > = 8034 km s−1 with a dispersion of 147 km s−1, similar to the peak of the σ distribution for compact galaxy groups with three members (see fig. 9b of Sohn et al. 2015)
Coziol & Plauchu-Frayn (2007) used J, H and K imaging of 25 galaxies in eight CGs, among which was HCG 98, to study galaxy asymmetries that could be linked to nuclear activity. They found evidence for tidal interactions, cannibalism, and galaxy mergers under ‘dry’ conditions. They assigned HCG 98 to their class B, i.e. galaxies in the most active phase in the evolution of the group, where nuclear activity in early-type galaxies is often found. They classify the two main galaxies of the group as E1 (component a) and E3 (component b) although later in their paper they call 98 a a ‘barred lenticular’. Note that their analysis relies only on the near-IR images of these two galaxies. They interpret the slightly bluer (H−K) colour of 98a (from 2MASS) as resulting from a close interaction. Their analysis also reveals an excess of light in component b pointing in the direction of a.
We observed HCG 98 among other CGs to complement our work of deep imaging of >100 edge-on discs, where we search for signs of interactions in the form of stellar tail and faint companions. Deep imaging of HCGs allows a similar search in environments where such processes should be more frequent and, perhaps, also more violent. Román & Trujillo (2017) imaged HCG 98 using very deep, co-added SDSS images from the IAC Stripe 82 Legacy Project (Fliri & Trujillo 2016). These images, in u, g, r, i and |$z$|, are 2--3 mag deeper than regular SDSS image since they were produced by co-adding some 80 individual images. The image of the group, shown in their fig. 1, exhibits the two features mentioned below, a tail and a diffuse envelope. However, since their paper concentrates on ultra-diffuse dwarf galaxies in the neighbourhood (two near HCG 98), the tail and halo reported here receive little or no discussion.
The structure of this paper is as follows. Section 2 describes briefly our observations and their reductions, as well as the results of the IAC Stripe 82 Project for HCG98 from Román & Trujillo (2017). Section 3 details our analysis of the results, and in Section 4 HCG98 is discussed in the context of a possible scenario for its formation and evolution. Section 5 summarizes this paper.
2 OBSERVATIONS AND DATA REDUCTION
HCG 98 was observed with the 28-inch ‘Jay Baum Rich telescope’ (hereinafter JBRT) at the Wise Observatory, Israel, extensively described in Brosch et al. (2015). Briefly, this is a 28-inch (0.7-m) Centurion-28 prime-focus f/3.1 reflector, imaging an ∼1º wide field of view on to a CCD camera behind a doublet field-corrector lens. The camera is a Finger Lakes Instruments ProLine 16801 equipped with a five-position filter wheel and thermoelectrically cooled to approximately –30°C using water assist. The plate scale is 0.83 arcmin pixel−1, the images are digitized to 16 bits, the readout is done at 8 MHz, and the dark counts are ∼0.05 s−1 pixel−1. The 4k × 4k chip covers a bit less than 1 deg2 of the sky and has a peak quantum efficiency of 67 per cent at 661 nm.
The observations were performed on 2017 August 29 when HCG98 was followed for about seven hours. The observations were successive 300-s exposures, dithered in arbitrary directions by at most 20 pixels. A ‘luminance’ filter, hereafter called L-filter (Baader Planetarium UV/IR-cut), was used throughout; it selects an ∼250-nm wide spectral region (L band) centred on ∼560 nm and with in-band transmission better than 94 per cent. With its sharp cutoffs at ∼400 and ∼690 nm, this filter reduces the sky background by excluding the blue-UV light originating from Hg street lamps as well as the red atmospheric emission. A total of 55 L-band images were obtained, were processed, and were combined into a final image. The reduction process used the theligui package (Erben et al. 2005; Schirmer 2013) and included bias and dark subtraction, flat-fielding using morning twilight exposures, and astrometric registration. The registered images were median-combined into a final image after outlier rejection.
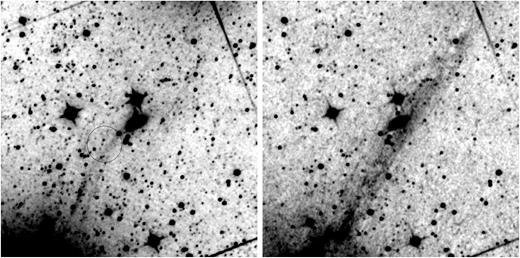
Following the observations and their reductions, the JBRT final image was visually inspected and a long and narrow tail was revealed, emerging from the general location of the two main galaxies of the group. Confirmation observations were immediately sought with the sister telescope to the JBRT, an almost-identical 28-inch reflector operated by RMR at the Polaris Observatory in California and called the ‘Jeanne Rich’ telescope (JRT; Rich et al. 2017). These observations, obtained through a similar luminance filter and using an FLI0900 imager, confirmed the reality of this feature. The tail is also clearly detected in additional deep SDSS g and r images obtained with the JRT. As already mentioned, the finding chart for HCG 98 posted on the SDSS web site does seem to show this tail, though considerably weaker than shown here due to the shallower nature of the regular SDSS images. Calibrating our luminance images to the Johnson-R band shows that faintest details visible in our final deep image reach a surface brightness of ∼28.5 mag arcsec−2. The JBRT and JRT full-size images are shown in Fig. 1.
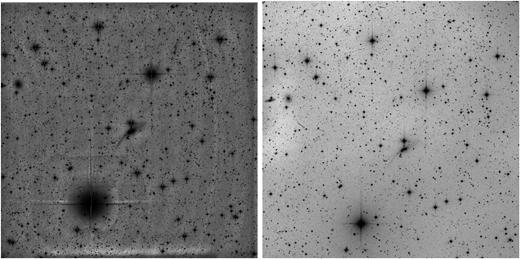
Left panel: the Hickson Compact Group 98. This is the JBRT co-added composite of 55 images, each exposed for 300-s through the L-band filter, unsharply masked and contrast-stretched, to reveal low-surface brightness details in the galaxies. North is up and West is to the right. Right panel: confirmatory image from the JRT telescope obtained in a similar way with the same L-band filter.
Given the group’s equatorial declination, its members have been scanned many times as part of the SDSS IAC Stripe 82 Project (Fliri & Trujillo 2016). Thus using the co-added SDSS u, g, r, i, |$z$| frames one can reach fainter surface brightness levels than with regular SDSS images. Stripe 82 was scanned by the SDSS telescope approximately 80 times, thus the project’s images are significantly deeper than those of the regular survey, reaching σr ≈28.5 mag. For HCG 98 one finds essentially the same features as revealed by the JBRT and JRT telescopes. This co-added SDSS-r image is shown here in Fig. 2 and it shows essentially the same features as the JBRT and JRT images. Note the straight feature running vertically right of the system; this is a result of stitching two adjacent 0.5 × 0.5 deg2r band rectified fields
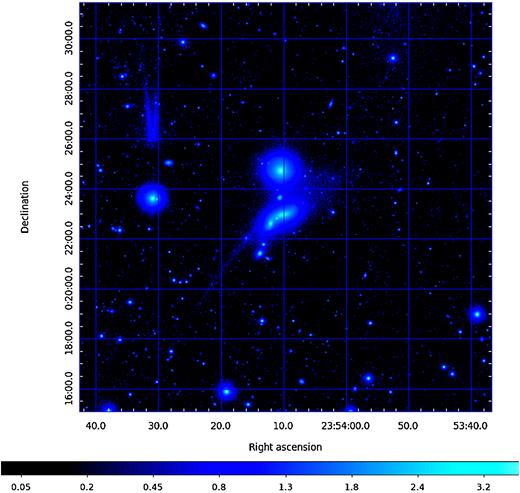
HCG 98 from the deep r image of the IAC Stripe 82 Project (Fliri & Trujillo 2016). The image has been contrast-stretched and is presented here with a logarithmic look-up table to emphasize faint features. Equatorial J2000 coordinates set the scale of this image, which has north to the top and west to the right.
This image is essentially identical to the colour one shown in fig. 1 of Román & Trujillo (2017) and to the images obtained with the JBRT and JRT telescopes..
Fig. 2 shows that the two main galaxies of the group are located at the ‘bottom’ part of the extended halo, in a brighter region of it. The tail is slightly bent but coherent and, with the exception of a star-like object at its ‘root’, where the tail joins the halo, appears featureless in all its LSB extent.
3 ANALYSIS AND RESULTS
Inspecting the deep images of the group shows that HCG 98 b exhibits the above-mentioned faint tail visible to the SE of the galaxy. This feature was already described in a note posted on the Cloudy Nights3 web site and it is also faintly visible on the SDSS finding chart of the group, but the single reference to it in the scientific literature is in Román & Trujillo (2017). The IAC Stripe 82 Project image shows exactly what the JBRT and the JRT co-added luminance images show. The various components of the system are shown and identified in Fig. 3. The tail, in the deep images, is more than 4 arcmin long. and is at position angle ∼55°. As the distance of the group is 111 Mpc (from NED4), the plate scale is 32.2 kpc arcmin−1, and the tail is at least 147 kpc long, if indeed it is part of the group, as we assume here. The tail has an almost constant width for its entire length; this is about 27 arcsec ≃15 kpc. All these measures refer to the sizes of the different components as estimated by eye from the various images and isophote plots; we estimate the accuracy of the various values to ∼1 arcsec≃500 pc.
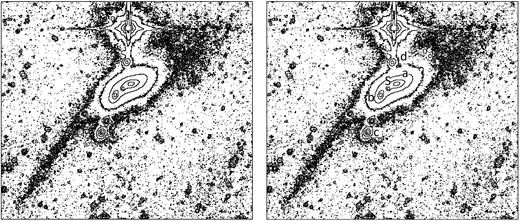
Left panel: Isophote display of HCG 98 from Fig. 2. The long tail and the faint envelope are emphasized. Right panel: The isophote plot with the different components discussed in the paper clearly labelled with the HCG prefix missing (for clarity). Label S corresponds to galaxy SDSS J235411.11 + 002249.6.
The two main galaxies, HCG 98 a and 98 b, are enveloped in a common faint elliptical halo or envelope; this is reported here for the first time. The halo is only slightly brighter (in surface brightness) than the long tail and extends to the North-West (opposite the tail) to about the same distance from the group centre as the tail itself. Here we take the group centre to be mid-way between components a and b, i.e. (23:54:11.1; + 00:22:10.5).
When discussing extremely faint extended features next to brighter image elements one has to be careful not to include false features caused by scattered light. We therefore point the reader to the Stripe 82 Project image and to the images from the JBRT and JRT telescopes shown above. Since the images were obtained with different telescopes and show the same LSB diffuse features, it is unlikely that the tail and halo reported here were caused by scattered light, which would be different in different instruments. Moreover, it should be sufficient to compare the round light haloes created around the bright stars in the JBRT and JRT images with the elongated halo around the galaxy group to convince one that the latter feature could not have been created by scattered light. However, the estimation of the total light produced by the envelope would certainly be affected, mainly by the scattered light from the bright star just North of the group, and in a more minor way from the star located between the two main galaxies of the group. This star, and its influence on the measurements, will also be discussed below.
The dimensions of the diffuse halo are ∼170 kpc major axis at position angle ∼32° and ∼69 kpc minor axis, all measured where the isophotes reach the sky brightness. This envelope size is ∼50 per cent larger than any found in a survey of nearby galaxies (Rich et al. 2017, 2018 in preparation). The two features together give the impression of an arch with one end wider than the other, or of a tadpole shape. It is logical to consider them parts of the same entity, since the long axis of the envelope does not deviate by much in position angle from the mid-axis of the tail, a difference of ∼23° ± 2°. A similar alignment criterion was also used by Straughn et al. (2006) when selecting tadpole galaxies from the Hubble Ultra Deep Field; they required that the tail be within 20° of the major axis of the tadpole head.
Note that this extended envelope, hereafter called ‘the head’ or ‘the halo’, could not have been strongly influenced by the bright star north of the system (HD223975, V = 9.87) since the envelope does not extend north of the star. To emphasize this, we plot in Fig. 3 isophotes of the region of interest, with the lowest con tour at 27.5 mag arcsec−2 and each subsequent con tour five times brighter than the previous con tour. Fig. 3 shows that the head extends in the direction opposite to the tail even more than the tail, say of the order of 170 kpc, but being wider (∼67 kpc; minor axis) does not have a similar linear correlation nor does it have a sharp border, as one would have been expected were this a shell feature. The right panel of this figure carries labels for the objects discussed here.
The tail, which we previously supposed to connect with HCG 98 a and b, is probably missing both galaxies and passes north of HCG 98 a but appears to point to HCG 98 d, the object with the strong emission lines and a blue-sloping continuum characteristic of a star-forming galaxy. However, the very discordant redshift of HCG 98 d, the galaxy just north of a and b and south of the star, when compared to those of the three other galaxies, makes this supposed association unlikely. This was also the conclusion of Anosova & Kiseleva (1993) from their study of HCGs with discordant redshift members, implying that it is probably a chance superposition. All four galaxies of the group are UV sources, visible in the GALEX NUV MIS image, with a possible connection between a and b, while neither the long tail nor the extended faint envelope is visible, as could have been expected were these features produced by ionized gas emission around massive young stars.
Fig. 4, where UV con tours are plotted over the r image, shows that the two major galaxies of HCG 98 are both extended UV sources and that, at low UV surface brightness levels, they appear to be embedded in the common envelope. At the GALEX resolution of 4--5 arcsec, and observing the UV isophotes, we cannot establish whether the UV emission is structured or is uniform, thus cannot determine whether it is produced by a relatively young stellar population, or by a diffuse old population.
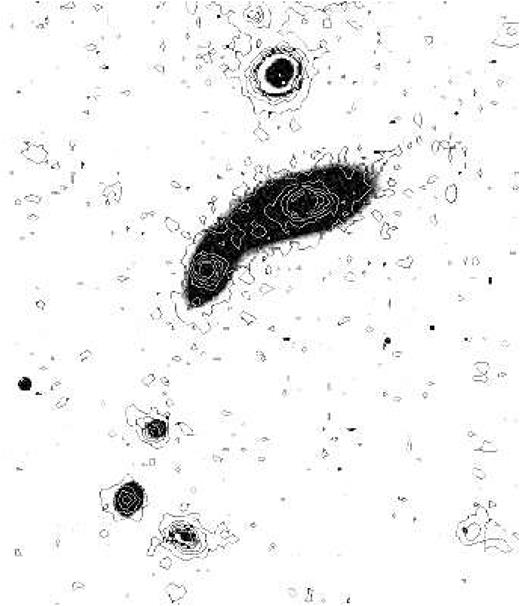
Con tours of the UV emission from the GALEX view of HCG 98, obtained by adding the FUV to the NUV frames, plotted over the r-band image of HCG 98. Note that neither the tail nor the extended halo are visible in the UV.
Fig. 5 shows two 20-arcmin wide near-infrared images obtained by the Wide-field Infrared Survey Explorer (WISE) satellite. This mission surveyed the entire sky at 3.4, 4.6, 12 and 22 μm (W1 through W4 bands) and using the archived images might yield information about the possible composition of the diffuse features in HCG 98, although the WISE image quality is rather low, ∼6 arcsec at the shortest three bands. While the images are dominated by the oblique stripes originating from the bright star XZ Psc (K∼0.13 mag) some 20 arcmin South-East of HCG 98, the curving tail shown in Fig. 2 is clearly visible in the W1 band and is marked by the southern oval. The faint extension of the halo is also visible and is marked in the figure by the northern oval. The right panel, with the W2-band image, does not show these features; if present they are probably much fainter and are masked by the stripes radiating from the bright star, implying that the tail is detected in the optical and at 3.6 μm but probably not at 4.6 μm. Measuring the tail brightness on the W1 image is complicated by the presence of the oblique strips mentioned above; this is why we do not give it here. However, the near-IR emission in W1 observed from the tail and head supports the possibility that both diffuse features contain mostly evolved stars and are not sites of recent star formation.
WISE near-infrared images of the HCG98 region; left panel W1 band (3.4 μm), right panel W2 band (4.6 μm). The images show the slightly curved tail in the left panel within the traced circle; the tail is not visible in the right panel.
We measured the brightness and colours of the tail and the head using the IAC Stripe 82 Project images of Fliri & Trujillo (2016) that have had the sky background subtracted, using SAOimage DS95 hand-drawn polygonal areas on the images and by selecting the median value from the statistics of each area (to eliminate outliers produced by faint foreground stars or background galaxies). The polygons used for these measurements are shown in Fig. 6 overplotted on the SDSS r image and they cover significantly clear parts of the tail and the halo, but not all the features because of the difficulty in eliminating the diffuse objects and the influence of the bright star. The results are listed in Table 2 and show that the tail is slightly fainter than the full tadpole head. Checking the images in the different bands of the Stripe 82 Project (Fliri & Trujillo 2016) shows that the tail is redder than the head and shows a colour gradient, with the bluest part close to the head and getting redder the further away from the head one goes. The head itself shows colour variation as well, with its northern part bluer than its southern side.
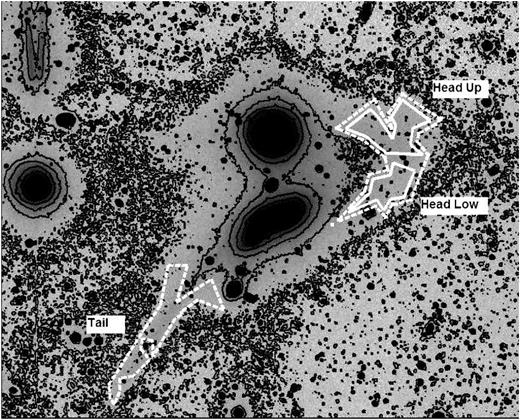
Plot of the deep luminance image with tracings of the regions mentioned in the paper (dashed con tour = the entire head area) where the median surface brightness was measured; in the W1 band only the entire head was measured.
SDSS data for HCG 98 from the Stripe 82 project.
| Region | Area (arcsec2) | r | (u − g) | (g − r) | (r − i) | (i − |$z$|) |
|---|---|---|---|---|---|---|
| Tail | 5171.8 | 19.10 | 0.08 | 0.70 | 0.42 | 1.11 |
| Head up | 3457.3 | 18.77 | 0.14 | 0.43 | 0.38 | 0.77 |
| Head low | 2028.6 | 18.81 | 0.53 | 0.58 | 0.20 | 0.84 |
| Head all | 6230.9 | 18.67 | 0.29 | 0.49 | 0.31 | 0.81 |
We also used the Fliri & Trujillo (2016) deep r-band image to derive morphological parameters for the brighter objects of interest. These were produced using the galaxy decomposition analysis code deca (Mosenkov 2014). deca is a python library using the codes of Source Extractor (SExtractor; Bertin & Arnouts 1996), galfit (Peng et al. 2002), and iraf6 to perform automatic decomposition of galaxy images. deca detects the sources in the image automatically, identifying the target galaxy, masking the foreground stars and unrelated galaxies, re-determines the local sky background in a small region containing the target galaxy and subtracts it, and extracts a star-cleaned image of the target galaxy. This image is analysed with galfit to determine various galaxy parameters, such as the proper profile of the bulge if present, the disc parameters, etc.
The models tested at the fitting stage are of an exponential disc for late-type spirals, ‘edge-on’ for discs at an inclination close to 90° to the line of sight, and a Sérsic profile (Sérsic 1963) with different indices, for elliptical galaxies or bulges. Various combinations of these models are also tested and the best fit is chosen based on a |$\chi ^2_\nu$| (reduced χ square test).
The DECA-derived best-fitted parameters are listed in Table 3.
Decomposition of objects in HCG 98 with DECA.
| Object | mr (bulge) | Re (bulge; kpc) | n (bulge) | mr (disc) | Re (disc; kpc) | n(disc) |
|---|---|---|---|---|---|---|
| HCG 98 a | 14.23 | 1.36 | 3.1 | 15.55 | 7.10 | 0.8 |
| HCG 98 b | 13.04 | 5.12 | 2.4 | 13.26 | 48.96 | 2.0 |
| Object | mr (bulge) | Re (bulge; kpc) | n (bulge) | mr (disc) | Re (disc; kpc) | n(disc) |
|---|---|---|---|---|---|---|
| HCG 98 a | 14.23 | 1.36 | 3.1 | 15.55 | 7.10 | 0.8 |
| HCG 98 b | 13.04 | 5.12 | 2.4 | 13.26 | 48.96 | 2.0 |
Notes. mr is the total r magnitude of the object, Re is the effective radius in arcsec and n is the Sérsic index fitted by DECA. The goodness-of-fit |$\chi ^2_\nu$| was 1.05, implying a very good fit.
The decomposition exercise, which might bring more understanding to the intrinsic properties of the galaxies, showed that while component a can be modelled as an exponential disc with a bright extended bulge, this is not the case for the other object. HCG 98 b shows a non-exponential disc and a central component that could be a bulge or a bar.
SDSS J235411.11 + 002249.6, which lies between these two components, is not sufficiently resolved in the deep r image of Fliri & Trujillo (2016). This object resembles a star, an AGN or a galaxy remnant and is discussed below. In the following section we sum the luminosities of the various components of the merging group to derive its total luminosity.
4 DISCUSSION
It is interesting to consider other galaxies that show features similar to those in HCG 98. These could be Arp 105 (N3561) where a spiral galaxy and an S0 or E galaxy interact, and matter pulled out from the spiral forms two tails pointing in opposite directions exhibiting star formation (Duc & Mirabel 1994). The Tadpole Galaxy (UGC 10214 = Arp 188) is an SB(s)bc: galaxy with a 75 kpc long diffuse tail toward North-East in which Jarrett et al. (2006) see significant star formation activity in all regions. The Mice Galaxy (Arp 242, N4676) where two strongly interacting disc galaxies produce tails in opposite directions (Higdon et al. 2014). The tail from N 4676A is unusual since it starts out blue and terminates in a more yellowish colour. The HST ACS image7 hints that the long tail may actually be one of the spiral arms of N4676B (the southern galaxy) that has been unusually stretched to the north. This, despite the fact that spiral arms begin yellow near the bulge in almost all spirals and terminate in a bluish colour.
The difference between the two main galaxies in HCG 98 and the apparently similar systems described above is that in our case the two brighter interacting objects are morphologically classified as early-type disc galaxies, and the colours of the tail and head observed in HCG 98 do not correspond to a (previously) star-forming galaxy. While the presence of the faint tail, which is much longer than in other galaxies, and very extended envelope or halo around HCG 98 a and 98 b, indicates that some kind of interaction did take place, it is interesting to try to identify which other objects could have been involved in this interaction and when did this process happen. We have already ruled out HCG 98 d, which seemed to be aligned with the tail extension and also showed strong signs of star formation, given its very discordant redshift.
In Table 1 we listed the group members and seven other objects from SDSS that have been selected via the environment search feature of NED, i.e. they are within 750 kpc projected distance and 500 km s−1 velocity difference. We point out, in particular, the object SDSS J235411.11 + 002249.6 that is visible as a star-like image between the two brightest objects of the group HCG a and b. Coziol & Plauchu-Frayn (2007) consider it to be a foreground star, but NED classified it as a galaxy and gave a redshift matching that of the group. The redshift source quoted in SDSS is from the redshift survey and search for groups and clusters in the SDSS data base using friend-of-friends percolation analysis by Berlind et al. (2006), but not an actual measured redshift. Its properties appear more similar to those of a galactic bulge than to those of a regular galaxy.
This object is located almost exactly at the centre of the tadpole-shaped feature made of the tail and the head, and appears as a very green object on the SDSS finding chart. From its SDSS colours, and assuming it is a galaxy part of the group, we could put it safely in the red sequence of the Mr versus (g − r) diagram. Note that this object is listed as unresolved in SDSS with a diameter of about 10.5 arcsec, implying a diameter of ∼5.5 kpc and Mr ≃−20.23 mag. with (g − r) = 0.91 and (u − g) = 2.23, corresponding to the colours of an early-type object (Strateva et al. 2001; Wyder et al. 2007) and the absolute magnitude of the bulge of a smallish galaxy (see fig. 4 in McLure & Dunlop 2002). The deep IAC Stripe 82 Project r image shows that its profile deviates at LSB levels from that of random stars in the image, which would support a galaxy identification. However, checking the second data release of GAIA8 we found that at the coordinates of this object the catalogue lists a star with a significant parallax of 1.56 ± 0.05 mas, with the GAIA identification number of 2642374248275736448, an approximate mid-K spectral type and rp ≃16.2 mag. SDSS J235411.11 + 002249.6 is therefore not a galaxy or part of a galaxy as stated in NED but rather a foreground star as stated by Coziol & Plauchu-Frayn (2007), which by chance is seen just between components a and b of HCG 98.
We can therefore propose a scenario in which a gas-poor small galaxy (’the victim’) merged with the HCG 98 a and b that are in the early stage of a binary interaction, with the victim disc stars forming the tail as a tidal feature and the head in the opposite direction as a ‘tidal spray’, with part of the linear motion of stars in the head transferred to perpendicular directions after the projectile’s stars were scattered by the target stars. The colours of the diffuse components correspond to those of galaxies at the border between the red sequence and green valley (for the tail) and the blue sequence for the head (Blanton et al. 2003). Since the diffuse features do not show bright regions, which could have been interpreted as loci of strong star formation, nor UV emission, this indicates to us that the victim galaxy was gas-poor.
In Table 2 we used the transformation given in the web-based description of the IAC Stripe 82 Project (Fliri & Trujillo 2016) to convert from counts to AB magnitudes, and the transformation of Frei & Gunn (1994) from the AB system to SDSS magnitudes to yield the mean r magnitudes of the different parts of the feature. Using the data from Table 2, integrating over the tail and head, and excluding the DECA-derived brightness of the SDSS J235411.11 + 002249.6 foreground star located between the two major galaxies of the group, it is possible to derive a lower limit to the light contributed by the diffuse components and by the presumed bulge of the projectile galaxy. We stress that this is a lower limit since our measurements of the diffuse components probably missed some LSB flux, but point out that not much could have been missed thus the lower limit should be close to the actual total brightness. This yields mr ≃18.43 mag or an absolute magnitude of Mr ≃−16.7, i.e. the victim was probably a dwarf galaxy significantly fainter than the two main galaxies of the group.
Duc (2017) discussed observations and simulations of interactions involving massive galaxies. He stated that ‘minor mergers produce narrow stellar streams; major wet mergers are characterized by prominent star-forming tidal tails; major dry mergers induce the formation of faint broad gas-poor plumes’. In HCG 98 we witness both a narrow stellar stream (the tail) and a faint plume (the halo). Could these features be the sign of two separate mergers, one minor forming the tail and another major and dry making the gas-poor plume? Or could the tadpole shape be formed in a single such event? We have mentioned above the similarity of the diffuse head and tail observed in HCG 98 to a tadpole shape. Straughn et al. (2006) identified tadpole-shaped galaxies in the Hubble Ultra Deep Field (HUDF). Local tadpole galaxies were studied by Elmegreen et al. (2012) and by Sánchez Almeida et al. (2013). While Straughn et al. stress the unrelaxed morphology, stating that tadpole galaxies would be seen some 0.7 Gyr following the merger, the heads of the objects dealt with by Sánchez Almeida et al. are star-forming knots and Sánchez Almeida et al. interpret their results as showing that local tadpole galaxies could be ‘discs in early stages of assembling, with their star formation sustained by accretion of external metal-poor gas’.
In the present case, some interaction-triggered star formation could have been taking place given that the main galaxies are GALEX sources. Given the red nature of the galaxies, this suggests that the GALEX emission could instead originate from an extended population of evolved He-burning stars (UVX emission). In most simulations of merging galaxies the studied cases are of binary mergers, where only two interacting galaxies cause the merging. In HCG 98 we witness a triple and essentially dry merger, with HCG a and b being very close but not yet merging, and a gas-poor dwarf galaxy being disrupted by the influence of both galaxies a and b. The ‘victim’ galaxy’s stars have formed the tail from its last parts yet to be accreted, while the first parts, already accreted, produced the ‘tidal spray’ showing now as the ‘head’, after the dynamical friction with the stars of HCG a and/or b transferred some of their linear velocity to transversal motion. Alternatively, we would have to assume that separate mergers formed on the one hand the tail, and on the other the head which coexist at the present time. Given the significant alignment between the tail and the long axis of the head (within ∼23°), we consider this ‘separate mergers’ option to be less likely.
It is possible to derive some information about the merger process from the dimensions of the diffuse features. While we see a fairly coherent and narrow tail, although slightly bent, the head is a diffuse structure with an ∼1:2.5 ratio of minor to major axes and with the major axis longer than the tail, i.e. some 170 kpc long by ∼67 kpc wide. Since in a dry merger the stars suffer elastic collisions, their velocities are virtually unchanged but their directions are modified. The highest relative velocity with respect to HCG 98 a and b, along the head’s major axis, would be from victim stars that have not suffered significant scattering. Victim stars along the minor axis have been scattered, and part of their kinetic energy has been transferred to stars of HCG 98 a and/or b. Assuming that the time required to reach the present form is one dynamical time of a major galaxy (HCG 98 a and b combined), i.e. of the order of one rotation period for a disc, some 300 Myr, e.g. Binney & Tremaine (1987) the velocity required to cover a distance of ∼200 kpc is of the order of 600 km s−1. This is larger than the free-fall time for a major galaxy and is about four times the velocity dispersion of the objects in Table 1, indicating that this merger was a fast one. Finally, by adding the brightness of components a and b to the small one calculated here for the victim galaxy we find that this is Mr ≃−22.1, brighter than the brightest cluster galaxies but corresponding to that of a giant elliptical or a cD galaxy. This indicates that, once the merging of these three objects would be complete, HCG 98 would become a gE or cD galaxy, even though the location would not be at the centre of a rich galaxy cluster.
5 SUMMARY
We have shown that deep imaging of the HCG 98 group, reaching to ∼28.5 mag arcsec−2 and fainter, reveals (a) an ∼150 kpc long tail that is only ∼15 kpc wide, and (b) a faint elliptical envelope (the head or halo) around the group that extends in a direction ∼away from the tail to ∼170 kpc with a minor axis of ∼67 kpc and is significantly wider than the tail. The group is located in a fairly low galaxy-density environment. The reality of the tail and envelope was confirmed by imaging with different telescopes, as well as by analysing co-added SDSS images obtained as part of the IAC Stripe 82 Project of Fliri & Trujillo (2016) reaching surface brightness levels of ∼28.5 mag and images of similar depth from the JBRT and JRT telescopes. The tail is also visible in the W1 band image of WISE. The victim galaxy was a gas-poor dwarf object of Mr ≃–16.7 disrupted while interacting with the two major galaxies in HCG 98. When all three objects would finally merge, the result would be a cD or a giant elliptical galaxy that would not reside in a rich galaxy cluster. We also show from consulting GAIA 2 catalogue that an object classified in SDSS as a galaxy of the group is in reality a foreground star.
ACKNOWLEDGEMENTS
Funding for the SDSS and SDSS-II has been provided by the Alfred P. Sloan Foundation, the Participating Institutions, the National Science Foundation, the U.S. Department of Energy, the National Aeronautics and Space Administration, the Japanese Monbukagakusho, the Max Planck Society, and the Higher Education Funding Council for England. The SDSS Web Site is http://www.sdss.org/.
The SDSS is managed by the Astrophysical Research Consortium for the Participating Institutions. The Participating Institutions are the American Museum of Natural History, Astrophysical Institute Potsdam, University of Basel, University of Cambridge, Case Western Reserve University, University of Chicago, Drexel University, Fermilab, the Institute for Advanced Study, the Japan Participation Group, Johns Hopkins University, the Joint Institute for Nuclear Astrophysics, the Kavli Institute for Particle Astrophysics and Cosmology, the Korean Scientist Group, the Chinese Academy of Sciences (LAMOST), Los Alamos National Laboratory, the Max-Planck-Institute for Astronomy (MPIA), the Max-Planck-Institute for Astrophysics (MPA), New Mexico State University, Ohio State University, University of Pittsburgh, University of Portsmouth, Princeton University, the United States Naval Observatory, and the University of Washington.
SAOImage DS9 development has been made possible by funding from the Chandra X-ray Science Center (CXC) and the High Energy Astrophysics Science Archive Center (HEASARC). Additional funding was provided by the JWST Mission office at Space Telescope Science Institute to improve capabilities for 3D data visualization.
This research has made use of NASA’s Astrophysics Data System Bibliographic Services.
We acknowledge constructive remarks by an anonymous referee.
