


ABSTRACT
We have investigated the metallicity distributions of mono-age stellar populations across the disc for 6 ≲ R ≲ 12 kpc and |Z| ≲ 2 kpc using samples selected from the main-sequence turn-off and subgiant (MSTO-SG) stars targeted by the LAMOST Galactic spectroscopic surveys. Both the mean values and the profiles of the distributions exhibit significant variations with age and position. We have found that the oldest (>11 Gyr) stars have nearly flat radial [Fe/H] gradients at all heights above the disc but show negative vertical [Fe/H] gradients. For stars younger than 11 Gyr, the radial [Fe/H] gradients flatten with |Z|, while the vertical [Fe/H] gradients flatten with R. Stars of 4–6 Gyr exhibit steeper negative radial [Fe/H] gradients than those of either younger or older ages. The values of [α/Fe] of mono-age stellar populations also show significant radial and vertical gradients, with patterns varying with age. The [Fe/H] distribution profiles of old (>8 Gyr) stars vary little with R, while those of younger stars exhibit strong radial variations, probably as a consequence of significant radial migration. The radial distribution profiles of [α/Fe] show the opposite patterns of variations with age to those of [Fe/H]. We have also explored the impact of stellar mixing by epicycle motions (blurring) on the [Fe/H] and [α/Fe] distributions, and found that blurring changes mainly the widths of the distribution profiles. Our results suggest that the disc may have experienced a complex assemblage history, in which both the ‘inside-out’ and ‘upside-down’ formation processes may have played an important role.
1 INTRODUCTION
As a typical disc galaxy, our own galaxy the Milky Way (MW) is an excellent laboratory in which to test scenarios of galaxy formation and evolution, with the advantage that the individual stars in the MW can be resolved. Because most of the MW’s baryons and angular momentum are in the disc, knowledge of how the disc was formed and assembled is key to understanding the formation and evolution of our Galaxy. Many questions regarding the disc formation and assemblage remain open, however, and there is much ongoing debate about these topics (e.g. Rix & Bovy 2013).
The surface chemical composition of low- and intermediate-mass stars remains almost unchanged during the main-sequence and turn-off evolutionary stage, which makes it a fossil record of the environment of the interstellar medium at the positions and times of the births of these stars. The stellar number density N is a function of metallicity [Fe/H] and α-element to iron abundance ratio [α/Fe] at a given disc position of radius R and height Z and age τ. It is expressed as stellar metallicity distribution function, MDF ≡ N([Fe/H], [α/Fe] | R, Z, τ), which is dependent on many complex physical processes, including the infall and outflow of gas (Larson 1976; Colavitti, Matteucci & Murante 2008; Pezzulli & Fraternali 2016; Andrews et al. 2017; Toyouchi & Chiba 2018; Grisoni, Spitoni & Matteucci 2018), supernova feedback (Kobayashi & Nakasato 2011), secular evolution (e.g. radial migration; Sellwood & Binney 2002; Roškar et al. 2008; Schönrich & Binney 2009; Minchev & Famaey 2010; Loebman et al. 2011; Haywood et al. 2016), non-axisymmetric perturbations (e.g. by the central bar or spiral arms), and the accretion of dwarf galaxies (Quinn, Hernquist & Fullagar 1993). The stellar metallicity distributions therefore provide strong constraints on the Galactic disc formation and evolution history, especially concerning when, where and how much these processes affect the assemblage and evolution of the Galactic disc.
The gradients of [Fe/H] and [α/Fe] represent the first-order variations with spatial position (the slopes) of the zero-order MDF (the mean values). The [Fe/H] gradients in the radial and vertical directions have been determined with a variety of tracers, including OB stars (Daflon & Cunha 2004), Cepheid variables (Andrievsky et al. 2002; Luck, Kovtyukh & Andrievsky 2006), H ii regions (Balser et al. 2011), open clusters (Chen, Hou & Wang 2003; Magrini et al. 2009), planetary nebulae (Costa, Uchida & Maciel 2004; Henry et al. 2010), FGK dwarfs (Katz et al. 2011; Cheng et al. 2012; Boeche et al. 2013), (red) giant stars (Hayden et al. 2014; Boeche et al. 2014) and red clump stars (Huang et al. 2015). The results reveal that the disc has negative gradients in both the radial and the vertical direction. The gradients have also been demonstrated to exhibit significant spatial variations. The observed negative radial [Fe/H] gradients generally support the ‘inside-out’ disc-forming scenario. On the other hand, none of the above studies clearly shows how the [Fe/H] gradients vary among different stellar populations, owing to the lack of robust age estimates for a large sample of stars. In a pioneering study, Xiang et al. (2015b) determined the radial and vertical [Fe/H] gradients of mono-age stellar populations using a sample of 0.3 million main-sequence turn-off (MSTO) stars with robust age estimates selected from the LAMOST Spectroscopic Surveys of the Galactic Anti-Centre (LSS-GAC; Liu et al. 2014; Yuan et al. 2015). They found that both the radial and the vertical gradient show strong variations among different mono-age stellar populations. The radial gradients are very small for the oldest populations, become steeper as age decreases, reaching a maximum (steepest slope) at age 6−8 Gyr, and then flatten again with decreasing age. The vertical gradients generally flatten with decreasing age for τ < 11 Gyr. Their results suggest that the disc may have experienced at least two assemblage phases.
The MDF profiles contain rich information on the Galactic disc assemblage history. The profile of the [Fe/H] distribution in the solar neighbourhood has been widely studied (e.g. van den Bergh 1962; Nordström et al. 2004; Casagrande et al. 2011). The results show very broad [Fe/H] profiles in the solar neighbourhood, suggesting that both gas dynamics and stellar migration have played important roles in the disc assemblage history. Beyond the solar neighbourhood, the variations of the [Fe/H] distribution with position have been investigated with data from the RAVE (Siebert et al. 2011), SEGUE (Schlesinger et al. 2012) and APOGEE (Anders et al. 2014; Hayden et al. 2015) surveys. The results show that the profile of the [Fe/H] distribution varies with both R and Z. Hayden et al. (2015) demonstrated that the low-[α/Fe] populations close to the Galactic plane have negatively skewed [Fe/H] distributions in the inner disc and positively skewed distributions in the outer disc, a result that they interpreted as a consequence of stellar radial migration, in particular that induced by the churning process. Their results also show that high-[α/Fe] populations exhibit a similar profile at all positions. The different behaviour of the MDF between the low-[α/Fe] and high-[α/Fe] populations suggests that the profile of the [Fe/H] distribution must vary with population, because [α/Fe] is a rough indicator of stellar age. [α/Fe] can, however, only be used to differentiate stars into two populations: a young and an old population, which is insufficient to study in detail how the strength of radial migration varies with time throughout the whole assemblage history of the disc. A large sample of stars with robust age estimates is essential in order to clarify this important issue.
Recently, robust ages for a million main-sequence turn-off and subgiant (MSTO-SG) stars, selected from the LAMOST Galactic spectroscopic surveys (Cui et al. 2012; Zhao et al. 2012; Deng et al. 2012; Liu et al. 2014; Yuan et al. 2015), have become available (Xiang et al. 2017a). The sample stars span a wide range of age, cover a large and contiguous volume of the Galactic disc, and have a simple yet non-trivial uniform target selection function. The sample provides an excellent opportunity to characterize the MDF of mono-age stellar populations, and to understand the disc assemblage history in more detail. In this work, we present the MDF of mono-age stellar populations across the disc for 6 ≲ R ≲ 12 kpc and |Z| ≲ 2 kpc. We have derived the distribution function not only of [Fe/H] but also of [α/Fe]. Although there have been some studies focusing on the distributions of [α/H] (Genovali et al. 2015; Hayden et al. 2015) and [α/Fe] (Anders et al. 2014; Boeche et al. 2014), the results are not as comprehensive as for [Fe/H]. In the current work, we investigate the spatial variations of both the gradients and profiles of the [Fe/H] and [α/Fe] distributions for various mono-age stellar populations, and explore the impact of stellar mixing by epicycle motions (blurring) on the distributions. Amongst what we investigated in the current paper, the radial and vertical [α/Fe] gradients and the profiles of [Fe/H] and [α/Fe] distributions of mono-age stellar populations are investigated for the first time.
This paper is organized as follows. In Section 2, we briefly introduce the MSTO-SG sample and the corrections for selection effects. In Section 3, we present the [Fe/H] and [α/Fe] gradients of mono-age stellar populations. We present the metallicity distribution profiles of mono-age stellar populations in Section 4. The effects of the blurring process on the metallicity distributions are discussed in Section 5. The constraints of the MDF derived here on the formation and evolution of the Galactic disc are discussed in Section 6. Finally, we summarize our work in Section 7.
2 DATA
2.1 The LAMOST MSTO-SG star sample
The sample used in the current work consists of 0.93 million MSTO-SG stars with robust age estimates selected from the Pilot Surveys and the first four years of the five-year Phase I Regular Surveys of the LAMOST Galactic spectroscopic surveys (Xiang et al. 2017a). Several studies have been devoted to deriving robust estimates of stellar atmospheric parameters from the LAMOST spectra, such as the LAMOST Stellar Parameter Pipeline (LASP; Luo et al. 2015), the LAMOST Stellar Parameter Pipeline at Peking University (LSP3; Xiang et al. 2015a, 2017b), application of the SEGUE Stellar Parameter Pipeline (SSPP) to LAMOST spectra (Lee et al. 2015), parameter determinations based on the Cannon (Ho et al. 2017), and an analysis based on the SP_Ace code (Boeche et al. 2018). The sample of MSTO-SG stars of Xiang et al. (2017a) was constructed based on LSP3 stellar parameters (effective temperature Teff, surface gravity |$\log \, g$|, metallicity |$\mathrm{ \, [Fe/H]}$|, α-element abundance ratio [α/Fe], radial velocity Vr, absolute magnitudes MV and MKs). Typical uncertainties of the parameters are listed in Table 1 for signal-to-noise ratios (SNRs) higher than 20 and 50. Note that all the MSTO-SG sample stars of Xiang et al. (2017a) have SNRs higher than 20. Stellar distances were inferred from the distance modulus using the absolute magnitudes derived directly from the spectra, and utilizing interstellar extinction derived with the ‘star pair’ method (Yuan, Liu & Xiang 2013; Yuan et al. 2015; Xiang et al. 2017b). The average distance uncertainty of the sample stars is 17 per cent. The ages of the stars were determined by matching with stellar isochrones using a Bayesian algorithm, as detailed in Xiang et al. (2017a). The derived ages were shown to be accurate to better than 30 per cent via a series of internal and external comparisons.
Typical accuracies of atmospheric parameters determined with LSP3 for stars of spectral signal-to-nose ratios > 20 and >50.
| Teff [K] | |$\log \, g$| [dex] | [Fe/H] [dex] | [α/Fe] [dex] | Vr [|$\rm km\, s^{-1}$|] | MV [mag] | MKs [mag] | |
|---|---|---|---|---|---|---|---|
| SNRs > 20 | 150 | 0.2 | 0.15 | 0.1 | 5 | 0.5–0.6 | 0.5–0.6 |
| SNRs > 50 | 100 | 0.1 | 0.1 | 0.05 | 5 | 0.2–0.3 | 0.2–0.3 |
| Teff [K] | |$\log \, g$| [dex] | [Fe/H] [dex] | [α/Fe] [dex] | Vr [|$\rm km\, s^{-1}$|] | MV [mag] | MKs [mag] | |
|---|---|---|---|---|---|---|---|
| SNRs > 20 | 150 | 0.2 | 0.15 | 0.1 | 5 | 0.5–0.6 | 0.5–0.6 |
| SNRs > 50 | 100 | 0.1 | 0.1 | 0.05 | 5 | 0.2–0.3 | 0.2–0.3 |
In this work, we discard MSTO-SG stars of |$T_{\rm eff}\, \gt \, 7500\,$| K and |$M_{\rm V}\, \gt \, 4.5$| mag as they have relatively large uncertainties in their [Fe/H] estimates, and it is these estimates that are used to investigate the [Fe/H] distributions. Here we refer to this sample as ‘MSTO-SG-SNR20’. Moreover, the study of [α/Fe] distributions of mono-age stellar populations requires higher SNRs, because the [α/Fe] measurements are more sensitive to spectral SNRs. For this purpose, we further define a subsample with spectral SNRs > 50. We refer to this sample as ‘MSTO-SG-SNR50’. However, the [α/Fe] estimates from LSP3 for relatively hot (e.g. >6000 K) and thus young stars may suffer large uncertainties owing to the inadequacies of the adopted template spectra as well as to the intrinsic weak spectral features of α-elements. In addition, Xiang et al. (2017a) suggested that about 10–20 per cent of stars younger than 4 Gyr may be blue stragglers whose ages have been incorrectly estimated. It is therefore necessary to be cautious about the derived [α/Fe] gradients and distribution profiles of the young populations in the current work.
Compared with the MSTO star sample used by Xiang et al. (2015b) for the study of the Galactic disc’s metallicity gradients, the current MSTO-SG star sample has been significantly improved compared with their sample. It contains more star, provides the information of [α/Fe], which is not available in Xiang et al. (2015b). More importantly, systematic errors in age estimates in our sample are reduced owing to improvements in stellar parameter determinations. As a consequence, potential sources of contamination are also better understood and well controlled. Xiang et al. (2015b) selected the MSTO in the Teff–|$\log \, g$| plane (see fig. 1 of Xiang et al. 2015b), using parameters derived with the LSP3 version for the LSS-GAC DR1. However, the |$\log \, g$| estimates then suffer from significant (systematic) uncertainties (Ren et al. 2016). Xiang et al. (2017a) selected the MSTO-SG stars in the Teff–MV plane (see their fig. 5). Values of MV were derived directly from the LAMOST spectra with a machine-learning method using a kernel-based component analysis utilizing the LAMOST–Hipparcos common stars as a training data set. In this case, the systematic errors are found to be negligible (Xiang et al. 2017a,b). Nevertheless, we note that, despite all these improvements, the current MSTO-SG sample stars may still suffer from contaminations from dwarf, giant, supergiant and binary stars owing to random errors in the stellar parameters. The contaminations could be severe and non-negligible for the old stellar populations.
2.2 Selection-effect correction
Nandakumar et al. (2017) and Chen et al. (2018) suggested that the LAMOST selection function has only a marginal effect on the peak of the metallicity distribution. Nevertheless, both Nandakumar et al. (2017) (see their fig. 10) and Chen et al. (2018) (see their fig. 11) do find that the dispersion and skewness of the MDF are affected by the selection effects of LAMOST. The possible impact of the selection effects of LAMOST on the MDF of mono-age stellar populations remains to be investigated. To clarify the situation, we have considered and corrected for the selection function of our sample stars.
Generally, there are two selection effects acting on the sample considered here. The first is the selection effects of the LAMOST Galactic spectroscopic surveys with respect to the photometric catalogues from which the spectroscopic targets are selected. The latter is usually assumed to be complete (to a certain limiting magnitude) and represents the underlying stellar populations. The second is the incompleteness of MSTO-SG stars in a given volume caused by the limiting magnitude of the surveys and the wide range of absolute magnitudes of MSTO-SG stars. This effect varies with stellar populations of different ages, as they have a different intrinsic width of absolute magnitude range according to their definition (Xiang et al. 2017a). The first part is corrected using the selection function S derived by Chen et al. (2018). The function S also contains two parts, according to the source of origin. The first part, quantified by S1, characterizes the LAMOST target selection strategy. The second part, quantified by S2, characterizes the selection effects arising from the observational quality, data reduction and parameter determination. Each star in our sample is weighted by |${1}/{S}$| in the colour–magnitude diagram (CMD). In order to account for the volume incompleteness of the mono-age populations of MSTO-SG stars, we define the completeness volumes of our sample stars using the same method as Xiang et al. (2018) and Chen et al. (2017). The complete volume of a sample of stars depends on the absolute magnitude, the limiting magnitude of the LAMOST Galactic spectroscopic surveys and the dust extinction. Considering that the absolute magnitudes of the MSTO-SG stars vary significantly with age, we defined a complete volume for each of the mono-age stellar populations of age range 0.0 < τ < 2.0, 2.0 < τ < 4.0, 4.0 < τ < 6.0, 6.0 < τ < 8.0, 8.0 < τ < 11.0, 11.0 < τ < 14.0 and 0 < τ < 14.0 Gyr. Sample stars falling outside the defined complete volume were discarded. The final completed samples of MSTO-SG-SNR20 and MSTO-SG-SNR50 contain 453 188 and 291 126 stars, respectively.
Fig. 1 shows the distributions of [Fe/H], [α/Fe] and number density of the final (complete) MSTO-SG-SNR20 and MSTO-SG-SNR50 samples in the R–Z plane. Here, R and Z are the axes of the Galactocentric cylindrical coordinate system (R, Φ, Z). The Sun is assumed to be at the Galactic disc mid-plane (i.e. Z = 0 pc) and has an R value of 8 kpc. Fig. 2 shows the normalized age distributions of the final MSTO-SG-SNR20 and MSTO-SG-SNR50 samples. The figure shows that, for both samples, the stars have a broad distribution in stellar age, from <1 to >13 Gyr, and peak at 3–4 Gyr.
![The figure show the [Fe/H] distribution of the MSTO-SG-SNR20 sample (left panel) and the [α/Fe] (right panel) distribution of the MSTO-SG-SNR50 sample (right panel), binned by 0.2 × 0.2 kpc in the R–Z plane. The over-plotted contours show the corresponding density (star number count in each R–Z bin) distributions on a logarithmic scale.](https://oup.silverchair-cdn.com/oup/backfile/Content_public/Journal/mnras/482/2/10.1093_mnras_sty2797/1/m_sty2797fig1.jpeg?Expires=1749926667&Signature=gpXX9HAbB8jzdKS4~O-r3Km3vu4QDVEgCNGMkd6yfQRXD~cQbUAsvtRC9GU0YYBaD6dVfyBZTThrmL8cUvazLKoE9L1TTP1M04r2D25Lg2Rf637rRH46--g6QAWsKhhBRC4yq5XM9AdBZGhIs37F~4ikIBEU7zWfEF~TuzzdKwTKxiHYAm4N-KH4KIFC8iv4tXfvsBM0dA495WQ9J8Jp5T9~cwogzxiToZoxbsNjksBJyJglqZzaXc9HF37ql-pZ69DIQiym7Keks0kS7R1SUaXipPJEeiyoScrOtg8p9TwK6kTbaiDrfVOm3kPwvS9kdxnJxeO64nE9VKohXBd2HA__&Key-Pair-Id=APKAIE5G5CRDK6RD3PGA)
The figure show the [Fe/H] distribution of the MSTO-SG-SNR20 sample (left panel) and the [α/Fe] (right panel) distribution of the MSTO-SG-SNR50 sample (right panel), binned by 0.2 × 0.2 kpc in the R–Z plane. The over-plotted contours show the corresponding density (star number count in each R–Z bin) distributions on a logarithmic scale.
Normalized age distributions of the MSTO-SG-SNR20 (black line) and MSTO-SG-SNR50 (red line) samples. The total numbers of stars in the two samples are given in the figure.
3 Radial and vertical gradients of [|${\rm Fe}$|/H] and [α/|${\rm Fe}$|]
In this section, we investigate the radial and vertical gradients of [Fe/H] with the MSTO-SG-SNR20 sample and the radial and vertical gradients of [α/Fe] with the MSTO-SG-SNR50 sample, using a method similar to Xiang et al. (2015b) in order to facilitate a comparison with their results.
3.1 The radial [Fe/H] gradients
First, we determined the radial [Fe/H] gradients of mono-age stellar populations in several thin slices of |Z|. To do this, we divided the stars in the MSTO-SG-SNR20 sample into mono-age populations in six age bins: τ < 2.0, 2.0 < τ < 4.0, 4.0 < τ < 6.0, 6.0 < τ < 8.0, 8.0 < τ < 11.0, 11.0 < τ < 14.0 Gyr. The division of age bins is the same as in Xiang et al. (2015b), which allows a direct comparison with their results. We then divided each of the mono-age populations into bins of constant thickness Δ|Z| = 0.3 kpc and 0.5 kpc for stars of |Z| < 1.5 kpc and |Z| > 1.5 kpc, respectively. In each age and height bin, we further divided the stars into small radial annuli of 0.25 kpc. Bins containing fewer than 30 stars were discarded. A straight line was then adopted to fit the CMD-weighted mean values of [Fe/H] in the individual radial annuli, as a function of R. The slope of the line was adopted as the radial [Fe/H] gradient. Fig. 3 plots the results for two |Z| slices of several individual mono-age stellar populations: |Z| < 0.3 kpc and 1.5 < |Z| < 2.0 kpc. The figure shows that the CMD-weighted mean values of [Fe/H] as a function of R can be well fitted by a straight line. The dip in the number of stars at |$R\, \sim \, 8$| kpc and |$|Z|\, \lt \, 0.3$| kpc in the figure is a consequence of the bright limiting magnitude (∼ 9 mag in the r-band) of the survey.
![Radial [Fe/H] gradients derived from several mono-age stellar populations (as marked in each panel) in two height slices: |Z| < 0.3 kpc (left panels), 1.5 < |Z| < 2.0 kpc (right panels). Red squares represent the colour–magnitude diagram-weighted mean values of [Fe/H] of the individual radial bins. The error bars of the mean values are also plotted, but in almost all cases they are smaller than the size of the symbols. Linear fits to the red squares are over-plotted by red lines. The blue horizontal dashed lines delineate a constant [Fe/H] value of −0.5 dex. The age span of each population, the slope of the linear fit (the radial [Fe/H] gradient) and the associated error are marked in each panel. The mean value of [Fe/H] as a function of R in each panel can be well fitted by a linear line.](https://oup.silverchair-cdn.com/oup/backfile/Content_public/Journal/mnras/482/2/10.1093_mnras_sty2797/1/m_sty2797fig3.jpeg?Expires=1749926667&Signature=TqsPXsp9rBEZgSxfrI7QZNSv0Z9mim0s-aAMybBdqc2uCl49P~imOTdq6xlCJbRpFikFybjaPqlMcEQ6Xs3rVylzQtLpsSouftbQ1M0u2onbBQTuhF2YW5nonPCi4OI5ZgElAZpDC~di3uylbKk-2pRUjOJj~mhw1OWzU81X6nOEZDT3q94m10I6GVbAyOsDMlW9tabVo8VoY0JnYjEtrwehkIrb6d21xYDmA8izZUcXoqWT7S8DLu1zXBfXueOOruRsZnEe6jxaBF47edQHIASfvfVkvpaqt1YbAJ~oFhehH9hltMAvzbbSA2g6MDnCf2GR7QnLoT8mXJSPZBwWKA__&Key-Pair-Id=APKAIE5G5CRDK6RD3PGA)
Radial [Fe/H] gradients derived from several mono-age stellar populations (as marked in each panel) in two height slices: |Z| < 0.3 kpc (left panels), 1.5 < |Z| < 2.0 kpc (right panels). Red squares represent the colour–magnitude diagram-weighted mean values of [Fe/H] of the individual radial bins. The error bars of the mean values are also plotted, but in almost all cases they are smaller than the size of the symbols. Linear fits to the red squares are over-plotted by red lines. The blue horizontal dashed lines delineate a constant [Fe/H] value of −0.5 dex. The age span of each population, the slope of the linear fit (the radial [Fe/H] gradient) and the associated error are marked in each panel. The mean value of [Fe/H] as a function of R in each panel can be well fitted by a linear line.
Fig. 4 shows the derived radial [Fe/H] gradients as a function of |Z| for mono-age stellar populations. It shows that there are negative radial [Fe/H] gradients for stellar populations of τ < 11 Gyr at |Z| < 1.5 kpc. The negative radial metallicity gradients flatten with increasing |Z|. The gradients of stellar populations of τ > 11 Gyr have marginally positive values, except for the results for |Z| < 0.3 kpc (∼−0.03 ± 0.04 dex |$\rm kpc^{-1}$|), and vary little with |Z|.
![Radial [Fe/H] gradients as a function of |Z| derived from mono-age populations, presented with different colours, as marked on the plot. The horizontal dashed lines delineate a constant radial [Fe/H] gradient value of 0.0 dex $\rm kpc^{-1}$. The mean radial [Fe/H] gradients for the young (left panel) and the old (right panel) stellar populations are negative and positive, respectively.](https://oup.silverchair-cdn.com/oup/backfile/Content_public/Journal/mnras/482/2/10.1093_mnras_sty2797/1/m_sty2797fig4.jpeg?Expires=1749926667&Signature=oWUZNIBWNbB48C5vwxoumwgGu-FArEuCsarIwWdtdYCMhEJESVQs328wFmlEYLP1ZyZnpuUqTTEQlzngcrbmZBM~VLhxtHmZ2FE7VsLoxbAnECyazQbZN4kkWorPiuAc~SOR5Kq9UMvQu6SiZ4jCVhjZXoj70QCrJ72OKjETFkNvAEzG5bRN3B1K4krh0TU~h2youXv-Ec06nrF~jxFOvqPiDfUbCEXZJbnk4P12BIFsPbrhq37JNRE9i5ruk6qKiJNUA3V1F705hL4loyZlmVMB62enVtydstJAK57ALj8Uh~GmuN30vTz~7LmRgoG1YY7Q9KU0fdg23en5M5yzcQ__&Key-Pair-Id=APKAIE5G5CRDK6RD3PGA)
Radial [Fe/H] gradients as a function of |Z| derived from mono-age populations, presented with different colours, as marked on the plot. The horizontal dashed lines delineate a constant radial [Fe/H] gradient value of 0.0 dex |$\rm kpc^{-1}$|. The mean radial [Fe/H] gradients for the young (left panel) and the old (right panel) stellar populations are negative and positive, respectively.
The values of radial [Fe/H] gradients presented in this paper are slightly larger than those in Xiang et al. (2015b), by 0.0–0.05 dex |$\rm kpc^{-1}$|. The differences are larger in low-|Z| bins. As discussed in Section 2.1, compared with Xiang et al. (2015b), the ages, distances and atmospheric parameters of the stars in the current sample have been improved. The current work also adopts different criteria for selecting MSTO-SG stars (or simply MSTO) compared with Xiang et al. (2015b). We re-estimated the radial [Fe/H] gradients using the common stars of the current sample and the sample used by Xiang et al. (2015b) to check whether it is the differences in the parameters that are the main cause of the difference in the [Fe/H] gradient. The exercise yielded very similar results, suggesting that the differences in the derived parameters are not the main cause of the differences between the results for radial [Fe/H] gradients derived in the current work and those presented in Xiang et al. (2015b). A further inspection of the MSTO sample of Xiang et al. (2015b) using the updated set of stellar parameters suggested that a considerable fraction of the sample stars are actually main-sequence star contaminations resulting from systematic errors in the (old version) LSP3 log g estimates, which were used by Xiang et al. (2015b) to select the MSTO sample stars. The contamination rate is a function of Teff in the sense that the cooler the stars, the higher the fraction of the contaminations. Because of the magnitude limits of the LAMOST surveys, the cooler and more metal-rich stars could be observed by LAMOST closer to the Sun, as they are intrinsically fainter. Furthermore, most of the Galactic radii of the MSTO stars in Xiang et al. (2015b) are larger than 7.5 kpc (see their fig. 13), and the radial gradients are derived with stars of R > 7.5 kpc (see their fig. 14). Thus, we can surmise that there are more contaminations (by more metal-rich stars) in the inner disc than in the outer disc, which in turn produces the steeper radial [Fe/H] gradients in Xiang et al. (2015b). In addition, the contaminations of metal-rich stars are more severe at lower heights, which causes more overestimation (i.e. steeper gradients) of radial [Fe/H] gradients in the lower disc. In conclusion, the differences of radial [Fe/H] gradients between this work and Xiang et al. (2015b) are probably caused by an overestimation of the results derived by Xiang et al. (2015b) as a result of non-negligible main-sequence star contaminations in their MSTO sample.
The vertical variations of radial [Fe/H] gradients are quite similar to what was found by Xiang et al. (2015b), as shown in their fig. 15. Minchev, Chiappini & Martig (2014) found that the negative radial metallicity gradients strongly flatten with increasing |Z| in their chemodynamical models (see their fig. 10). This is consistent with our results for stellar populations of τ < 11 Gyr.
Fig. 5 shows the derived radial [Fe/H] gradients as a function of age for stars in various |Z| bins. The figure shows that for stellar populations the gradients steepen with increasing age for τ < 4 Gyr reach a maximum at 4 < τ < 6 Gyr, and then flatten with age.
![Radial [Fe/H] gradients as a function of τ derived from stars in various |Z| slices, presented with different colours, as marked in the plot. The horizontal dashed line delineates a constant radial [Fe/H] gradient of 0.0 dex $\rm kpc^{-1}$. The vertical dashed lines delineate constant ages of 4 and 6 Gyr. There are dips in the radial [Fe/H] gradients at 4$\, \lt \, \tau \, \lt \,$6 Gyr.](https://oup.silverchair-cdn.com/oup/backfile/Content_public/Journal/mnras/482/2/10.1093_mnras_sty2797/1/m_sty2797fig5.jpeg?Expires=1749926667&Signature=kOYI0HTrUV4wxRfLJ-cTNkk7kRYSAxCObHLqHWfQ8QUHcTx9H9gQiozRD5u6VF16e90-bjOYgl17ZLp8-L3kT8SaCnEentPBW1sIFxm83rntxs5anXqkTaHO1lC1IGXfYfgj3fU8HjkE2TRB9wGhZDtE9P7aPLaZHRXRsNksfNXBVjwsenRn0gYRDNOU4~-ZVy3SW4n7ivW5-hw47EzUOi-FAyqjCdEbeq1upec0qY5GzwwS~1QLPzpV4OCD06uZW9yXs8vL0iQ6YPy6cEOMBaynIVnhGCX2Ibgzwb2mG-DCGfLMBeRjDTy5eCpeCBNUL~-ovD101u3QDOUSC4MYvg__&Key-Pair-Id=APKAIE5G5CRDK6RD3PGA)
Radial [Fe/H] gradients as a function of τ derived from stars in various |Z| slices, presented with different colours, as marked in the plot. The horizontal dashed line delineates a constant radial [Fe/H] gradient of 0.0 dex |$\rm kpc^{-1}$|. The vertical dashed lines delineate constant ages of 4 and 6 Gyr. There are dips in the radial [Fe/H] gradients at 4|$\, \lt \, \tau \, \lt \,$|6 Gyr.
The existence of reversions of radial [Fe/H] gradients as a function of age was also found by Xiang et al. (2015b) (see their fig. 16). However, they found that the reversion occurs at 6 < τ < 8 Gyr. As we know, the stellar ages used by Xiang et al. (2015b) are systematically older than those deduced by Xiang et al. (2017a) for stars of τ > 6 Gyr. This accounts for the difference in the reversion epoch. Interestingly, the epoch of reversion derived here is closer to that obtained by Casagrande et al. (2011) (∼ 4 Gyr) for the solar-neighbourhood disc (Z < 100 pc) using GCS FG(K) dwarf stars, as shown in their fig. 18. The results are not consistent with those obtained by the models of Toyouchi & Chiba (2018), who found that the radial [Fe/H] gradients monotonically increase as age increases. The disagreement may be the result of their too simple and perhaps unrealistic assumptions for gas infall, gas outflow, gas re-accretion and the stellar radial migration processes, or of the lack of some important ingredients in the understanding of the formation of the MW (Toyouchi & Chiba 2018).
3.2 The vertical [Fe/H] gradients
In order to derive the vertical [Fe/H] gradients, we divided the stars in the MSTO-SG-SNR20 sample into radial annuli of 1 kpc with a step of 0.5 kpc in the radial direction for the mono-age stellar populations. In each annulus, we further divided the stars into bins of constant height of Δ|Z| = 0.2 kpc with a step of 0.1 kpc. Bins containing fewer than 30 stars were discarded. The CMD-weighted mean values of [Fe/H] in the individual |Z| slices as a function of |Z| were fitted by straight lines to derive the vertical [Fe/H] gradients. Fig. 6 plots the results for two radial bins of several mono-age stellar populations: 7 < R < 8 kpc and 9 < R < 10 kpc. The figure shows that the CMD-weighted mean values of [Fe/H] as a function of |Z| can be well fitted by a straight line. Fig. 6 shows that old stars reach much further above the disc than young stars. Few stars are sampled at |$7\, \lt \, R\, \lt \, 8$| kpc and |$|Z|\, \sim \,$|0 kpc because of the bright limiting magnitude of the surveys.
![Vertical [Fe/H] gradients derived for several individual mono-age stellar populations (as marked in each panel) in two radial bins: 7 < R < 8 kpc (left panels) and 9 < R < 10 kpc (right panels). Red squares represent the CMD-weighted mean values of [Fe/H] in the individual vertical bins. The error bars of the mean values are over-plotted, but in almost all cases they are smaller than the size of the symbols. Linear fits to red squares are over-plotted by red lines. The blue horizontal dashed lines delineate a constant [Fe/H] value of −0.5 dex. The age range of each mono-age stellar population, the slope of the linear fit (vertical [Fe/H] gradients) and the associated error are marked in each panel. The mean value of [Fe/H] as a function of |Z| in each panel can be well fitted by a straight line.](https://oup.silverchair-cdn.com/oup/backfile/Content_public/Journal/mnras/482/2/10.1093_mnras_sty2797/1/m_sty2797fig6.jpeg?Expires=1749926667&Signature=qMHpyk9V-HpLT3JNEHm4aelx7ew0wpaUQAGrHaDahYYL4PLzyAmRlWj4d79S~lL0qG5OvY-mW3tTzDewHjhunn8i8R8YeFIcNC2w1aP4kIhQK9pz3BHGElLHhz0hRG7KDllYYonzeWrMKC8MDbAGg54YdOUI3ZfnfPBgP~3X5rTZrXQTpccDCEQkBPJvMJgJ8-40Osr3UzWvQQg2cdDDtxCUL20CVpVsMfTrG1pZwXGnX8IYNEsPGQWfcE-JfXIJX2XwQS6ut5SFbk-R0ErKu8Ja~ND4Y24GENk7itbEpsHoiDk4iTpFChJqqDeLJNG3gZlsflaqCkiW3omp1px3jg__&Key-Pair-Id=APKAIE5G5CRDK6RD3PGA)
Vertical [Fe/H] gradients derived for several individual mono-age stellar populations (as marked in each panel) in two radial bins: 7 < R < 8 kpc (left panels) and 9 < R < 10 kpc (right panels). Red squares represent the CMD-weighted mean values of [Fe/H] in the individual vertical bins. The error bars of the mean values are over-plotted, but in almost all cases they are smaller than the size of the symbols. Linear fits to red squares are over-plotted by red lines. The blue horizontal dashed lines delineate a constant [Fe/H] value of −0.5 dex. The age range of each mono-age stellar population, the slope of the linear fit (vertical [Fe/H] gradients) and the associated error are marked in each panel. The mean value of [Fe/H] as a function of |Z| in each panel can be well fitted by a straight line.
Fig. 7 shows the derived vertical [Fe/H] gradients as a function of R for the mono-age stellar populations. It shows that almost all of the mono-age stellar populations have negative vertical [Fe/H] gradients. The vertical [Fe/H] gradients flatten with increasing R for all the mono-age stellar populations at R > 8 kpc. The vertical [Fe/H] gradients vary significantly with age.
![Vertical [Fe/H] gradients as a function of R derived from mono-age stellar populations, presented with different colours, as marked in the plot. The horizontal dashed line delineates a constant vertical [Fe/H] gradient of 0.0 dex $\rm kpc^{-1}$. Stars in all R and τ bins have negative vertical [Fe/H] gradients.](https://oup.silverchair-cdn.com/oup/backfile/Content_public/Journal/mnras/482/2/10.1093_mnras_sty2797/1/m_sty2797fig7.jpeg?Expires=1749926667&Signature=lw0AMFTaRe-Gdr7cNs-OZbcibh7ZQk~mZJQtuX3QXCTN3jO1X~sEiBpuwAxBdJS4MM4AK0Urk31P7pXEKBWcZkr29AYumzdb75nSTZ0eXEfXEkxcYgkFt01ccChNIolX2ZRpivnHErfB2RrJra4NNUCblAYdMIUr3uuTPv7dNjV2Q11Yxp93duRTLYVCDnhjVVJluT75spn6cdShIpqXIt7BkLw3-Gb2A1aESdj4uGlPEViuZ3FC50DHWuqpPJpXSlUiElZJ5UVB1-1ow0uuRsjR5oGtmB8KyFhX8wTdTKFoTGO08LrePAD4pPN0nkXw4Lke~DlUFVTHnuPI3P3wqw__&Key-Pair-Id=APKAIE5G5CRDK6RD3PGA)
Vertical [Fe/H] gradients as a function of R derived from mono-age stellar populations, presented with different colours, as marked in the plot. The horizontal dashed line delineates a constant vertical [Fe/H] gradient of 0.0 dex |$\rm kpc^{-1}$|. Stars in all R and τ bins have negative vertical [Fe/H] gradients.
Compared with Xiang et al. (2015b), we have extended the measurement of vertical [Fe/H] gradients toward the inner disc, to |$R\, \lt \, 7$| kpc. We found that the vertical [Fe/H] gradients in the inner disc are much flatter than in the solar neighbourhood. The vertical [Fe/H] gradients derived in the current work are consistent with those obtained by Xiang et al. (2015b) for populations younger than 11 Gyr. The derived vertical [Fe/H] gradients for the oldest populations (τ > 11 Gyr) are comparable to those for 8 < τ < 11 Gyr in the current work, whereas Xiang et al. (2015b) found that the gradients for their oldest populations were much shallower than those for populations of 8 < τ < 11 Gyr. We believe that this is because Xiang et al. (2015b) discard stars cooler than 5400 K. Such a temperature cut may have rejected some old metal-rich stars, which are mostly found at low values of |Z|, leading to shallower vertical [Fe/H] gradients for the populations of τ > 11 Gyr. Of course, it is also possible that those old metal-rich MSTO-SG stars in the current sample may be contaminations from younger dwarf stars. Further study is needed to gain a deeper understanding of the results. The cause of the differences in the vertical [Fe/H] gradients of the oldest stellar populations (τ > 11 Gyr) needs to be further explored.
In the current work, we do not find a monotonic increase of vertical [Fe/H] gradient with age, in contrast to Xiang et al. (2015b, fig. 17), who found that (with the exception of the oldest stars of |$\tau \, \gt \,$|11 Gyr) the younger the stars, the flatter the vertical [Fe/H] gradients. Ciucǎ et al. (2018, fig. 6) also found a clear trend of vertical [Fe/H] gradient with age using common dwarf stars selected from Gaia and RAVE, quite similar to what was found by Xiang et al. (2015b). We note that the observational selection bias of the samples of Ciucǎ et al. (2018) and Xiang et al. (2015b) are not removed completely. Ciucǎ et al. (2018) only minimized the observational selection bias induced by the various selection criteria by selecting a sample in a specific colour and magnitude range. Xiang et al. (2015b) did not consider the effects of the incomplete volume of mono-age stellar populations on the derived vertical [Fe/H] gradients. The selection bias may be responsible for the difference of the trend between our results and those of Ciucǎ et al. (2018) and Xiang et al. (2015b).
3.3 The radial [α/Fe] gradients
We determined the radial [α/Fe] gradients in thin |Z| slices. In order to do this, we divided the stars in the MSTO-SG-SNR50 sample into |Z| and age bins, as described in Section 3.1. In each bin, stars were further divided into small radial bins of size 0.25 kpc. Bins containing fewer than 30 stars were again discarded. The CMD-weighted mean values of [α/Fe] in the individual radial bins as a function of R were fitted by a straight line to derive the radial [α/Fe] gradient. As an example, Fig. 8 presents the results for several mono-age populations in two |Z| slices: |Z| < 0.3 kpc and 1.5 < |Z| < 2.0 kpc. The figure shows that straight lines fit the trends well for almost all the mono-age stellar populations in almost all the |Z| bins. An exception is for young stellar populations (τ < 4 Gyr), and this may be a consequence of poor [α/Fe] estimates for those stars (Xiang et al. 2017a). The fits are also not very good for the population of all ages (0 < τ < 14 Gyr), and this may be the consequence of the domination of young disc stars with incorrect [α/Fe] values at low values of |Z| in the inner disc.
![Radial [α/Fe] gradients derived from several mono-age stellar populations (as marked in each panel) in two height slices: |Z| < 0.3 kpc (left panels) and 1.5 < |Z| < 2.0 kpc (right panels). Red squares represent the CMD-weighted mean values of [α/Fe] of the individual radial bins. The error bars of the mean values are also plotted, but in almost all cases they are smaller than the size of the symbols. Linear fits to the red squares are over-plotted by red lines. The blue horizontal dashed lines delineate a constant [α/Fe] value of 0.0 dex. The age span of each population, the slope of the linear fit (the radial [α/Fe] gradient) and the associated error are marked in each panel. In some |Z| and τ bins, [α/Fe] as a function of R cannot be well fitted by a linear line.](https://oup.silverchair-cdn.com/oup/backfile/Content_public/Journal/mnras/482/2/10.1093_mnras_sty2797/1/m_sty2797fig8.jpeg?Expires=1749926667&Signature=LjErWkeT9BY7ojpLWWn2gy0T~WLw6489YO3jKKrfOgzp5gc-QPCZNQpimB0POWVnS2TYsm-9frzj~9CXXx1w8Z82qvbLUA7LLU~dZs48cvDA5rvfB2obSr3LLwHaEDLFFNQb4NgKUsl5rHPRUl4uWEF98HXCp0QozP5M61b67v42gmsx45~fobJAliViUFLpo4xdcxr3SkghBKTKJQZ8tALNabbd~5OZglil8Vdk5j7Wi3teiqGx5A5nn8ZAdOhJ9NocYnLaoDaZRnSuB6mAC-IEdfjPhyGDVY9X3-iLSI5xKIauUj6M1uXWKXfJO0PmejMwAuh44mwzFQHGJp-dGQ__&Key-Pair-Id=APKAIE5G5CRDK6RD3PGA)
Radial [α/Fe] gradients derived from several mono-age stellar populations (as marked in each panel) in two height slices: |Z| < 0.3 kpc (left panels) and 1.5 < |Z| < 2.0 kpc (right panels). Red squares represent the CMD-weighted mean values of [α/Fe] of the individual radial bins. The error bars of the mean values are also plotted, but in almost all cases they are smaller than the size of the symbols. Linear fits to the red squares are over-plotted by red lines. The blue horizontal dashed lines delineate a constant [α/Fe] value of 0.0 dex. The age span of each population, the slope of the linear fit (the radial [α/Fe] gradient) and the associated error are marked in each panel. In some |Z| and τ bins, [α/Fe] as a function of R cannot be well fitted by a linear line.
Fig. 9 shows the derived radial [α/Fe] gradients for the mono-age stellar populations as a function of |Z|. The current work is the first time that the radial [α/Fe] gradients of mono-age stellar populations have been investigated. We found that the radial [α/Fe] gradients and its variations with |Z| vary significantly with age. Fig. 9 shows that the radial [α/Fe] gradients of population of all ages are nearly flat at low values of |Z|, and negative at high values. The radial [α/Fe] gradients of populations of τ < 4 Gyr have positive values at low values of |Z|, and negative gradients at high values, and become smaller as |Z| increases. Stars of ages 4 < τ < 6 Gyr have nearly flat radial [α/Fe] gradients. Stars older than τ > 6 Gyr have negative radial [α/Fe] gradients. The radial [α/Fe] gradients of old stellar populations (τ > 8 Gyr) flatten as |Z| increases.
![Radial [α/Fe] gradients as a function of |Z| derived from mono-age populations, presented with different colours, as marked in the plot. The mean radial [α/Fe] gradients of all ages of stellar populations, young, median-age and old stellar populations are negative, positive, near-zero and negative, respectively. The horizontal dashed lines delineate a constant radial [α/Fe] gradient value of 0.0 dex $\rm kpc^{-1}$. The results of young stellar populations should be taken with caution, as about 10–20 per cent of the [α/Fe] measurements of those stars might be incorrect.](https://oup.silverchair-cdn.com/oup/backfile/Content_public/Journal/mnras/482/2/10.1093_mnras_sty2797/1/m_sty2797fig9.jpeg?Expires=1749926667&Signature=Vh7qUc4Z3EbFYGAxEcRAIk9dB1AwUNulSrdkFQxjYDMAIZhBW40F3SHa~QVYafTixFYbuXgyhtL9cBox-xoOtB-Y-2EVJQ6dDZXudDB6AHBBkzo4rLuhseO9wtu5MIRghy6bjXclxrHlDCVJAASvKtujF90paeAs38OoQ04acYfO4qRq~VYui1oriSvMmEi3LGvfzc2bC5z3dr5NoTRZLqpfOsG9br2G8LwonOx5yJWGCS~cDBgnj4gO~5iVKEs8Hq4INGOvlW4C7fQ2xmGFbLB4rCNtMubo~R83HfCVdnmKr70gIXOTPI1K-YAXFswY2~ut~Mp~JhLjhQROB1BrJw__&Key-Pair-Id=APKAIE5G5CRDK6RD3PGA)
Radial [α/Fe] gradients as a function of |Z| derived from mono-age populations, presented with different colours, as marked in the plot. The mean radial [α/Fe] gradients of all ages of stellar populations, young, median-age and old stellar populations are negative, positive, near-zero and negative, respectively. The horizontal dashed lines delineate a constant radial [α/Fe] gradient value of 0.0 dex |$\rm kpc^{-1}$|. The results of young stellar populations should be taken with caution, as about 10–20 per cent of the [α/Fe] measurements of those stars might be incorrect.
Several previous works have studied the radial [α/Fe] gradients of the population of all ages. Anders et al. (2014) showed that there are almost flat radial [α/Fe] gradients at Zmax < 0.4 kpc, but clear negative [α/Fe] gradients at 1.5 < Zmax < 3.0 kpc, as derived from an analysis of APOGEE red giant stars and shown in their fig. 16. Minchev et al. (2014) also found that the weak positive [Mg/Fe] gradient for the all-age stellar population becomes negative as |Z| increases (see their fig. 10). Boeche et al. (2014) found that the radial [Mg/Fe], [Al/Fe] and [Si/Fe] gradients are positive at low values of |Z| and negative at high values, using giant stars selected from RAVE (see their table 2). Our current results for the stellar population of all ages are consistent with those of Anders et al. (2014) and Minchev et al. (2014), but are slightly different from those of Boeche et al. (2014).
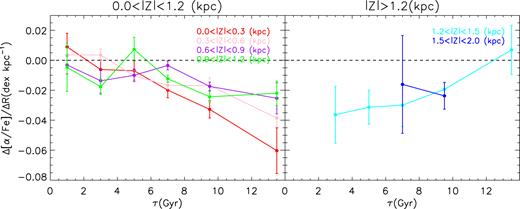
Fig. 10 shows the derived radial [α/Fe] gradients as a function of age for stars at different values of |Z|. It shows that the derived negative radial [α/Fe] gradients steepen with increasing age at low values of |Z|, but flatten or become nearly invariant with increasing age at high values. Minchev et al. (2014) found that there is a nearly flat [Mg/Fe] gradient for old stellar populations, but a positive radial [Mg/Fe] gradient for young stellar populations (see their fig. 10) in their chemodynamical models, some different from what is found here. Our results may strongly constrain existing chemodynamical models.
![Radial [α/Fe] gradients as a function of τ derived for stars in various |Z| slices, presented with different colours, as marked in the plot. The horizontal dashed lines delineate a constant radial [α/Fe] gradient value of 0.0 dex $\rm kpc^{-1}$. Radial [α/Fe] gradients steepen with increasing age in low-|Z| bins (left panel), but flatten or become nearly invariant with increasing age in high-|Z| bins (right panel).](https://oup.silverchair-cdn.com/oup/backfile/Content_public/Journal/mnras/482/2/10.1093_mnras_sty2797/1/m_sty2797fig10.jpeg?Expires=1749926667&Signature=xs2DCzP1158YDaPEuorrf7j8bCfY1sfvMpFeY0Azh-g0Qj~~bdsdmtCDef-w4v4G8bWipvmPppRxAyFK~vatZ6S2m3zyp4Xb9iMloWt-xq-RFfjQW-q0u4gHPcwKCxFvwxlnyxXiBpEu3df3OD1msAe0zAW~diFlHMxlKT4CodclxUKr--0r4yX8eE5M-36Fg-2ZW-gkCuZ9CaAzRYYghkRGznO8wzZl3aJKxi51a~X1DZ~Ks7kwYqfZaTUYKp-yMy8SmbVvjWAz8WKKSP0e87JLBr9w21hq2aFK8T67ljZmftu-dJseBYJM1p05-me~fpAaHZUyVa09JUEfuj2KsQ__&Key-Pair-Id=APKAIE5G5CRDK6RD3PGA)
Radial [α/Fe] gradients as a function of τ derived for stars in various |Z| slices, presented with different colours, as marked in the plot. The horizontal dashed lines delineate a constant radial [α/Fe] gradient value of 0.0 dex |$\rm kpc^{-1}$|. Radial [α/Fe] gradients steepen with increasing age in low-|Z| bins (left panel), but flatten or become nearly invariant with increasing age in high-|Z| bins (right panel).
3.4 The vertical [α/Fe] gradients
We now determine the vertical [α/Fe] gradients. In order to do this, we divided the stars in the MSTO-SG-SNR50 sample into annuli of 1.0 kpc with a step of 0.5 kpc in the radial direction for the mono-age stellar populations. In each annulus, we further divided the stars into bins of a constant thickness of Δ|Z| = 0.2 kpc with a step of 0.1 kpc. Bins containing fewer than 30 stars were discarded. For each annulus, the CMD-weighted mean values of [α/Fe] were estimated for all height slices. The results as a function of |Z| were fitted by a straight line. The slope of the straight line was adopted as the vertical gradient of the mono-age stellar population at that radial annulus. Fig. 11 shows the results for two radial bins: 7 < R < 8 kpc and 9 < R < 10 kpc. It shows that the CMD-weighted mean values of [α/Fe] as a function of |Z| are well fitted by a linear line.
![Vertical [α/Fe] gradients derived from several individual mono-age stellar populations (as marked in each panel) in two radial bins: 7 < R < 8 kpc (left panels) and 9 < R < 10 kpc (right panels). Red squares represent the CMD-weighted mean values of [α/Fe] in the individual vertical bins. The error bars of the mean values are over-plotted, but in almost all cases they are smaller than the size of the symbols. Linear fits to red squares are over-plotted by red lines. The blue horizontal dashed lines delineate a constant [α/Fe] value of 0.0 dex. The age range of each mono-age stellar population, the slope of the linear fit (vertical [α/Fe] gradients) and the associated error are marked in each panel. The mean value of [α/Fe] as a function of |Z| in each panel can be well fitted by a linear line.](https://oup.silverchair-cdn.com/oup/backfile/Content_public/Journal/mnras/482/2/10.1093_mnras_sty2797/1/m_sty2797fig11.jpeg?Expires=1749926667&Signature=qQMfH9RmKJtRnXtVC4ojGDeVT7KsmLaIrv14SSydxfpDa2czRCY7clyLy738hsM2536ZAqRD3Bx5tCGfhrXs9dMJ0sxF30K~rmI-FwuTiQzKwEEsrvPc39lICYP4OZWP5HQ4dYn0S8NAm9khl-e7uWrpOdk9G2vkoh~EQhBg0brJRNP0dG-t~90X7XHp2vC5-66Mrthbh22MwQINGU8etyDlXL1ncxiI2YiFmE4BtTZhWJ-Nsh9cTn4pI~fatR9MGHlvvW8ro-WTfyUiL1eFUEufUriD3wSUjQU9MCGrnY4vqp9Akt5PUrnGZzljSdqayWWpgMcJZejiAnRBx8dmhg__&Key-Pair-Id=APKAIE5G5CRDK6RD3PGA)
Vertical [α/Fe] gradients derived from several individual mono-age stellar populations (as marked in each panel) in two radial bins: 7 < R < 8 kpc (left panels) and 9 < R < 10 kpc (right panels). Red squares represent the CMD-weighted mean values of [α/Fe] in the individual vertical bins. The error bars of the mean values are over-plotted, but in almost all cases they are smaller than the size of the symbols. Linear fits to red squares are over-plotted by red lines. The blue horizontal dashed lines delineate a constant [α/Fe] value of 0.0 dex. The age range of each mono-age stellar population, the slope of the linear fit (vertical [α/Fe] gradients) and the associated error are marked in each panel. The mean value of [α/Fe] as a function of |Z| in each panel can be well fitted by a linear line.
Fig. 12 shows the vertical [α/Fe] gradients derived for the mono-age stellar populations as a function of R. Almost all of the mono-age stellar populations have positive vertical [α/Fe] gradients at a given radial annulus. The figure also shows that the positive vertical [α/Fe] gradients flatten with increasing R for stellar populations of τ < 8 Gyr. The gradients steepen with increasing R for stellar populations of τ > 8 Gyr.
![Vertical [α/Fe] gradients as a function of R derived from mono-age stellar populations, presented with different colours, as marked in the plot. The horizontal dashed lines delineate a constant vertical [α/Fe] gradient value of 0.0 dex $\rm kpc^{-1}$. Vertical [α/Fe] gradients flatten as R increases for populations of $\tau \, \lt \, 8\,$ Gyr (left panel), but steepen as R increases for populations of $\tau \, \gt \, 8\,$ Gyr (right panel).](https://oup.silverchair-cdn.com/oup/backfile/Content_public/Journal/mnras/482/2/10.1093_mnras_sty2797/1/m_sty2797fig12.jpeg?Expires=1749926667&Signature=bar9NiO3ZNL1oGwu2eUsKC8-aa81o0-v0y4kxcWkEFSxRYlybnqgieweQ4GRjBvNWdjPHyZu2-KdxD9HdAqcitAxxJd2BzdUxtzuCz0wpOInULPeDeNkMHvt9SALGgMuFbRvlCXsp-JDZpeq0~fjPUJx0WfhJNf5vS9A5gXdqaB3Jg6FgRu6su1QoPJc7HfoabA36AdHIi4DCF8J09RMWP6Sdpiry4g~BXCUB90hcF6MA0X7NG8qJraoZwvMVMFsvl0h~UA6x6p0rsE1lsuQWuVY44p7rVYflc3Qe2mfyVRm2j1bhzoPPO8E9EQGnxnRWVFFCje~xjRFLxxwrXbE~Q__&Key-Pair-Id=APKAIE5G5CRDK6RD3PGA)
Vertical [α/Fe] gradients as a function of R derived from mono-age stellar populations, presented with different colours, as marked in the plot. The horizontal dashed lines delineate a constant vertical [α/Fe] gradient value of 0.0 dex |$\rm kpc^{-1}$|. Vertical [α/Fe] gradients flatten as R increases for populations of |$\tau \, \lt \, 8\,$| Gyr (left panel), but steepen as R increases for populations of |$\tau \, \gt \, 8\,$| Gyr (right panel).
3.5 Uncertainties of the gradients
Throughout this paper, only the fitting errors are reported, and the main contributions are random errors of the stellar parameters ([Fe/H], R, Z and age). In most cases, the fitting errors are very small (|$\lt\! 0.01\rm \, dex\, kpc^{-1}$|) because of the large number of stars in our sample. We emphasize that these small values of gradient errors are not in conflict with the broad metallicity distribution of stars at a given R or Z. This is because the latter is not only contributed by random errors of stellar parameters but also largely contributed by the intrinsic width of metallicity distribution. There are, however, other error (systematic) sources that are not considered in this work. For example, we derived the gradients with linear functions, but these may fail to describe the true radial or vertical trend of the mean [Fe/H] or [α/Fe] accurately. This is especially obvious in the case of the radial [α/Fe] gradients (see Fig. 8). In addition, contaminations from dwarf stars to our current MSTO-SG star sample are also expected to lead to considerable systematic errors in the gradients of old stellar populations.
4 Profiles of the [|${\rm Fe}$|/H] and [α/|${\rm Fe}$|] distributions
4.1 Profiles of the [|${\rm Fe}$|/H] distributions
In order to investigate the profiles of the [Fe/H] distributions, we first mapped out the [Fe/H] distributions of mono-age stellar populations in each R and |Z| bin. In doing this, the individual mono-age stellar populations were divided into annuli of 1 kpc and 3 kpc in the radial direction for R < 12 kpc and R > 12 kpc, respectively. In each annulus, we further divided the mono-age stellar populations into three bins of |Z|, namely [0,0.3], [0.3,1.5] and [1.5,2] kpc, corresponding roughly to the thin disc, the transition region between the thin and thick disc, and the thick disc, respectively. Bins containing fewer than 100 stars were discarded. Fig. 13 shows the normalized [Fe/H] distributions of the individual mono-age stellar populations in each R and |Z| bin. The histogram [Fe/H] distribution is plotted with a bin size of 0.08 dex, corresponding approximately to half of the typical uncertainty of [Fe/H] measurements. The profiles of the [Fe/H] distributions of the different mono-age stellar populations show significant variations with R and |Z|, especially for stellar populations of τ < 8 Gyr. For stellar populations of τ < 8 Gyr and |Z| < 1.5 kpc, the [Fe/H] distributions vary from a negative skewed profile (having relatively long metal-poor tails) in the inner disc to a positive skewed profile (having relatively long metal-rich tails) as R in the outer disc. For the stellar populations older than 8 Gyr in all |Z| bins, or the stellar populations younger than 8 Gyr in high-|Z| bins, the distributions show only weak variations with R. For the stellar population of τ > 11 Gyr, our results also show an unexpectedly high fraction of metal-rich [Fe/H] > 0 stars, whose origins are not fully understood. One possibility is that they originated in the inner disc and migrated to their current positions as a result of kinematic processes. Contaminations of younger dwarf stars may have also contributed a significant part of them.
![Distributions of [Fe/H] in various R, |Z| and τ bins. The x-axis show the values of [Fe/H], and they-axis shows the relative stellar numbers in different [Fe/H] bins. The left, middle and right panels show the results derived from stars at |Z| < 0.3 kpc, 0.3 < |Z| < 1.5 kpc and 1.5 < |Z| < 2.0 kpc, respectively. The age ranges of the mono-age stellar populations are given in each panel. The results for the different radial bins are presented by lines of different colours, as labelled in the lower right panel of the plot. The vertical dashed lines delineate constant [Fe/H] values of −0.5 and 0.0 dex. The profiles of the [Fe/H] distributions show significant radial variations for young stellar populations ($\tau \, \lt \, 8\,$ Gyr), but no clear radial variations for old stellar populations ($\tau \, \gt \, 8\,$ Gyr).](https://oup.silverchair-cdn.com/oup/backfile/Content_public/Journal/mnras/482/2/10.1093_mnras_sty2797/1/m_sty2797fig13.jpeg?Expires=1749926667&Signature=Ha4YZtIT1C7pjE94p4qf-VmOAYfmaidupLeJDkiWkhSCetmaBvldEeRD-YlA0aHveaRe5mxHyYbLdErIhrZudhikpSEBunoN97Hkcel0LOxsl1iYYUP6NCekXJWiSObv87Q6U4O7yprfPiZtmUKN2U40MnQBPj5hH2p34pKc-VDQtKxpR4ExnfOtiyR4ciwk1-1wwyu-kjNJka0SwPVMGKGJa4bXhh8cPrSLMkSOHarWLawj8z76mFWUtc637KHjYwhFOuXNJiEAE17d8IgH3aqv1zLgiZ2ZyeuK6IHutJQNCmFTMPDonKLW1bsaQ55RF3eYe3yaECPhDeJEixUrZg__&Key-Pair-Id=APKAIE5G5CRDK6RD3PGA)
Distributions of [Fe/H] in various R, |Z| and τ bins. The x-axis show the values of [Fe/H], and they-axis shows the relative stellar numbers in different [Fe/H] bins. The left, middle and right panels show the results derived from stars at |Z| < 0.3 kpc, 0.3 < |Z| < 1.5 kpc and 1.5 < |Z| < 2.0 kpc, respectively. The age ranges of the mono-age stellar populations are given in each panel. The results for the different radial bins are presented by lines of different colours, as labelled in the lower right panel of the plot. The vertical dashed lines delineate constant [Fe/H] values of −0.5 and 0.0 dex. The profiles of the [Fe/H] distributions show significant radial variations for young stellar populations (|$\tau \, \lt \, 8\,$| Gyr), but no clear radial variations for old stellar populations (|$\tau \, \gt \, 8\,$| Gyr).
In order to describe quantitatively the differences of the profiles of the [Fe/H] distributions of the individual mono-age stellar populations, we derived the skewness of the distributions. To do this, we divided the individual mono-age stellar populations into annuli of 1 kpc in the radial direction from 6 to 13 kpc with a step of 0.5 kpc. The bins of |Z| are the same as used for Fig. 13. Bins containing fewer than 600 stars were discarded in order to ensure robust measurements of the skewness. Fig. 14 plots the radial variations of the skewness for mono-age stellar populations at |Z| < 1.5 kpc. The figure shows a strong radial trend of the skewness, and the trend varies with stellar age. It shows that for populations of τ < 8 Gyr and |Z| < 1.5 kpc, the skewness increases with increasing R (it switches from negative to flat or even positive), and the radial trend becomes flatter with increasing age. For the old populations, of τ > 8 Gyr, the skewness decreases with increasing R, while the radial trend of the skewness for populations of 8 < τ < 11 Gyr is less significant.

Skewness as a function of R for the mono-age stellar populations (at |Z| < 1.5 kpc), presented with different colours, as marked in the plot. The skewness of stellar populations of |$\tau \, \lt \, 8\,$| Gyr (left panel) increases as R increases, while that of stellar populations of |$\tau \, \gt \, 8\,$| Gyr (right panel) decreases or is nearly invariant as R increases. The results for the stellar population of |$\tau \, \gt \, 11\,$| Gyr should be taken with caution owing to the possible contamination by young dwarf stars.
Hayden et al. (2015) studied the radial variations of the profiles of the [Fe/H] distributions (see their fig. 5) using 69 919 APOGEE red giant stars. In their study, they divide the sample stars into two populations of high and low [α/Fe] ratios, corresponding approximately to old and young stellar populations, respectively. Their results show that the [Fe/H] distributions of the low-[α/Fe] population close to the Galactic plane (|Z| < 0.5 kpc) are negatively skewed in the inner disc and are positively skewed in the outer disc. However, the profiles of the [Fe/H] distributions of the high-[α/Fe] population, as well as those of the low-[α/Fe] population at large height above the disc mid-plane, are almost symmetric and invariant with R. These radial variation trends of the profiles of [Fe/H] distributions for low-[α/Fe] and high-[α/Fe] populations are generally in good agreement with our results for young (<8 Gyr) and old (>8 Gyr) stellar populations, respectively. Because we benefit from robust age estimates, we are able to determine the transition age at which the profiles of the [Fe/H] distributions (more precisely, the skewness) change from displaying strong radial variations (at τ < 8 Gyr) to displaying weak radial variations (at τ > 8 Gyr).
4.2 Profiles of the [α/Fe] distributions
In order to study the profiles of the [α/Fe] distributions of the mono-age stellar populations, the MSTO-SG-SNR50 sample was divided into bins of R, |Z| and τ. The bins used, in terms of R, |Z| and τ, are the same as those adopted for Fig. 13. The normalized [α/Fe] distributions are shown in Fig. 15. The figure shows that the profiles of the [α/Fe] distributions vary with R at all values of |Z| for the populations of τ > 8 Gyr. They have negatively skewed distributions in the inner disc and positively skewed distributions in the outer disc. For the stellar populations of 2 < τ < 8 Gyr, the profiles of the [α/Fe] distributions vary only weakly with R and |Z|. The results also show that the stellar population of 4 < τ < 6 Gyr at R < 7 kpc contains many more α-rich stars than at R > 7 kpc. Considering the small number of stars in this bin, we presume that this result is not significant. The profiles of the [α/Fe] distributions of stellar populations of |$\tau \, \lt \, 2\,$| Gyr show variations with R. However, we note that the stellar populations of |$\tau \, \lt \, 2\,$| Gyr contain an unexpectedly high fraction of high [α/Fe] stars, and this may be the consequence of incorrect [α/Fe] estimates of some of those stars. As discussed by Xiang et al. (2017a), these objects are probably spectroscopic binaries of composite spectra. The [α/Fe] values of these stars have been incorrectly estimated. The fraction of the youngest stars with incorrect values of [α/Fe] is about 10–20 per cent. Thus, the profiles of the [α/Fe] distributions of the youngest stars should be taken with caution.
![As Fig. 13, but for [α/Fe]. The vertical dashed lines delineate constant [α/Fe] values of 0.0 and 0.2 dex. The results for the stellar population of $\tau \, \lt \, 2\,$ Gyr should be taken with caution as about 10–20 per cent of the [α/Fe] measurements of these stars may be incorrect.](https://oup.silverchair-cdn.com/oup/backfile/Content_public/Journal/mnras/482/2/10.1093_mnras_sty2797/1/m_sty2797fig15.jpeg?Expires=1749926667&Signature=0VpdcqITmioL~e~wJoS4PhVTCWzaosAajQVdXEvaLiVVrN6ntSI7d19pO-~uZOs4b84~M3zTKD110PllkQ3QSx69Yw652CWMZ5YOo0pdsT1p2kiuUAov3a1s6HgAI11zo9GFBuw6Q8QhXmkj7rA7fBtzwYETnauspj~bJoaHGsMWq8AsKoENuupWpI2r84FqMssQPny6mM9Ix6OCH0wTOkvpAYfHdhoYD4BcsV9qhd1aR9aTmbTtGla0VFbdSyLZAcLrX6JcfepjuIbMTXTM7JhEzahe3Ef-seOe~rjSa6BQ7bnlkH3P0SCvZWWaDH8sGFyBG4O-TaFRqpR2ugCrYA__&Key-Pair-Id=APKAIE5G5CRDK6RD3PGA)
As Fig. 13, but for [α/Fe]. The vertical dashed lines delineate constant [α/Fe] values of 0.0 and 0.2 dex. The results for the stellar population of |$\tau \, \lt \, 2\,$| Gyr should be taken with caution as about 10–20 per cent of the [α/Fe] measurements of these stars may be incorrect.
Values of skewness of the [α/Fe] distributions were also estimated for the mono-age stellar populations, as shown in Fig. 16. As discussed in the above paragraph, we found that the profiles of the [α/Fe] distributions of τ < 2.0 Gyr are likely to be unrealistic and that those of 2 < τ < 8 Gyr vary weakly with R. Thus, values of skewness of the [α/Fe] distributions of the young stellar populations are not presented here. Fig. 16 shows only the radial variations of the skewness of the [α/Fe] distributions for the stellar populations of τ > 8 Gyr in various |Z| bins. It shows that the skewness of the stellar populations of τ > 8 Gyr increase with increasing R at |Z| < 1.5 kpc.
![As Fig. 14, but for [α/Fe]. The skewness of [α/Fe] distributions of old stellar populations ($\tau \, \gt \, 8$ Gyr) increases as R increases.](https://oup.silverchair-cdn.com/oup/backfile/Content_public/Journal/mnras/482/2/10.1093_mnras_sty2797/1/m_sty2797fig16.jpeg?Expires=1749926667&Signature=mkDKGCAIq99d1IqOU1zoeSYBjmd-fnotQ2gGcjTGliPoy5H-A0WMEe-~VC47IFSc0hJfnLedGCjr9DOcTDJnCh73jPmvLDEHhdIEdLrT0bgfJw-60XmlaaR1WH2RouXAs9XHpbJZFfKxj0YsZHYNOKl4GEoCBXZ0n5i954pA0pHkfYvH1KkyLMQONuPkBWsDVYFdlAtYsDatqpab3uNQvaGQxZBhbr~cwHeqUG72NV8SLjGiPW~fAwyIdGnd3ly9sz-j-3pzBABuLmUefoGL8P7163xl2c7cEP7TeGKHtG9UHWrUyj4Y0Y5~mo~HuAraZl-tis281sJ5qBFZyNCveQ__&Key-Pair-Id=APKAIE5G5CRDK6RD3PGA)
As Fig. 14, but for [α/Fe]. The skewness of [α/Fe] distributions of old stellar populations (|$\tau \, \gt \, 8$| Gyr) increases as R increases.
5 IMPACTS OF RADIAL MIGRATION ON THE METALLICITY DISTRIBUTION FUNCTION
The radial dependence of the profiles of the [Fe/H] distributions has been modelled by Schönrich & Binney (2009) and Toyouchi & Chiba (2018) using a chemical evolution model that includes the radial migration processes. The radial migration processes carry stars from the inner (metal-rich) or outer (metal-poor) disc region to their current spatial position (R, Z) (Minchev et al. 2018, see their fig. 6), and consequently change the profiles of the [Fe/H] distributions owing to the existence of radial metallicity gradients in the Galactic disc. Because the Galactic disc exhibits negative radial [Fe/H] gradients, the ‘inwards’ migrators generally contribute the metal-poor tail of the [Fe/H] distribution, while the ‘outwards’ migrators contribute mainly the metal-rich tail. The process will produce a relatively negative skewed [Fe/H] distribution in the inner disc and a relatively positive skewed [Fe/H] distribution in the outer disc, and consequently produces a positive radial gradient of skewness. That is, the radial gradients of skewness and mean values and their evolution with age should be opposite in sign. Fig. 17 shows the radial gradients of skewness and mean values of [Fe/H] and [α/Fe] as a function of age for stellar populations at |$|Z|\, \lt \, 1.5$| kpc. The figure shows that the radial gradients of skewness and mean values and their evolution with age are indeed opposite in sign, and the stronger the abundance gradients, the stronger the gradients in skewness. The radial [Fe/H] gradients of stellar populations of τ < 8 Gyr at |$|Z|\, \lt \, 1.5$| kpc are negative, while the radial gradients of skewness in [Fe/H] are positive. For stellar populations of τ > 8 Gyr at |$|Z|\, \lt \, 1.5$| kpc, the radial gradients of skewness and of the mean values of [Fe/H] are nearly flat. This suggests that radial migration is clearly in operation and has affected the profiles of the [Fe/H] distributions of stellar populations with significant radial [Fe/H] gradients. The absence of radial variations of the profiles of the [Fe/H] distributions for stellar populations of τ > 8 Gyr is probably caused by the absence of any significant radial [Fe/H] gradients in those stellar populations. Fig. 17 also shows that the radial [α/Fe] gradients of stellar populations of τ > 8 Gyr are negative, while the radial skewness gradients in [α/Fe] are positive. The radial variations of profiles of [α/Fe] for stellar populations of |$\tau \, \gt \, 8\,$| Gyr are probably the result of both the presence of negative radial [α/Fe] gradients and the radial migration processes.
![The radial gradients of skewness (black dots and lines) and mean values (red dots and lines) of [Fe/H] (left panel) and [α/Fe] (right panel) as a function of age for stellar populations at $|Z|\, \lt \, 1.5\,$ kpc. The horizontal lines delineate a constant gradient value of 0.0. The vertical lines delineate a constant age of 8 Gyr. The variations of the radial skewness gradients with age are opposite to the variations of the radial gradients of the mean values with age.](https://oup.silverchair-cdn.com/oup/backfile/Content_public/Journal/mnras/482/2/10.1093_mnras_sty2797/1/m_sty2797fig17.jpeg?Expires=1749926667&Signature=kX2f7kppk63BpTBzj7H8edt7KuWruJXnYbWRZAYFYQevx9k6VZrgINZNvZTJsRHp-Q4U~U1Cb5c41dyS2ZV3pMmTmm0fWlvhp04SgM2gvA66gUpCA2PDrpS9~1lQoRjZ5upCWuHow4LdJjI7l3bAgwxLl~FwsdEfQHGw~ypvO3V3RDaII3yuysqzYNPvN~cBao9KWtGOIrwHkqUaewmYJhb0pn8rDTYTdKa68ZqwGPhA-JIerBrhkDno8UVB0Iifu7fC0MfcOyD9gAEo-EOj8sfe3GdsWl27chkmvObuwPUCY4pa0HleNVJ9maMeszQB~BpLI6XbD3h8h8PIjlUd5A__&Key-Pair-Id=APKAIE5G5CRDK6RD3PGA)
The radial gradients of skewness (black dots and lines) and mean values (red dots and lines) of [Fe/H] (left panel) and [α/Fe] (right panel) as a function of age for stellar populations at |$|Z|\, \lt \, 1.5\,$| kpc. The horizontal lines delineate a constant gradient value of 0.0. The vertical lines delineate a constant age of 8 Gyr. The variations of the radial skewness gradients with age are opposite to the variations of the radial gradients of the mean values with age.
In short, negative radial [Fe/H] or [α/Fe] gradients, combined with radial migration processes, which change the motion radii of the stars, are responsible for the observed radial variations of the profiles of the [Fe/H] and [α/Fe] distributions for young and old populations, respectively.
Generally, there are two types of radial migrations, namely churning and blurring (e.g. Schönrich & Binney 2009). In the churning process, a star changes its orbit radius owing to a gain/loss of angular momentum. In the blurring process, the angular momentum of a star is conserved and its epicycle amplitude changes. In the remainder of this section, we will further discuss the effects of the blurring process on the metallicity distributions of the mono-age stellar populations. First, we integrated the orbit of each star, assuming the Galactic gravitational potential given by Gardner & Flynn (2010), for a long enough time and derived the average R and |Z|, namely <R > and <|Z| >. We then examined the distributions as a function of the guiding centre radius (|$R_{\rm g}\, =\, \lt R\gt $|) and |Z|, rather than of R and |Z|. The results seem to rule out any significant effects of blurring at play.
Fig. 18 shows the radial and vertical [Fe/H] and [α/Fe] gradients estimated in the R–|Z| and Rg–|Z| planes for the various mono-age stellar populations. For stellar populations of τ > 8 Gyr, the radial [Fe/H] and [α/Fe] gradients estimated in the R–|Z| plane are flatter and steeper than those derived in the Rg–|Z| plane, respectively. In the regions of low |Z|, the radial [Fe/H] gradients derived in the R–|Z| plane are steeper than those deduced in the Rg–|Z| plane for stellar populations of τ < 8 Gyr. The radial [α/Fe] gradients for the stellar populations of 4 < τ < 8 Gyr derived in the R–|Z| plane are steeper than those derived in the Rg–|Z| plane. The results suggest that the blurring process may steepen the radial [Fe/H] gradients for populations of τ < 8 Gyr, and the radial [α/Fe] gradients for all stellar populations, while its effects on the radial [Fe/H] gradients are likely to be small or negligible for populations of τ > 8 Gyr. The results are opposite to the predictions of chemical evolution models (e.g. Schönrich & Binney 2009), which suggest that radial migration will lead to a flattening of the radial metallicity gradients. While the chemical evolution models always assume a smooth radial stellar number (mass) distribution, the real disc shows a complicated structure, and this may partly account for the difference. Note that Schönrich & Binney (2009) considered both two types of radial migration processes, which may also produce a difference. The vertical [Fe/H] and [α/Fe] gradients derived in the R–|Z| plane and those derived in the Rg–|Z| plane are quite identical to each other, with the exception that the vertical [Fe/H] gradient in the R–|Z| plane is flatter than that in the Rg–|Z| plane for populations of τ < 4 Gyr.
![Radial (top panels) and vertical (bottom panels) [Fe/H] (left panels) and [α/Fe] (right panels) gradients. Solid lines show gradients estimated in the R–|Z| plane, while dotted lines show those estimated in the Rg–|Z| plane. Different colours show the results of the different mono-age stellar populations, as marked in the panels. The horizontal lines delineate a constant gradient value of 0.0 dex $\rm kpc^{-1}$.](https://oup.silverchair-cdn.com/oup/backfile/Content_public/Journal/mnras/482/2/10.1093_mnras_sty2797/1/m_sty2797fig18.jpeg?Expires=1749926667&Signature=m4tm4I54JfWvmt44IZjmjjy9YE~qI0rlDcj1PG3vzs3wohh1tJDB2dV19u2Bfmhuko53jT1hW5BF275RJx2JrYBh~WlDD3LoC-zEJwzfS-xU1dlXXAT~xwQc7aCDCbwOfnYlZsBkRmtDUVAvpZaJds3E5rp0-2d4t~So9UExs197vzFe-Bv7cdJw3pjs4wdr18Fxpqlc97-foNV-yfFql3o9W3b6i2kGD7lhGCH2lQfF-SRfsEbIXyPXxJb4twjFIVaGbxqvdRkfW283ENhnLdOQL1K-NT2AbIsrHVTBcQgIsDeND13Q-Y8bCI89KVJjgNtnGX7vSBkPhQYAOalw-w__&Key-Pair-Id=APKAIE5G5CRDK6RD3PGA)
Radial (top panels) and vertical (bottom panels) [Fe/H] (left panels) and [α/Fe] (right panels) gradients. Solid lines show gradients estimated in the R–|Z| plane, while dotted lines show those estimated in the Rg–|Z| plane. Different colours show the results of the different mono-age stellar populations, as marked in the panels. The horizontal lines delineate a constant gradient value of 0.0 dex |$\rm kpc^{-1}$|.
As discussed in Section 4, the skewness of the [Fe/H] and [α/Fe] distributions is a function of R for the young and old populations, respectively. In order to check whether the blurring is the main process producing the radial trends of the [Fe/H] and [α/Fe] distributions, we plot the profiles of the [Fe/H] and [α/Fe] distributions in different R and Rg bins for the young and old populations in relatively low-|Z| regions, respectively, in Fig. 19. The figure shows the distributions of [Fe/H] of stellar populations of |$4\, \lt \, \tau \, \lt \, 6\,$| Gyr and |$11\, \lt \, \tau \, \lt \, 14\,$|Gyr in order to check whether blurring affects the [Fe/H] distributions of different mono-age populations differently. For the distributions of [α/Fe], we only show the results for stellar populations of |$8\, \lt \, \tau \, \lt \, 11\,$| Gyr at |$0.3\, \lt \, |Z|\, \lt \, 1.5$| kpc, in which there are a sufficient number of stars. Fig. 19 shows that the profiles of the [Fe/H] and [α/Fe] distributions also vary with Rg for the young and old populations, respectively. This suggests that the radial variations of the skewness are not a consequence of the blurring process. Hayden et al. (2015) argue that a chemical evolution model considering the churning rather than the blurring process can reproduce the radial variations of the observed profiles of the [Fe/H] distributions. Alternatively, the effects of blurring must be much smaller than those of churnning. Their conclusions are consistent with our results.
![[Fe/H] (first and second columns) and [α/Fe] (third column) distributions. The top panels show the distributions derived in the R–|Z| plane, while those in the bottom panels show the results derived in the Rg–|Z| plane. The panels in the first column show the [Fe/H] distributions derived for the stellar populations of 4 < τ < 6 Gyr close to the Galactic plane. The panels in the second column show the [Fe/H] distributions derived for the stellar populations of 11 < τ < 14 Gyr close to the Galactic plane. The panels in the third column show the [α/Fe] distributions for the stellar populations of 8 < τ < 11 Gyr of height 0.3 < |Z| < 1.5 kpc. The vertical lines delineate constant [Fe/H] values of −0.5 and 0.0 dex, and constant [α/Fe] values of 0.0 and 0.2 dex.](https://oup.silverchair-cdn.com/oup/backfile/Content_public/Journal/mnras/482/2/10.1093_mnras_sty2797/1/m_sty2797fig19.jpeg?Expires=1749926667&Signature=aNRf2vqr8ySiTpg8CjEzlRbQUOz2M3wXh~v4XUUl2ea~OVPiIy7~kcD2A2HhC9bzROS3rid9m~FQLGfqXEBPi7AXzSYCoS07hCHogFP3XHq8EV24GWY84IZ2RpXnq8rpHHt8Iget0vQ4oL~5dz5Vem16mvQ4CSrZZFND7PhjjdV2RtYsfSUdsWByPTZ7iSERr7eu2mDRPi2I55ZYg0Jj7h8wFB~THcawlPmfjVA-uiI-TZGwHAYWLdvtYHi8yii5WoQJQ-eGgOjUh6u2Hv-PTbevlkIMkPC-42GmMZIo3gQDx7fnYEtb-TTnk8oyeK-~Mzs~xP-c9zUvdmNg-SiNAA__&Key-Pair-Id=APKAIE5G5CRDK6RD3PGA)
[Fe/H] (first and second columns) and [α/Fe] (third column) distributions. The top panels show the distributions derived in the R–|Z| plane, while those in the bottom panels show the results derived in the Rg–|Z| plane. The panels in the first column show the [Fe/H] distributions derived for the stellar populations of 4 < τ < 6 Gyr close to the Galactic plane. The panels in the second column show the [Fe/H] distributions derived for the stellar populations of 11 < τ < 14 Gyr close to the Galactic plane. The panels in the third column show the [α/Fe] distributions for the stellar populations of 8 < τ < 11 Gyr of height 0.3 < |Z| < 1.5 kpc. The vertical lines delineate constant [Fe/H] values of −0.5 and 0.0 dex, and constant [α/Fe] values of 0.0 and 0.2 dex.
Fig. 19 also shows that the dispersions of the metallicity distributions derived in the R–|Z| plane are larger than those derived in the Rg–|Z| plane. This suggests that the blurring process may have increased the dispersions of the metallicity distributions for both the young and the old stellar populations. Comparing the top and bottom panels in the third column of the figure, it is found that there are more high-α stars in the 7 < R < 8 kpc and 0.3 < |Z| < 1.5 kpc bin than in the 7 < Rg < 8 kpc and 0.3 < |Z| < 1.5 kpc bin. By examining the Rg distribution of stars in 7 < R < 8 kpc, we find that there are many more stars for Rg < 7 kpc than for Rg > 8 kpc. Clearly, those high-α stars originate from the inner disc and move to their current positions through the blurring process.
6 CONSTRAINING THE FORMATION AND EVOLUTION OF THE DISC(S)
6.1 The formation scenario of the disc at an early epoch
The radial and vertical [Fe/H] and [α/Fe] gradients of the oldest stellar populations provide strong constraints on the formation scenario of the disc at early epochs. The oldest stellar populations (τ > 11 Gyr) show nearly flat or marginally positive radial [Fe/H] gradients. This suggests that the oldest stellar populations formed from gas that was originally well mixed in the radial direction in a violent, fast formation process. A fast, highly turbulent gas-rich merger formation scenario as proposed by Brook et al. (2004, 2005) suggests that the thick disc formed so fast (with a time-scale shorter than the lifetime of Type Ia supernovae (SNe Ia), which produce most of the iron elements) at an early epoch that there should be no [Fe/H] gradients in the radial direction, which is consistent with our results for the oldest stellar populations.
On the other hand, we find that there are significant negative vertical [Fe/H] gradients and negative radial [α/Fe] gradients for the oldest stellar populations. This suggests that the formation of the oldest disc (meaning here the disc older than 11 Gyr) cannot be too fast, as it needs enough time to develop vertical [Fe/H] gradients and negative radial [α/Fe] gradients. The time-scale of disc formation should be longer than the lifetime of Type II supernovae (SNe II). SNe II produce most of the α elements. Before 11 Gyr, several generations of stars have evolved and changed the [α/Fe] of the disc. Higher star formation rates (SFRs) (discussed in Section 6.2) in the inner disc produce more exploring of SNe II in the inner disc and the negative radial [α/Fe] gradient presented in the current work.
In conclusion, the disc formed from an originally well-mixed gas in a violent, fast formation process at early epoch. The time-scale of the process is shorter than the lifetime of SNe Ia, but longer than the lifetime of SNe II. In the evolution of the oldest disc, the vertical heating plays an important role.
6.2 The ‘inside-out’ and ‘upside-down’ disc formation scenarios
Our data show negative radial [Fe/H] gradients for the stellar populations younger than 11 Gyr and negative radial [α/Fe] gradients for the oldest stellar populations, which is a consequence of the ‘inside-out’ disc formation scenario (Matteucci & Francois 1989; Schönrich & McMillan 2017). In this scenario, SFRs in the inner disc are higher than those in the outer disc, yielding more metals in the inner disc than in the outer disc and the negative radial [Fe/H] gradients. As discussed in Section 6.1, the ‘inside-out’ disc formation scenario is also responsible for the negative radial [α/Fe] gradients for the oldest stellar populations. At early epochs, as R decreases the SFR increases, yielding more exploding SNe II, more α-elements and higher [α/Fe] in the inner disc.
All the mono-age stellar populations show negative vertical [Fe/H] gradients. This is consistent with the theoretical predictions of Minchev et al. 2014 and Kawata et al. (2017), who consider among others mono-age stellar populations formed in a flaring, star-forming disc. In this scenario, stars in the outer regions can reach higher vertical heights than can stars in the inner regions because of their higher vertical energies, which produces a flaring disc (Minchev et al. 2015). Radial mixing then yields negative vertical [Fe/H] gradients (Kawata et al. 2017; Ciucǎ et al. 2018). If the radial migration process is slow, old stars have more time to migrate to the outer disc, producing steeper (negative) vertical [Fe/H] gradients for the old stellar populations. Again this is consistent with our findings. On the other hand, if this scenario does obtain, then one would expect negative vertical [α/Fe] gradients, which is not consistent with our finding that all the mono-age stellar populations exhibit positive vertical [α/Fe] gradients. Our results thus prefer the ‘upside-down’ disc formation scenario. This scenario suggests that the height of the star-forming gas layer contracts as the stellar mass of the disc grows (Bird et al. 2013; Bournaud, Elmegreen & Martig 2009). Furthermore, as the metal-rich and [α/Fe]-poor gas settles down to the Galactic plane, it produces negative vertical [Fe/H] gradients and positive vertical [α/Fe] gradients.
6.3 The superposition of two discs
Our current study finds that for the low-|Z| regions, the radial [α/Fe] gradients steepen with increasing age, while for the high-|Z| regions, the gradients flatten with increasing age. The results are the consequence of the superposition of two discs, a low-α, ‘thin’ disc with a large scale-length, and a high-α, ‘thick’ disc with a small scale-length. The relative fractions of the ‘thin’ and the ‘thick’ disc are different for different mono-age stellar populations, with younger stellar populations containing more low-α, ‘thin’-disc stars. In the low-|Z| regions, low-α, ‘thin’-disc stars dominate both the inner and the outer disc (see Fig. 11) for young stellar populations, leading to relatively flat gradients. Populations of older ages contain more α-rich, ‘thick’-disc stars in the inner disc than in the outer disc (see Fig. 11), yielding relatively steeper (negative) gradients. In the high-|Z| regions, ‘thick’-disc, α-rich stars dominate in the inner disc (see Fig. 11) for all the mono-age stellar populations. It seems that the α-rich disc contains stars as young as 2−4 Gyr. Those young, α-rich stars are either a consequence of a sustained star formation process of the thick disc, or are intrinsically old stars whose ages have been underestimated – some of them may well be blue stragglers (Xiang et al. 2017a). In the outer disc, young stars are dominated by ‘thin’-disc, α-poor stars (see Fig. 11). This produces relatively steeper negative radial [α/Fe] gradients for young stars. Likewise, old stars in the outer disc are dominated by ‘thick’-disc, α-rich stars, leading to relatively flat negative radial [α/Fe] gradients for old stars. The superposition of two discs can also naturally explain the finding that the positive vertical [α/Fe] gradients flatten with increasing R for the stellar populations of τ < 8 Gyr, while they steepen with increasing R for the stellar populations of τ > 8 Gyr.
7 SUMMARY
In this work, two samples, a sample consisting of 453 188 LAMOST MSTO-SG stars of spectral SNRs > 20 (MSTO-SG-SNR20) and another consisting of 291 126 similar stars of spectral SNRs > 50 (MSTO-SG-SNR50), were built to study the [Fe/H] and [α/Fe] distributions of mono-age stellar populations, respectively. Here, we have carried out for the first time a systematic study of the profiles of [Fe/H] distributions, of the radial and vertical [α/Fe] gradients, and of the profiles of [α/Fe] distributions of mono-age stellar populations. For the MSTO-SG-SNR20 sample, estimates of effective temperature, surface gravity, metallicity, radial velocity and absolute magnitudes are estimated to be accurate to 150 K, 0.2 dex, 0.15 dex, 5 km |$\rm s^{-1}$| and 0.5–0.6 mag, respectively. Estimates of [α/Fe] are estimated to be accurate to 0.05 dex for MSTO-SG-SNR50 sample stars. For the two MSTO-SG samples, the age and distance errors are about 30 and 17 per cent, respectively. The main results presented in this work are the following.
(a) The main results on the radial and vertical [Fe/H] and [α/Fe] gradients are as follows.
Radial [Fe/H] gradients derived from stars of τ < 11 Gyr are negative, and vary with |Z| and τ. The gradients flatten with increasing |Z|. Radial [Fe/H] gradients derived from stars of τ > 11 Gyr are ∼−0.00 ± 0.03 dex |$\rm kpc^{-1}$| and vary little with |Z|. After being nearly flat at the earliest epoch of the disc formation, the radial [Fe/H] gradients steepen with decreasing age, reaching maxima in the range 4 < τ < 6 Gyr, and then flatten again.
There are negative vertical [Fe/H] gradients, which vary with R and τ. The gradients flatten with increasing R, and steepen with increasing age at R > 8 kpc.
Radial [α/Fe] gradients derived for the stellar populations of τ < 4 Gyr decrease with increasing |Z|. The gradients are nearly flat for the stellar populations of 4 < τ < 6 Gyr and are invariant with |Z|. There are negative gradients for the stellar populations of τ > 6 Gyr. The gradients are a function of age. They steepen with increasing age in the low-|Z| regions and flatten with increasing age in the high-|Z| regions.
There are positive vertical [α/Fe] gradients that vary with R and τ. The gradients flatten with increasing R for the stellar populations of τ < 8 Gyr and steepen with increasing R for the stellar populations of τ > 8 Gyr.
(b) The main results for profiles of the [Fe/H] and [α/Fe] distributions are as follows.
The profiles of the [Fe/H] distributions vary with R for the young stellar populations of τ < 8 Gyr close to the Galactic plane (|Z| < 1.5 kpc). They show negatively skewed distributions in the inner disc and positively skewed distributions in the outer disc. The profiles of the distributions of the young stellar populations in the high-|Z| (|Z| > 1.5 kpc) regions show only marginal variations with R. The profiles are nearly the same in all R bins for the stellar populations of τ > 8 Gyr in all |Z| regions.
The profiles of the [α/Fe] distributions change with R for the old stellar populations of τ > 8 Gyr in all |Z| regions. Old stellar populations have negatively skewed distributions in the inner disc and positively skewed distributions in the outer disc. The profiles show weak radial variations for populations of τ < 8 Gyr.
The radial and vertical [Fe/H] gradients and their variations with radius and height deduced here for mono-age populations are quite similar to those obtained by Xiang et al. (2015b). For the stellar populations of τ < 8 Gyr, the observed radial variations of the profiles of the [Fe/H] distributions also match very well with those derived from the α-poor stellar populations by Hayden et al. (2015), who suggest that radial migration (especially the churning process) is an important process in the Galactic disc formation and evolution. The radial variations of the profiles of the [Fe/H] distributions derived here for the stellar populations of τ > 8 Gyr also match very well with those derived from the α-rich stellar populations by Hayden et al. (2015).
By examining the metallicity distributions in the R, |Z| and τ space, as well as in the Rg, |Z| and τ space, we find that the churning process rather than the blurring process is the main reason for the observed radial variations of the profiles of the metallicity distributions, consistent with the results of Hayden et al. (2015). The blurring process may have increased the widths of the profiles of the metallicity distributions.
Because of the wide-age and large-volume coverage of our MSTO-SG samples, we could map the metallicity distributions in different R, |Z| and τ bins. The results provide strong constraints on the formation and evolution of the Galactic disc(s). Our measured radial [Fe/H] and [α/Fe] gradients support the ‘inside-out’ disc formation scenario, while the vertical [Fe/H] and [α/Fe] gradients are consistent with the ‘upside-down’ disc formation scenario. Variations with age of the radial [α/Fe] gradients suggest that the Galactic disc is a superposition of two discs, a low-α, ‘thin’ disc with a large scale-length, and a high-α, ‘thick’ disc with a small scale-length. The measured values of [α/Fe] provide strong constraints on the SNe II/Ia ratio. The clearly observed negative radial [α/Fe] gradients derived from the populations of τ > 8 Gyr suggest that the SNe II/Ia ratio is larger in the outer disc than it is in the inner disc in the early epochs of disc formation.
ACKNOWLEDGEMENTS
We appreciate the helpful comments of the anonymous referee. This work is supported by National Key Basic Research Program of China2014CB845700, the NSFC grant 11703035 and the Joint Funds of the National Natural Science Foundation of China (Grant Nos U1531244 and U1331120). Guoshoujing Telescope (the Large Sky Area Multi-Object Fiber Spectroscopic Telescope LAMOST) is a National Major Scientific Project built by the Chinese Academy of Sciences. Funding for the project has been provided by the National Development and Reform Commission. LAMOST is operated and managed by the National Astronomical Observatories, Chinese Academy of Sciences. This work is also supported by National Natural Science Foundation of China (Grant No. 11473001).
