-
PDF
- Split View
-
Views
-
Cite
Cite
C Johnston, A Tkachenko, C Aerts, G Molenberghs, D M Bowman, M G Pedersen, B Buysschaert, P I Pápics, Binary asteroseismic modelling: isochrone-cloud methodology and application to Kepler gravity mode pulsators, Monthly Notices of the Royal Astronomical Society, Volume 482, Issue 1, January 2019, Pages 1231–1246, https://doi.org/10.1093/mnras/sty2671
Close - Share Icon Share
Abstract
The simultaneous presence of variability due to both pulsations and binarity is no rare phenomenon. Unfortunately, the complexities of dealing with even one of these sources of variability individually means that the other signal is often treated as a nuisance and discarded. However, both types of variability offer means to probe fundamental stellar properties in robust ways through asteroseismic and binary modelling. We present an efficient methodology that includes both binary and asteroseismic information to estimate fundamental stellar properties based on a grid-based modelling approach. We report parameters for three gravity mode pulsating Kepler binaries, such as mass, radius, age, as well the mass of the convective core and location of the overshoot region. We discuss the presence of parameter degeneracies and the way our methodology deals with them. We provide asteroseismically calibrated isochrone-clouds to the community; these are a generalization of isochrones when allowing for different values of the core overshooting in the two components of the binary.
1 INTRODUCTION
The mass of the helium core at the end of core hydrogen burning on the main-sequence (MS) is a pivotal quantity in stellar structure and evolution calculations, since it is regulated by the interior physics of MS stars and dictates the subsequent evolution of stars. Internal mixing processes modify the amount of nuclear fuel available for burning (Maeder 2009; Meynet et al. 2013), and thus, are of paramount importance to stellar structure and evolution calculations. Having a fully mixed convective core on the MS, intermediate- and high-mass stars are particularly sensitive to internal mixing processes, making their calibration and implementation a high priority in modelling efforts. Several different physical mechanisms work either independently or in conjunction with one another to form an internal mixing profile, which cannot be derived from first principles (Salaris & Cassisi 2017, for a recent review). However, from those processes which contribute to near core mixing in intermediate- and high-mass stars, we identify two classes: (i) convective boundary mixing (CBM) and (ii) rotation.
Convective boundary mixing is a collective term that includes convective entrainment, convective penetration, and convective overshooting, as well as shear instabilities, and the generation of internal gravity waves (Cristini et al. 2015; Viallet et al. 2015). Convective entrainment is the process by which mass (and hence chemicals) is (are) transported into a convective region due to turbulent motion at the interface of a convective region with a stably stratified region (Meakin & Arnett 2007). Although convective entrainment is commonly implemented in 3D hydrodynamic simulations, it has not yet been widely implemented in 1D stellar evolution codes (Staritsin 2013).
Convective penetration and convective overshooting represent two consequences of the same process, and in the literature are often both referred to as overshooting. This process refers to a convective element passing beyond a convective boundary as set by the Schwarzchild or Ledoux criterion due to its inertia, by an amount scaled in terms of the local pressure scale height. In convective penetration, the extended region adopts the adiabatic temperature gradient, which makes the extended region fully mixed and alters the thermal structure of the star, thus effectively enlarging the convective region. However, in convective overshooting, the extended region adopts the radiative temperature gradient, altering only the chemical structure of the equilibrium model. Due to limits in their implementation in 1D stellar models, these phenomena produce the same effect on non-asteroseismic observables, to differing degrees (Godart 2007). A complete CBM profile would consist of entrainment, penetrative, and overshooting profiles stitched to the Schwarzschild boundary (Hirschi et al. 2014), but this has yet to be consistently implemented in 1D stellar models. Additional mechanisms that can contribute to CBM currently lack firm observational characterization. Due to degeneracies in their implementation, it can be more sensible to only consider a single mechanism that contributes to the overall CBM profile, such as convective overshooting as described above, and measure those stellar quantities altered by different amounts of overshooting.
Rotationally induced mixing and its impact on stellar evolution are heavily researched areas in single stars (Abt, Levato & Grosso 2002; Ekström et al. 2012; Zhang 2013), binary stars (Torres, Andersen & Giménez 2010; Brott et al. 2011a,b; de Mink et al. 2013; Schneider et al. 2014), pulsating stars (Van Reeth, Tkachenko & Aerts 2016; Ouazzani et al. 2017; Christophe et al. 2018; Van Reeth et al. 2018), and stellar clusters (Evans et al. 2006; Niederhofer et al. 2015; Ahmed & Sigut 2017; Bastian & Lardo 2017). However, in 1D stellar models, rotational mixing is often introduced as a diffusive mixing term, making its contribution degenerate with those CBM process previously described, as well as with any additional mixing term implemented. For a comprehensive overview of rotation in stellar astrophysics, we refer the reader to Maeder (2009).
Convective overshooting (or CBM in general) alters the chemical (μ)-gradient in the near-core region and increases the mass of the core. The μ-gradient is important for massive stars that have a shrinking convective core as they evolve along the MS. The most important observational quantity varies from one modelling technique to another. For binaries and stellar clusters, the amount of CBM extends MS lifetimes, and hence alters the effective temperature, radius, and surface gravity of a star at a given age compared to when no CBM is present. For asteroseismic studies of pulsating stars, the μ-gradient and core mass dictate the characteristics of the gravity (g)-mode cavity, and hence the observed pulsation periods. Thus, the important quantity is the core mass of a star along its MS, but this is not an input parameter for the computation of stellar models. Rather, it is an output parameter once the overshooting description, Dov, has been chosen. Therefore, estimation of Dov (both the initial mixing value D0 and the shape of the overshoot description along the radial coordinate) is necessary to derive the core mass, μ-gradient and age of the star along the MS.
While the investigation of the consequences of an enhanced core mass for stars in a binary system extends back several decades (see e.g. Zahn 1977, 1991; Roxburgh 1978; Maeder & Meynet 1987; Andersen, Nordstroem & Clausen 1990, for some early works), today it is largely seen as a necessity to find agreement between observed dynamic masses and evolutionary masses. This so-called mass discrepancy is encountered when evolutionary tracks computed at the spectroscopic mass or dynamic mass obtained via eclipse modelling cannot reproduce spectroscopic temperatures or dynamic radii and surface gravities of the binary system (Herrero et al. 1992; Tkachenko et al. 2014). To match these observed quantities, a more massive star or a star of the same mass with a more massive core is required. Furthermore, these quantities must be matched at the same age for both components in the system. This can be done by fitting individual tracks and enforcing the same age at each evaluation, or by fitting stellar isochrones.
Several studies spanning stars of a considerable mass range have noted the need for at least some amount of overshooting to reconcile the otherwise discrepant dynamic and evolutionary masses (Claret & Gimenez 1991; Schroder, Pols & Eggleton 1997; Iwamoto & Saio 1999; Ribas, Jordi & Giménez 2000; Torres et al. 2010; Tkachenko et al. 2014; Claret & Torres 2018, hereafter CT18). Recently, Claret & Torres (2016, 2017) (hereafter CT16 and CT17, respectively) and CT18 have explored the mass dependence of overshooting in a sample of well-detached, evolved, double-lined (SB2) eclipsing binaries (EBs). The authors computed several tracks at the determined dynamic mass with varied overshooting (a step-overshooting prescription: αov in CT16, and a diffusive exponential description: fov in CT17 and CT18) and αMLT values, then fit the tracks individually according to their respective observed quantities allowing for a 5 per cent difference in age between the two components. Their results revealed an apparent mass dependence of overshooting from 1.2 to 2 M⊙ with no significant mass dependence from 2 to 4 M⊙. However, CT16, CT17, and CT18 did not take into account important degeneracies amongst the stellar parameters. Indeed, it is well known from gravity-mode asteroseismology that the core mass, via the core overshooting, is not only degenerate and correlated with the mass of the star, but also with metallicity and central hydrogen content (Moravveji et al. 2015, 2016; Schmid & Aerts 2016; Buysschaert et al. 2018). Moreover, estimation of Dov also requires one to take into account the depedencies of the choice of nuclear network, chemical mixture, opacity tables, atomic diffusion (e.g. Aerts et al. 2018). Only a systematic approach taking into account these parameter degeneracies can lead to proper estimates of core masses and ages of stars. This is supported by the work of Constantino & Baraffe (2018) who show that the need for overshooting in evolutionary tracks is less obvious when considering the sensitivity of commonly used observables to varying amounts of overshooting. Such a systematic study has not yet been done for binaries, which is the topic of this paper.
The extended MS turn-off (eMSTO) refers to the spread in effective temperature and surface gravity (or colour and magnitude) observed in the turn-off point of open and globular clusters. Historically, this has been investigated as being caused by several populations of stars with different rotation rates, where an entire cluster is assumed to have a singular amount of overshooting (Bastian & Lardo 2017). Regarding the Large Magellanic Cloud, convective core overshooting, metallicity, extinction, distance, and age were estimated simultaneously from Hubble Space Telescope observations by Rosenfield et al. (2017). This led to Dov values in line with canonical values, but with a proper (large!) uncertainty range. Yang & Tian (2017) have recently interpreted the eMSTO as being partly caused by stars with varying values of Dov. However, the authors did not systematically account for degeneracies with other parameters connected with the choice of the input physics in their stellar models.
Gravity mode oscillations are excellent calibrators for near-core mixing processes, such as core overshooting, because they propagate in the deep stellar interior near the core, and are sensitive to the processes at work there. For example, g modes have been used to estimate the near-core rotation rate in some 40 BAF-type stars, covering the range of very slow rotation to half critical (Kurtz et al. 2014; Saio et al. 2015; Murphy et al. 2016; Van Reeth et al. 2016, 2018). This was achieved by exploiting the properties of g-mode period spacings which were first discovered in MS Slowly Pulsating B (SPB) stars by the CoRoT mission (Degroote et al. 2010; Pápics et al. 2012) and have since been observed in Kepler space photometry of numerous SPB and γ Dor stars (Bedding et al. 2015; Van Reeth et al. 2015; Ouazzani et al. 2017; Pápics et al. 2017).
Period spacings of g modes are constructed by taking the difference between the periods of modes with the same degree, ℓ, and azimuthal order, m (Aerts, Christensen-Dalsgaard & Kurtz 2010). Gravity modes and hence g-mode period spacing patterns are sensitive to the mass of the core, which sets the scaling of the pattern for a given mode geometry (ℓ, m). Deviations from uniformity are produced by trapped g modes, whose frequencies are bumped due to the near-core μ-gradient that results from internal mixing (Miglio et al. 2008). Additionally, g modes are deflected by the Coriolis force according to their geometry, producing a negative slope in period spacing patterns of prograde and zonal g modes and a positive slope in the patterns of retrograde g modes (Miglio et al. 2008; Bouabid et al. 2013). This theoretical interpretation has been used to interpret period spacing patterns detected in space photometry in terms of near-core rotation, overshooting, and diffusive envelope mixing (Moravveji et al. 2015, 2016; Van Reeth et al. 2016; Schmid & Aerts 2016; Ouazzani et al. 2017; Pápics et al. 2017). Recently, period-spacing patterns have been modelled to reveal the shape and extent of core overshooting in a handful of SPB and γ Dor stars (Moravveji et al. 2015, 2016; Schmid & Aerts 2016; Buysschaert et al. 2018; Szewczuk & Daszyńska-Daszkiewicz 2018). Additionally period spacing patterns allowed Aerts, Van Reeth & Tkachenko (2017) to place the detected near-core rotation rates into an evolutionary sequence, with the aim to remedy shortcomings in angular momentum transport inside stars.
Despite their complementary nature and the extensive discussion of their synergies in the literature (Clausen 1996; De Cat et al. 2000, 2004; Aerts & Harmanec 2004; Miglio & Montalbán 2005), simultaneous binary and asteroseismic modelling efforts to investigate interior mixing have rarely been achieved. In the case of solar-like oscillators, a handful of MS, subgiant and red giant binaries, where both components exhibit oscillations, have been modelled (Miglio & Montalbán 2005; Appourchaux et al. 2014, 2015; Metcalfe, Creevey & Davies 2015; Bellinger et al. 2017; White et al. 2017; Beck et al. 2018; Li et al. 2018). With the exception of Beck et al. (2018), all of these studies modelled the systems individually and employed the assumption of equal age and initial chemical composition as an a posteriori test. Red giant binaries with one pulsating component are more common (Beck et al. 2014; Themessl et al. 2018). Beck et al. (2014) simultaneously investigated the binary and asteroseismic signals in KIC 5006817 to study the angular momentum and dynamical evolution of that unresolved binary system. The most recent example of combined binary and asteroseismic modelling was carried out for the almost twin δ Sct/γ Dor binary system KIC 10080943 by Schmid & Aerts (2016). In this study, the authors were able to identify multiple g-mode period spacing patterns corresponding to the individual components of the binary and carry out asteroseismic modelling. Furthermore, Schmid & Aerts (2016) enforced equal age in the modelling procedure, rather than as an a posteriori test
This paper is part of a larger extensive study of parameter estimation and stellar model selection, which properly takes into account correlations and degeneracies, of single and binary stars that pulsate in g modes. Here, we take the first steps in developing a methodology which integrates binarity and gravity-mode asteroseismology and show that the incorporation of binary information in asteroseismic modelling changes the solution space and refines the model selection process. We provide a framework for such simultaneous asteroseismic and binary modelling of g-mode pulsators in binaries using isochrones based on Π0 to quantify the extent of near-core mixing attributed to convective core overshooting, as well as the mass and size of the convective core. We do this in the simplest case where the two stars are assumed to have the same initial metallicity, Z = 0.014 and adopt one prescription for the core overshooting, keeping in mind the known degeneracies among those quantities and stellar mass and age. Later studies will consider more complex isochrone construction where the full parameter space covering the most important phenomena needed to interpret the g-mode frequencies as discussed in Aerts et al. (2018) will be taken into account. In Section 2 we discuss the stellar models we computed and in Section 3 we discuss the construction of isochrones and outline our modelling methodology. In Sections 4 and 5 we present applications to three binary systems observed by Kepler and discuss the implications of our integrated modelling approach compared to the case where we treat the binary components as single stars. Finally in Section 6 we summarize the strategy for future work. Our isochrones are made available electronically for use by the community.
2 STELLAR MODELS
To evaluate the binary and asteroseismic properties of our target stars, we construct a grid of stellar evolutionary models, using the open source mesa software (r10108; Paxton et al. 2011, 2013, 2015, 2018). The goal of this grid is to obtain reliable estimates of fundamental stellar parameters, such as the initial mass, the core hydrogen content, the core mass, and the extent of the overshooting region. To adequately assess these quantities, we must consider several model parameters and input physics choices, which are discussed below. To inspect if there is a benefit in joint binary asteroseismic modelling, we establish the necessary lowest possible dimensionality. We hence fix the initial hydrogen and helium fractions (X, Y), as well as the metallicity Z. We do not treat binary evolution in our grid of equilibrium models, but instead assume each star has undergone secular single-star evolution. After our exploration of the benefit of binary asteroseismic modelling, more general model grids for isochrone construction will be considered, as well as applications to g-mode pulsators in EBs and clusters.
2.1 Convection and overshooting
Compared to evolutionary time-scales of stars, convective phenomena are instantaneous. This difference in time-scales allows for a simplification in the implementation of convection in evolution codes. In terms of element transport, it is appropriate to consider the mixing due to convection as instantaneous mixing over a scale distance in regions that satisfy a convection criterion. One of the most widely used implementations of convection in 1D is mixing length theory (MLT) (Böhm-Vitense 1958) and its variations. mesa employs several variations of MLT to model convection (Paxton et al. 2018). Through this formalism, convection is considered to be very efficient mixing with the effective mixing distance being scaled by the parameter αMLT. Recent asteroseismic modelling efforts in intermediate-mass stars have fixed αMLT = 2.0 (Moravveji et al. 2016). Initially, we consider this as the centre point of our grid step in αMLT.
A major limitation of MLT is its inability to predict the behaviour of convective fluid elements at the boundary of a convective region, defined by the Schwarzschild criterion (e.g. Kippenhahn, Weigert & Weiss 2012). Due to their inertia, the convective elements cannot abruptly stop when they move from a convective region to a radiative region. Thus, they ‘overshoot’ the boundary, causing mixing in that transition zone.
Recent asteroseismic modelling by Moravveji et al. (2015, 2016) has shown that a diffusive exponential overshooting better reproduces observed period-spacing patterns of B-type stars of |${\sim }3\, {\rm M_{\odot}}$| compared to a diffusive step overshooting implementation – see also Pedersen et al. (2018) for the capacity of g modes to distinguish these two from mode trapping. Here, we use diffusive exponential overshooting in our grid, taking the values shown in Table 1. While both diffusive overshooting and convective penetration may be simultaneously active in stars, we consider this configuration in future work. Here, we only consider convective overshooting in our models and use it as a proxy for the total amount of CBM with the aim to estimate the convective core mass and size of stars.
| . | Unit . | Lower . | Upper . | Step . |
|---|---|---|---|---|
| M | M⊙ | 1.2 | 10 | 0.1 |
| fov | 0.005 | 0.04 | 0.005 |
| . | Unit . | Lower . | Upper . | Step . |
|---|---|---|---|---|
| M | M⊙ | 1.2 | 10 | 0.1 |
| fov | 0.005 | 0.04 | 0.005 |
| . | Unit . | Lower . | Upper . | Step . |
|---|---|---|---|---|
| M | M⊙ | 1.2 | 10 | 0.1 |
| fov | 0.005 | 0.04 | 0.005 |
| . | Unit . | Lower . | Upper . | Step . |
|---|---|---|---|---|
| M | M⊙ | 1.2 | 10 | 0.1 |
| fov | 0.005 | 0.04 | 0.005 |
Since r10000, mesa has a scheme to robustly determine the convective core boundary, which ensures a continuous temperature gradient from the convective core to the radiative envelope (Paxton et al. 2018). We adopt this predictive mixing scheme in this work. Given that our grid and isochrones are computed for both receding and growing convective cores, we select the Ledoux criterion for convection to account for the chemical gradient present in the case of a shrinking convective core.
2.2 mesa model physics and inlist
Varying the metallicity within a grid of evolutionary tracks introduces the aforementioned degeneracy to modelling: lower metallicity tracks shift to higher temperatures and thus effectively mimic evolutionary tracks produced with higher masses. This causes a near perfect degeneracy between initial mass and metallicity in evolutionary modelling. As such, we fix the metallicity, selected to be the cosmic B-star metallicity Z = 0.014 (Przybilla, Nieva & Butler 2008; Nieva & Przybilla 2012). We fix the initial helium fraction to Y = 0.276 taken from the cosmic B-star solution and solve for initial hydrogen fraction as X = 1 − 0.276 − 0.014. In doing so we fix the mean molecular weight contribution from helium, which would otherwise contribute to the mass-metallicity degeneracy. We enforce that both stars in a system being evaluated have the same initial metallicity, which is a reasonable assumption as the two components of a given system collapse from the same proto-stellar cloud. We choose a mass range that spans 1.2 to 10 M⊙, which covers the mass range where g-mode pulsations are theoretically expected for stars with a convective core. Additionally, we vary the extent of overshooting, fov, to cover the entire range encountered so far from asteroseismic modelling.
Due to the limitations of its parametrized implementation, exponential diffusive overshooting alone was not sufficient to accurately model the observed period spacing patterns of KIC 10526294 and KIC 7760680 (Moravveji et al. 2015, 2016). In both cases, to better reproduce the observations the authors needed to include an additional diffusive mixing term, Dmix, which alters the chemical stratification in the envelope of the star where the period spacing pattern is most sensitive. As this parameter alters the core mass, we are interested in varying this quantity in our grid, but restrict it to less than |$10^3 \, {\rm cm^2\, s^{-1}}$| as Pedersen et al. (2018) have shown that values larger than this wash away the chemical gradient outside of the core and destroy mode trapping which is observed in period-spacing patterns. The contribution of any additional mixing term is implemented as a diffusive coefficient, making it degenerate with Dmix. Thus, we consider Dmix to be a catch-all extra mixing term to be calibrated.
The impact of rotation on seismic modelling cannot be ignored at the level of pulsation mode modelling. Rotation is introduced at the level of the pulsation eigenmode calculations in 3D. Recently, Aerts et al. (2018) have shown that eigenmodes computed with and without the Coriolis force (at 10 per cent critical rotation rate) have differences larger than the observational frequency uncertainty provided by the 4-yr time base of the nominal Kepler Space Telescope (Borucki et al. 2010). Additionally, mesa implements rotationally induced chemical mixing as a diffusive term, which is degenerate with the extra diffusive mixing term Dmix that we already include. As stated previously, since we use Π0 as our seismic diagnostic and do not attempt to model individual mode frequencies, we choose to compute non-rotating hydrostatic-equilibrium stellar evolution models.
As discussed by Aerts et al. (2018), the choice of 1D equilibrium model physics such as opacity, chemical mixture, amongst others, alters seismic modelling. All of our mesa tracks are computed from the Hayashi track, with the fully extended CNO nuclear network option ‘pp_cno_extras_o18_ne22.net’, a simple photosphere, and do not include atomic diffusion. We assume a uniform initial chemical composition, fix the element fraction for the metals to those of Asplund et al. (2009), and use the mesa defaults for the equation-of-state and opacities. We do not include mass loss and only calculate non-rotating models as discussed previously. Additionally, we use the Cox & Giuli (1968) implementation of the MLT for convection and employ the Ledoux criterion for convective stability combined with the new predictive mixing scheme in mesa. Our base inlist is posted in the mesa Marketplace: http://cococubed.asu.edu/mesa_market/inlists.html.
2.3 Seismic diagnostic
Our seismic diagnostic is applied in the form of the asymptotic period spacing Π0 (equation 1), which can be computed directly from the mesa models. As previously discussed, Π0 is sensitive to any process that has an impact on the Brunt-Väisälä frequency. As such, we are interested in probing convective-core overshooting, αMLT, and additional mixing in our grid.
The g modes are sensitive to the mass and radius of the convective core, which depend on the age and mass of the star, and overshooting, which directly alters the core mass. The traditionally defined convective core radius is not altered by the diffusive exponential overshooting description since the thermal structure of the star is not altered. One can re-define the radius, and hence mass, of the core to lie at the boundary of the overshooting region, as was done by CT16 and CT17. However we define the core as at the position of the Schwarzschild boundary. Hence, the core mass will still account for the influx of mass due to near-core mixing as the star evolves. The sensitivity of Π0 to αMLT and Dmix is less obvious. Table 2 lists the difference in Π0 for different parameter combinations at different combinations of masses and Xc compared to a baseline. This table clearly demonstrates that constraining αMLT and Dmix only becomes possible by modelling the observed trapping properties of individual modes. Following this, we only investigate fov in our calculations, leaving αMLT and Dmix as nuisance parameters which can be fixed or marginalized over.
Differences in Π0 from one parameter combination to a baseline at fixed masses, and XC combinations. Baseline denoted by an asterisk (*).
| |${{\rm M}\, [{\rm M}_{\odot }]}$| . | XC . | Zini . | αMLT . | fov . | |$\log D_{\rm mix}$| . | |$\delta \Pi _{0}\, {\rm [s]}$| . |
|---|---|---|---|---|---|---|
| . | . | . | . | . | |${\rm [cm^2 \, s^{-1}]}$| . | . |
| 1.5 | 0.70 | 0.0140 | 2.0 | 0.0200 | 1.0 | 0* |
| 1.5 | 0.70 | 0.0140 | 2.0 | 0.0250 | 1.0 | 20 |
| 1.5 | 0.70 | 0.0140 | 1.8 | 0.0200 | 1.0 | 2 |
| 1.5 | 0.70 | 0.0140 | 2.0 | 0.0200 | 1.5 | 11 |
| 4.5 | 0.70 | 0.0140 | 2.0 | 0.0200 | 1.0 | 0* |
| 4.5 | 0.70 | 0.0140 | 2.0 | 0.0250 | 1.0 | 2 |
| 4.5 | 0.70 | 0.0140 | 1.8 | 0.0200 | 1.0 | 1 |
| 4.5 | 0.70 | 0.0140 | 2.0 | 0.0200 | 1.5 | 2 |
| 9.0 | 0.70 | 0.0140 | 2.0 | 0.0200 | 1.0 | 0* |
| 9.0 | 0.70 | 0.0140 | 2.0 | 0.0250 | 1.0 | 5 |
| 9.0 | 0.70 | 0.0140 | 1.8 | 0.0200 | 1.0 | 0 |
| 9.0 | 0.70 | 0.0140 | 2.0 | 0.0200 | 1.5 | 3 |
| 1.5 | 0.30 | 0.0140 | 2.0 | 0.0200 | 1.0 | 0* |
| 1.5 | 0.30 | 0.0140 | 2.0 | 0.0250 | 1.0 | 51 |
| 1.5 | 0.30 | 0.0140 | 1.8 | 0.0200 | 1.0 | 30 |
| 1.5 | 0.30 | 0.0140 | 2.0 | 0.0200 | 1.5 | 15 |
| 4.5 | 0.30 | 0.0140 | 2.0 | 0.0200 | 1.0 | 0* |
| 4.5 | 0.30 | 0.0140 | 2.0 | 0.0250 | 1.0 | 127 |
| 4.5 | 0.30 | 0.0140 | 1.8 | 0.0200 | 1.0 | 10 |
| 4.5 | 0.30 | 0.0140 | 2.0 | 0.0200 | 1.5 | 59 |
| 9.0 | 0.30 | 0.0140 | 2.0 | 0.0200 | 1.0 | 0* |
| 9.0 | 0.30 | 0.0140 | 2.0 | 0.0250 | 1.0 | 202 |
| 9.0 | 0.30 | 0.0140 | 1.8 | 0.0200 | 1.0 | 4 |
| 9.0 | 0.30 | 0.0140 | 2.0 | 0.0200 | 1.5 | 6 |
| 1.5 | 0.05 | 0.0140 | 2.0 | 0.0200 | 1.0 | 0* |
| 1.5 | 0.05 | 0.0140 | 2.0 | 0.0250 | 1.0 | 54 |
| 1.5 | 0.05 | 0.0140 | 1.8 | 0.0200 | 1.0 | 1 |
| 1.5 | 0.05 | 0.0140 | 2.0 | 0.0200 | 1.5 | 14 |
| 4.5 | 0.05 | 0.0140 | 2.0 | 0.0200 | 1.0 | 0* |
| 4.5 | 0.05 | 0.0140 | 2.0 | 0.0250 | 1.0 | 166 |
| 4.5 | 0.05 | 0.0140 | 1.8 | 0.0200 | 1.0 | 6 |
| 4.5 | 0.05 | 0.0140 | 2.0 | 0.0200 | 1.5 | 70 |
| 9.0 | 0.05 | 0.0140 | 2.0 | 0.0200 | 1.0 | 0* |
| 9.0 | 0.05 | 0.0140 | 2.0 | 0.0250 | 1.0 | 296 |
| 9.0 | 0.05 | 0.0140 | 1.8 | 0.0200 | 1.0 | 2 |
| 9.0 | 0.05 | 0.0140 | 2.0 | 0.0200 | 1.5 | 11 |
3 METHODS
In this section we outline our methodology for isochrone construction and selection of valid models for seismic evaluation according to the equal age and initial chemical composition constraints and mass ratio enforced by binarity, while allowing for differing model parameters for the primary and secondary components.
3.1 Isochrone construction
After constructing our grid with parameters as defined in Table 1, we build isochrones according to Dotter (2016). This methodology involves two steps. In the first step, in every evolutionary track we identify the main phases of evolution from Pre-MS (PMS) to zero-age MS (ZAMS), ZAMS to middle-age MS (MAMS), MAMS to TAMS, and TAMS to the onset of core helium burning (RGBhb). From there, we identify n equidistantly spaced steps between any two main evolutionary phases according to a weighting function accounting for the change in log Teff, log g, log Tc, and other quantities. The tracks are then interpolated to these points to create equivalent evolutionary phase (EEP) tracks. In the second step, we simply loop over a given EEP point in all tracks to construct a monotonic mass-age relationship. From this relationship, we then build our isochrones by interpolating in all quantities that we are interested in, using mass as the independent variable. For an elaborate discussion and detailed testing of this method, we refer the reader to Dotter (2016) and Choi et al. (2016).
Traditionally, an isochrone at a given age τ is constructed from evolutionary tracks that were all computed with the same input physics and equal free parameters, i.e. with the same Θiso=(Zini, αMLT, fov, Dmix, τ). However, changing the core overshooting in a model alters the evolutionary tracks, and hence, the isochrones constructed from these tracks. Fig. 1 highlights the difference in isochrones (solid black lines) constructed from tracks with fov = 0.005 (right-most isochrone) and fov = 0.040 (left-most isochrone), constructed from the solid grey tracks and dashed grey tracks, respectively. These two limiting values of fov result from asteroseismology of various pulsators (Briquet et al. 2007; Moravveji et al. 2015, 2016; Buysschaert et al. 2018). If one were to use isochrones constructed with only one set of parameter combination, they would artificially restrict the solution to a singular region of the parameter space, or potentially drive their solution space to an unrealistic range. Instead, we introduce the concept of an isochrone-cloud (hereafter isocloud), i.e. the collection of all isochrones (created from all combinations of Zini, αMLT, fov, Dmix) calculated at a given age τ, given by: Θcloud = (Zini, αMLT–i, fov–j, Dmix–k, τ), where i, j, and k denote the different possible values of αMLT, fov, and Dmix, respectively. An example isocloud for fixed αMLT, and Dmix at a given age can be seen in Fig. 1 as the area spanned in red. We note that this region falls between the two extreme cases for the traditional isochrones. We provide our isochrone-clouds to the community on VizieR.1
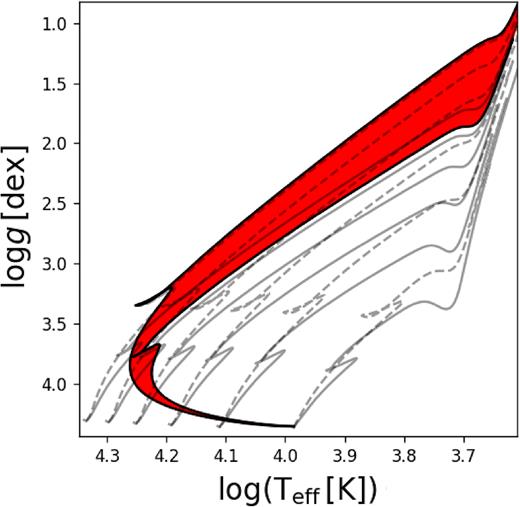
Example evolutionary tracks (grey solid and dashed lines), isochrones (black solid lines), and isocloud (red region). All evolutionary tracks are computed with Zini = 0.014 and αMLT = 2.0. Evolutionary tracks range from 2 to 7 M⊙ with fov = 0.005 (solid grey lines) and fov = 0.040 (dashed grey lines).
3.2 Forward modelling scheme
Aerts et al. (2018) proposed a scheme for the forward seismic modelling of g-mode pulsators with a convective core that accounts for the degeneracies produced by combinations of varied free parameters in the modelling process. This work has recently been employed by Mombarg et al. (in preparation) who use Teff, log g, and Π0 to estimate the age, mass, core mass, and core overshooting of γ Dor stars after estimation of the near-core rotation rate by Van Reeth et al. (2016).
Here, we adopt the same framework to estimate stellar parameters, but extend it to include binary information. This binary information comes in the form of equal age and initial chemical composition, the effective temperature and surface gravity of the secondary, as well as information on the component masses and radii. In the case of an EB or heartbeat star (Welsh et al. 2011; Thompson et al. 2012), this comes in the form of direct estimates of dynamical masses and radii from binary modelling. However, in the case of a SB2, binary modelling only yields estimates of the mass and radii ratios to be applied to our modelling scheme. We thus assume that the near-core rotation rate has been deduced from the data, allowing us to derive Π0 from the observed period spacing pattern.
3.3 Hare-and-hound
To test the methodology, we perform a hare-and-hound exercise, where the hare was computed from mesa using the input parameters listed in the top portion of Table 3. The system is evaluated at an age of 59.7 Myr, resulting in the parameters seen in the bottom half of Table 3. To simulate realistic observational errors for an SB2, we assume symmetric uncertainties of 200 K on Teff for both stars, 300 s on Π0, 0.01 on the mass ratio, and 0.05 on the radii ratio.
| Parameter . | Primary . | Secondary . |
|---|---|---|
| |${M\, [{\rm M}_{\odot }]}$| | 5.40 | 3.83 |
| Zini | 0.0135 | 0.0135 |
| αMLT | 2.10 | 1.95 |
| fov | 0.025 | 0.010 |
| |$D_{\mathrm{mix}}\, \mathrm{[cm^2\, s^{-1}]}$| | 20 | 15 |
| |${T_{\rm eff}\, {\rm [K]}}$| | 16700 | 14450 |
| |$\log g\, \mathrm{[dex]}$| | 3.91 | 4.19 |
| |${R\, {\rm [R_{\odot }]}}$| | 4.274 | 2.595 |
| |$\Omega _{\mathrm{rot}}\, \mathrm{[d^{-1}]}$| | 0.54 | – |
| |$\mathrm{Age\, [Myr]}$| | 59.7 | 59.7 |
| Xc | 0.342 | 0.558 |
| |$\mathrm{\Delta \Pi \, [d^{-1}]}$| | 0.129 | 0.103 |
| |${M_{\rm cc}\, [{\rm M}_{\odot }]}$| | 0.97 | 0.76 |
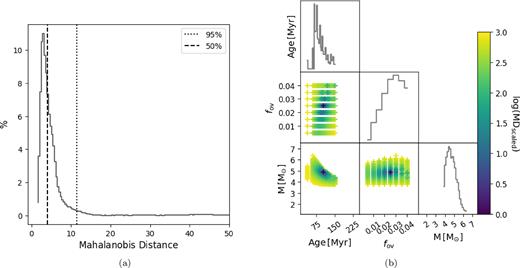
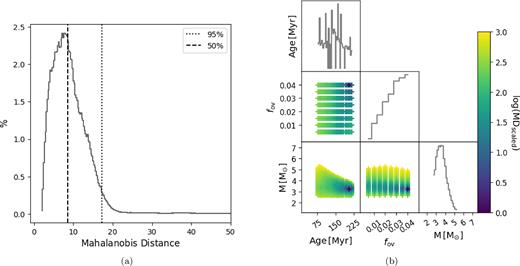
The results of treating the hare as a single star and as the primary of an SB2 system can be seen in Figs 2 and 3. Fig. 2(a) shows the MD evaluations for each grid point. The vertical dotted line represents the 95th percentile and the dashed line represents the 50th percentile. Fig. 2(b) shows the correlation structure for the components of the θ vector for all grid points with an MD below the 50th percentile cutoff. The binned distributions along the diagonal are projections of each component in θ on to one dimension. The colour represents the MD where all distances have been re-scaled between 1 and 1000 for ease of comparison across systems and cases. Since the MD is an MLE point estimator, we report the grid point with the lowest MD as the best model, where the MLE lower and upper bounds are taken as the minimum and maximum value of the parameter space within the 50th percentile (inter-quantile) cutoff, as listed in Table 4. We are interested in other astrophysical quantities such as Mcc, the radius R, core hydrogen content Xc, and radial location of the overshoot region Rov. However, since these quantities are not model input parameters in θ, but rather are output of a given model, we list their values corresponding to the best model without corresponding MLE bounds.
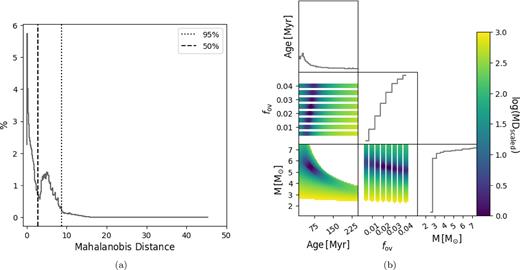
MD distribution (left) and 50th inter-quartile ranges (right) for the primary of the hare-and-hound exercise using a single-star evaluation. All points in the correlation plots are colour coded according their rescaled MD. Diagonal plots are binned parameter distributions.
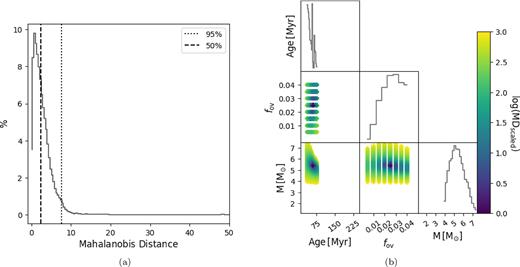
Same as Fig. 2 but for the SB2 evaluation of the hare-and-hound exercise.
| . | Parameter . | Primary . | Secondary . |
|---|---|---|---|
| Single | |$\mathrm{Age\, [Myr}]$| | 61 (0, 1593) | |
| fov | 0.025 (0.005, 0.04) | – | |
| |${M\, [{\rm M}_{\odot }]}$| | 5.4 (2.2, 9.9) | – | |
| |${R\, \rm [R_{\odot }]}$| | 4.31 | – | |
| |${M_{\rm cc}\, [{\rm M}_{\odot }]}$| | 0.97 | – | |
| |${{R}_{\rm cc}\, [{\rm R}_{\odot }]}$| | 0.50 | – | |
| Xc | 0.34 | – | |
| SB2 | |$\mathrm{Age\, [Myr}]$| | 63 (38, 78) | |
| fov | 0.025 (0.005, 0.04) | 0.020 (0.005, 0.04) | |
| |${M\, [{\rm M}_{\odot }]}$| | 5.37 (3.86, 7.48) | 3.80 (2.58, 5.91) | |
| |${R\, [{\rm R}_{\odot }]}$| | 4.33 | 2.57 | |
| |${M_{\rm cc}\, [{\rm M}_{\odot }]}$| | 0.96 | 0.78 | |
| |${R_{\rm cc}\, [{\rm R}_{\odot }]}$| | 0.49 | 0.39 | |
| Xc | 0.34 | 0.58 | |
In this example we can see that the binary evaluation greatly reduces the parameter space compared to the single-star evaluation. Furthermore, we can see that in both cases, the best models agree well with the input.
4 Kepler SAMPLE
We apply our methodology to three g-mode pulsating stars observed with Kepler. All targets are binary systems with at least one g-mode pulsating component with an estimate of Π0, as measured according to Van Reeth et al. (2016), which have been previously studied in the literature (Pápics et al. 2013, 2017; Schmid et al. 2015; Schmid & Aerts 2016). The relevant spectroscopic and binary parameters are listed in Table 5. The three systems are plotted in a Kiel diagram in Fig. 4.
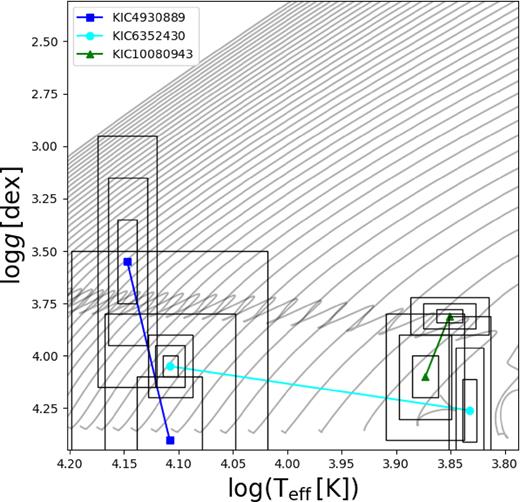
Spectroscopic parameters for target binaries plotted over evolutionary tracks. Tracks computed with |$Z_{\rm ini}=0.014,\, \alpha _{\rm MLT}=2.0,\, f_{\rm ov}=0.015,\, D_{\rm mix}=10 \, {\rm cm^2\, s^{-1}}$|.
Measured spectroscopic, binary, and asteroseismic parameters for Kepler targets.
| Parameter . | KIC 4930889 . | KIC 6352430 . | KIC 10080943 . | |||
|---|---|---|---|---|---|---|
| |${T_{\rm eff} \, {\rm [K]}}$| | 14020 ± 280 | 12820 ± 900 | 12810 ± 200 | 6805 ± 100 | 7150 ± 250 | 7640 ± 240 |
| |$\log g \, \mathrm{[dex]}$| | 3.55 ± 0.24 | 4.38 ± 0.10 | 4.05 ± 0.05 | 4.26 ± 0.15 | 3.81 ± 0.03 | 4.10 ± 0.10 |
| |${\rm \Pi _0 \, [s]}$| | 8712 ± 320 | – | 6944 ± 900 | – | 3984 ± 38 | 4108 ± 51 |
| |$q\, \left[ \frac{M_2}{M_1} \right]$| | 0.77 ± 0.09 | 0.44 ± 0.03 | 0.9598 ± 0.0007 | |||
| Porb[d] | 18.296 ± 0.002 | 26.551 ± 0.019 | 13.3364 ± 0.0003 | |||
| e | 0.32 ± 0.02 | 0.371 ± 0.003 | 0.449 ± 0.005 | |||
4.1 KIC 4930889
KIC 4930889 was found to be an SB2 system and was characterized by Pápics et al. (2017) as consisting of a B5 IV-V primary and B8 IV-V secondary. Their orbital and spectral analysis placed both components in the iron-bump theoretical instability strip for g modes in SPB stars. Their spectroscopic solution places the secondary as more evolved than the primary, which is an unphysical configuration unless binary evolution has altered the evolution of this system. We therefore revisit and re-normalized the original 26 spectra obtained by Pápics et al. (2017), and derive a new spectroscopic solution, which is presented in Table 5. This new solution reports a much lower surface gravity for the primary and a much higher surface gravity for the secondary compared to the original solution reported by Pápics et al. (2017). However the newly returned radii ratio (|$\mathcal {R}=0.76$|) is consistent with evolutionary expectations. Additionally, the effective temperatures of both component are lower by ∼800 K compared to the solution of Pápics et al. (2017). Seismic modelling of this system has not been performed so far.
Pápics et al. (2017) report 297 significant frequencies in the 4-yr Kepler light curve after filtering for close peaks and low-order combinations. From this list of 297 frequencies, the authors identify three separate period-spacing patterns (figs 15 and 16 from Pápics et al. 2017). The first pattern consists of 20 consecutive radial orders and reveals a mean rotational frequency of |$f_{\rm rot}=0.74\pm 0.01 \, {\rm d^{-1}}$|, following the method of Van Reeth et al. (2016). The slope of this pattern reveals it to consist of dipole prograde modes, leading to Π0 = 8712 ± 320 s. The second and third patterns are consistent with retrograde modes, but could not unambiguously be assigned a degree or component from which they originate.
Figs 5 and 6 show the distributions of estimated parameters and their correlations. We find that the parameter estimates derived from the single-star solution and the SB2 solution largely agree within their errors. While the best model returned by the binary evaluation is less massive by |$0.28 \, {\rm M_{\odot}}$| compared to the single-star case, the convective core mass and location of the overshooting zone have very good agreement between the single and binary evaluations. This is due to the fact that the seismic diagnostic Π0 is strongly sensitive to the convective core mass. We note that the binary case greatly reduces both the mass-age and mass-overshoot degeneracies, which can be seen by comparing Figs 5(a) and 6(b). The binary constraints restrict the possible masses that can be considered valid at a given age, effectively lifting the degeneracy between the parameters. This propagates into the mass-overshoot degeneracy as the mass range is restricted. As the best solution, our analysis returns a system with age of 103 Myr consisting of a |${\rm 4.89^{+1.49 }_{ -1.09} \, \, M_{\odot}}$| primary with a |${\rm 0.54 \, M_{\odot}}$| convective core and a |${\rm 3.47^{+1.4 }_{ -0.57} \, \, M_{\odot}}$| secondary with a |${\rm 0.60 \, \, M_{\odot}}$| convective core near the ZAMS. Finally, as an a posteriori check, the mass ratio of the best model agrees with the value listed in Table 5 within 1σ.
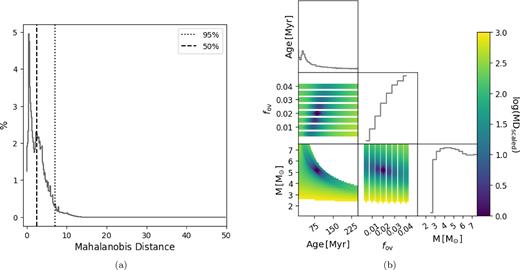
Same as Fig. 2 but for the single-star evaluation of KIC 4930889 A.
4.2 KIC 6352430
KIC 6352430 is a close (|${P_{\rm orb}=26.551\, {\rm d}}$|) eccentric (e = 0.37) SB2 system consisting of a B7 V primary (KIC 6352430A) and F2.5 V secondary (KIC 6352430B) and was observed by Kepler over 1459.5 d (Pápics et al. 2013). While some slight ellipsoidal variability was detected, the authors concluded that the remaining signal seen in the light curve could be explained by g modes excited via the κ-mechanism. Later analysis by Pápics et al. (2017) revealed 584 significant frequencies after cleaning for close peaks and low-order combination frequencies, from which a single sloped period-spacing pattern was identified consisting of 24 radial orders. The mean asymptotic period spacing and slope of the pattern identify it as SPB dipole prograde modes originating from the primary component, as much lower values are expected for the asymptotic dipole period spacing value in γ Dor stars (Pápics et al. 2017 versus Van Reeth et al. 2015). Spectroscopic and orbital values taken from Pápics et al. (2013) are listed in Table 5. This system has not been the subject of modelling efforts to date.
Figs 7 and 8 and Table 6 show the results for the modelling of KIC 6352430. As in the case of KIC 4930889, the estimates derived for the binary case are much more precise than that of the single-star case, and agree within the errors of the single-star solution. While the stellar mass and convective core mass agree across both the single-star and binary evaluation cases, the MLE errors show that we do not have the capacity to estimate overshooting. This suggests that the core mass rather than the extent and shape of overshooting is the important astrophysical quantity (Constantino & Baraffe 2018). We can see that the correlation between mass and overshoot that is present in the single-star correlation plots (Fig. 7b) has been effectively lifted in the binary case. The binary solution reveals a system with an age of 205 Myr consisting of a |${\rm 3.23^{+1.98}_{-0.56} \, \, M_{\odot}}$| primary with a |${\rm 0.56 \, \, M_{\odot}}$| convective core and a |${\rm 1.34^{+0.68}_{-0.14} \, M_{\odot}}$| secondary with a |${\rm 0.08 \, M_{\odot}}$| convective core. The best estimated masses agree with the mass ratio reported in Table 5 to within 1σ.
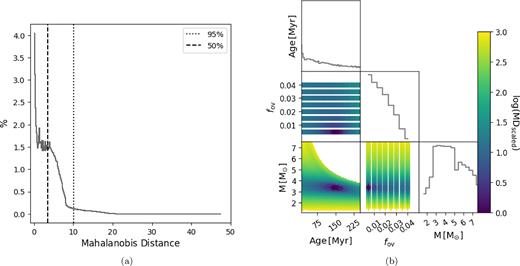
Same as Fig. 2 but for the single-star evaluation of KIC 6352430 A.
Maximum likelihood estimates (half inter-quartile range) of the model parameters for three Kepler binaries. Values reported with no lower and upper values are taken from the best model. Top panel is for single-star solution. Middle panel is for SB2 solution. Bottom panel is for heartbeat star solution where applicable.
| Case . | Parameter . | KIC 4930889 . | KIC 6352430 . | KIC 10080943 . | |||
|---|---|---|---|---|---|---|---|
| Age [Myr] | 85 (0, 2000) | – | 140 (0, 2000) | – | 1446 (0, 2500) | – | |
| fov | 0.02 (0.005, 0.04) | – | 0.005 (–, 0.04) | – | 0.010 (0.005, 0.04) | – | |
| M [M⊙] | 5.2 (2.4, 7.0) | – | 3.4 (1.5, 8.9) | – | 1.7 (1.2, 9.7) | – | |
| Single | R [R⊙] | 6.39 | – | 2.91 | – | 2.66 | – |
| Mcc [M⊙] | 0.58 | – | 0.51 | – | 0.096 | – | |
| Rov [R⊙] | 0.37 | – | 0.31 | – | 0.103 | – | |
| Xc | 0.06 | – | 0.38 | – | 0.006 | – | |
| Age [Myr] | 103 (38, 150) | 205 (78, 215) | 1440 (700, 1500) | ||||
| fov | 0.025 (0.005, 0.04) | 0.005 (–, 0.04) | 0.04 (0.005, –) | 0.005 (–, 0.04) | 0.04 (0.005, –) | 0.04 (0.005, –) | |
| M [M⊙] | 4.89 (3.80, 6.38) | 3.47 (2.9, 4.87) | 3.23 (2.67, 5.21) | 1.34 (1.2, 2.02) | 1.71 (1.26, 2.31) | 1.56 (1.25, 2.21) | |
| SB2 | R [R⊙] | 6.72 | 2.65 | 3.01 | 1.42 | 2.56 | 1.79 |
| Mcc [M⊙] | 0.54 | 0.60 | 0.56 | 0.08 | 0.19 | 0.18 | |
| Rov [R⊙] | 0.35 | 0.33 | 0.34 | 0.11 | 0.17 | 0.17 | |
| Xc | 0.05 | 0.48 | 0.42 | 0.55 | 0.28 | 0.46 | |
| Age [Myr] | – | – | 890 (700, 1500) | ||||
| fov | – | – | – | – | 0.01 (0.005, 0.04) | 0.005 (–, 0.04) | |
| M [M⊙] | – | – | – | – | 1.99 (1.50, 2.36) | 1.85 (1.40, 2.26) | |
| Heartbeat star | R [R⊙] | – | – | – | – | 3.11 | 2.39 |
| Mcc [M⊙] | – | – | – | – | 0.15 | 0.17 | |
| Rov [R⊙] | – | – | – | – | 0.14 | 0.15 | |
| Xc | – | – | – | – | 0.06 | 0.21 | |
4.3 KIC 10080943
KIC 10080943 was the first system with two g-mode pulsating δ Sct/γ Dor components, each of which were observed to have multiple pulsation patterns, for which binary modelling could be performed to obtain independent estimates for the component masses and radii from modelling the periastron brightening as KIC 10080943 is a heartbeat star system (Keen et al. 2015; Schmid et al. 2015; Schmid & Aerts 2016). In addition to identifying multiple patterns in each component, for both p and g modes, Schmid & Aerts (2016) were able to derive surface-to-core rotation rate estimates and an independent age estimate from binary modelling. For our purposes, we take the values of Teff, log g, M1, 2, and R1, 2 from the binary modelling performed by Schmid et al. (2015) and the estimates of Π0 from the analysis of Schmid & Aerts (2016), all of which are listed in Table 5.
Given the characterization of this system, we can test how the application of different information in the modelling impacts our results. We find that the single-star and SB2 evaluation largely agree except for the overshoot and Xc returned by the best model for each case. The application of mass and radius estimates to the modelling procedure results in yet again different mass, age, and overshoot estimates for the best model. Again, we see that we have no capacity to provide MLE estimates of fov. We find approximate agreement between Mcc for all cases.
The difference in solution between the SB2 and heartbeat star cases is caused by the use of the radii ratio in SB2 case versus individual radii in the heartbeat star case. Since KIC 10080943 comprised two nearly identical stars, the application of the mass ratio and radii ratio does not provide any new information or strong constraints. Additionally, the covariance structure inherently changes between individual evolutionary tracks and the isoclouds, which produces the differences between the single-star and SB2 solutions. However, applying the absolute mass and radii estimates provides sufficient constraints to improve the solution. The best model from the heartbeat star evaluation reports a system with an age of |$890^{+610}_{-190}$| Myr consisting of a |$1.99^{+0.37}_{-0.49} \, \, {\rm M_{\odot}}$| primary with an |$0.15 \, {\rm M_{\odot}}$| convective core and a |$1.85^{+0.41}_{-0.45} \, \, {\rm M_{\odot}}$| secondary with an |$0.17 \, {\rm M_{\odot}}$| convective core.
Of the six models that Schmid & Aerts (2016) reported for KIC 10080943, we are interested in comparing Models 4 and 6 to our result. Model 4 corresponds to the solution from modelling the individual g-mode periods for both components accounting for the effect of rotation on pulsations using the Traditional Approximation of Rotation (TAR; Townsend 2003; Townsend & Teitler 2013). Model 6 corresponds to the solution from modelling the overall morphology of the g-mode period spacing pattern, while again accounting for rotation using the TAR. In both models, the diffusive exponential description of overshooting was used. Schmid & Aerts (2016) only enforced an equal age constraint in their modelling and employ a χ2 evaluation using only the individual g modes (per star) in model 4 and the g-mode period spacing pattern (per star) in model 6. Our single-star and SB2 solutions share approximate agreement with both model 4 and model 6 from Schmid & Aerts (2016). Our heartbeat star solution, which includes the mass ratio, absolute masses and radii, as well as the spectroscopic quantities, does not agree with either model 4 or model 6 from Schmid & Aerts (2016). Due to the differences in the modelling methodology, we suggest caution at making a direct comparison between the two results.
5 DISCUSSION
Understanding the degeneracy between stellar mass, age, and extent of core overshooting is pivotal for asteroseismic modelling. The single-star case evaluates Π0, Teff, and log g, all of which depend on a star’s mass, age, and core mass. In the binary cases, our methodology imposes a strict range of ages at which a solution is valid. Since Π0 varies with mass and age, by constraining the valid age range, we also constrain the masses at which a given Π0 can be considered a valid solution. In the SB2 case, the mass ratio (when sufficiently far from unity) drives the selection of stellar masses and core masses towards those combinations which satisfy the value of Π0, which is already constrained by the valid age range. In the heartbeat star case, the addition of absolute masses and radii fixes the stellar masses to be considered in the valid age range, leaving only the extent of core overshooting to influence the mass of the core, and thus Π0. While this is the most constrained case, the addition of the radii ratio in the SB2 case enables a cross-constraint on the evolution as well, constraining the mass-age-overshooting degeneracy to a manageable extent.
This work shows that the application of additional information derived from binarity significantly improves the results of extracted parameters and their uncertainties due to the independent cross-constrains that binary information provides. In particular, it is seen that for each system that the single-star case has discrepant mass and age estimates compared to the SB2 case. Given the transformation of basis from age to mass for the isoclouds, the restricted age range imposed by the binary methodology corresponds to a restricted age range and thus shifts the best age and mass extracted by our methodology. This comparison of single- to binary-star solutions reveals the hierarchy of what results to take as robust, and which to reference with caution. The binary constraints render some single-star configurations impossible, allowing the precision of the seismic diagnostic to take full effect. We note that the inclusion of absolute mass and radius estimates only becomes important in the case where both stars are similar, with a mass ratio near unity. In the case that the components of a binary are sufficiently different in mass, the inclusion of mass and radii ratios as well as the spectroscopic quantities of the secondary are sufficient to improve the model selection and parameter estimation.
No clear trend emerges between mass and overshoot for this sample. Even accounting for the small sample, we do not encounter the same mass dependence of overshooting as seen by CT16, CT17, and CT18. Even with the addition of the asteroseismic diagnostic, we recover the entire input range of overshooting as the uncertainty on its estimates. However, we do find consistent estimates of the convective core mass and location of the overshooting region (cf. Miglio et al. 2008; Constantino & Baraffe 2018). Several overshoot values can satisfy the observations of a given target in the single-star seismic case, as seen in the correlation plots in Figs 5(b), 7(b), and 9(b). We are able to remove this correlation structure by simultaneously applying asteroseismic and binary constraints, as seen in the correlation plots in Figs 6(b), 8(b), 10(b), and 11(b). This leads to a unique determination of the stellar age and mass as seen by comparing the single and binary cases in Table 6.
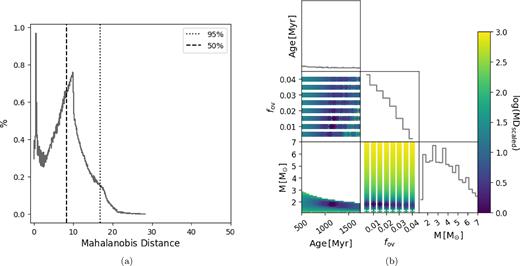
Same as Fig. 2 but for the single-star evaluation of KIC 10080943 A.
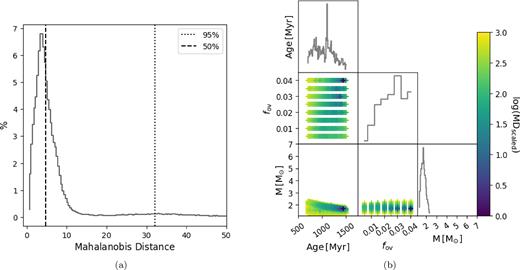
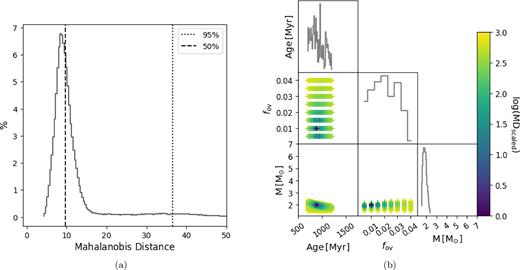
Same as Fig. 2 but for the heartbeat star evaluation of KIC 10080943 A.
6 SUMMARY AND CONCLUSIONS
In this work we have formulated a framework for the modelling of g-mode pulsating stars in binary systems and applied it to three systems KIC 4930889, KIC 6352430, and KIC 10080943 (Pápics et al. 2013, 2017; Schmid et al. 2015; Schmid & Aerts 2016). We calculated a grid of stellar evolution tracks using mesa spanning a wide range of stellar masses and extents of core overshooting using the diffusive exponential overshooting description. We fixed Zini, αMLT, and Dmix after investigating the sensitivity of our observations to our grid of models. To carry out our modelling, we followed the approach discussed in detail by Aerts et al. (2018).
To apply binary constraints and allow both components of a binary system to have a different amount of internal mixing, we introduced the concept of an iso(chrone-)cloud where the two components are only evaluated within the same isocloud. We modelled the three systems considering first the pulsating primary as single with the seismic diagnostic Π0, then introduced the binary information in the form of age constraints, mass and radii ratios (KIC 4930889, KIC 6352430, KIC 10080943), and absolute masses and radii (KIC 10080943).
The addition of binary information proved useful for reducing the uncertainties on parameter estimates and reducing the correlation between model parameters. Comparison of the MLE estimates derived by the MD calculations did not reveal any obvious dependence of overshooting with mass or age. Most interestingly, we did not recover the traditional binary mass discrepancy in our results. This is likely due to the fact that even in our most constrained case (KIC 10080943) we do not have one per cent-level relative precision on the mass and radius estimates from binary modelling. In the future, systems with the necessarily high precision on mass and radius estimates need to be scrutinized to determine if the mass discrepancy persists with the inclusion of asteroseismic information in the modelling procedure.
In this work, we do not include any possible effects of binary evolution or tidal effects on pulsations in our modelling. It has already been established for KIC 10080943 that rotation has a much larger impact than the tidal interaction (Schmid & Aerts 2016), and as both KIC 4930889 and KIC 6352430 have longer orbital periods and smaller mass ratios, the tide generating potential in these systems is smaller than that of KIC 10080943. The addition of more or longer period-spacing patterns in the determination of Π0 can aid in the improvement of the relative precision of this parameter and would thus improve the derived parameters compared to the results of this work.
The methodology presented here can be extended to full modelling of g-mode period spacing patterns. Our isocloud evaluation methodology provides a robust framework for investigating the overall internal mixing in binary stars – core overshooting as well as rotational or envelope mixing. Our methodology is also relevant for isochrone fitting of stellar populations such as clusters, where both Dov and Dmin should be allowed to vary from star to star. Application of this methodology to samples of EBs and clusters can provide insight into internal mixing phenomena at various ages and metallicities. Furthermore, the flexibility of this method allows for the easy inclusion of seismic information to impose an independent calibration of such phenomena, should it become available. Future modelling will investigate whether or not the core mass and extent of overshooting for single stars differs from those stars in binary systems, as this would indicate the impact of tidal forces and/or binary evolution. The recently launched NASA tess mission (Ricker et al. 2015) and the future ESA PLATO missions (Rauer et al. 2014) promise to deliver high-quality observations of thousands of new g-mode pulsators with sufficiently high precision on Π0 for stars in binaries and clusters (only in the continuous viewing zones for TESS), all of which will be suitable for analysis under the methodology put forth here. After their future release (2021 +), the addition of Gaia astrometric binary solutions for non-EB systems will enable the application of direct mass estimates in this methodology, instead of using only the mass ratios as was done for the SB2 systems here (Lindegren et al. 2018).
ACKNOWLEDGEMENTS
The authors thank the referee for his/her/their comments and suggestions towards improving the manuscript. The research leading to these results has received funding from the European Research Council (ERC) under the European Union’s Horizon 2020 research and innovation programme (grant agreement N°670519: MAMSIE). The computational resources and services used in this work were provided by the VSC (Flemish Supercomputer Center), funded by the Research Foundation - Flanders (FWO) and the Flemish Government - department EWI.
Footnotes
REFERENCES
APPENDIX A: SECONDARY COMPONENT PARAMETER CORRELATION PLOTS
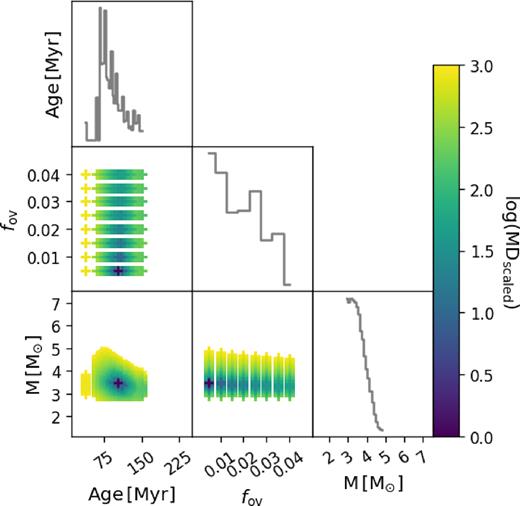
Same as Fig. 2(b) but for the SB2 evaluation of KIC 4930889 B.
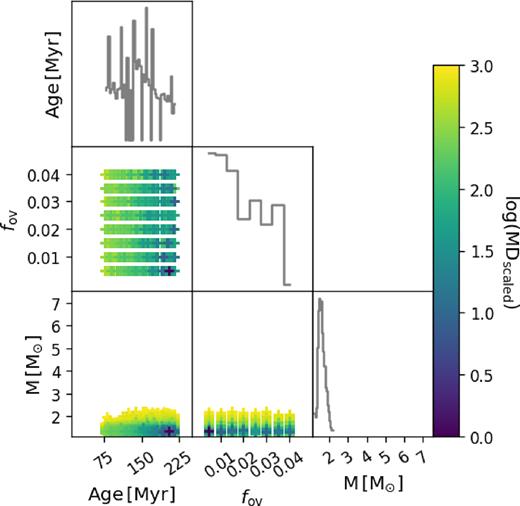
Same as Fig. 2(b) but for the SB2 evaluation of KIC 6352430 B.
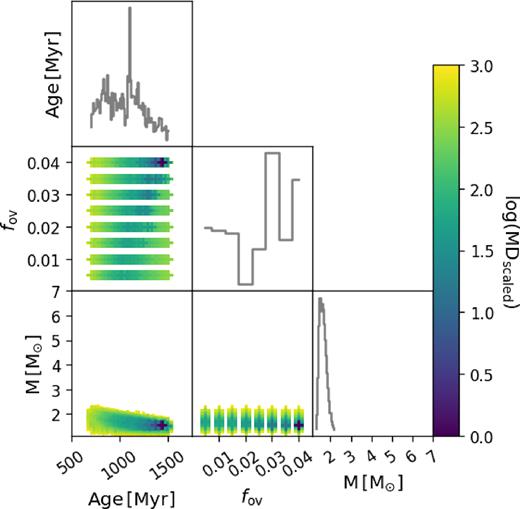
Same as Fig. 2(b) but for the SB2 evaluation of KIC 10080943 B.
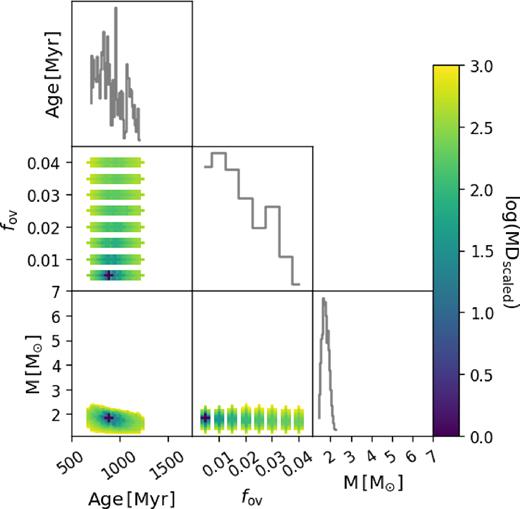
Same as Fig. 2(b) but for the heartbeat star evaluation of KIC 10080943 B.


