


ABSTRACT
In this paper, we present the astrophotometric catalogues of 56 globular clusters and one open cluster. Astrometry and photometry are mainly based on images collected within the ‘HST Legacy Survey of Galactic Globular Clusters: Shedding UV Light on Their Populations and Formation’ (GO-13297, PI: Piotto), and the ‘ACS Survey of Galactic Globular Clusters’ (GO-10775, PI: Sarajedini). For each source in the catalogues for which we have reliable proper motion, we also publish a membership probability for separation of field and cluster stars. These new catalogues, which we make public in Mikulski Archive for Space Telescopes, replace previous catalogues by Paper VIII of this series.
1 INTRODUCTION
Nowadays the presence of multiple stellar populations (MPs) in globular clusters (GCs) is a commonly accepted observational fact, even though our understanding of their origin is still far from satisfying (Bastian 2015; Renzini et al. 2015; Bastian & Lardo 2018). The ‘HST Legacy Survey of Galactic Globular Clusters: Shedding UV Light on Their Populations and Formation’ (GO-13297, PI: Piotto) observations, combined with the optical data from the ‘ACS Survey of Galactic Globular Clusters’ (ACS GCS; GO-10775, PI: Sarajedini) have provided key building blocks for the observational edifice of MPs. These data sets have allowed us to demonstrate their ubiquitous presence in all Galactic GCs studied in enough details, convincingly showing the existence of discrete populations, establishing a tight connection between photometric and spectroscopic data, and spurring further studies by discovering populations with particularly complex chemical patterns (Piotto et al. 2015 hereafter Paper I; Milone et al. 2017; Marino et al. 2018 and references therein).
In this paper, we present and publish the final catalogues. These catalogues contain astrometric positions, F275W, F336W, F438W, F606W, and F814W photometry and cluster membership from proper motions (PMs) of stars in the central regions of 56 GCs and the old super metal-rich open cluster (OC) NGC 6791, presented in Paper I. The GO-13297 data are complemented here by the Wide Field Camera 3 (WFC3) images collected within the GO-12311 (PI: Piotto) and GO-12605 (PI: Piotto) programs, used as pilot projects for the more extended UV Legacy survey. As discussed in Section 5, the catalogues presented in this paper replace our preliminary catalogues published by Soto et al. (2017, Paper VIII). The complete GO-13297 data set also includes the astrometry and photometry catalogues of the external fields taken with the Advanced Camera for Surveys (ACS), in parallel with the GO-13297 WFC3/UVIS central fields and published by Simioni et al. (2018, Paper XIII).
The paper is organized as follows. Section 2 is dedicated to the observations and data reduction; Section 3 briefly presents the colour–magnitude diagrams; the proper motion measurements and the methodology to estimate membership probability are described in Section 4. Section 5 discusses the improvements of the new data reduction with respect to the preliminary one of Paper VIII. In Section 6, we describe the content of the data release tables.
2 OBSERVATIONS AND DATA REDUCTION
In this paper, we present high-precision stellar astrometry and photometry from WFC3/UVIS and ACS/WFC observations of 56 GCs and the old open cluster NGC 6791. The GCs were all observed with ACS/WFC in F606W and F814W bands within GO-10775 (PI: A. Sarajedini). For the open cluster NGC 6791, we used the ACS/WFC data in the same filters collected within GO-10265 (PI: T. Brown). Observations in the UV/blue HST bands (F275W, F336W, and F438W) of 55 clusters were collected with the WFC3/UVIS camera within GO-12311 (PI: G. Piotto), GO-12605 (PI: G. Piotto), and GO-13297 (PI: G. Piotto) programs. A complete log of these observations is presented in Paper I. In addition to the data used in Paper I, for NGC 0104 we also incorporated F336W observations from GO-11729 (PI: J. Holtzman) and GO-12971 (PI: H. Richer), and F435W images collected with ACS/WFC within GO-9443 (PI: I. King) and GO-9281 (PI: J. Grindlay). For NGC 6752, we used F275W data from GO-12311, F336W images from GO-11729, and F435W ACS/WFC observations obtained by GO-12254 (PI: A. Cool).
2.1 First-pass photometry
We worked on _flc images, which are _flt exposures corrected for charge-transfer efficiency (CTE) defects (Anderson & Bedin 2010). For the data reduction, we used an evolution of the software described in Anderson et al. (2008). A detailed description of the adopted tools is given by Bellini et al. (2017), Nardiello et al. (2018), and Libralato et al. (2018).
Briefly, for each image, we accounted on the spatial and time dependence of the Point Spread Function (PSF) by constructing an optimal PSF for each exposure by perturbing the ’library’ PSF1 appropriate for each filter. In order to obtain the perturbed PSFs, we used the FORTRAN program hst1pass (see also Bellini et al. 2018); we selected bright, unsaturated, isolated stars, we measured the flux and the positions using the library PSFs, and finally we subtracted a model of each star to the real star. The residuals of the subtraction are averaged to form a grid of residuals used to perturb the library PSFs. This grid has dimensions that go from 1 × 1 to 5 × 5, depending on the total number of stars available in the field. Each element of the grid corresponds to a different fiducial location on the detector, and we used linear interpolation to evaluate the PSF between these locations. Nine rounds of iterations allowed us to arrive at an evenly spaced set of perturbation PSFs from the random distribution of stars in each image. An example of the grid of residual PSFs is shown in Fig. 1.
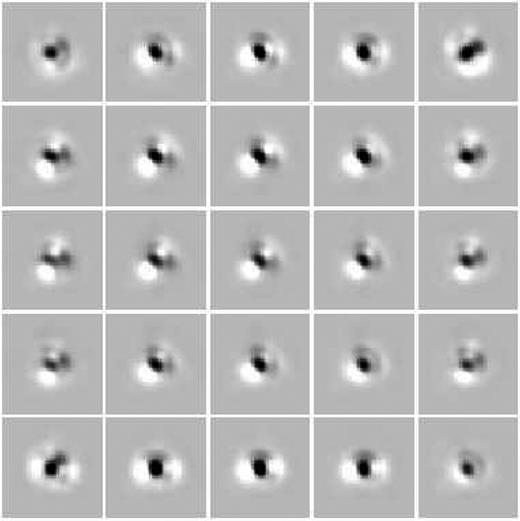
A 5 × 5 grid of perturbation PSFs that modify the library PSF array in the case of the image j9l959f6q (NGC 6352). The total variation across the grid goes from ∼−2 per cent to ∼1 per cent of the star’s total flux.
With these arrays of PSFs, we extracted the preliminary catalogues using the program hst1pass. This program measures positions and fluxes of the stars on the single HST exposures, without performing any neighbour subtraction. It is even able to make measurements of saturated stars, using the technique described in Gilliland (2004) and Gilliland, Rajan & Deustua (2010). We corrected the positions of the stars for geometric distortion using the routines described in Anderson & King (2006, ACS/WFC), and Bellini & Bedin (2009), Bellini, Anderson & Bedin (2011, WFC3/UVIS).
We transformed all the catalogues into a common reference system. We adopted the Gaia Data Release 1 catalogue (Gaia Collaboration et al. 2016b) as the reference system for positions. In this way, the X- and Y-axes are aligned with West and North, respectively. We de-projected the Gaia (α, δ)-coordinates on to a tangent plane with the cluster centre from Goldsbury et al. (2010) as the tangent point (α0, δ0). We transformed these coordinates into WFC3/UVIS pixels (pixel scale 0.0395 arcsec pixel−1; Dressel 2018), positioning the centre of the cluster in the pixel (5000,5000). In the first iteration, we found the six-parameter linear transformations between this master catalogue and each of the single-exposure catalogues by using unsaturated, bright, and isolated stars, and used this transformation to transform all stars measured in each exposure into this reference frame. We collated these lists and extracted a new master catalogue with the 3σ-clipped average stellar positions. We then used this new catalogue to improve the transformations, iterating until the precision on the transformed positions did not improve. For each filter, the photometric zero-point of each individual catalogue is tied to those of the deepest exposure. For each filter, we obtained a final catalogue containing the 3σ-clipped average stellar positions and magnitudes in that filter (‘first-pass’ photometry, similar to that used in Paper I).
2.2 Multiple-pass photometry
In the ‘multiple-pass’ photometry stage, we used the images, the PSF arrays, and the transformations obtained during the ‘first-pass’ to simultaneously find and measure stars in all the individual exposures. The tool we used is the FORTRAN software kitchen_sync2 (KS2; Bellini et al. 2017; Libralato et al. 2018; Nardiello et al. 2018). The software analyses all the images simultaneously to find and measure the sources; in this way it is able to also measure the stars that cannot be detected in individual exposures. To avoid spurious detection caused by artefacts of the PSF, and in order to detect faint stars close to bright stars, KS2 creates an ad hoc mask for bright and saturated stars, which were included in the one-pass catalogues.
The finding procedure is accomplished through different iterations. During the first iteration, the software identifies the bright stars and subtracts them. In the following step, the routine searches for stars that are fainter than the stars from previous iteration and then measures and subtracts them. In each iteration, we defined different criteria (which are increasingly more relaxed from the first to the last iteration) to qualify a source as a star. We chose to iterate eight times: in the first five iterations we required that a stars be present both in the F606W and F814W exposures; in iteration six, seven, and eight we performed the finding on the F275W, F336W, and F438W exposures to detect the stars that are brighter in the UV/blue filters than optical filters (i.e. white dwarfs) and not detected in optical filters.
The KS2 software generated astrometric and photometric catalogues of stars using three different methods. A detailed description of the three methods is given in Bellini et al. (2017).
Method 1 gives the best results for stars that are bright enough to generate star-like profiles in individual exposures. During the finding stage, the routine searches for a distinct peak in a 5 × 5 pixel2 raster and measures, in each image, the flux and the position of the source using an appropriate local PSF, after subtracting the neighbour stars. The local sky value is computed inside an annulus with an inner radius rin = 4 pixels and outer radius rout = 8 pixels. The final flux and position of a star in a filter is given by a robust average of the fluxes and positions measured in the single exposures.
Method 2 works well for faint stars and crowded environments. Starting from the position obtained during the finding stage, KS2 performs weighted aperture photometry of the star in a raster of 5 × 5 pixels, after neighbour subtraction; each pixel is weighted in such a way that pixel containing neighbour stars are down weighted. The local sky is computed as above for method 1. The final flux is a robust average of the fluxes obtained in the single exposures.
Method 3 works well in very crowded environments. It is similar to method 2, but uses only the pixels inside a radius r = 0.75 pixel from the centre of the star and the sky is calculated in a tight annulus with rin = 2 pixels and rout = 4 pixels.
Saturated stars are not measured by KS2. They were, however, included in the one-pass based catalogues using techniques described above.
In addition to the astrophotometric catalogue, KS2 also outputs stacked versions of the fields obtained from the _flc images. Excluding NGC 0104, NGC 6752, and NGC 5897, for all the clusters we generated seven different stacked images: one for the filters F275W, F336W, and F438W, and two for the filters F606W and F814W, separating short- and long-exposure images. For NGC 5897, the F814W short-exposure image is unusable. For NGC 0104 and NGC 6752, we generated eight stacked images: one for the filters F275W and F336W, and two for the filters F435W, F606W, and F814W, one for short-exposure observations and one for the long ones.
2.3 Photometric calibration
We calibrated the output photometry from KS2 into the Vega-mag system by comparing aperture photometry on _drc images (which are normalized to the exposure time of 1 s) with our PSF-based photometry.
For aperture photometry on _drc images, we used an aperture radius rAP = 0.2 arcsec. We adopted the rAP after testing different apertures (from 0.04 arcsec to 0.4 arcsec) on a sample of 10 GCs images with different crowding level and total number of stars. We found that rAP = 0.2 arcsec gives, on average, the lowest error on the determination of the zero-point that converts the instrumental magnitudes to calibrated magnitudes. It represents a fair compromise between measuring as much flux as possible for the stars (≳80 per cent) on the _drc images and avoiding the contamination from neighbour stars.
We corrected the aperture photometry magnitudes |$m^{\rm drc}_{\rm AP}$| with the appropriate aperture correction,2 obtaining the magnitudes for an infinite-aperture radius |$m^{\rm drc}_{\rm AP, \infty }$|.
For each filter, we cross-identified the stars in common between the catalogue obtained using KS2 and that obtained from aperture photometry on _drc images, and computed the 3σ-clipped average <δm >, and the associated error, of the difference |$\delta m = m^{\rm drc}_{\rm AP, \infty }-m^{flc}_{\rm PSF}$|, where |$m^{flc}_{\rm PSF}$| is the magnitude associated with the PSF photometry on _flc images output of KS2.
Table 1 contains the values of <δm > +ZPX and the associated errors for each cluster and for each filter.
Difference between |$m_{\rm CAL,{\rm X}}$| and |$m^{flc}_{\rm PSF, X}$| for each filter X.
| Cluster | F275W | F336W | F438Wa | F606W | F814W |
|---|---|---|---|---|---|
| NGC 0104 | 28.75 ± 0.04 | 30.42 ± 0.02 | 30.71 ± 0.01 | 30.60 ± 0.03 | 29.70 ± 0.03 |
| NGC 0288 | 28.94 ± 0.01 | 29.66 ± 0.01 | 28.85 ± 0.01 | 31.62 ± 0.01 | 30.88 ± 0.01 |
| NGC 0362 | 29.19 ± 0.04 | 29.66 ± 0.02 | 29.14 ± 0.01 | 31.80 ± 0.02 | 31.04 ± 0.02 |
| NGC 1261 | 29.75 ± 0.02 | 29.84 ± 0.01 | 30.38 ± 0.01 | 32.71 ± 0.02 | 31.85 ± 0.02 |
| NGC 1851 | 30.21 ± 0.02 | 29.94 ± 0.01 | 30.18 ± 0.01 | 32.71 ± 0.02 | 31.82 ± 0.02 |
| NGC 2298 | 30.34 ± 0.03 | 29.66 ± 0.01 | 30.14 ± 0.01 | 32.71 ± 0.02 | 31.82 ± 0.02 |
| NGC 2808 | 29.89 ± 0.02 | 30.33 ± 0.02 | 29.77 ± 0.02 | 32.74 ± 0.03 | 31.87 ± 0.05 |
| NGC 3201 | 29.62 ± 0.01 | 29.53 ± 0.01 | 29.39 ± 0.01 | 31.35 ± 0.01 | 30.46 ± 0.02 |
| NGC 4590 | 29.53 ± 0.01 | 29.51 ± 0.01 | 29.26 ± 0.01 | 31.64 ± 0.02 | 30.89 ± 0.02 |
| NGC 4833 | 29.85 ± 0.01 | 29.66 ± 0.01 | 30.15 ± 0.01 | 31.78 ± 0.01 | 31.03 ± 0.01 |
| NGC 5024 | 30.58 ± 0.01 | 29.96 ± 0.01 | 30.46 ± 0.01 | 32.68 ± 0.03 | 31.78 ± 0.03 |
| NGC 5053 | 29.74 ± 0.03 | 29.84 ± 0.01 | 30.34 ± 0.01 | 32.68 ± 0.01 | 31.82 ± 0.02 |
| NGC 5272 | 28.96 ± 0.02 | 29.66 ± 0.02 | 28.87 ± 0.01 | 31.64 ± 0.02 | 30.90 ± 0.03 |
| NGC 5286 | 29.66 ± 0.02 | 29.56 ± 0.02 | 29.33 ± 0.01 | 32.71 ± 0.03 | 31.85 ± 0.03 |
| NGC 5466 | 30.14 ± 0.03 | 29.65 ± 0.01 | 30.13 ± 0.01 | 32.69 ± 0.02 | 31.82 ± 0.02 |
| NGC 5897 | 29.84 ± 0.01 | 29.65 ± 0.01 | 30.18 ± 0.01 | 32.68 ± 0.02 | 31.82 ± 0.02 |
| NGC 5904 | 29.51 ± 0.01 | 29.51 ± 0.01 | 29.22 ± 0.01 | 31.71 ± 0.02 | 30.82 ± 0.02 |
| NGC 5927 | 29.58 ± 0.04 | 29.51 ± 0.01 | 29.80 ± 0.02 | 32.71 ± 0.02 | 31.85 ± 0.02 |
| NGC 5986 | 29.61 ± 0.01 | 29.49 ± 0.01 | 29.33 ± 0.01 | 32.72 ± 0.02 | 31.82 ± 0.03 |
| NGC 6093 | 29.78 ± 0.02 | 30.31 ± 0.02 | 29.60 ± 0.01 | 32.69 ± 0.03 | 31.79 ± 0.03 |
| NGC 6101 | 29.86 ± 0.01 | 29.84 ± 0.01 | 30.35 ± 0.01 | 32.77 ± 0.02 | 31.91 ± 0.02 |
| NGC 6121 | 29.70 ± 0.01 | 29.49 ± 0.01 | 29.36 ± 0.01 | 29.84 ± 0.02 | 29.14 ± 0.02 |
| NGC 6144 | 29.63 ± 0.02 | 29.51 ± 0.01 | 29.28 ± 0.01 | 32.68 ± 0.01 | 31.82 ± 0.02 |
| NGC 6171 | 30.13 ± 0.04 | 29.65 ± 0.01 | 30.17 ± 0.01 | 31.64 ± 0.02 | 30.90 ± 0.02 |
| NGC 6205 | 29.00 ± 0.02 | 29.66 ± 0.01 | 28.97 ± 0.01 | 31.72 ± 0.03 | 30.83 ± 0.03 |
| NGC 6218 | 29.67 ± 0.01 | 29.51 ± 0.01 | 29.36 ± 0.01 | 31.24 ± 0.02 | 30.34 ± 0.02 |
| NGC 6254 | 29.68 ± 0.01 | 29.51 ± 0.01 | 29.37 ± 0.01 | 31.23 ± 0.02 | 30.34 ± 0.02 |
| NGC 6304 | 29.55 ± 0.03 | 29.51 ± 0.02 | 29.28 ± 0.01 | 32.68 ± 0.02 | 31.82 ± 0.02 |
| NGC 6341 | 29.55 ± 0.02 | 29.51 ± 0.02 | 29.24 ± 0.02 | 31.72 ± 0.02 | 30.90 ± 0.03 |
| NGC 6352 | 29.58 ± 0.02 | 29.53 ± 0.01 | 29.22 ± 0.01 | 31.72 ± 0.02 | 30.90 ± 0.02 |
| NGC 6362 | 29.58 ± 0.02 | 29.57 ± 0.01 | 29.40 ± 0.01 | 31.64 ± 0.01 | 30.90 ± 0.02 |
| NGC 6366 | 29.73 ± 0.05 | 29.51 ± 0.02 | 29.29 ± 0.01 | 31.72 ± 0.02 | 30.83 ± 0.02 |
| NGC 6388 | 30.16 ± 0.03 | 29.65 ± 0.05 | 30.11 ± 0.02 | 32.68 ± 0.05 | 31.81 ± 0.06 |
| NGC 6397 | 29.63 ± 0.01 | 29.53 ± 0.01 | 29.36 ± 0.01 | 29.29 ± 0.02 | 28.40 ± 0.02 |
| NGC 6441 | 30.29 ± 0.07 | 29.64 ± 0.04 | 30.06 ± 0.02 | 32.68 ± 0.05 | 31.81 ± 0.06 |
| NGC 6496 | 29.67 ± 0.07 | 29.50 ± 0.01 | 29.47 ± 0.01 | 32.68 ± 0.02 | 31.82 ± 0.02 |
| NGC 6535 | 29.68 ± 0.03 | 29.51 ± 0.01 | 29.30 ± 0.01 | 31.64 ± 0.01 | 30.90 ± 0.02 |
| NGC 6541 | 29.63 ± 0.02 | 29.50 ± 0.02 | 29.36 ± 0.02 | 31.72 ± 0.02 | 30.90 ± 0.03 |
| NGC 6584 | 29.55 ± 0.03 | 29.53 ± 0.01 | 29.29 ± 0.01 | 32.72 ± 0.02 | 31.85 ± 0.02 |
| NGC 6624 | 29.67 ± 0.03 | 29.48 ± 0.02 | 29.58 ± 0.01 | 32.71 ± 0.02 | 31.81 ± 0.02 |
| NGC 6637 | 29.86 ± 0.02 | 29.66 ± 0.01 | 30.10 ± 0.01 | 32.68 ± 0.02 | 31.78 ± 0.02 |
| NGC 6652 | 29.67 ± 0.05 | 29.53 ± 0.01 | 29.65 ± 0.01 | 32.68 ± 0.02 | 31.79 ± 0.02 |
| NGC 6656 | 29.69 ± 0.02 | 29.99 ± 0.01 | 30.19 ± 0.01 | 30.70 ± 0.02 | 29.99 ± 0.02 |
| NGC 6681 | 29.69 ± 0.01 | 29.48 ± 0.01 | 29.62 ± 0.01 | 31.72 ± 0.02 | 30.90 ± 0.02 |
| NGC 6715 | 30.51 ± 0.03 | 29.97 ± 0.04 | 30.51 ± 0.02 | 32.69 ± 0.04 | 31.82 ± 0.04 |
| NGC 6717 | 29.51 ± 0.01 | 29.54 ± 0.01 | 29.26 ± 0.01 | 31.63 ± 0.02 | 30.90 ± 0.02 |
| NGC 6723 | 29.59 ± 0.02 | 29.54 ± 0.01 | 29.27 ± 0.01 | 31.73 ± 0.02 | 30.91 ± 0.02 |
| NGC 6752 | 28.84 ± 0.02 | 30.05 ± 0.01 | 32.14 ± 0.01 | 30.21 ± 0.02 | 29.46 ± 0.02 |
| NGC 6779 | 29.69 ± 0.01 | 29.47 ± 0.01 | 29.58 ± 0.01 | 32.68 ± 0.02 | 31.82 ± 0.02 |
| NGC 6791 | 29.49 ± 0.05 | 29.48 ± 0.01 | 29.45 ± 0.01 | 30.60 ± 0.01 | 29.72 ± 0.01 |
| NGC 6809 | 29.71 ± 0.01 | 29.47 ± 0.01 | 29.36 ± 0.01 | 30.97 ± 0.02 | 30.22 ± 0.02 |
| NGC 6838 | 29.68 ± 0.02 | 29.50 ± 0.01 | 29.35 ± 0.01 | 31.04 ± 0.02 | 30.21 ± 0.02 |
| NGC 6934 | 29.67 ± 0.02 | 29.50 ± 0.01 | 29.42 ± 0.01 | 32.69 ± 0.02 | 31.79 ± 0.02 |
| NGC 6981 | 29.55 ± 0.02 | 29.51 ± 0.01 | 29.43 ± 0.01 | 31.64 ± 0.02 | 30.91 ± 0.02 |
| NGC 7078 | 29.53 ± 0.02 | 29.65 ± 0.02 | 29.34 ± 0.01 | 31.64 ± 0.03 | 30.90 ± 0.04 |
| NGC 7089 | 29.68 ± 0.02 | 29.54 ± 0.02 | 29.29 ± 0.02 | 32.69 ± 0.03 | 31.79 ± 0.04 |
| NGC 7099 | 29.58 ± 0.02 | 29.50 ± 0.01 | 29.35 ± 0.01 | 31.72 ± 0.02 | 30.82 ± 0.02 |
aFor NGC 0104 and NGC 6752, the value is referred to ACS/WFC F435W filter.
2.4 Astrometric solution
As described in Section 2.1, our reference frame was based on the Gaia Data Release 1 catalogue (Gaia Collaboration et al. 2016b), which enables us to transform the coordinates from (X,Y) into (α, δ). As such, the positions are given for Equinox J2000 and referred to the epoch of Gaia observations (2015.0).
2.5 Quality parameters
In addition to the photometric error (RMS), the KS2 routine provides as output some quality parameters that are useful for selecting the best measured stars for a particular science case.
Introduced by Bedin et al. (2008, see also Bedin et al. 2009, 2010; Simioni et al. 2018), the parameter RADXS is a shape parameter that allows us to distinguish sources that deviate from a PSF shape. It is a comparison between the measured flux of the source outside the core (in an annulus 1.0 < r < 2.5 pixels) and the flux expected from the PSF-model. For RADXS>0, the source is broader than that expected from the model (i.e. galaxies), while for negative values of RADXS the source is sharper than the PSF (i.e. cosmic rays and artefacts).
Finally, the KS2 routine gives the number of images in which a star is found (N|$_{{\tt f}}$|) and the number of consistent measurements of the star used to compute its average position and flux (N|$_{{\tt g}}$|).
3 COLOUR–MAGNITUDE DIAGRAMS
In Fig. 2, we show an example of selection of well-measured stars for the case of NGC 6752 and the photometric method 1. Similar plots can be made for the methods 2 and 3. The top and middle panels of Fig. 2 show the selection of the stars based on the distribution of the photometric errors (RMS, left-hand panels), the quality of fit (QFIT, centre panels), and the shape of the sources (RADXS, right-hand panels), in the case of F275W (top panels) and F336W (middle panels) filters. The selection based on RMS and QFIT are performed as done by Milone et al. (2012): we divided the distributions in 12 magnitude bins and, in each bin, we calculated the 3.5σ-clipped average of the magnitude and of the parameter, where σ is the standard deviation associated with the average value in the given bin. We added to the mean parameter of each bin 3.5 × σ, and we linearly interpolated these points (green line). We excluded all the points above (in the case of the RMS) or below (in the case of the QFIT) the green line (azure points). For the sharp parameter, we selected all the stars that satisfy the condition: −0.15 <RADXS<+0.15. Bottom panels show the mF275W versus (mF275W − mF336W) colour-magnitude diagram (CMD) for the stars that pass the selection criteria in both filters (left-hand panel) and for the stars that were rejected in at least one filter (right-hand panel). In red, the stars that are saturated in at least one filter and that have been recovered from the ‘first-pass’ photometry. From the CMDs, it is clear that many stars with poor photometric quality are rejected.
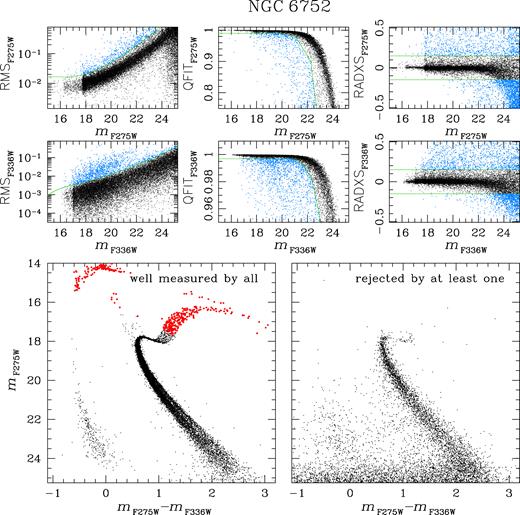
Procedure adopted for selecting well-measured stars in the cluster NGC 6752. Top and middle panels show the selection of the stars based on RMS (left-hand panels), QFIT (central panels), and RADXS (right-hand panels) parameters: in azure the stars that are rejected. Bottom panels show the mF275W versus (mF275W − mF336W) CMD cleaned by rejected stars in both filters (left-hand panel) and the CMD of the stars rejected in at least one filter. Red dots correspond to the stars that are saturated in at least one filter.
Fig. 3 shows a comparison of the CMDs of NGC 6752 obtained using the three photometric methods described in Section 2: top-panels show the mF275W versus (mF275W − mF336W) CMDs of NGC 6752 in the bright regime of magnitudes (16.5 < mF275W < 20.5) and obtained with method 1 (panel a1), method 2 (panel a2), and method 3 (panel a3). The middle panels (b1), (b2), and (b3) of Fig. 3 show the same CMDs for stars with 22.0 < mF275W < 26.9. The stars plotted in the CMDs have passed the selection criteria described above applied to each photometric method. Top panels show that for bright stars method-1 gives better results than method 2 and method 3. Panel (b1) shows that method 1 gives a good measurement of the stars with mF275W ≲ 23.0; stars having magnitude 23.0 ≲ mF275W ≲ 25.5 are well measured with method 2, while method 3 is an optimal choice for stars having 25.5 ≲ mF275W ≲ 27.0. Panel (c) of Fig. 3 shows the mF275W − mF336W colour RMS as a function of the F275W magnitude: light red, light green, and light blue points are the RMS of the stars measured with method 1, method 2, and method 3, respectively. We divided the RMS distribution in bins of width 1 F275W magnitude, and we computed in each bin the median RMS. The binned RMS distributions of the three methods (in red, green, and blue for methods 1, 2, and 3, respectively), confirm that method-1 gives the best results in the bright magnitude regime, while stars measured with methods 2 and 3 have lower RMS at fainter magnitudes.
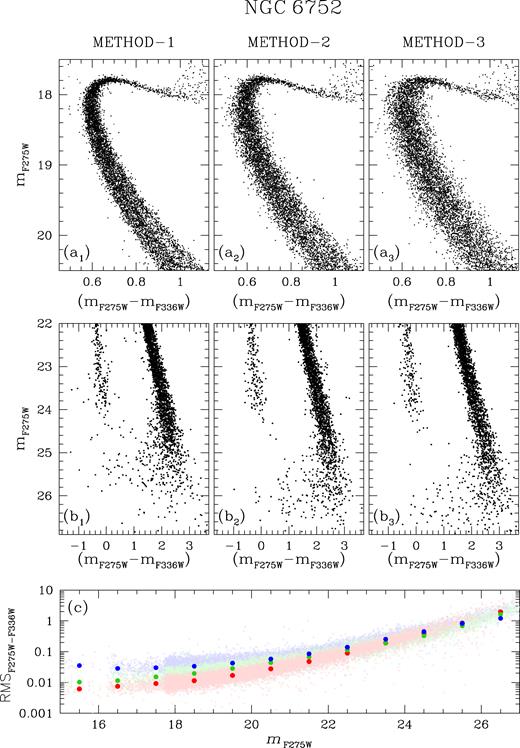
The CMDs of NGC 6752 obtained using the three photometric methods described in Section 2: top-panels show the mF275W versus (mF275W − mF336W) CMDs for stars with 16.5 < mF275W < 20.5 and obtained with method 1 (panel a1), method 2 (panel a2), and method 3 (panel a3). Middle panels (b1), (b2), and (b3) show the same CMDs for stars with 22.0 < mF275W < 26.9. Panel (c) shows the colour RMS as a function of the F275W magnitude for the three photometric methods: in red the Method 1, in green the Method 2, and in blue the Method 3.
4 RELATIVE PROPER MOTIONS AND CLUSTER MEMBERSHIP PROBABILITIES
The photometric catalogues published with this manuscript are obtained with reduction pipelines fine tuned to achieve high-precision photometric measurements. High-precision proper motions require a completely different, ad hoc reduction of the images (see e.g. Bellini et al. 2014, 2018; Libralato et al. 2018), which is beyond the scope of this manuscript. High-precision astrometry have different demands with respect to high-precision photometry since, to the first order, photometry cares of sum of pixels while astrometry is focused on differences between pixels. There are several systematic effects (e.g. CTE correction residuals, geometric-distortion correction residuals, colour terms in the blue filters of the WFC3/UVIS, etc.) that cannot be properly accounted for with a reduction fine-tuned for photometry. These systematic effects can be as large as 0.2 ACS/WFC pixels in a given data set. The proper motions we computed for this work are based on image pairs, are insensitive to systematic errors, and are highly degenerate in terms of proper motion errors.
In summary, the present proper motions can be only used to calculate cluster membership in order to separate cluster members and field stars. We are presently working on the much more precise astrometry needed for internal kinematics (≪0.1 mas yr−1, see e.g. Libralato et al. 2018), and we defer the publication of proper motions catalogues to future papers.
Selecting bona-fide cluster members by relying solely on the stellar positions on a CMD is not an easy task, in particular for those GCs near the Galactic plane or bulge. In principle, the user can combine our photometry with the proper motions in the Gaia Data Release 2 (Gaia Collaboration et al. 2016a, 2018). However, the Gaia catalogue is severely incomplete near the core of GCs (see e.g. Libralato et al. 2018), and furthermore most cluster stars are well below Gaia’s faint limit. Therefore, in order to help interested users to select cluster members, we include in our photometric catalogues an estimate of the membership probability Pμ. In this section, we will describe how we measured relative motions and estimated membership probabilities.
To compute relative PMs, we adopted the approach described in many previous publications by our group (see e.g. Bedin et al. 2003; Anderson et al. 2006; Yadav et al. 2008; Bellini & Bedin 2010; Libralato et al. 2014; Libralato et al. 2015; Nardiello et al. 2015; Nardiello et al. 2016; Kerber et al. 2018). The routine KS2 provides raw catalogues, one for each exposure, containing positions and magnitudes of the stars listed in the final catalogue as measured on the single images. We used these raw catalogues to compute the relative PMs; for this computation we excluded F275W raw catalogues because of colour-dependent systematic effects in the geometric-distortion correction of this filter (Bellini et al. 2011)
We used six-parameter local transformations and a sample of likely cluster members (red giant branch (RGB), sub giant branch (SGB), and main-sequence (MS) stars) to compute the displacement between the stellar positions in two different epochs. We started with a first, preliminary, sample of likely cluster members, selected on the mF814W versus (mF606W − mF814W) CMD, to compute the coefficients of the six-parameter linear transformations between the positions of the raw catalogues and the final catalogue. In order to minimize the effects of residual uncorrected geometric distortion, we computed the transformations using local samples (50 stars) of likely cluster members. Stars in each single-exposure catalogue of the first-epoch data set were compared to stars in each single-exposure catalogue of the second-epoch data set. Suppose we have N exposures for the first epoch and M exposures for the second epoch, then we end up with N × M displacements for each star. The computed relative proper motion of a star is the average of all these displacements along the X- and the Y-axes. The assigned error is simply the RMS of the displacement residuals around the average. Because the displacements are not statistically independent, the assigned errors are not a reliable estimate of the proper-motion errors, but can still be used to estimate membership probabilities (see Anderson et al. 2006 for an in-depth description of the method). We used these displacements to remove from the list of likely cluster members objects that had colours placing them close to the cluster sequences but had a field-star-like motion (i.e. those stars with proper motions relative to the cluster mean motion >6 mas yr−1). We iterated the procedure three times using the new member list to compute the improved linear transformations with each iteration.
KS2 does not measure the positions and fluxes of saturated stars. Therefore, we used the outputs of first pass photometry to obtain the relative proper motions of these stars.
Since the coefficients of the six-parameter linear transformations are computed using likely cluster members, the stellar displacements are computed relative to the cluster mean motion, and therefore, in the vector-point diagram (VPD), cluster stars will be centred around (0,0), while field stars will lie in different regions of the VPD. The mean date of the adopted observations for the first and second epoch and the time baseline are listed in Table 2.
Epochs of observations.
| Cluster | 1st epoch | 2nd epoch | Δt (yrs) | Cluster | 1st epoch | 2nd epoch | Δt (yrs) |
|---|---|---|---|---|---|---|---|
| NGC 0104 | 2006.20 | 2013.14 | 6.94 | NGC 6352 | 2006.27 | 2014.01 | 7.74 |
| NGC 0288 | 2006.56 | 2012.83 | 6.27 | NGC 6362 | 2006.41 | 2014.37 | 7.96 |
| NGC 0362 | 2006.42 | 2012.70 | 6.28 | NGC 6366 | 2006.25 | 2014.50 | 8.25 |
| NGC 1261 | 2006.19 | 2013.93 | 7.74 | NGC 6388 | 2006.27 | 2014.44 | 8.18 |
| NGC 1851 | 2006.33 | 2014.51 | 8.17 | NGC 6397 | 2006.41 | 2014.34 | 7.93 |
| NGC 2298 | 2006.45 | 2014.27 | 7.82 | NGC 6441 | 2006.41 | 2014.36 | 7.95 |
| NGC 2808 | 2006.17 | 2013.69 | 7.52 | NGC 6496 | 2006.31 | 2014.01 | 7.71 |
| NGC 3201 | 2006.20 | 2013.85 | 7.65 | NGC 6535 | 2006.25 | 2014.48 | 8.23 |
| NGC 4590 | 2006.18 | 2014.07 | 7.88 | NGC 6541 | 2006.25 | 2014.29 | 8.04 |
| NGC 4833 | 2006.57 | 2014.16 | 7.59 | NGC 6584 | 2006.40 | 2014.02 | 7.62 |
| NGC 5024 | 2006.17 | 2014.04 | 7.87 | NGC 6624 | 2006.29 | 2014.08 | 7.79 |
| NGC 5053 | 2006.18 | 2014.15 | 7.97 | NGC 6637 | 2006.39 | 2014.32 | 7.93 |
| NGC 5272 | 2006.14 | 2012.37 | 6.23 | NGC 6652 | 2006.40 | 2013.93 | 7.52 |
| NGC 5286 | 2006.17 | 2013.95 | 7.78 | NGC 6656 | 2006.25 | 2014.54 | 8.29 |
| NGC 5466 | 2006.28 | 2014.13 | 7.85 | NGC 6681 | 2006.39 | 2014.09 | 7.70 |
| NGC 5897 | 2006.27 | 2014.25 | 7.97 | NGC 6715 | 2006.40 | 2014.09 | 7.69 |
| NGC 5904 | 2006.20 | 2014.31 | 8.11 | NGC 6717 | 2006.24 | 2014.45 | 8.21 |
| NGC 5927 | 2006.28 | 2014.63 | 8.34 | NGC 6723 | 2006.42 | 2014.41 | 7.99 |
| NGC 5986 | 2006.29 | 2014.60 | 8.31 | NGC 6752 | 2006.40 | 2010.34 | 3.95 |
| NGC 6093 | 2006.27 | 2012.44 | 6.17 | NGC 6779 | 2006.36 | 2014.17 | 7.81 |
| NGC 6101 | 2006.42 | 2014.19 | 7.77 | NGC 6791 | 2004.74 | 2013.97 | 9.23 |
| NGC 6121 | 2006.18 | 2014.82 | 8.65 | NGC 6809 | 2006.30 | 2014.44 | 8.14 |
| NGC 6144 | 2006.29 | 2014.28 | 7.99 | NGC 6838 | 2006.36 | 2014.08 | 7.71 |
| NGC 6171 | 2006.25 | 2014.32 | 8.08 | NGC 6934 | 2006.25 | 2014.20 | 7.95 |
| NGC 6205 | 2006.25 | 2012.37 | 6.12 | NGC 6981 | 2006.38 | 2014.11 | 7.73 |
| NGC 6218 | 2006.17 | 2014.01 | 7.85 | NGC 7078 | 2006.33 | 2011.79 | 5.46 |
| NGC 6254 | 2006.18 | 2014.02 | 7.84 | NGC 7089 | 2006.29 | 2013.69 | 7.40 |
| NGC 6304 | 2006.29 | 2014.04 | 7.76 | NGC 7099 | 2006.34 | 2014.54 | 8.20 |
| NGC 6341 | 2006.28 | 2014.20 | 7.92 |
Membership probabilities were then computed using the local-sample method, similarly to what was done in Bellini et al. (2009) and Libralato et al. (2014). For each target star, the membership probability is estimated using a sub-sample of reference 500 stars in the catalogue. These reference stars were initially chosen on the basis of PM error (typically ±0.25 mas yr−1) and a magnitude similar to those of the target. The only exceptions are for target stars along the SGB and RGB, for which – due to small-number statistics – we considered as reference stars sources over the entire SGB–RGB sequence.
The cluster density function is modelled with an axisymmetric 2D Gaussian distribution centred on the origin of the VPD (since PMs are computed relative to the cluster’s bulk motion). The sigma of the 2D Gaussian is magnitude dependent, and is defined as the 68.27th per centile of the |$\sqrt{\mu _x^2+\mu _y^2}$| distribution at any given magnitude. Field stars are assumed to have a flat distribution in the VPD, which is a fair assumption for the vast majority of our clusters. The remaining parameters of the local-sample method (see equation 10 of Kozhurina-Platais et al. 1995) are solved for using least-squares techniques.
Fig. 4 shows an example of field-star decontamination based on membership probabilities. Panels (a), (b), and (c) show the VPD, the mF814W versus mF336W − mF814W CMD, and the membership distribution Pμ, respectively, for all the well-measured stars of NGC 6304: in black are the stars having a membership probability Pμ > 90 per cent, in azure the other stars. In panel (b) we highlight in orange the stars that are saturated in at least one of the two filters.
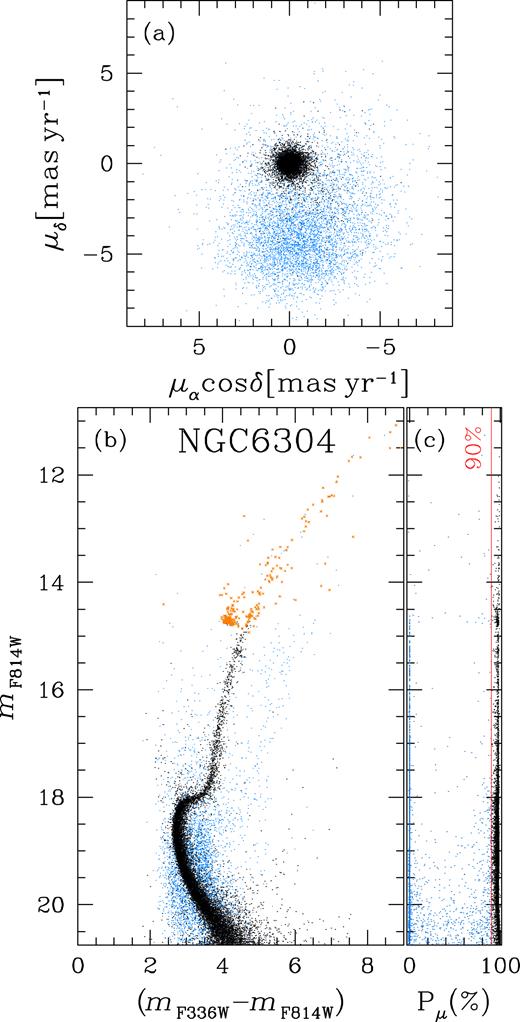
Likely NGC 6304 members selection. Panel (a) shows the VPD for the well-measured stars; panel (b) illustrates the mF814W versus mF336W − mF814W CMD: in orange are the saturated stars in at least one filter; panel (c) is the membership probability as a function of the F814W magnitude. In all the plots, we highlighted in azure the stars having Pμ < 90 per cent and in black the likely cluster members.
Stars with unrealistic PM errors4 are not considered in our membership-probability determination. This limits our ability to estimate membership-probabilities to stars brighter than a certain magnitude threshold that varies from cluster to cluster.
5 THE NEED FOR A NEW DATA RELEASE
In Paper VIII preliminary catalogues of the clusters in our project were released, in order to provide to the astronomical community an initial estimate of positions, luminosities, and colours of bright stars belonging to different populations in order to enable target selection for spectroscopic observations. As clearly stated in Paper VIII, this was the main purpose of the preliminary published catalogues.
The data-reduction pipelines used in this work and in Paper VIII are different. In the following, we list the most important improvements.
1) Perturbed PSFs: In Paper VIII static library PSFs were used. As explained in Section 2, in this work we perturbed library PSFs to take into account of spatial and temporal variations of the PSFs and to empirically reproduce the shape of the stars in each single image. This procedure was not adopted in Paper VIII;
2) Neighbour subtraction: For the present catalogue, when we measured the position and the flux of each source, we subtracted the neighbours to avoid the contamination by other close stars. This allowed us to better estimate the real flux of each star (as well as the measurement error), even in very crowded environments. In Paper VIII neighbour stars were not subtracted;
3) Faint stars: Because in Paper VIII we were interested only in measuring bright stars, only stars with S/N ≳ 10 were searched in each image. The main consequence is that the faint part of the CMD was lacking in Paper VIII. In this work we searched for each significant peak (≥1σ above the sky) combining all the images, and measured the associated source using three different photometric methods.
4) Optical filters and UV completeness: In Paper VIII UV starlists were cross-identified with former ACS GCS catalogues (Sarajedini et al. 2007), and many bright stars in UV bands were lost. In this work we also re-reduced data from the GO-10775 in an effort to improve the photometry in F606W and F814W bands using the new pipeline. Moreover, because we searched for stars using all filters, the new catalogues include stars bright in UV, even if they are too faint to be detected in optical bands (e.g. white dwarfs).
Fig. 5 gives an example of the photometric improvements of the catalogues released by this work with respect to the preliminary catalogue in Paper VIII. The bottom panels show the RMS improvements (in per centage) of our photometry compared to that published in Paper VIII for the filters F275W, F336W, and F438W. The RMS was calculated for the stars in common between the two catalogues in the magnitude range 15 ≤ mX ≤ 20, with X=F275W, F336W, F438W. In this interval we computed the 3.5σ-clipped median and dispersion of RMSX for both catalogues and calculated the value 100× [1 −RMSX(this work)/RMSX(Paper VIII)] that we used as indicator of photometric improvement. On average, our photometry has a ∼20–30 per cent lower RMS than that published in Paper VIII. Top panels of Fig. 5 illustrate a comparison between the mF275W versus mF275W − mF336W CMDs of NGC 1851 from method-1 photometry (left-hand panel) and the catalogue published in Paper VIII. In black we show the stars in common between these catalogues, in orange the stars measured in this work, but missing in Paper VIII catalogue. The photometric improvement is evident, especially at the SGB and MS level.
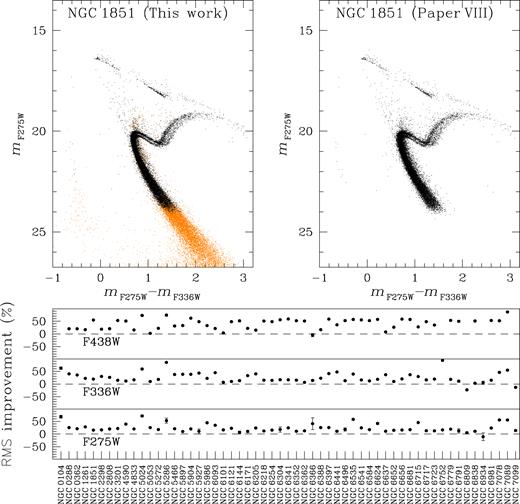
Comparison between catalogues of this work and Paper VIII. Top-panels show the mF275W versus mF275W − mF336W CMDs of NGC 1851 obtained with the catalogue obtained in this work (left-hand panel) and the Paper VIII catalogue (right-hand panel). Black points are the stars in common to the two data-release, orange points the stars measured in this work. Bottom panels show the photometric RMS improvements of our catalogues with respect to Paper VIII ones for F275W, F336W, and F438W bands.
Previous papers of the series are based on the catalogues described in Paper I, which were generated for internal use, and have not been published. Even though the routines used to obtain may be slightly different from the ones we adopted for this paper, these catalogues were extracted using perturbed PSFs and neighbour subtraction. The F275W, F336W, and F438W photometric precision of this data set and the internal-use set are comparable. The main difference regards the optical filters: as with the preliminary catalogue, the UV catalogues extracted in Paper I were cross-identified with pre-existing ACS GCS catalogues (Sarajedini et al. 2007) with all the limitations we discussed above for UV-bright sources. The catalogues we publish in this paper includes a new reduction of ACS GO-10775 F606W and F814W data, and includes UV and optical magnitudes of sources detected significantly in at least one of the F275W, F336W, F438W, F606W, and F814W bands.
6 THE DATA RELEASE
This new data release replaces the preliminary public available data release of Paper VIII (see Section 5). The new released material is part of the project ‘HST UV Globular cluster Survey’ (HUGS). All of the data products from HUGS are available at Mikulski Archive for Space Telescopes (MAST) (http://dx.doi.org/10.17909/T9810F) as a High Level Science Product.
We release the astrophotometric catalogues for all 57 clusters and, for each of them, we also release all the astrometrized stacked images (see Section 2 for details). The released material will be available at the ‘Exoplanets and Stellar Populations Group’ (ESPG) website5 of the Università degli Studi di Padova, and on the MAST under the project HUGS.6
For each cluster we release three catalogues, one for each photometric method. The catalogues contain information on the positions and on the photometry of each star found in the field. The catalogues also include membership probability. In Table 3 we describe the content of each column. The same description is also included in the header of each catalogue. For exemplification purpose, Table 4 shows three rows of one of the released tables.
Description of the column content of the astrophotometric catalogues.
| Column | Name | Unit | Explanation |
|---|---|---|---|
| 01,02 | X, Y | [pix] | (x,y) stellar position in a reference system where the cluster center is in (5000,5000) |
| 03 | mF275W | [mag] | F275W calibrated magnitude |
| 04 | RMSF275W | [mag] | F275W photometric RMS |
| 05 | QFITF275W | F275W quality-fit parameter | |
| 06 | RADXSF275W | F275W sharp parameter | |
| 07 | N|$_{{\tt f},{\rm F275W}}$| | Number of F275W exposures the source is found [99: saturated star] | |
| 08 | N|$_{{\tt g},{\rm F275W}}$| | Number of F275W exposures the source is well measured [99: saturated star] | |
| 09 | mF336W | [mag] | F336W calibrated magnitude |
| 10 | RMSF336W | [mag] | F336W photometric RMS |
| 11 | QFITF336W | F336W quality-fit parameter | |
| 12 | RADXSF336W | F336W sharp parameter | |
| 13 | N|$_{{\tt f},{\rm F336W}}$| | Number of F336W exposures the source is found [99: saturated star] | |
| 14 | N|$_{{\tt g},{\rm F336W}}$| | Number of F336W exposures the source is well measured [99: saturated star] | |
| 15 | mF438W | [mag] | F438W calibrated magnitude |
| 16 | RMSF438W | [mag] | F438W photometric RMS |
| 17 | QFITF438W | F438W quality-fit parameter | |
| 18 | RADXSF438W | F438W sharp parameter | |
| 19 | N|$_{{\tt f},{\rm F438W}}$| | Number of F438W exposures the source is found [99: saturated star] | |
| 20 | N|$_{{\tt g},{\rm F438W}}$| | Number of F438W exposures the source is well measured [99: saturated star] | |
| 21 | mF606W | [mag] | F606W calibrated magnitude |
| 22 | RMSF606W | [mag] | F606W photometric RMS |
| 23 | QFITF606W | F606W quality-fit parameter | |
| 24 | RADXSF606W | F606W sharp parameter | |
| 25 | N|$_{{\tt f},{\rm F606W}}$| | Number of F606W exposures the source is found [99: saturated star] | |
| 26 | N|$_{{\tt g},{\rm F606W}}$| | Number of F606W exposures the source is well measured [99: saturated star] | |
| 27 | mF814W | [mag] | F814W calibrated magnitude |
| 28 | RMSF814W | [mag] | F814W photometric RMS |
| 29 | QFITF814W | F814W quality-fit parameter | |
| 30 | RADXSF814W | F814W sharp parameter | |
| 31 | N|$_{{\tt f},{\rm F814W}}$| | Number of F814W exposures the source is found [99: saturated star] | |
| 32 | N|$_{{\tt g},{\rm F814W}}$| | Number of F814W exposures the source is well measured [99: saturated star] | |
| 33 | Pμ | [%] | Membership probability [-1.0: not available] |
| 34 | α | [deg.] | Right ascension (J2000, epoch 2015) of the star |
| 35 | δ | [deg.] | Declination (J2000, epoch 2015) of the star |
| 36 | ID | Identification number of the star | |
| 37 | ITER | Iteration the star was found | |
| 1–5: found in F814W and F606W images | |||
| 6: found in F438W images | |||
| 7: found in F336W images | |||
| 8: found in F275W images |
For NGC 0104 and NGC 6752, the F438W quantities are referred to the ACS/WFC F435W filter.
Three lines from the catalogue of NGC 6304.
| X | Y | mF275W | RMSF275W | QFITF275W | RADXSF275W | N|$_{{\tt f},{\rm F275W}}$| | N|$_{{\tt g},{\rm F275W}}$| | mF336W | RMSF336W | QFITF336W | RADXSF336W | N|$_{{\tt f},{\rm F336W}}$| | N|$_{{\tt g},{\rm F336W}}$| |
|---|---|---|---|---|---|---|---|---|---|---|---|---|---|
| 6993.4438 | 2488.7637 | 24.0801 | 0.0000 | 0.7845 | −0.4151 | 1 | 1 | 22.3862 | 0.0137 | 0.9844 | 0.0308 | 2 | 1 |
| 4117.0439 | 2489.3533 | 23.1821 | 0.0000 | 0.9453 | −0.0596 | 1 | 1 | 21.4650 | 0.0103 | 0.9955 | 0.1101 | 2 | 1 |
| 4674.6870 | 2490.8945 | −99.9999 | 99.9999 | 0.0000 | 9.9999 | 0 | 0 | −99.9999 | 99.9999 | 0.0000 | 9.9999 | 0 | 0 |
| mF438W | RMSF438W | QFITF438W | RADXSF438W | N|$_{{\tt f},{\rm F438W}}$| | N|$_{{\tt g},{\rm F438W}}$| | mF606W | RMSF606W | QFITF606W | RADXSF606W | N|$_{{\tt f},{\rm F606W}}$| | N|$_{{\tt g},{\rm F606W}}$| | mF814W | RMSF814W |
| 21.3648 | 0.0000 | 0.9933 | 0.1235 | 1 | 1 | 19.5705 | 0.0025 | 1.0000 | 0.0013 | 4 | 1 | 18.4205 | 0.0027 |
| 21.1103 | 0.0000 | 0.9960 | −0.0177 | 1 | 1 | 19.7744 | 0.0035 | 0.9999 | 0.0324 | 4 | 1 | 18.7334 | 0.0032 |
| −99.9999 | 99.9999 | 0.0000 | 9.9999 | 0 | 0 | 19.9864 | 0.0000 | 0.9999 | 0.0615 | 1 | 1 | 18.9580 | 0.0000 |
| QFITF814W | RADXSF814W | N|$_{{\tt f},{\rm F814W}}$| | N|$_{{\tt g},{\rm F814W}}$| | Pμ | α | δ | ID | ITER | |||||
| 1.0000 | 0.0049 | 4 | 1 | 00.0 | 258.638467 | −29.489565 | R0000287 | 1 | |||||
| 1.0000 | 0.0595 | 4 | 1 | 98.1 | 258.638913 | −29.489539 | R0000288 | 1 | |||||
| 0.9999 | 0.0999 | 1 | 1 | −01.0 | 258.614414 | −29.489541 | R0000289 | 1 |
The catalogues that we make public here are complemented by the astrometric and photometric catalogues of the external ACS/WFC fields for 48 GCs plus NGC 6791 observed in parallel to the GO-13297 WFC3/UVIS central fields and published in Paper XIII. All catalogues are available at ESPG webpage5.
SUPPORTING INFORMATION
As described in the manuscript, the released material (astrophotometric catalogues and stacked images) will be available at
(1) Mikulski Archive for Space Telescope as a High Level Science Product: https://archive.stsci.edu/prepds/hugs/
(2) Exoplanets and Stellar Populations Group website of the Universita` degli Studi di Padova: http://groups.dfa.unipd.it/ESPG/treasury.php
Please note: Oxford University Press is not responsible for the content or functionality of any supporting materials supplied by the authors. Any queries (other than missing material) should be directed to the corresponding author for the article.
ACKNOWLEDGEMENTS
This work has made use of data from the European Space Agency (ESA) mission Gaia (http://www.cosmos.esa.int/gaia), processed by the Gaia Data Processing and Analysis Consortium (DPAC, http://www.cosmos.esa.int/web/gaia/dpac/consortium). Funding for the DPAC has been provided by national institutions, in particular the institutions participating in the Gaia Multilateral Agreement. DN and GP acknowledge partial support by the Università degli Studi di Padova Progetto di Ateneo CPDA141214 and BIRD178590 and by INAF under the program PRIN-INAF2014. ML and AB acknowledge support from STScI grant GO 13297. AA, SC, and GP acknowledge partial support by the Spanish Ministry of Economy and Competitiveness and the Spanish Ministry of Science, Innovation and Universities (grants AYA2013-42781-P and AYA2017-89841-P). AA acknowledges partial support by the Instituto de Astrofìsica de Canarias (grant 310394). APM acknowledges support by the European Research Council through the ERC-StG 2016 project 716082 ’GALFOR’. AFM has been supported by the Australian Research Council through Discovery Early Career Researcher Award DE160100851. Based on observations with the NASA/ESA Hubble Space Telescope, obtained at the Space Telescope Science Institute, which is operated by AURA, Inc., under NASA contract NAS 5-26555.All of the data products are available at MAST as a High Level Science Product under the project HUGS: https://archive.stsci.edu/prepds/hugs/
Footnotes
Stars with extremely (several sigmas) underestimated or overestimated PM errors with respect to those of stars with similar magnitude.
