


ABSTRACT
In the local Universe, there is a strong division in the star-forming properties of low-mass galaxies, with star formation largely ubiquitous amongst the field population while satellite systems are predominantly quenched. This dichotomy implies that environmental processes play the dominant role in suppressing star formation within this low-mass regime (M⋆ ∼ 105.5–8 M⊙). As shown by observations of the Local Volume, however, there is a non-negligible population of passive systems in the field, which challenges our understanding of quenching at low masses. By applying the satellite quenching models of Fillingham et al. (2015) to subhalo populations in the Exploring the Local Volume In Simulations suite, we investigate the role of environmental processes in quenching star formation within the nearby field. Using model parameters that reproduce the satellite quenched fraction in the Local Group, we predict a quenched fraction – due solely to environmental effects – of ∼0.52 ± 0.26 within 1 < R/Rvir < 2 of the Milky Way and M31. This is in good agreement with current observations of the Local Volume and suggests that the majority of the passive field systems observed at these distances are quenched via environmental mechanisms. Beyond 2Rvir, however, dwarf galaxy quenching becomes difficult to explain through an interaction with either the Milky Way or M31, such that more isolated, field dwarfs may be self-quenched as a result of star-formation feedback.
1 INTRODUCTION
Recent observations of nearby dwarf galaxies show that low-mass systems (M⋆ ≲ 109 M⊙) currently residing >1 Mpc from a massive neighbour are almost exclusively star forming (Mateo 1998; Haines et al. 2008; Weisz et al. 2011; Geha et al. 2012). This is supported by H i observations of systems in the Local Volume, which find a predominately gas-rich field population (Spekkens et al. 2014). Together, these results indicate that low-mass systems largely lack the ability to cease forming stars, or quench, in the field. In other words, ‘in situ’ processes, such as morphological quenching (Martig et al. 2009) or stellar feedback (Larson 1974; Dekel & Silk 1986) that operate on more massive field galaxies appear unable to shut down star formation at the lowest galaxy masses.
In contrast to the local field population, the low-mass satellites of the Local Group are nearly universally quenched (e.g. Mateo 1998; Grcevich & Putman 2009; Spekkens et al. 2014). This dramatic difference in the star-forming properties of low-mass field and satellite galaxies strongly indicates that environmental mechanisms are responsible for quenching low-mass systems. Moreover, the environmental mechanism at play must act with great efficiency (i.e. rapidly following infall; Fillingham et al. 2015; Wetzel et al. 2015). Using N-body simulations to model the accretion history of satellites in the Local Group, Fillingham et al. (2016) present a coherent picture of satellite quenching as a function of satellite and host mass in which satellites above a host-dependent, critical mass scale are quenched via starvation while low-mass systems are rapidly quenched via stripping. This model is supported by complementary observations of satellite populations in the local Universe, such that it reproduces the fraction of quenched satellites at z ∼ 0 over a broad range of masses (e.g. De Lucia et al. 2012; Wetzel et al. 2013; Davies et al. 2016; Stark et al. 2016).
Studies of dark matter halo populations within N-body simulations, however, show that a significant fraction of low-mass haloes residing just beyond the virial radius (Rvir) of a massive halo today were previously located within Rvir (Balogh et al. 2000; Mamon et al. 2004; Gill et al. 2005; Teyssier et al. 2012; Wetzel et al. 2014). For example, Garrison-Kimmel et al. (2014) find that these so-called ‘backsplash’ haloes comprise roughly |$50\hbox{ per cent}$| of systems in the Local Volume (i.e. within 1 < R/Rvir < 2 of the Milky Way). Given this sizable backsplash population, highly efficient satellite (or environmental) quenching, needed to reproduce the Local Group satellite population at low masses, could be expected to produce a non-negligible number of quenched galaxies in the field – potentially in conflict with current observations.
In this work, we utilize a suite of N-body simulations to investigate the degree to which environmental quenching models reproduce the observed population of quenched field galaxies that are currently known to reside beyond the virial radius of either the Milky Way or M31 (i.e. in the Local Volume). Specifically, does the model of satellite quenching presented by Fillingham et al. (2015, 2016) overproduce the relative number of quenched systems in the field? For more massive galaxies (∼109.5 M⊙), where environmental quenching is less efficient, Wetzel et al. (2014) show that observations agree with the expectations of the model, with |${\sim}40\hbox{ per cent}$| of systems within ∼2Rvir of local groups and clusters likely quenched by environmental effects. In Section 2, we detail the observational and simulation data used in this analysis. Additionally, we introduce the quenching models that facilitate comparison between observations and theory. In Sections 3 and 4, we present our results and discuss any implications and limitations this analysis might have on the current galaxy evolution paradigm. Finally, in Section 5, we summarize this work and discuss how ongoing efforts will clarify and enhance this framework of environmental quenching of dwarf satellite galaxies. Where necessary, we adopt a ΛCDM cosmology with the following parameters: σ8 = 0.801, Ωm = 0.266, ΩΛ = 0.734, ns = 0.963, and h = 0.71 (WMAP7; Larson et al. 2011).
2 DATA AND MODELS
2.1 Local volume dwarfs
Our sample of local dwarf galaxies is drawn from the compilation of McConnachie (2012). The data set builds upon the low-mass satellite sample from Fillingham et al. (2015) by extending beyond the virial radius of the Milky Way and M31 systems while maintaining the same stellar mass range in order to facilitate a clean comparison to the known classical satellites of the Local Group. Our field population is selected to be in the stellar mass range ∼106–108 M⊙ and within 1.2 Mpc of either the Milky Way or M31. While this stellar mass range leads to a complete sample of dwarf galaxies inside the virial radius of the Milky Way and out to 0.5Rvir in M31, the field sample within the Local Volume is potentially incomplete at these stellar masses.
Whiting et al. (2007) demonstrate that all-sky surveys using photographic plates are complete down to a surface brightness of ∼25.5 mag arcsec−2. This roughly corresponds to And V (M⋆ ∼ 4 × 10⁵ M⊙) at the distance of M31, suggesting that we are largely complete for stellar masses above a few × 105 M⊙ out to distances of at least ∼750 kpc from the Milky Way. Inside the footprints of the Sloan Digital Sky Survey (York et al. 2000) and the Dark Energy Survey (The Dark Energy Survey Collaboration 2005; Diehl et al. 2014), however, dwarf galaxy samples are complete well below our lower stellar mass limit of M⋆ = 106 M⊙ out to distances of (at least) 1.5 Mpc from the Milky Way (Koposov et al. 2008; Tollerud et al. 2008; Walsh et al. 2009; Jethwa et al. 2016; Newton et al. 2017). Finally, while all optical imaging data sets will suffer incompleteness due to obscuration by the disc of the Milky Way, assuming the dwarf galaxy population is not biased in a manner where quenched (or star-forming) objects preferentially reside behind the disc, our results should not be strongly affected by this incompleteness.
Our final sample includes 11 dwarf galaxies in the field within 1.2 Mpc in addition to the previously identified 12 satellite galaxies from Fillingham et al. (2015). The left-hand panel of Fig. 1 shows the host-centric radial velocities for our sample (McConnachie 2012; Tollerud et al. 2012; Makarova et al. 2017), scaled by |$\sqrt{3}$| to approximately account for tangential motion, as a function of distance to the nearest host (Milky Way or M31). The vertical dotted line at 300 kpc denotes the approximate location of the virial radius in a Milky Way-like dark matter halo. Throughout this work, we adopt Rvir = 300 kpc for both the Milky Way and M31. The dashed lines illustrate the region in which a subhalo is likely bound to the host, assuming a Navarro–Frenk–White (NFW) dark matter halo profile (Navarro et al. 1997) with a virial mass of 2 × 10¹² M⊙ and a concentration of 8.
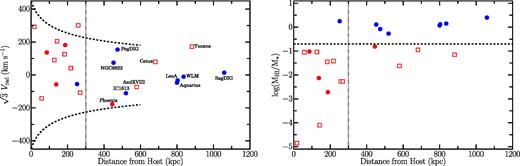
Left: Host-centric radial velocity (scaled by |$\sqrt{3}$| to approximately account for tangential motion) for all known Local Volume dwarf galaxies in the stellar mass range 106–108 M⊙ as a function of distance from the nearest host (either the Milky Way or M31). The dotted vertical line roughly corresponds to the virial radius of a Milky Way-like host and the dashed lines correspond to the boundary between bound and unbound systems. Satellite points are colour-coded according to their observed H i gas fraction, with blue (and red) points denoting gas-rich (and gas-poor) systems, respectively. The closed points signify H i detections, while the open points correspond to upper limits on the total H i mass. Right: The gas fraction (|$M_{\rm H{\small I}}/{M}_{\star}$|) as a function of distance from the nearest host for the same dwarf galaxies as in the left-hand panel. The horizontal dashed line corresponds to a gas fraction of 0.2, below which systems are considered quenched.
In the right-hand panel of Fig. 1, we show the H i gas fraction for each dwarf in our sample as a function of host-centric distance. The filled points correspond to H i detections while the open points denote upper limits (Hunter et al. 2012; McConnachie 2012; Spekkens et al. 2014). To separate gas-rich, star-forming systems from gas-poor, quenched systems, we divide the sample based on the H i gas fraction (|$M_{\rm H{\small I}}/{M}_{\star}$|). Galaxies with an H i gas fraction above 0.2 are considered star forming, while galaxies with H i gas fractions below 0.2 are quenched. The points in Fig. 1 are colour-coded according to this classification, with blue and red points corresponding to star-forming and quenched dwarfs, respectively. Our resulting quenched fraction in the local field is fquench = 0.36 ± 0.15, assuming a binomial error on the measured quenched fraction. The measured quenched fraction is largely independent of host-centric distance, with fquench = 0.40 ± 0.22 within 1 < R/Rvir < 2 and fquench = 0.33 ± 0.19 within 2 < R/Rvir < 4, which suggests that our sample is not dramatically incomplete for passive systems at large distances. While varying the classification threshold for quenched versus star-forming systems will have a mild impact on the measured quenched fraction, it does not significantly change the qualitative results of this analysis.
As an independent measure of the quenched fraction, we also include data from the Updated Nearby Galaxy Catalog (UNGC; Karachentsev et al. 2013). Objects are selected according to the same stellar mass limits (106–108 M⊙), given their K-band magnitude and assuming a mass-to-light ratio of M/L = 1 (Bell & de Jong 2001). Due to the heterogeneity of star formation rate measurements within the UNGC, we instead use the morphology of each system as an indicator of its current star-forming activity. As an upper bound to the quenched fraction, we assume that both elliptical and transitional morphologies correspond to quenched galaxies, while the lower bound for fquench assumes only galaxies with elliptical morphologies are quenched. For each galaxy in the UNGC, which covers the entire Local Volume, we compute the distance to M31 and the Milky Way, adopting the lesser of the two as the host-centric distance. We then compute the quenched fraction, fquench, as a function of host-centric distance (see the grey shaded regions in Figs 2, 3, and 4). Our measured quenched fraction within the Local Volume is in good agreement with the observed fraction of early-type galaxies in the vicinity of other nearby massive hosts (Karachentsev & Kudrya 2015).
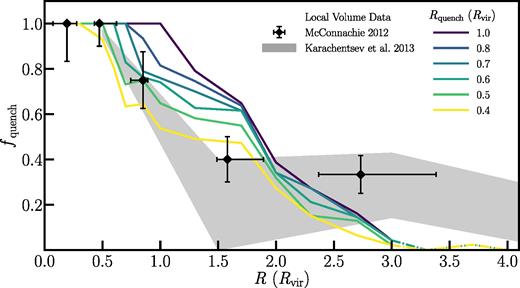
The quenched fraction as a function of host-centric distance for the Rquench model and Local Volume dwarfs. The black diamonds show the quenched fraction for our sample of Local Volume dwarfs (see Fig. 1) spanning five radial bins, with error bars on the host-centric distance corresponding to the 5th and 95th percentiles of the distribution in each respective bin and the error bars on fquench denoting the 2σ uncertainty assuming binomial statistics. The grey shaded region illustrates a complementary measurement of the quenched fraction in the Local Volume determined using the UNGC. The upper bound is determined by assuming that both elliptical and transitional morphologies are quenched systems, while the lower bound assumes that only elliptical systems are quenched. Finally, the coloured lines show the inferred quenched fraction in the ELVIS suite when varying the radius at which a subhalo is considered quenched, Rquench. Beyond 3Rvir, the model lines are dot–dashed to illustrate the point at which some of the simulations in the ELVIS suite are contaminated by low-resolution particles such that our modelling is less reliable. At R < 2Rvir, there is excellent agreement between the observed quenched fraction and a model with Rquench = 0.5Rvir, such that all low-mass dwarfs within ∼2Rvir of the Milky Way and M31 can be explained via environmental quenching. Beyond ∼2Rvir, the models cannot explain the observed quenched fraction such that these objects are likely self-quenching in the field.
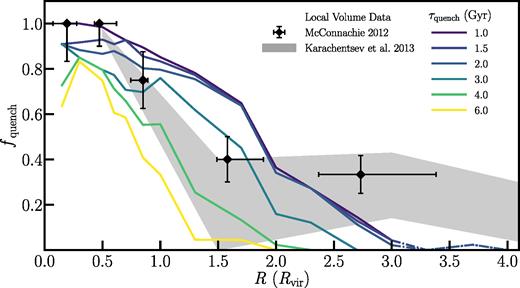
The quenched fraction as a function of host-centric distance for the τquench model and Local Volume dwarfs. The black diamonds show the quenched fraction for our sample of Local Volume dwarfs (see Fig. 1) spanning five radial bins, with error bars on the host-centric distance corresponding to the 5th and 95th percentiles of the distribution in each respective bin and the error bars on fquench denoting the 2σ uncertainty assuming binomial statistics. The grey shaded region illustrates a complementary measurement of the quenched fraction in the Local Volume determined using the UNGC, as detailed in Fig. 2. Finally, the coloured lines show the inferred quenched fraction in the ELVIS suite when varying the quenching time-scale from τquench = 1–6 Gyr. Beyond 3Rvir, the model lines are dot–dashed to illustrate the point at which some of the simulations in the ELVIS suite are contaminated by low-resolution particles such that our modelling is less reliable. While the satellite quenched fraction in the Local Group favours τquench = 1.5 Gyr, such a short quenching time-scale overproduces the observed quenched fraction at 1 < R/Rvir < 2 due to the contribution from backsplashing systems. Similar to the Rquench model, beyond ∼2Rvir the models cannot explain the observed quenched fraction such that these objects are likely self-quenching in the field.
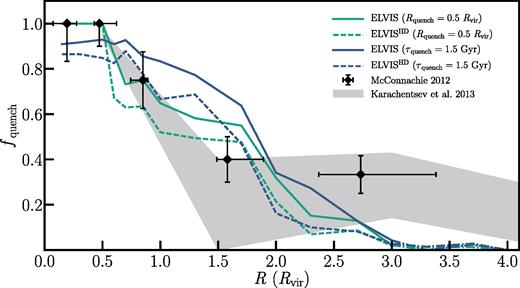
The quenched fraction as a function of host-centric distance for both the τquench and Rquench models in comparison to the corresponding measurement in the Local Volume. The solid lines are the result of applying the quenching models to the ELVIS dark matter-only simulations, while the dashed lines show how our results change when we include the effects of tidal disruption by the host potential (ELVISHD, see Section 4). The black diamonds and grey shaded region illustrate the measurements of the quenched fraction in the Local Volume as given in Fig. 2. As before, beyond 3Rvir the model lines are dot–dashed to illustrate the point at which some of the simulations in the ELVIS suite are contaminated by low-resolution particles. The inclusion of subhalo destruction due to tidal effects brings both models into better agreement with current observations, such that these models can fully explain the observed distribution of quenched dwarf galaxies within 2Rvir of both the Milky Way and M31. For all of our modelling, quenched dwarf galaxies that currently reside beyond 2Rvir cannot be fully explained via environmental quenching in either the Milky Way or M31 systems. Further emphasizing that self-quenching via star-formation feedback is the likely quenching scenario in these objects.
2.2 Simulations
The Local Group and its environs provide a unique laboratory for studying the details of how star formation in low-mass field and satellite galaxies is affected by the host environment. In order to take full advantage of this opportunity, a comparably specific suite of simulations is needed in order to understand both the details of the host environment and satellite population. That is, an unbiased comparison of observations in the Local Volume to galaxy formation and evolution theory requires simulations that span the entire Local Volume.
The Exploring the Local Volume in Simulations (ELVIS) project is a suite of cosmological zoom-in dark matter-only simulations and is comprised of 24 Milky Way-like hosts as well as 12 Local Group-like pairs (Garrison-Kimmel et al. 2014). Each simulated Local Volume provides complete halo catalogues for Mhalo > 2 × 10⁷ M⊙ and Vmax > 8 km s−1 within a high-resolution region spanning 2–5 Mpc, so as to enable tracking of the orbital and accretion histories of all dark matter subhaloes that could potentially host an M⋆ > 106 M⊙ dwarf galaxy. In addition, the ELVIS suite of simulations is uncontaminated by lower resolution particles out to at least 3Rvir for each host, such that they reliably trace the properties of the nearby field dark matter halo population.
From ELVIS, we select dark matter haloes and subhaloes in the range Mpeak = 5 × 10⁹−6 × 10¹⁰ M⊙, which corresponds to M⋆ = 106–108 M⊙ via the abundance matching (or stellar mass–halo mass) relation of Garrison-Kimmel et al. (2014). Varying the abundance matching prescription only has a minor effect on thetypical infall times for subhaloes in this mass regime and thus a negligible impact on our results (Fillingham et al. 2015). In order to increase the precision at which we track subhalo accretion events, we interpolate, using a cubic spline, all of the dark matter halo properties in the ELVIS catalogue, following Fillingham et al. (2015).
2.3 Quenching models
The physical mechanisms that act upon a galaxy while in the vicinity of a more massive host are thought to suppress star formation through modification of the gas reservoir itself or by preventing the gas reservoir from replenishing its supply. However, there are many different potential mechanisms that can accomplish this and distinguishing which mechanism is operating in each satellite stellar mass regime can be challenging. In order to constrain the possible quenching mechanisms, our recent work has developed subhalo accretion-based models in N-body simulations that should capture the global properties of the quenching process and constrain the typical quenching time-scale (Wheeler et al. 2014; Fillingham et al. 2015). What follows is a brief description of both quenching models used in this work – see Fillingham et al. (2015) for a more detailed description.
2.3.1 Rquench Model
The first model that we examine is based on a ‘ram pressure-like’ quenching scenario where quenching will only occur once a satellite reaches a sufficient host circumgalactic medium (CGM) density and/or a high enough velocity relative to the host frame-of-reference, such that the ram pressure experienced by a satellite is capable of disrupting its gas reservoir. Both the host CGM density and typical satellite velocity scale with host-centric distance, such that a model which includes a radial quenching dependence can broadly capture how these processes should affect the subhalo (i.e. satellite galaxy) population.
Within this model, any subhalo that crosses within the quenching radius (Rquench) is instantaneously and permanently quenched, regardless of where the subhalo resides today. In contrast, those haloes that never pass within the quenching radius remain star forming. By varying the quenching radius (Rquench), in a manner similar to Fillingham et al. (2015), the model produces different quenched populations that can then be compared to the observed quenched fractions in the Local Volume, as shown in Fig. 2. This model naturally leads to a quenched fraction of unity inside of the adopted quenching radius.
2.3.2 τquench Model
The τquench model assumes that quenching occurs at some time, τquench, after a dark matter halo crosses within the virial radius of the host (i.e. once it becomes a subhalo). In other words, the adopted quenching time-scale (τquench) sets how long a dark matter halo must remain a subhalo before it is considered quenched. This model is able to approximate a ‘starvation-like’ scenario, where the infalling satellite galaxy has been cut off from cosmic accretion and therefore will stop forming stars when it runs out of its current reservoir of fuel (i.e. H i+H2 gas). For relatively short quenching time-scales, however, the model may also mimic suppression of star formation via ram-pressure stripping (e.g. where τquench roughly follows the crossing time of the host system).
Within this model, all subhaloes that remain inside the host dark matter halo at least as long as the quenching time-scale are instantaneously and permanently quenched. Subhaloes that enter and subsequently exit beyond the virial radius in less time than the quenching time-scale remain star forming. Such haloes are rare for short quenching time-scales (<2 Gyr), however, comprising <8 per cent of subhaloes at 1 < R/Rvir < 2 within our mass range. As shown in Fig. 3, by varying the quenching time-scale, the τquench model makes distinct predictions for how the quenched fraction depends on host-centric distance. Overall, a shorter time-scale produces more quenched systems.
3 RESULTS
For a wide range of quenching radii (Rquench) and time-scales (τquench), we apply the models described in Section 2.2 to the ELVIS subhalo populations. For each implementation of a given model, we measure the dwarf quenched fraction as a function of distance from the nearest host, extending to at least 3Rvir (or ≳0.9 Mpc for these Milky Way-like systems). Fig. 2 shows the results for the Rquench model, illustrating the quenched fraction, fquench, as a function of distance to the nearest host for values of Rquench ranging from 0.4Rvir to 1Rvir. For comparison, the black diamonds show the observed quenched fraction in the Local Volume covering five bins in host-centric distance and the grey shaded region shows the UNGC quenched fraction as described in Section 2.1.
Within the satellite population (R < Rvir), the observed quenched fraction is remarkably high (fquench ∼ 0.9), so as to favour a quenching radius of 0.5 ± 0.1Rvir (Fillingham et al. 2015). For a quenching radius on this scale, our Rquench model predicts a field quenched fraction of fquench = 0.52 ± 0.26 at 1 < R/Rvir < 2 (see Fig. 2).1 Overall, at R < 2Rvir, our quenching model with Rquench = 0.5Rvir is consistent with the observed field quenched fraction in the Local Volume, such that all passive systems at these distances can be explained through interactions with either the Milky Way or M31. Beyond 2Rvir, however, the backsplash fraction decreases dramatically such that the model predicts a quenched fraction ≲ 0.25 for all quenching radii. At these distances from a massive host, the observed quenched fraction begins to exceed what the models predict by roughly a factor of 2. The implications of this excess are discussed further in Section 4.
For the τquench model, the quenched fraction of the Local Group satellite population (i.e. at R < 1Rvir) is best reproduced by a quenching time-scale of τquench ∼ 1.5 ± 1 Gyr (Fillingham et al. 2015). As shown in Fig. 3, this relatively short quenching time-scale following infall yields a field quenched fraction of fquench = 0.65 ± 0.24 within 1 < R/Rvir < 2, due to the large population of backsplash haloes at that host-centric distance. Compared to observations of dwarf systems at similar distances in the Local Volume, this slightly overpredicts the fraction of quenched field galaxies. Meanwhile, at R > 2Rvir, the τquench models underpredict the fraction of passive systems found locally.
Ultimately, both the Rquench and τquench models do not dramatically overpredict the field quenched fraction within the Local Volume. Instead, the models offer a potential explanation for a substantial number of the quenched dwarf galaxies that are observed outside of the virial radius of either the Milky Way or M31 today. Both models, however, do struggle to explain quenched systems beyond ∼600 kpc from either of the Local Group hosts.
4 DISCUSSION
Recent work has shown that the vast majority of low-mass dwarf galaxies that reside in the field are star forming while a significant fraction that reside near a massive neighbour are quenched (e.g. Geha et al. 2012). A likely consequence of this scenario is that all quenched dwarf galaxies observed in this mass regime (M⋆ ≲ 109 M⊙) should have their star formation shut down via external, environmental processes. There have been many recent studies that test this picture under the assumption that the low-mass dwarf galaxy population in the Local Group is a representative of the Universe at large (e.g. Slater & Bell 2014; Wheeler et al. 2014; Weisz et al. 2015; Wetzel et al. 2015; Fillingham et al. 2015, 2016).
However, the environmental-only quenching hypothesis for low-mass galaxies can be called into question in the Local Volume since there have been numerous quenched dwarf galaxies discovered beyond the virial radius of their most massive nearby neighbour. This has led some studies to the conclusion that in situ quenching of field dwarf galaxies is potentially occurring (Makarova et al. 2017). In this work, we have shown that our models of environmental quenching (i.e. quenching that only occurs inside Rvir) can lead to a quenched fraction of ∼0.5 beyond the virial radius but within 2Rvir. Beyond 2Rvir, it becomes increasingly difficult to explain the number of quenched galaxies through an interaction with either the Milky Way or M31.
4.1 Baryonic effects on the dark matter distribution
As shown by D’Onghia et al. (2010), and more recently by Garrison-Kimmel et al. (2017) and Sawala et al. (2017), the baryonic component of the host system can substantially alter the final subhalo distribution inside the virial radius at z = 0 (relative to that found in a pure N-body simulation such as ELVIS). Due to tidal forces, subhalo destruction preferentially occurs in objects with early infall times and/or more radial orbits. As such, the distribution of subhalo infall times for a dark matter-only simulation (such as ELVIS) will be biased towards earlier cosmic times. Given our quenching models, which are directly connected to the accretion and orbital history of subhaloes, this bias will skew the inferred quenched fractions as a function of host-centric distance.
In the Rquench model, the inclusion of the host system’s baryonic potential will destroy many subhaloes that plunge deep into the central regions of the host halo on highly radial orbits. Given that the majority of these systems will have pericentric passages within our adopted quenching radius, our model as applied to ELVIS is likely biased towards greater fquench (see Fig. 2). Specifically, we have counted subhaloes as ‘quenched’ that would have been destroyed through interactions with a host baryonic potential, therefore overpredicting the quenched fraction within the Local Volume. Similarly, in the τquench model as applied to ELVIS, we again overpredict the environmental quenched fraction, since the typical surviving subhalo in ELVIS spends more time inside the virial radius of the host. Subhaloes accreted at early cosmic time, which are more likely to be tidally disrupted, are classified as quenched within our model, thereby overcounting the true number of quenched subhaloes that survive to z = 0.
To mimic the disruption of subhaloes in ELVIS, we adopt (NDMO/NFIRE)−1 as the likelihood that a subhalo survives as a function of pericentric distance. Beyond 50 kpc, we assume no subhalo destruction. Within ELVIS, we then randomly destroy subhaloes as a function of their pericentric distance given this probability of survival. The results of this exercise can be seen in Fig. 4 for the preferred values adopted in both the Rquench and τquench models. For both models, we find a decrease in the quenched fraction relative to the same model applied to the dark matter-only simulations, with the difference being particularly strong for measurements of fquench outside of Rvir. Overall, the inclusion of tidal effects brings our model predictions into better agreement with the star-forming properties of dwarfs at R < 2Rvir. At R ≳ 2Rvir, however, tidal disruption has relatively little impact on the number of low-mass haloes, with environmental processes unable to explain the suppression of star formation in the most distant dwarfs. Finally, it should be noted that the subhalo survival fraction given in equation (1) is derived from a sample dominated by low-mass systems, such that our subhalo destruction model will likely overpredict the effect for the ‘classical’ dwarfs. A conservative interpretation would be to treat the results of our tidal disruption models (as shown in Fig. 4) as a lower limit on the predicted quenched fraction in the Local Volume.
4.2 Quenched dwarfs in the field
As shown in Section 3, several of the passive dwarf systems in the local field population are potentially the product of environmental quenching mechanisms. Specifically, And XVIII, Phoenix, and Cetus currently reside within 2Rvir of their nearest host, such that they can potentially be explained with this model. Weisz et al. (2014) measured the star formation histories (SFHs) inferred from colour–magnitude diagrams of resolved stars in Cetus and Phoenix (see also Hidalgo et al. 2009; Monelli et al. 2010a,b, 2012). Both objects are consistent with a quenching event occurring roughly 2 Gyr ago. Additionally, Makarova et al. (2017) inferred a relatively recent star formation event in And XVIII, approximately 1.5 Gyr ago. The quenched backsplash subhaloes in our models that are currently located at similar distances from their most massive neighbour have a mean lookback time to infall of tinfall = 5.5 ± 1.5 Gyr. Assuming a quenching time-scale (τquench) of ∼2 Gyr, this suggests a quenching time of ∼2–5 Gyr ago, consistent with the quenching times inferred from the measured SFHs of Cetus, Phoenix, and And XVIII. Lower mass quenched systems within 2Rvir (e.g. Eri II, Bechtol et al. 2015; Koposov et al. 2015) could have been influenced by environmental processes, however it is likely that reionization is at play in quenching the lowest mass dwarfs independent of environment (Brown et al. 2014; Wimberly et al. in preparation).
At >2Rvir, there are several passive dwarfs with M⋆ ∼ 106–108 M⊙ in the Local Volume: Tucana, KK258, KKs3, and KKR 25 (Lavery & Mighell 1992; Makarov et al. 2012; Weisz et al. 2014; Karachentsev et al. 2014, 2015a,b). These are very unlikely to have been quenched as a result of interaction with either the MW or M31. Instead, star formation in these systems was most likely suppressed via in situ processes. One possibility is highly efficient feedback, relative to the depth of the dark matter potential, that sufficiently disrupts the gas reservoir such that star formation is halted (if not completely shut down). Dwarf galaxies quenching in isolation (i.e. in the field), independent of environment, have been found in hydrodynamic simulations and can offer insight into the mechanisms responsible for shutting down star formation in these isolated dwarf galaxies (e.g. Fitts et al. 2017).
5 SUMMARY
Based on our analysis of quenching models applied to high-resolution N-body simulations, we show that the highly efficient environmental quenching, required to suppress star formation in the Local Group satellite population, does not overpredict the fraction of quenched systems in the local field. Within 2Rvir of the Milky Way and M31, the passive population at 106 < M⋆/M⊙ < 108 is consistent with being quenched by environmental processes. Moreover, beyond the Local Volume, we conclude that environmental mechanisms are likely at play in quenching a significant fraction of the low-mass (M⋆ ≲ 108 M⊙), passive field systems observed in the local Universe (see also Simpson et al. 2018). Passive dwarfs at R ≳ 2Rvir, such as Tucana or KK25, are unlikely to have been quenched due to interaction with the Milky Way or M31. Instead, these systems may represent a tail of the star-forming field population, quenched by highly efficient feedback (e.g. Wang et al. 2015; Di Cintio et al. 2017; Fitts et al. 2017). Altogether, our work adds further support to the model of satellite quenching outlined by Fillingham et al. (2015, 2016), in which low-mass (M⋆ ≲ 108 M⊙) satellites are rapidly quenched following infall on to a Milky Way-like host.
In conclusion, it should be noted that the broader impact of our work relies on the assumption that the star-forming properties of the Local Group and surrounding Local Volume are cosmologically representative (i.e. are not atypical; Boylan-Kolchin et al. 2016). Studies of low-mass satellites in other nearby systems, however, find a similarly high quenched fraction like that observed in the Local Group (e.g. Kaisin & Karachentsev 2013). Moreover, by stacking photometric measurements of satellite populations surrounding a large sample of local Milky Way-like host systems in wide-field imaging data sets, Phillips et al. (in preparation) measure a satellite quenched fraction of fquench ∼ 0.7 at M⋆ ∼ 106–9 M⊙ in broad agreement with that observed in the Local Group. On the other hand, observations of the NGC 4258 group find a significant number of blue, likely star-forming, satellites with M⋆ < 108 M⊙ (Spencer et al. 2014). In addition, recent work by Geha et al. (2017) to spectroscopically identify a large population of low-mass satellites orbiting Milky Way analogues finds very few passive systems, suggesting that the high satellite quenched fraction within the Local Group may be very atypical. Without question, more work remains to fully place the Milky Way (and more broadly the Local Group) in a cosmological context.
Footnotes
The reported quenched fraction for both models is the mean quenched fraction in that distance range and the uncertainty is the 1σ scatter in the quenched fraction as measured individually for each ELVIS host.
ACKNOWLEDGEMENTS
We thank Tyler Kelley, Dan Weisz, Josh Simon, Andrew Wetzel, and Walden Cassotto for helpful discussions regarding this work. We also thank the anonymous referee for providing comments that helped clarify our work. This work was supported in part by NSF grants AST-1518257, AST-1517226, AST-1009973, and AST-1009999. Additional support was also provided by NASA through grants AR-12836, AR-13242, AR-13888, AR-13896, GO-14191, and AR-14289 from the Space Telescope Science Institute, which is operated by the Association of Universities for Research in Astronomy, Inc., under NASA contract NAS 5-26555. MBK acknowledges support from NASA through grant NNX17AG29G. Support for SGK was provided by NASA through Einstein Postdoctoral Fellowship grant number PF5-160136 awarded by the Chandra X-ray Center, which is operated by the Smithsonian Astrophysical Observatory for NASA under contract NAS8-03060. CW was supported by the Lee A. DuBridge Postdoctoral Scholarship in Astrophysics.
This research made extensive use of Astropy, a community-developed core Python package for Astronomy (Astropy Collaboration 2013). Additionally, the Python packages NumPy (Walt et al. 2011), iPython (Pérez & Granger 2007), SciPy (Jones et al. 2001), and matplotlib (Hunter 2007) were utilized for our data analysis and presentation.
REFERENCES
Author notes
Einstein fellow
DuBridge fellow
