


Abstract
We present the results of simultaneous Suzaku and NuSTAR observations of the nearest low-luminosity active galactic nucleus (LLAGN), M81*. The spectrum is well described by a cut-off power law plus narrow emission lines from Fe K α, Fe xxv, and Fe xxvi. There is no evidence of Compton reflection from an optically thick disc, and we obtain the strongest constraint on the reflection fraction in M81* to date, with a best-fitting value of R = 0.0 with an upper limit of R < 0.1. The Fe K α line may be produced in optically thin, |$N_{\rm H} = 1 \times 10^{23} {\rm \,cm}^{-2}$|, gas located in the equatorial plane that could be the broad line region. The ionized iron lines may originate in the hot, inner accretion flow. The X-ray continuum shows significant variability on ∼40 ks time-scales suggesting that the primary X-ray source is ∼100 s of gravitational radii in size. If this X-ray source illuminates any putative optically thick disc, the weakness of reflection implies that such a disc lies outside a few ×103 gravitational radii. An optically thin accretion flow inside a truncated optically thick disc appears to be a common feature of LLAGN that are accreting at only a tiny fraction of the Eddington limit.
1 INTRODUCTION
M81, also known as NGC 3031, is a spiral galaxy hosting the closest low-luminosity active galactic nucleus (LLAGN), M81*, at a distance of 3.63 Mpc (Freedman et al. 1994). Its central black hole has a mass of M = 7 × 10⁷M⊙ (Devereux et al. 2003). The bolometric luminosity of M81* is |$9.3\,\times \,10^{40}\,{\rm \,erg\,s}^{-1}$| (Ho et al. 1996), which corresponds to 1.1 × 10⁻⁵ LEdd, where LEdd is the Eddington luminosity. Thus, logarithmically speaking, M81* is midway between ultra-low Eddington fraction accreters such as Sgr A* at the centre of the Galaxy with LSgr A* ∼ 3 × 10⁻¹⁰ LEdd (Melia & Falcke 2001) and a typical high-efficiency active galactic nucleus (AGN) with LAGN ∼ 0.1–1 LEdd. M81* is particularly interesting to study because it is nearby and bright enough to allow detailed spectroscopy, while being in the sub-Eddington regime in which the accretion flow is thought to be qualitatively different to that of an efficiently radiating, high accretion rate AGN.
Orbiting the black hole in M81* at large, ∼10 pc, scales is a disc inclined at 14° to the line of sight (i.e. the angle between the normal to the disc and the observer is 14°) as measured from its narrow optical emission lines (Devereux et al. 2003). On smaller scales, there is a 0.8 pc radius (2.5 × 10⁵ rg, where rg = GM/c2) disc inclined at 50° to the line of sight, the presence of which is inferred from its broad H α line (Devereux & Shearer 2007) . The inclination angle of this inner disc is consistent with that of the short, 0.017 pc long, radio jet from the nucleus which is also inclined at 50° (i.e. the jet is perpendicular to the inner disc; Bietenholz et al. 2000). These observations suggest that there is a warp between the sub-pc and 10 pc-scale discs.
The thin disc does not extend all the way into the event horizon of the black hole. While X-ray observations with ASCA (Ishisaki et al. 1996) revealed a possibly broadened Fe K line with an equivalent width (EW) of 170 eV, no strong Compton reflection component was detected. Subsequent observations with BeppoSAX detected a broad complex of Fe lines with the same EW, 170 eV, but again no Compton reflection component. The BeppoSAX spectrum extended to over 100 keV allowing the reflection fraction R = Ω/2π, where Ω is the solid angle subtended by the optically thick gas from the point of view of the X-ray continuum source, to be constrained to be R < 0.3 (Pellegrini et al. 2000). More recent observations with XMM–Newton were able to resolve the broad Fe K complex into three separate lines of almost equal strength due to Fe K α, Fe xxv, and Fe xxvi with EWs of 39, 47, and 37 eV, respectively (Page et al. 2004). High-spectral-resolution observations with the Chandra High-Energy Transmission Gratings Spectrometer (HETGS) showed that the Fe xxvi line is redshifted by |${\sim } 2500 {\rm \,km\,s}^{-1}$| while the neutral Fe K α line, with an EW of 47 eV, is consistent with being at rest (Young et al. 2007). The Fe K α line is unresolved, with a full width at half-maximum (FWHM) of <4670 |${\rm \,km\,s}^{-1}$|. For a disc inclined at 50°, this requires rin ≳ 104rg. For a face-on disc, however, the constraint is much weaker and formally fitting a diskline model (Fabian et al. 1989) only constrains rin > 55 rg (Young et al. 2007) . The Si K α line appears to be broadened, with a FWHM |${\sim } 1433 {\rm \,km\,s}^{-1}$| which corresponds to rin ≃ 105rg in a disc inclined at 50°. This radius is comparable to that of the broad H α emitting gas. In this truncated disc model, the inner accretion flow is optically thin, radiatively inefficient, and may produce the ionized Fe xxv and Fe xxvi emission lines, characteristic of emission from plasma at temperatures of 107–|$10^8 {\rm \,K}$| close to the truncation radius (see Young et al. 2007, for more details of this model). The origin of the Fe K α line is less straightforward.
X-ray monitoring of M81* has shown the continuum power-law photon index to be anti-correlated with X-ray flux, so the source is harder when it is brighter (Miller et al. 2010; Connolly et al. 2016). This is consistent with models in which the continuum is produced by the inner accretion flow which Comptonizes seed photons from the inner edge of truncated disc, with changes in photon index associated with changes of the truncation radius (e.g. Skipper et al. 2013).
In this paper, we address the questions of where the Fe K α line originates, what is the geometry of the inner accretion flow, and what is the transition radius between the outer thin disc and inner thick disc. To answer these questions we make use of simultaneous Suzaku and NuSTAR observations to measure the strength of the Fe K α line, Compton reflection hump, and hence reflection fraction. In this way, we hope to disentangle whether the Fe K α line is produced by scattering in optically thin gas, or is produced by reflection from an optically thick disc.
M81* has a redshift of z = −0.0001. The Galactic column density in this direction is |$N_{\rm H} ({\rm Gal}) = 4.22 \times 10^{20} {\rm \,cm}^{-2}$| .
2 OBSERVATIONS
The X-ray data presented here come from a coordinated NuSTAR and Suzaku observing programme in 2015 May. The observing times are simultaneous for about 2 d, while the NuSTAR observations extend for a further 2 d, as illustrated in Fig. 1 and summarized in Table 1. In addition, we have contemporaneous Swift X-ray and the Arcminute Microkelvin Imager (AMI) radio observations that will be presented elsewhere.
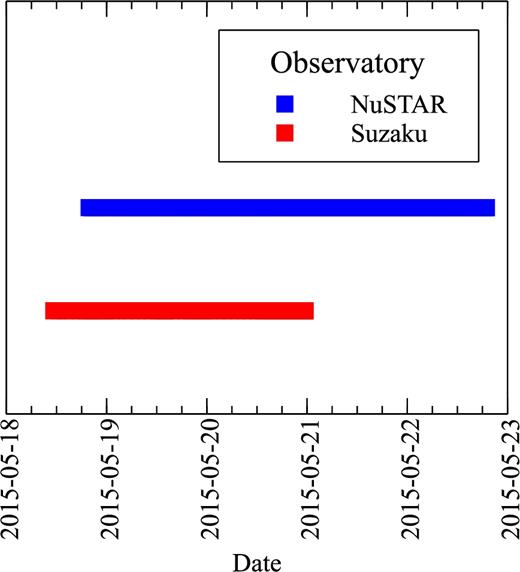
Date and time of observations of M81* with NuSTAR (top) and Suzaku (bottom). There are about 2 d of strictly simultaneous observation with both observatories.
Observations of M81* taken with NuSTAR and Suzaku showing the start time and total good time (averaged over the active instruments for each observatory).
| Observatory | Start date | Total good time |
|---|---|---|
| NuSTAR | 2015-05-18 | 209 ks |
| Suzaku | 2015-05-18 | 99 ks |
| Observatory | Start date | Total good time |
|---|---|---|
| NuSTAR | 2015-05-18 | 209 ks |
| Suzaku | 2015-05-18 | 99 ks |
The X-ray data were extracted and analysed using heasoft version 6.18, using standard processing techniques as described below.
2.1 NuSTAR
The NuSTAR data, from ObsID 60101049002, were processed using caldb version 20150702. The standard NuSTAR pipeline processing tools, nupipeline and nuproducts, were used to produce spectra and light curves. The on-source time was 343 ks which resulted in a total good exposure time of 209 ks, where the difference between these two times is mostly due to the lost exposure time caused by the Earth occultations and passages through the South Atlantic Anomaly (SAA) each orbit. Source counts were extracted from a circular aperture of radius 100 arcsec centred on M81*, with background counts taken from a source-free circular aperture of the same radius to the north of the nucleus. The spectra from modules A and B were fit jointly, rather than being combined.
The NuSTAR full-band, 3–79 keV, background subtracted light curve in 1000 s bins was produced using the pipeline, and is shown in Fig. 2. The error in the source and background counts was given by |$\sqrt{N}$|, where N is the number of counts in a bin, and these errors were propagated through the calculation to give the error bars shown in the figure.
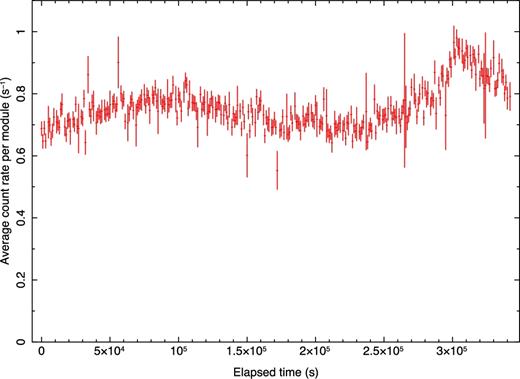
NuSTAR full-band, 3–79 keV, background subtracted light curve of M81* averaging the count rates of modules A and B. Significant, |${\sim } 30\, {per\,cent}$|, variability is seen on time-scales of |${\sim } 40 {\rm \,ks}$|.
2.2 Suzaku
The Suzaku data, from ObsID 710017010, were processed using the caldb with XIS calibration products dated 2015-01-05 and XRT mirror calibration products dated 2011-06-30. The HXD was not used during this observation. The on-source time was 217 ks which resulted in a total good exposure time of 98 ks for XIS 0 and 100 ks for XIS 1 and 3. The good time is significantly shorter than the observation duration due to the low Earth orbit of the satellite resulting in the Earth occultations and passage through the SAA. Source counts were extracted from a circular aperture of radius 260 arcsec centred on M81*, excluding the region within 100 arcsec of the ultra-luminous X-ray source (ULX) M81* X-6 that is ∼200 arcsec south of the nucleus. Background counts were taken from a source-free circular aperture of radius 150 arcsec to the northeast of the nucleus. The spectra from XIS 0, 1, and 3 were not combined, but fit jointly.
Note that during these observations there was a problem with charge leakage in XIS 0 that resulted in telemetry saturation and therefore some data drop-outs that were taken care of with the pipeline processing. This is likely related to the expansion of the dead area of XIS 0 as described in the ISAS memo JX-ISIS-SUZAKU-MEMO-2015-05.1
2.3 Spectral fitting
We simultaneously fit the three Suzaku XIS spectra and the two NuSTAR spectra. To account for calibration differences between instruments and detectors the spectral model is multiplied by a (different) constant for each detector. We find that the two NuSTAR telescope modules agree very well. If the normalization of FPMA is fixed at unity, the normalization of FPMB is ∼1.02, well within the anticipated calibration uncertainty.2 With Suzaku the XIS 1 and 3 detectors are in good agreement with one another, and within about 4 per cent of the NuSTAR detector normalization. The constant used for XIS 1 is ∼0.94 and the constant for XIS 3 is ∼0.98. The constant for XIS 0, however, is ∼0.85, which is lower than expected but likely linked to problems with the XIS 0 charge leakage. However, there is no apparent difference in the shape of the spectrum from XIS 0 when we compare the residuals of fit models to individual detectors. The precise values of these normalizations change slightly from fit to fit. Unless otherwise stated, the data are binned such that each point in the spectrum from an individual satellite has a signal-to-noise ratio of at least 20; the background is included in this calculation.
3 RESULTS
3.1 Light curve
The full-band, 3–79 keV, background subtracted NuSTAR light curve is shown in Fig. 2 and shows that there is significant, |${\sim } 30\, {per\,cent}$|, variability on time-scales of |${\sim } 40 {\rm \,ks}$|. For a black hole mass of 7 × 10⁷ M⊙, 40 ks corresponds to the light crossing time of 116 rg. This suggests that a significant fraction of the X-ray continuum originates in a very compact region within a few hundred gravitational radii of the black hole.
3.2 Simple spectral models
If we model the 0.5–30 keV continuum as an absorbed power law, we find significant residuals in the 6–7 keV band due to iron. Excluding the 5–8 keV band and refitting, we obtain a good description of the continuum with |$\Gamma = 1.89^{+0.01}_{-0.01}$| and |$N_{\rm H} = 6.9^{+0.2}_{-0.2} \times 10^{20} {\rm cm}^{-2}$|, having χ2/d.o.f. = 2545/2193 = 1.16 (where d.o.f. means degrees of freedom). The error bars on parameter values give the 90 per cent statistical confidence interval for one interesting parameter (i.e. corresponding to Δχ2 = 2.71).
We now include the Fe K band. The iron lines are described by narrow Gaussian lines fixed at 6.40 keV, 6.68 keV, and 6.96 keV, representing neutral Fe K α, He-like Fe xxv, and H-like Fe xxvi, respectively. This fit is shown in Fig. 3, and the model parameters for all fits are given in Table 3. The normalizations of each of the lines are free parameters. The spectrum continues to be well described by a power law of photon index |$\Gamma = 1.89^{+0.00}_{-0.01}$|, column density |$N_{\rm H} = 6.9^{+0.2}_{-0.3} \times 10^{20}\, {\rm cm}^{-2}$|, with line strengths and EWs as given in Table 2. This is a good fit, with χ2/d.o.f = 2933/2550 = 1.15. The Suzaku data allow us to accurately measure the strength of the neutral Fe K α line while cleanly separating the contribution of Fe xxv and Fe xxvi in this band. This is important because the neutral reflection we wish to constrain is only expected to contribute to the neutral Fe K α line. The 0.5–10 keV model flux and luminosity are 3.2 × 10⁻¹¹ergcm−2 s−1 and 5.1 × 1040 ergs−1, respectively.
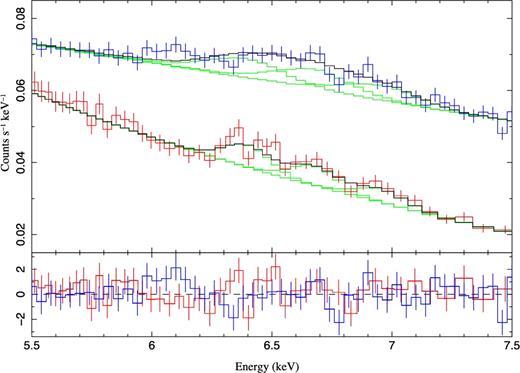
The Fe K band of M81* from the NuSTAR (blue points) and Suzaku (red points) observations. The upper panel shows the data, model (black line), and model components folded through the instrument responses (green lines) while the lower panel shows the residuals. Three narrow Gaussian lines have been added at 6.40 keV, 6.68 keV, and 6.96 keV representing neutral Fe K α, Fe xxv, and Fe xxvi, respectively. The Suzaku data are able to cleanly separate these lines.
Fe K lines in M81* measured from joint fits to the NuSTAR and Suzaku data. The fourth column shows the equivalent width (EW) of each line.
| Energy | Line | Normalization | EW |
|---|---|---|---|
| (keV) | ID | (×10−6 phcm−2 s−1) | (eV) |
| 6.40 | Fe K α | |$8.5^{+1.6}_{-1.6}$| | |$40^{+8}_{-7}$| |
| 6.68 | Fe xxv | |$7.6^{+1.7}_{-1.6}$| | |$38^{+8}_{-9}$| |
| 6.96 | Fe xxvi | |$6.0^{+1.5}_{-1.5}$| | |$33^{+8}_{-9}$| |
| Energy | Line | Normalization | EW |
|---|---|---|---|
| (keV) | ID | (×10−6 phcm−2 s−1) | (eV) |
| 6.40 | Fe K α | |$8.5^{+1.6}_{-1.6}$| | |$40^{+8}_{-7}$| |
| 6.68 | Fe xxv | |$7.6^{+1.7}_{-1.6}$| | |$38^{+8}_{-9}$| |
| 6.96 | Fe xxvi | |$6.0^{+1.5}_{-1.5}$| | |$33^{+8}_{-9}$| |
Summary of continuum models. Note that these models include Gaussian lines with strengths consistent with those given in Table 2, except the mytorus model which only has additional Fe xxv and Fe xxvi lines because it self-consistently includes its own neutral Fe K α line. The photon index and normalization of the mytorus component apply to the power-law continuum and all components of the mytorus model were appropriate; see the text for more details. i is the inclination angle of the observer. f denotes a frozen parameter.
| Model | Γ | NH | i | R | Ecut | Norm | χ2/d.o.f. |
|---|---|---|---|---|---|---|---|
| (cm−2) | (°) | (keV) | |||||
| powerlaw | |$1.89^{+0.00}_{-0.01}$| | |$6.9^{+0.2}_{-0.3} \times 10^{20}$| | 7.1 ± 0.1 × 10⁻³ | 2933/2550 | |||
| cut-off powerlaw | |$1.86^{+0.01}_{-0.01}$| | |$6.3^{+0.3}_{-0.3} \times 10^{20}$| | |$267^{+133}_{-67}$| | |$7.0^{+0.1}_{-0.1} \times 10^{-3}$| | 2908/2549 | ||
| pexrav | |$1.86^{+0.01}_{-0.01}$| | |$6.3^{+0.3}_{-0.3} \times 10^{20}$| | <0.11 | |$220^{+173}_{-86}$| | |$7.0^{+0.1}_{-0.1} \times 10^{-3}$| | 2910/2548 | |
| absorption | |$5.9^{+0.3}_{-0.2} \times 10^{20}$| | ||||||
| mytorus | |$1.87^{+0.00}_{-0.01}$| | |$1.1^{+0.3}_{-0.2} \times 10^{23}$| | 50f | |$7.0^{+0.0}_{-0.1} \times 10^{-3}$| | 2837/2529 |
While the signal-to-noise ratio is dominated by the lowest energies, there is no strong evidence of a systematic deviation from the power law model at high energies, other than a slight hint of spectral softening above |${\sim } 15 {\rm \,keV}$|. This softening can be modelled by a cut-off power law with an e-folding energy of |$267^{+133}_{-67} {\rm \,keV}$|, with this one additional free parameter improving the fit by Δχ2 = 25, although the reduced χ2 value is essentially unchanged. There is, however, no clear evidence of any upturn in the spectrum at higher energies as one might expect if there were a strong Compton hump. At soft X-ray energies, a small amount of absorption is required in addition to the Galactic column, and this intrinsic absorption has been reported previously (e.g. Page et al. 2003). The best-fitting cut-off power law plus iron line model is shown in Fig. 4.
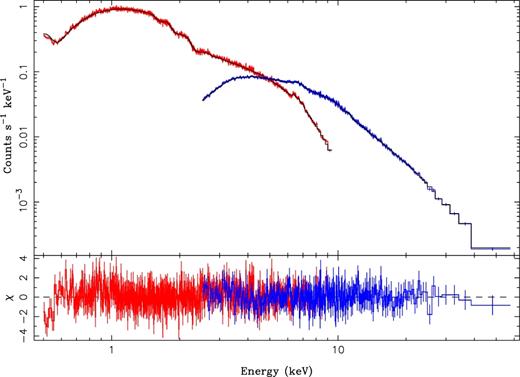
Suzaku (red) and NuSTAR (blue) spectra of M81*, with the best-fitting absorbed, cut-off power law plus three narrow Gaussian iron lines shown as the solid line. Residuals to this fit are in the lower panel. There is no evidence of a Compton reflection hump at high energies.
3.3 Optically thick reflection modelling of the continuum and iron lines
The continuum modelling described above does not suggest that there is any strong Compton reflection hump in the spectrum of M81*. We can measure the strength of any putative reflection continuum from optically thick material by including a Compton reflection component to the spectral model. We replace the cut-off power law model with the pexrav model in which the normalization, photon index, e-fold energy, and reflection fraction are free parameters. The disc inclination is fixed at 50°, although allowing this to be a free parameter does not change our conclusions. We find that the best-fitting value for R is consistent with zero, i.e. no reflection, with a 90 per cent upper confidence limit of R < 0.11, where R = 1 corresponds to an isotropic point source above an infinite disc covering |$2 {\pi} {\rm \, sr}$| of the sky. The power-law cut-off energy is constrained to be |$E_{\rm cut} = 220^{+173}_{-86} {\rm \,keV}$|. Contours of the constraints on these two parameters are shown in Fig. 5. Thus, the K α line cannot be produced by reprocessing in optically thick material.
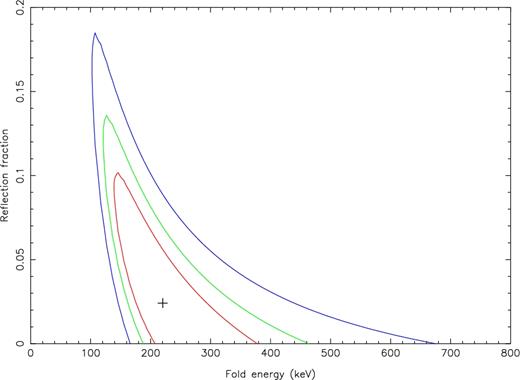
Constraints on the reflection fraction and power-law cut-off energy in M81*. The data are consistent with no reflection. The power-law cut-off energy is constrained to be |$E_{\rm cut} = 220^{+173}_{-86} {\rm \,keV}$|. Contours show the 68 per cent, 90 per cent, and 99 per cent confidence regions in red, green, and blue, respectively, with a 90 per cent confidence upper limit on R < 0.11. The best-fitting value is shown by the ‘+’ symbol.
3.4 Optically thin reprocessing modelling of the continuum and iron lines
An alternative scenario to reflection from Compton thick material for producing the neutral Fe K α line is that the line is produced by reprocessing in optically thin material which does not produce a strong Compton hump. We model the continuum, scattered, and iron line components from a centrally illuminated torus using the mytorus model applied to a power-law continuum with a 200 keV high energy cut-off (see Murphy & Yaqoob 2009; Yaqoob 2012, and the associated instruction manual for a full description of how this model is supposed to be used). The geometry is that of a torus with half-opening angle fixed at 60°, and we find an acceptable fit for viewing angle i < 60°, i.e. the view of the nucleus is unobscured by the torus. Note that acceptable fits might be possible with different opening angles for the torus but the version of mytorus we used has a fixed opening angle and an acceptable description could be found with this value. The iron K α line is then produced by scattering of the Γ = 1.9 power-law continuum by the optically thin3 torus with a column density |$N_{\rm H} = 1.1^{+0.3}_{-0.2}\,\times \,10^{23} {\rm \,cm}^{-2}$|. This provides a good description of the spectrum, with χ2/d.o.f. = 2837/2529 = 1.12.
The ‘torus’ might correspond to the broad line region (BLR). In M81*, |$1 {\rm \,pc} = 3\,\times \,10^5\,r_{{\rm g}}$|, so the size of the torus may be comparable to the size of the BLR which is particularly large in M81* with a radius of maybe ∼1pc (Devereux & Shearer 2007). So this hypothesis is compatible with the optical properties of the galaxy. The BLR might very well have a ‘torus’-like geometry because both disc and spherical geometries are able to explain the optical lines (Devereux & Shearer 2007). The column density NH ≃ 1 × 1023 cm−2 is a reasonable column density for a BLR cloud (e.g. Peterson 2006). Both the Fe K α line and velocity-resolved Si K α line (the latter reported by Young et al. 2007) could originate in the BLR. In this model the highly ionized Fe xxv and Fe xxvi lines would be associated with the inner hot, inefficient flow within a few thousand rg. Bianchi et al. (2007) reached a similar conclusion for NGC 7213. In some AGN, such as NGC 5548, the BLR can contribute significantly to the X-ray/optical lags (e.g. Fausnaugh et al. 2016).
4 DISCUSSION
We have considered two different scenarios to explain the overall Suzaku and NuSTAR observations of M81* and, in neither case, is there a detectable Compton hump, with a constraint on the reflection fraction R < 0.11. If the Fe K α line originates in reflection off Compton-thick material, the ∼40 eV EW of this line suggests that, for an illuminating continuum of Γ = 1.9 and solar abundances, the reflection fraction should be R ≃ 0.3–0.4 (e.g. George & Fabian 1991). An optically thick disc reflection origin for the Fe K α line is clearly ruled out. Furthermore, the observed limit on reflection fraction implies that the EW of the iron line should be |${\lesssim } 12 {\rm \,eV}$|, indicating that the majority of the Fe K α line flux we observe does not originate from disc reflection.
We can approximate the X-ray continuum source size as h ∼ 100 rg based on the variability time-scale (see Section 3.1). The weak reflection then suggests that if the disc is centrally illuminated by a source at height h, the inner radius rin ∼ 20 h ∼ 2 × 10³ rg (George & Fabian 1991). This all suggests that the inner accretion flow within at least a few ×103 rg is optically thin, and we have a very ‘clean’ view of the nucleus. The X-ray continuum source size we have assumed here is much larger than ≲4 rg typical of more Eddington luminous AGN (e.g. Emmanoulopoulos et al. 2014).
Instead of disc reflection, the Fe K α line is well explained by the mytorus model in which the continuum, scattered, and iron line components originate in an optically thin ‘torus’. The precise geometry of this model has not been fully explored, and is unlikely to be unique, but what we see is consistent with a torus of half-opening angle larger than the inclination angle of the inner disc, with a column density of |${\sim } 10^{23}\,{\rm \,cm}^{-2}$|. It is not clear at what distance this material lies from the nucleus, as that is not directly constrained by the model, but the torus might correspond to the BLR. A possible geometry for M81* is shown in Fig. 6. The BLR in M81* is unlikely to be an outflow, as a radiatively driven outflow cannot be supported by such a weak nucleus, so a disc or spherical inflow is a more plausible geometry (Devereux & Shearer 2007).

A cartoon of the possible geometry for M81*. The radial scale here is logarithmic, as follows. The region log (r/rg) ≤ 0.3 represents a Schwarzschild black hole (although we do not know the spin of the black hole in M81*). The region 0.3 < log (r/rg) ≤ 2 represents an optically thin (τ < 1), hot, and inefficient flow. The region 2 < log (r/rg) ≤ 5 represents some transition from optically thin to optically thick, the details of which are uncertain but it likely has a half-opening angle larger than 50° and a total column density |${\sim } 10^{23} {\rm \,cm}^{-2}$|; we have modelled this component with mytorus (Murphy & Yaqoob 2009; Yaqoob 2012). This is surrounded by a warped thin disc (τ ≫ 1) at log (r/rg) > 5. The viewing angle of 50° is equal to the inclination angle of the inner thin disk and the radio jet, providing a relatively unobscured view of the nucleus.
Our results are consistent with the hypothesis that the inner accretion environment of LLAGN is very clean, and the optically thick accretion disc is truncated at a large radius. Other similar galaxies include the Seyfert 2 galaxy NGC 2110 with R < 0.14 (Marinucci et al. 2015) and the low accretion rate LINER NGC 7213 with R < 0.13 (Ursini et al. 2015; Lobban et al. 2010). These galaxies are all radiating significantly below the Eddington limit, with L/LEdd = 0.25–3.7 × 10⁻² for NGC 2110 (Marinucci et al. 2015) and L/LEdd = 1.4 × 10⁻³ for NGC 7213 (Ursini et al. 2015). What is not clear, however, is whether there are low Eddington fraction sources that have high reflection fractions. While low Eddington fraction galaxies can have fairly large EW iron lines (e.g. see Bianchi et al. 2007), this does not necessarily mean their reflection fractions are large – this is not the case in NGC 2110, for example. For the AGN in the XXL survey (Pierre et al. 2016) with L/LEdd ≳ 10−2 the reflection fraction is typically R > 0.3 (Liu et al. 2016), although since these authors have to perform a stacking analysis it is not clear what R is for the very lowest Eddington fraction galaxies. An illustration of the reflection fraction versus Eddington fraction is shown in Fig. 7, which suggests that the transition between high (R > 0.3) and low (R ≃ 0) reflection fraction may be quite abrupt. Higher signal-to-noise ratio observations of low Eddington fraction AGN are necessary to clarify this picture, to fill in or exclude galaxies from the upper left quadrant of this plot.
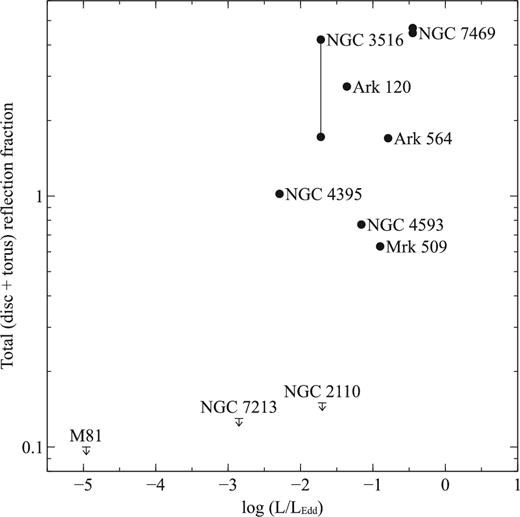
Reflection fraction versus Eddington ratio. The three AGNs known to unambiguously have no reprocessed emission from Compton thick material are M81* (this work), NGC 7213 (Ursini et al. 2015), and NGC 2110 (Marinucci et al. 2015). The other data points have reflection fractions measured with XMM–Newton by Nandra et al. (2007) and Eddington fractions using the bolometric luminosities and black hole masses reported by Vasudevan & Fabian (2007).
The Fe xxv and Fe xxvi lines may originate in hot, optically thin gas within a few ×103rg. Highly ionized iron lines are also seen in NGC 7213 (Lobban et al. 2010), a galaxy with very similar spectral properties to M81*. Observations of ‘bare’ Seyfert galaxies also show Fe xxv and Fe xxvi lines (Patrick et al. 2011), suggesting that these hot iron lines may be a common component of AGN spectra. The LLAGN NGC 2110, however, does not show evidence of ionized iron lines (Evans et al. 2007), but NGC 2110 is a Seyfert 2 galaxy so does not have a ‘bare’ nucleus.
5 CONCLUSIONS
In this paper, we present simultaneous Suzaku and NuSTAR observations of the LLAGN M81*. We find the following:
The NuSTAR light curve shows significant, |${\sim } 30\, {per\,cent}$|, variability on time-scales of ∼40 ks.
The continuum spectrum is well described by a cut-off power law with photon index Γ = 1.9 and cut-off energy of Ec ≃ 220–270 keV.
There are weak Fe K α, Fe xxiv, and Fe xxvi lines with EWs of 40, 38, and 33 eV, respectively.
There is evidence of weak intrinsic absorption, with the absorbing column density |$N_{\rm H} = 6.3^{+0.3}_{-0.3} \times 10^{20} {\rm \,cm}^{-2}$| exceeding the Galactic value |$N_{\rm H}({\rm Gal}) = 4.2 \times 10^{20} {\rm \,cm}^{-2}$|.
There is no Compton reflection hump, with the reflection fraction measured to be R < 0.11.
We model the Fe K α line as being produced in an optically thin, |$N_{\rm H} = 1.1 \times 10^{23} {\rm \,cm}^{-2}$| torus using the mytorus model (Murphy & Yaqoob 2009; Yaqoob 2012).
We hypothesise that the primary X-ray emission originates in a hot, optically thin inner accretion flow within ∼102 rg. Surrounding this is the ‘torus’, with a half-opening angle larger than 50°, that extends from ∼102 to 105 rg. At larger radii, ≳105 rg, is a warped, optically thick, and geometrically thin disc.
Acknowledgements
This research has made use of the NuSTAR Data Analysis Software (nustardas) jointly developed by the ASI Science Data Center (ASDC, Italy) and the California Institute of Technology (Caltech, USA). We are grateful to Katja Pottschmidt and Kenji Hamaguchi for helpful discussion regarding the Suzaku calibration and the problem we had with XIS 0.
Footnotes
See e.g. the analysis caveats at http://heasarc.gsfc.nasa.gov/docs/nustar/analysis/.
We consider |$N_{\rm H} < 10^{24} {\rm \,cm}^{-2}$| to be optically thin.
