


Abstract
The variability of interstellar atomic lines, sporadically reported in the astronomical literature, has been confirmed both in the case of the nearby hot star δ Ori and the very young and violent star-forming region η Carinae, using high-resolution echelle spectra. The presented variability concerns the intensities and profiles of Na i, K i and Ca ii. The time-scale of the above-mentioned variations clearly suggests very local phenomena as their cause. It is important to say that not all interstellar lines vary in unison.
1 INTRODUCTION
The search for the variability of interstellar lines has a long history. At first, for a long time interstellar absorption lines were believed to be of naturally constant intensities because of the cloud sizes, estimated as several parsecs, which do not allow any change of the physical parameters of a substantial part of them during the human lifetime. However, later investigations seemed to suggest that interstellar clouds are not homogeneous and thus the above-mentioned argument may not be valid in some cases. Some strength variations of interstellar absorption lines may happen if the inhomogeneities are of a spatial scale not exceeding 100 au. This is the scale of rather circumstellar shells than of true interstellar clouds.
Moreover, the huge clouds may contain very small but dense – and thus optically thick – cloudlets that intersect sightlines with a rather high speed. This is especially likely inside big OB associations, recently formed out of dense molecular clouds or around some expanding objects. It is then not astonishing that changes in non-stellar absorptions have been observed in supernova (SN) remnants, such as those in the work of Hobbs, Wallerstein & Hu (1982), who found variable Doppler structure in the interstellar Ca ii lines in the high-resolution spectrum of HD 72127A.
The observation clearly concerned changes in the structure or involved probing different parts of the circumstellar shell of large proper motions. Some variations of Na i lines have been reported by Lauroesch & Meyer (2003), being not accompanied by those of Ca ii in the spectrum of the bright supergiant ρ Leo (HD 91316).
Recently we found possibly variable interstellar lines in the spectrum of HD 73882 (Galazutdinov et al. 2013). This variability concerned Ca i and Fe i lines, believed to be related in a way (Bondar et al. 2007). The object is not distant and thus the variability may follow its proper motion, which makes the sightline intersect different parts of the intervening cloud, as suggested by Herbig (1999) in the case of HD 34078 (AE Aur). The latter suggestion was noticed by Rollinde et al. (2003) and developed later by Krełowski et al. (2016). The decline of the intensities of interstellar molecular CH and CH+ lines was demonstrated beyond a doubt. However, these intensities were constant or just marginally variable during the period 1949–2010; the substantial variability started in 2010. In the spectrum of AE Aur atomic lines seem to remain invariant. The observed variations of molecular features have been interpreted by Boissé et al. (2009) as the effect of the sightline crossing small, dense clumps, very likely similar to globules, observed in the background of emission nebulae.
A list of many papers devoted to the search for variations of interstellar absorption lines over time can be found in the paper by McEvoy et al. (2015). Apart from radio observations, optical and UV observations have also been used to detect temporal and spatial variations in interstellar absorption lines. Most such studies have relied upon multi-epoch ultra-high-resolution optical observations in Na i and Ca ii interstellar features, although variations in K i, Ca i and/or Fe i have also been detected (e.g. Crawford et al. 2000; Galazutdinov et al. 2013). Some authors (cited in McEvoy et al. 2015) have studied the spatial distribution of CH+, CH and CN, on scales ranging from 1 to 20 au, for a single sightline towards ζ Per, finding the neutral species to be uniformly distributed and a CH+ excess, implying its production in very small localized active regions of only a few astronomical units in diameter. The paper by McEvoy et al. (2015) concerns the study of the variations of interstellar absorption lines as caused by the transverse motion of stars combined with changes in the structural properties of the interstellar medium (ISM) on small scales, sub-au to 1 pc, and/or temporal changes in the physical properties of this matter. The authors have compared interstellar absorption lines seen along 104 sightlines towards a set of selected O and B stars at two (and sometimes three) epochs, separated by 5–20 yr. However, out of the 104 sightlines investigated, possible convincing temporal variations were identified in the strong lines of Ca ii (H and K), Ca i and/or Na i D absorptions but only for 6|${\rm per \, cent}$| of the considered directions. For Ca i, the variations were always seen at the same velocity as the corresponding variations in Na i or Ca ii, which provides confidence in their reality. Generally, out of the total twin-epoch spectra analysed, 80|${\rm per \, cent}$| show no significant difference between the two epochs in any species. 2|${\rm per \, cent}$| show variation caused by eclipsing companions, 12|${\rm per \, cent}$| show changes that are probably due to circumstellar material, and 6|${\rm per \, cent}$| show possible time variation in one or more velocity component caused by interstellar absorption. The sightlines where stellar or circumstellar variations are visible could also exhibit interstellar variations but they would be hidden due to the more prominent stellar–circumstellar profile changes. Despite the variations seen in atomic or molecular lines, a possible phenomenon was recently reported also concerning diffuse interstellar bands (Law et al. 2017). In the latter case it is, however, difficult to say whether these variations are related to those observed in the high-velocity components of atomic lines.
The above examples suggest that interstellar line variability is possible. Typically one does not have several spectra of the same star, acquired in different epochs. However, it seems possible that having a couple of spectra of a given early-type star gives a reasonable chance of finding the interstellar lines to be variable. Such an example is presented below for the case of the δ Ori and ρ Leo stars. Also, because the observed variabilities apparently occur on relatively small spatial scales, it seems likely that this phenomenon may be mainly present inside young stellar aggregates where a lot of diffuse matter is still observable. Young OB associations typically contain many dense globules or elephant trunks, suggesting the possibility of the presence of some small size, dense but transparent gaseous-molecular clouds that may cause variable interstellar atomic or molecular lines when crossing a sightline at high speed. They can also cause atypical extinction because during gravitational collapse grains may aggregate, forming big particles, much bigger than the grains populating diffuse or translucent clouds. These can effectively conceal observed stars. We have considered such a situation inside the η Carinae association.
2 OBSERVATIONS
Our analysed data were acquired using two echelle spectrographs, UVES and FEROS.
The UVES spectrograph is fed with the 8-m Kueyen VLT mirror. The spectral resolution is up to R = 80 000 in the blue range and R = 110 000 in the red one. The telescope size allows high-S/N-ratio spectra to be obtained for even pretty faint stars.
The FEROS spectrograph is fed with the 2.2-m ESO La Silla telescope. It allows the recording in a single exposure of a spectral range from 3 600 to 9 200 Å divided into 39 echelle orders. The resolution of FEROS spectra is R = 48 000. The orders cover pretty broad ranges of wavelengths that make the FEROS spectrograph a very useful tool to check the spectral types and luminosity classes of the observed targets.
Southern sky objects are available to both of these spectrographs. The S/N ratio of the spectra, analysed in this paper, was 100–400 in the case of the FEROS data and 300 for the UVES ones.
3 RESULTS
3.1 δ Ori
Crawford (2003) mentions the possible variability of the Na i interstellar line in the spectrum of the bright, nearby star δ Ori, first found as such by Price, Crawford & Barlow (2000). The variability, found in ultra-high-resolution spectra, concerns one Doppler component, seen in the Na i D1 line profile. We found two spectra of this target in the ESO archive: one taken using FEROS on 2009 May 1 (Program ID 083.D-0589(A)) and one taken using UVES on 2014 October 6 (Program ID 194.C-0833(A)). The resolution of the above spectra is R = 48 000 and R = 80 000, respectively, i.e. an order of magnitude lower than that used by Price et al. (2000). However, thanks to the lower resolution, the spectra cover a much broader wavelength range. It seems interesting to check whether the variations already discussed, seen in very high-resolution spectra, can also be found in the FEROS/UVES data.
The only two absorption spectral features that we traced in δ Ori are the strongest Ca ii and Na i lines. Fig. 1 shows clearly that the intensities of the Ca ii lines are the same in both epochs while those of the Na i ones differ from epoch to epoch. It is to be emphasized that our spectra cover the whole Na i profile while those of Price et al. (2000) only cover part of it. Our ‘blue’ component, centred around a heliocentric radial velocity of 8 km s−1, is out of range in the Price et al. (2000) spectrum shown in their fig. 2. We are thus able to demonstrate that this component is especially variable. We cannot compare directly our profiles with those of Price et al. (2000) due to the different resolutions. We can only compare equivalent widths in both our spectra, which are very different in the case of Na i (see Fig. 1). Thus our result clearly confirms that of Price et al. (2000), i.e. of interstellar line strength variability in this nearby object.
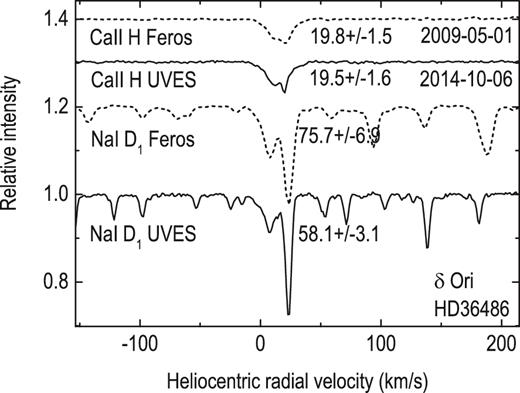
The strongest interstellar lines compared in two epochs. Note the variability of Na i when Ca ii remains constant. The spectra presented are archival.
3.2 ρ Leo
Some variations in Na i interstellar line intensities have been reported by Lauroesch & Meyer (2003). The authors reported no variations in the Ca ii lines observed in the same spectra acquired with a gap of 8 yr. We have checked this effect using two spectra, acquired with the Korean BOES spectrograph fed by the 1.8-m telescope of the Korean National Observatory. We confirm that the Ca ii lines are apparently of constant intensity. For Na i, the line shows two evident Doppler components, seen at a resolution of 44 000. The equivalent widths of the stronger component are 77.7 ± 0.8 mÅ and 82.3 ± 0.8 mÅ for 2004 February 5 and 2007 December 22 respectively. For the same dates the equivalent widths (EWs) of the weaker components were measured as 24.2 ± 0.6 mÅ and 21.8 ± 0.7 mÅ respectively. Apparently both components vary with time while the Ca ii lines remain invariant.
3.3 η Carinae Nebula
The η Carina Emission Nebula (NGC 3372) is part of the Carina OB1 association in the Carina–Sagittarius Arm. Within the nebula are also seen open clusters, e.g. Trumpler (Tr) 14, Tr 16 and Collinder 228. The whole nebula presents a huge complex of high-mass stars, dust and gas, being probably the youngest such association in the Milky Way. The presence of remnants of the parent cloud in the form of clouds excited to shine by the newly formed massive hot stars and seen in direct images of the nebula Bok globules and elephant trunks indicates the possibility of different dynamical phenomena inside the aggregate. Remnants of the parent cloud (especially in the form of small ‘clumps’) may likely cause variability of interstellar lines while intersecting crosswise a sightline. Because of ongoing star formation activity η Carina Nebula is one of the most interesting regions in the Galaxy and has attracted the attention of investigators over many years. Walborn & Hesser (1975) have shown that the interstellar absorption lines towards stars in the Carina Nebula show the most complex Doppler profiles known in the Galaxy. Exceedingly complicated structure has been found in the interstellar Ca ii lines. As many as six components have been observed in a single spectrum; moreover, the profiles show large variations over small angular distances covering a total velocity range of 330 km s−1. Moreover, stellar spectra in the outer parts of the nebula contain single ionized calcium lines, which suggests that the additional components seen in the inner region are formed there. This supports the idea of the very complex and dynamical behaviour of the centre of this association. Measurements of the interstellar Ti ii lines, which are double in a few cases, are also presented. These results seem to indirectly indicate the possibility of significant temporal interstellar line variations in the inner part of the Carina association. A similar conclusion concerning extreme interstellar profiles and a very large spread of radial velocities in this region was also drawn by Walborn et al. (1998).
It seems then quite reasonable to suggest that the violent gas motions, indicated by the complex interstellar line profiles, seen in the Carina association may also lead to temporal interstellar line intensity variations. Indeed, Danks et al. (2001), on the basis of two observations of one star, CPD −59° 2603, in the centre of the Carina Nebula, obtained 22 months apart in the R ≥ 110 000 mode of the Space Telescope Imaging Spectrograph on board the Hubble Space Telescope, revealed substantial variations in the intensities of several high-velocity components of the UV Mg ii and C ii interstellar lines. They claim that the most probable interpretation of these variations is proper motions of small clumps across the line of sight. It is interesting that the radial velocities of the UV Mg ii and C ii lines (−40 km s−1, according to Danks et al. 2001) differ from those of the Ca ii ones, measured in the UVES spectrum as +7.5 km s−1. It is also interesting that clouds of velocities as high as −40 km s−1 must be local to the association as the Galactic components must not be so fast (see Fig. 7).
Walborn (1973), Walborn et al. (2002), Levato & Malaroda (1982), Morrell, Garcia & Levato (1988) and Massey & Johnson (1993) have classified stars in the region. Cudworth, Martin & Degioia-Eastwood (1993) performed a proper-motion study and presented the membership probability of stars down to V = 16 mag. The long-standing problem is the distance to the nebula and the question of whether the above-mentioned clusters, in particular Tr 14 and Tr 16, are at the same distance or not. As these clusters are situated along the tangent line to the Sagittarius spiral arm, their relative close positions in the sky could be the optical coincidence of objects at very different distances. Most photometric studies have estimated the distances of these clusters to be between 2.0–4.0 kpc. Knowledge of the relative localization of the members mentioned may help in the proper interpretation of the variation of interstellar lines as observed in their spectra.
The ESO archive contains several spectra of the Trumpler 16 and 14 targets. Among these one can find a few spectra for each of the four stars (Table 1). Let us check whether the interstellar lines seen in these spectra show some variability.
Stars from the Tr 14 and Tr 16 clusters (parallaxes from Gaia DR1).
| Name | V | Sp. type | B − V | π (mas) | D (pc), | D (pc), |
|---|---|---|---|---|---|---|
| Gaia | (Sp/L) | |||||
| HD 93130 | 8.09 | O6.5 III(f) | 0.23 | 0.23 ± 0.27 | 4350 | 3570 |
| HD 93161 | 7.87 | O7.5 V+O9 V | 0.09 | – | – | 3570 |
| HD 93205 | 7.75 | O3.5 V((f))+O8 V | 0.05 | 0.59 ± 0.25 | 1695 | 3460 |
| HD 93250 | 7.37 | O4 III(fc) | 0.17 | 0.42 ± 0.22 | 2380 | 3340 |
| δ Ori | 2.25 | O9.5 II | |$-$|0.22 | 4.71 ± 0.58 | 212 | 430 |
| ρ Leo | 3.84 | B3 Ia | |$-$|0.14 | 0.60 ± 0.18 | 1670 | 1500 |
At least two stars from our list are multiple objects. This naturally makes proper estimates of their absolute magnitudes very uncertain. For three η Carinae objects we found Gaia trigonometric parallaxes. However, in one case the quoted error of this parallax is bigger than the measurement. Two other cases are better but the errors are still relatively big. It seems interesting that these new Gaia distances are shorter than e.g. those of Feinstein (1963) and our spectrophotometric distance estimates (Table 1). For δ Ori the trigonometric parallax is taken from Hipparcos as the star itself is too bright for Gaia. We also give the Hipparcos distance for ρ Leo. It seems interesting that the Hipparcos and spectrophotometric distances are accordant only if the star is of B3 Ia instead of B1 Ib, as typically quoted in the literature. It seems interesting that all the other spectrophotometric distances listed in Table 1 are substantially larger that the trigonometric ones. This may be due to the presence of grey (neutral) extinction, which acts in the photometric equation exactly like distance.
The result for HD 93250 is astonishing (Fig. 2). The four profiles of Ca ii (taken at different epochs) are almost identical. Only the very weak Doppler component near +50 km s−1 may show some variations of intensity and profile. The component(s) must be local to the η Carinae complex because such a big radial velocity, due to the orbital motion around the Galactic centre, is kinematically impossible (see Fig. 7). Also, the K i line is apparently of constant intensity and profile shape. In just one case it seems to be a bit stronger but the shape of the profile remains the same. The Na i lines behave, however, in a very strange fashion. While the profile remained the same in 2004 and 2006, in 2012 it became much broader, ‘swelling’ in both (blue and red) directions! It is important that in the 2012 spectrum the Ca i line profile is also severely modified. Moreover, it contains a very strong +50 km s−1 component – the same as that barely seen in the Ca ii. Apparently some very dynamic process took place between 2006 and 2012 in front of HD 93250. The figure also contains the molecular feature (of CH+), which does not seem to be substantially changed; its profile seems free of Doppler splitting. It seems important that the stellar radial velocities are identical in all our spectra. Thus either the star is a single object or the orbit of the binary is perpendicular to the sightline.
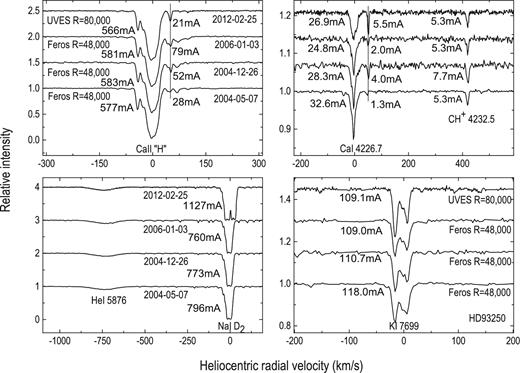
Intensities of atomic lines in the spectra of HD 93250. Note the different behaviour of the depicted lines, especially of the Na i and Ca i ones in the most recent epoch. Equivalent widths of the features depicted are given.
Another star (HD 93161) – and another result (Fig. 3). The object is apparently a multiple one. The He i profile of the stellar 5876 Å line changes from observation to observation. In unison with it also we observe quite rapid changes of interstellar Ca ii profiles. It is amazing that the Ca ii and Ca i profiles change substantially over just 4 d!

Intensities of atomic lines in the spectra of HD 93161. Note the variability of atomic lines while that of CH+ remains constant. EWs of the depicted features are given in the plot.
Apparently this is due to some circumstellar processes; otherwise such rapid changes could not happen in huge cloud(s).
The variations in the Na i profile seem to be very similar to those of Ca ii. K i is apparently of constant intensity and profile shape – free of Doppler splitting. One can trace in all profiles a nearly not-wavelength-shifted component that seemingly does not change. This is very likely the truly interstellar component, i.e. originated in the ISM distributed along the sightline; other components, which vary too rapidly, are most likely of either circumstellar or at least local provenance. They are severely red-shifted in our Ca ii and Ca i lines. This may follow the fact that η Carinae is a very young aggregate, still immersed in relatively optically thick remnants of the parent cloud. The collapse of the latter, together with the formation of H ii regions around massive stars, may have caused very turbulent motions of individual clouds.
Another target with more than one spectrum is HD 93130. The interstellar lines in its spectrum are depicted in Fig. 4. Here we do not observe substantial variations of line intensities, despite the fact that a high-radial-velocity component at ∼−200 km s−1 is seen in most of the interstellar lines. The component may be marginally variable while the main group of components remains evidently constant (as in HD 93161). The stellar radial velocity, ranging between −85 and +38 km s−1 (in our spectra), clearly demonstrates that the star is multiple. However, the variability of possible circumstellar features is marginal.
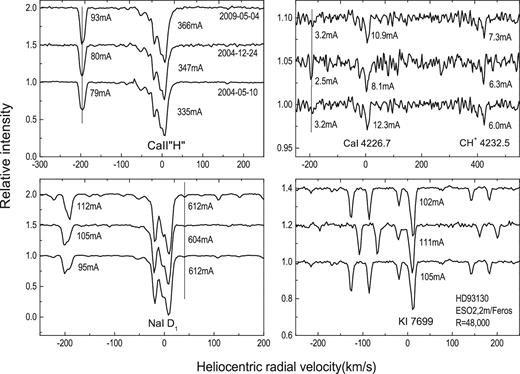
Intensities of atomic lines in the spectra of HD 93130. The lines are hardly variable. Some high-velocity components, likely variable, are marked with vertical lines. The plot contains EWs of the depicted features.
We also found several spectra of the star HD 93205. We observe here some variability of high-velocity components of Ca ii, Na i and Ca i; see Fig. 5. The main components of interstellar lines are seemingly constant.
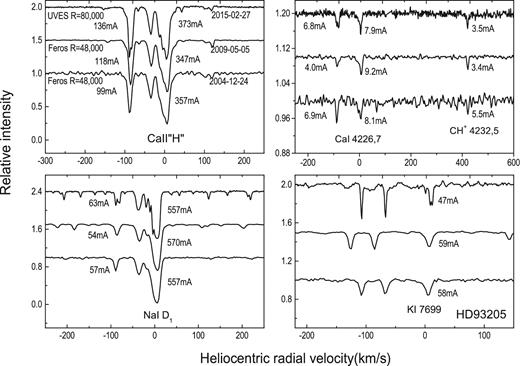
Intensities of atomic lines in the FEROS/UVES spectra of HD 93205. Note the different behaviour of the depicted lines. EWs are given in the plot.
The radial velocities of the observed Doppler components in the spectra of the chosen targets originating along the sightlines are comparable to the radial velocities expected using the Galactic rotation curve. Clouds with speeds strongly different from the expected orbital components of radial velocity must be rather local.
4 DISCUSSION
Apparently the young stellar aggregate η Carinae is in a very unstable state. The huge system of massive stars and various interstellar clouds shows very dynamical phenomena, first suggested by Walborn & Hesser (1975). Bok globules and elephant trunks in H ii regions produce a very complex and variable system. High spatial and spectral resolution observations have proved that the aggregate is full of quite small globulettes, likely remnants of expanding shells, which move with velocities similar to those seen in our plots (see Grenman & Gahm 2014; Haikala et al. 2017). The globulettes are small clumps, but optically thick enough to produce observable Ca ii or Na i lines. According to Grenman & Gahm (2014) the globulettes are as dense as 105 particles cm−3. The Carina Nebula contains apparently many such globulettes, moving in different directions. Such a system is likely to produce quite a stochastic variation of interstellar line profiles and intensities. Growths and/or declines of interstellar lines may be quite unpredictable and thus variations may occur in a much bigger sample of objects than already discovered.
Our result does not contradict the old conviction that interstellar lines should not vary. The observed variations concern rather local phenomena, taking place inside the considered aggregate. It is especially easy to see in Fig. 6 that the star HD 93205 shines through an expanding double envelope. The weak features, centred near 111 and −147 km s−1, look like mirror images. This is additional proof of the existence of very turbulent phenomena inside the η Carinae Nebula. It is important to mention that while the atomic lines show some variability, the molecular features usually remain constant and their profiles are not as complex as those of Ca ii (Fig. 6). Thus molecules are rather absent inside the globulettes, populating the η Carinae Nebula, but originate along the sightline towards the aggregate.
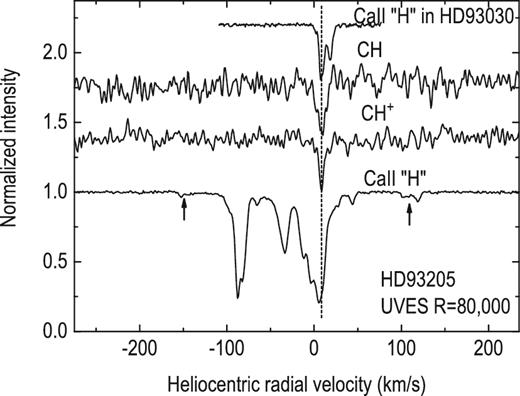
Simple structure of molecular lines in the spectra of HD 93205 in sharp contrast to the Ca ii line. Note the positive values of molecular radial velocities; see Fig. 7.
Fig. 6 demonstrates the very rich Doppler structure of the Ca ii profile while those of diatomic radicals remain very simple, showing no Doppler splitting at all. It is obvious that in the majority of clouds, revealed by the Ca ii components, molecules are absent. Most likely the molecular lines represent the general interstellar medium towards the η Carinae complex. Their radial velocities seem to agree with the kinematic predictions, based on the Galactic rotation curve (Sofue, Honma & Omodaka 2009) (see Fig. 7) for either very nearby Milky Way objects (∼800 pc) or for very distant (∼4 kpc) clouds.
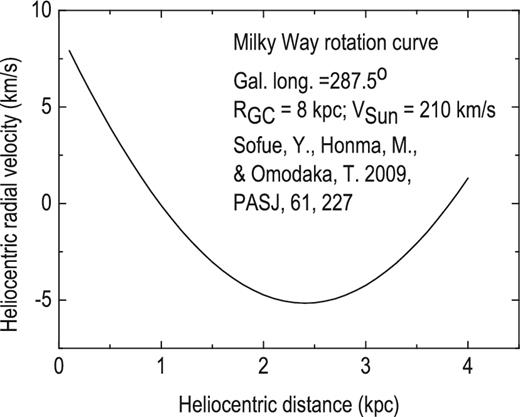
Theoretical variations of heliocentric radial velocities versus heliocentric distance in the direction of η Carinae due to the orbital motions of Galactic objects.
Acknowledgements
JK acknowledges the financial support of the Polish National Science Centre during the period 2015–2017 (grant 2015/17/B/ST9/03397). SV and DM acknowledge support from the Toruń Astrophysics/Physics summer program (TAPS).
This paper includes data gathered with the VLT (UVES) and 2.2-m (FEROS) ESO telescopes. This work has made use of data from the European Space Agency (ESA) Gaia mission (https://www.cosmos.esa.int/gaia), processed by the Gaia Data Processing and Analysis Consortium (DPAC, https://www.cosmos.esa.int/web/gaia/dpac/consortium). Funding for the DPAC has been provided by national institutions, in particular the institutions participating in the Gaia Multilateral Agreement.
REFERENCES
