


Abstract
Bright-rimmed clouds (BRCs) form on the edges of H ii regions affected by high-energy radiation from a central ionizing source. The UV radiation from the ionizing source results in compression and ionization, causing either cloud disruption or further star formation. In this work, we present R-band polarization measurements towards four BRCs, namely IC 1396A, BRC 37, BRC 38 and BRC 39, located in different directions in the H ii region, Sh2-131, in order to map the magnetic field (B-field) in the plane of the sky. These BRCs are illuminated by the O star HD 206267 and present a range of projected on-sky geometries. This provides an opportunity to gain an understanding of the magnetized evolution of BRCs. The B-field geometries of the clouds deduced from the polarization data, after correction for foreground contamination by the interstellar medium, are seen to be connected to the ambient B-fields on large scales. They seem to play an important role in shaping the clouds IC 1396A and BRC 37. BRCs 38 and 39 show a broader and snubber head morphology, possibly because the B-fields are aligned with incoming radiation, as revealed in the simulations. A good general agreement is noted on comparing our observational results with the simulations, supporting the importance of B-fields in BRC evolution. This work is the first step towards systematic mapping the B-fields morphology in multiple BRCs in an expanding H ii region, extending our previous work.
1 INTRODUCTION
H ii regions are formed when massive stars photoionize and thus expand the surrounding medium. Ionized bubbles with pressure higher than the surrounding medium are formed by massive stars (OB type) emitting high-energy photons (at rates of 1047–1050 s−1). The shocks driven from the ionizing source result in the expansion of these bubbles. When the shock is isothermal, a thin, dense and generally unstable gas and dust shell forms at the boundary of the H ii region. These boundaries are often found to have peculiar and highly irregular structures. According to their structural appearance, these objects are referred to as fingers or pillars, speck globules, bright-rimmed clouds (BRCs), cometary globules (CGs) or elephant trunks (Leung 1985). It is unclear whether these irregular structures are formed as a result of flow instabilities (Spitzer 1954; Giuliani 1979; Garcia-Segura & Franco 1996; Williams 1999) or from pre-existing dense structures in the ambient interstellar medium advected through the ionization front (Reipurth 1983). Recently, however, Kinnear et al. (2014, 2015) systematically investigated these objects and revealed that an initially ellipsoidal molecular cloud inclined to an ionizing source could form most of the observed irregular structures, from a filament and asymmetrical BRC to a horse-head, for example, depending on the initial density, geometry, inclination angle and strength of the ionization flux. This work, combined with the previous investigation by Miao et al. (2009) on the formation mechanism of symmetrical A-, B- and C-type BRCs, provided a complete set of mechanisms for the formation of the various structures found on the boundaries of H ii regions.
The radiation from massive stars drives an implosion into the globules in the vicinity. The radiation-driven implosion (RDI) mode presupposes a structured ambient medium into which the H ii region expands rapidly in directions where the density is relatively low. When this rapid-type (R-type) ionization front encounters a relatively high-density globule, it changes to a delayed-type (D-type) and drives a convergent shock into the globule. The maximum compression of the globule occurs in this initial phase, causing it to implode. Existing simulations of RDI focused on the onset and the efficiency of triggered star formation in isolated pre-existing clumps (Bisbas et al. 2011; Haworth, Harries & Acreman 2012) and on the driving of turbulence. The accretion luminosity of the embedded protostar in the globules could be increased as a result of the enhanced accretion rate owing to strong compression during the RDI process. On the other hand, the luminosity could be decreased in the RDI process owing to the photo-evaporation of the parent core, causing a decrease in the core mass (Motoyama, Umemoto & Shang 2007). In order to investigate this process in detail and to model the collapse of cores exposed to ultraviolet (UV) radiation from massive stars, Motoyama et al. (2007) presented numerical simulations and estimated the dependence of the mass-loss rate on the initial density profiles of cores and the variation of UV fluxes. Their study also derived simple analytic estimates of the accretion rates and final masses of the protostars.
The first 3D magnetohydrodynamical (MHD) simulations towards magnetized globules were presented by Henney et al. (2009). They found that, for the case of a strong ionizing field, there is a significant deviation when the initial magnetic field threading the globule has an associated magnetic pressure that is 100 times the gas pressure. The photo-evaporating globule will adopt a flattened or ‘curled-up’ shape depending on the initial field orientation. Later this work is extended by adding B-fields of various strengths and orientations by Mackey & Lim (2011). One of the important results they obtained was that initially perpendicular but weak- and medium-strength B-fields are finally swept away and become aligned with the pillar [a whole range of structures seen inside or at the edges of H II regions, which, according to their morphology, may be variously described as bright rims (Pottasch 1956), fingers/columns/pillars/elephant trunks (Minkowski 1949; Osterbrock 1957; Rathborne et al. 2004, hereafter pillars) or bars (O'Dell & Yusef-Zadeh 2000)] during its dynamical evolution. This is consistent with the observed field orientations in M16 (Sugitani et al. 2007) and in some CGs (e.g. Hodapp 1987; Sridharan, Bhatt & Rajagopal 1996). However, in CG 30-31 (BRC 51), Bhatt (1999) found that the projected B-fields are oriented perpendicular to the tail of the globule. The above results obtained on CG 30-31 are different from the previous polarization studies towards various H ii regions such as RCW 41 (Santos, Roman-Lopes & Franco 2012), NGC 3576 (Shih et al. 2009) and Sh 156 (King & Scarrott 1983), where the B-fields are found to be parallel to the tail. So far, very few attempts have been made to map the B-field geometry observationally towards BRCs such as BRC 20 (Targon et al. 2011), BRC 51 (CG 30-31, Bhatt 1999), BRC 74 (Kusune et al. 2015) and BRC 89 (Santos et al. 2014).
IC 1396 is a young and active H ii region in Cep OB2 containing clustered OB stars (Schwartz, Wilking & Giulbudagian 1991). It appears that the expansion of this H ii region has resulted in the sweeping up a molecular ring of radius ∼12 pc (Patel et al. 1995). This region contains 15 small globules with embedded IRAS sources (Schwartz et al. 1991). A large-scale dynamical study using CO molecular line observations has been presented by Patel et al. (1995) and Weikard et al. (1996). Sugitani, Fukui & Ogura (1991) and Froebrich et al. (2005) found a rich population of BRCs and CGs seen in silhouette against the emission nebulae residing in the large molecular shell surrounding the H ii region. The dominant source of UV radiation in the H ii region IC 1396 is a O6.5V star, HD 206267 (Walborn & Panek 1984; Patel et al. 1995). This star is a member of Trumpler 37, a young open cluster located at the centre of the Cep OB2 association (Simonson 1968). Using the photometric observations by Garrison & Kormendy (1976) and Simonson (1968), Patel et al. (1995) found 12 stars with spectral types earlier than B1. Clearly, the hottest star HD 206267 (O6.5) in the centre is the primary source of the ionizing UV radiation.
In order to understand the effects of B-fields in the structural evolution of clouds, it is important to perform a systematic polarimetric study by selecting an H ii region containing multiple BRCs at different locations, with known properties of the ionizing source(s). Relatively closer regions (with less foreground extinction) with less complex geometry would be easier to study systematically. Assuming a preferred orientation of the B-field prior to the formation of a H ii region, the clouds in different directions would show different magnetized evolutions because of the different orientations of the ionizing radiation. Soam et al. (2017b) chose the Sh 185 region with IC 63 and IC 59 nebulae in different directions of the radiation from the ionizing source γ Cas, but there were only two nebulae studied in that region. In this study, we present the polarization results of four BRCs associated with the IC 1396 H ii region. We have chosen these BRCs in the north (BRC 38 or IC 1396N), south (BRC 37), east (BRC 39) and west (IC 1396A and BRC 36) directions of this H ii region.
This study will give us an insight into the magnetized evolution of multiple BRCs associated with the H ii region as a function of the direction of the ionizing radiation. The data acquisition information is presented in Section 2. The results of the polarimetric observations are given in Section 3. In Section 4 we discuss and analyse the results obtained, and we draw some conclusions in Section 5.
2 DATA ACQUISITION
Polarization measurements towards the IC 1396 H ii region were obtained on 10 nights from 2013 October to 2014 January (see Table 1) using the Aries IMaging POLarimeter (AIMPOL; Rautela, Joshi & Pandey 2004) at the 1-m optical telescope located at the Aryabhatta Research Institute of Observational Sciences (ARIES), India. The mean exposure time per observed frame per half wave-plate (HWP) angle was ∼250 s in order to obtain a good signal-to-noise ratio. We obtained seven frames on each position of the HWP in one field and repeated the procedure to cover the four BRCs in the IC 1396 region. The details of the instrument and the procedure for data reduction to obtain polarization values from observed data are given in our previous papers (Soam et al. 2013, 2015, 2017b). Care was taken in removing the instrumental polarization from the measurements by considering a constant value observed in various studies using this instrument. This value has been reported as 0.1 per cent (see Soam et al. 2013, 2015; Neha et al. 2016). We also observed the polarized standard stars (results shown in Table 2) from Schmidt, Elston & Lupie (1992) to determine the reference direction of the polarizer. A good correlation was found among the observed values and the standard values given in Schmidt et al. (1992). These values were used to obtain the zero-point offset correction, which was later applied to the observed position angles of the target stars.
Log of polarimeteric observations towards the IC 1396 region in the Rkc filter (|$\rm \lambda _{eff}$| = 0.760 |$\mu$|m).
| Cloud ID | Date of observations (year, month, day) |
|---|---|
| IC 1396 | 2013 Oct 29; 2013 Nov 8, 9, 10, 26, 28 |
| 2013 Dec 1, 3; 2014 Jan 3, 5 |
| Cloud ID | Date of observations (year, month, day) |
|---|---|
| IC 1396 | 2013 Oct 29; 2013 Nov 8, 9, 10, 26, 28 |
| 2013 Dec 1, 3; 2014 Jan 3, 5 |
Results of observed polarized standard stars.
| Date of | P ± σP | θ ± σθ |
|---|---|---|
| obs. | (per cent) | (°) |
| HD 236633 | ||
| †Standard values: 5.38 ± 0.02 per cent, 93|${^{\circ}_{.}}$|04 ± 0|${^{\circ}_{.}}$|15 | ||
| 01 Dec 2013 | 5.5 ± 0.1 | 92 ± 1 |
| 03 Dec 2013 | 5.6 ± 0.1 | 93 ± 1 |
| 03 Jan 2014 | 4.8 ± 0.2 | 92 ± 1 |
| 05 Jan 2014 | 5.3 ± 0.1 | 92 ± 1 |
| HD 25443 | ||
| †Standard values: 4.73 ± 0.05 per cent, 133|${^{\circ}_{.}}$|65 ± 0|${^{\circ}_{.}}$|28 | ||
| 08 Nov 2013 | 4.9 ± 0.1 | 133 ± 2 |
| 09 Nov 2013 | 4.9 ± 0.1 | 132 ± 1 |
| 03 Dec 2013 | 4.8 ± 0.1 | 133 ± 1 |
| BD+64°106 | ||
| †Standard values: 5.69 ± 0.04 per cent, 96|${^{\circ}_{.}}$|63 ± 0|${^{\circ}_{.}}$|18 | ||
| 01 Dec 2013 | 5.3 ± 0.1 | 96 ± 1 |
| HD 19820 | ||
| †Standard values: 4.53 ± 0.02 per cent, 114|${^{\circ}_{.}}$|46 ± 0|${^{\circ}_{.}}$|16 | ||
| 29 Oct 2013 | 4.4 ± 0.1 | 114 ± 1 |
| 03 Dec 2013 | 4.5 ± 0.1 | 113 ± 1 |
| HD204827 | ||
| †Standard values: 4.89 ± 0.03 per cent, 59|${^{\circ}_{.}}$|10 ± 0|${^{\circ}_{.}}$|17 | ||
| 29 Oct 2013 | 5.0 ± 0.2 | 61 ± 7 |
| HD43384 | ||
| ‡Standard values: 4.89 ± 0.03 per cent, 59|${^{\circ}_{.}}$|10 ± 0|${^{\circ}_{.}}$|17 | ||
| 28 Nov 2013 | 4.7 ± 0.1 | 57 ± 3 |
3 RESULTS
The results of our optical polarization measurements towards the stars projected on the fields of IC 1396A (also known as the elephant trunk nebula), BRC 37, BRC 38 (also known as IC 1396N) and BRC 39 are presented here. The vectors, corresponding to 374 polarization measurements, are overlaid on a WISE1 12-|$\mu$|m image containing these fields in Fig. 1. The expanding circular H ii region IC 1396 is clearly perceptible in the image. The direction of the ionizing radiation and the position of the ionizing source are also shown. The mean values of the polarization measurements towards the four BRCs are given in Table 3. The locations of these clouds are shown in the zoomed images in the north (BRC 38), south (BRC 37), east (BRC 39) and west (IC 1396A). The orientation of the Galactic plane is shown with the dashed white line at a position angle of 65°. The black open circle on the image shows the field of view (8-arcmin diameter) of the instrument (AIMPOL) used for the observations. In our study, we mapped the B-field geometry of the outer low-density parts of the clouds. The distribution of the degree of polarization (P) and the position angle (|$\rm \theta _{P}$|) towards the four BRCs observed in IC 1396 are shown in Fig. 2. We segregated the known young stellar objects (YSOs), emission-line sources, known binary systems and the normal stars from our observed sample based on information from Simbad and the literature. YSOs are identified in the vicinity of IC 1396A (Sicilia-Aguilar et al. 2005, 2006), BRC 37, BRC 38 (Choudhury, Mookerjea & Bhatt 2010) and BRC 39.
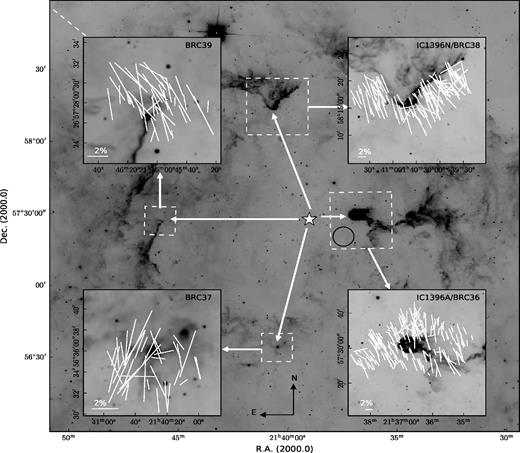
Optical polarization vectors over-plotted on a WISE 12-|$\mu$|m image of the IC 1396 H ii region. The structures IC 1396 A, BRC 37, BRC 38 and BRC 39 with the B-field geometry are shown in zoomed-in images. Line segments with 2 per cent polarization are shown for scaling. The white dashed line shows the position angle of the Galactic plane. The black circle in the dashed panel in the centre right of the image shows the field of view of the instrument (AIMPOL). Position angles are measured from north, increasing towards the east. The north and east directions are shown in the figure.

Plots of P versus |$\rm \theta _{P}$| of stars, excluding peculiar stars, projected on IC 1396A, BRC 37, BRC 38 (IC 1396N) and BRC 39. Histograms of the |$\rm \theta _{P}$| with bin-size 10° are also presented. The position angles of the Galactic plane at the latitude of the clouds are shown using dashed lines.
Mean values of polarization results obtained towards the bright-rimmed clouds studied in this work.
| Object | No. of stars | P ± σP | |$\rm \theta \pm \sigma _{\theta }$| |
|---|---|---|---|
| ( per cent) | (|$^{^\circ }$|) | ||
| IC 1396A | 173 | 2.0 ± 1.1 | 53 ± 18 |
| BRC 37 | 40 | 1.6 ± 0.8 | 98 ± 50 |
| BRC 38 | 121 | 2.7 ± 1.2 | 51 ± 17 |
| BRC 39 | 40 | 1.8 ± 1.0 | 50 ± 21 |
| Object | No. of stars | P ± σP | |$\rm \theta \pm \sigma _{\theta }$| |
|---|---|---|---|
| ( per cent) | (|$^{^\circ }$|) | ||
| IC 1396A | 173 | 2.0 ± 1.1 | 53 ± 18 |
| BRC 37 | 40 | 1.6 ± 0.8 | 98 ± 50 |
| BRC 38 | 121 | 2.7 ± 1.2 | 51 ± 17 |
| BRC 39 | 40 | 1.8 ± 1.0 | 50 ± 21 |
3.1 Polarimetric results of the YSOs found in the sample
YSOs are found to show an intrinsic polarization, which is attributed to the asymmetric distribution of circumstellar material either as a disc or as a flattened envelope (Breger & Dyck 1972; Bhatt 2011). We, therefore, separated the polarization measurements of YSOs from those of the target stars. Of the observed sources towards IC 1396, 19 stars are identified as YSOs in Simbad. Hence we have polarization measurements of 19 YSOs towards this region, of which seven stars are projected on IC 1396A (Sicilia-Aguilar et al. 2005, 2006) and 12 stars are located towards BRC 38 (Choudhury et al. 2010). The mean values of P and |$\rm \theta _P$| with their standard deviations towards these YSOs are estimated to be 1.2 ± 1.1 per cent and 55° ± 44° in IC 1396A, and 2.4 ± 1.2 per cent and 46° ± 24° towards BRC 38, respectively.
4 DISCUSSION
4.1 Distance of the IC 1396 H ii region
IC 1396 was found to be at a distance of ∼750 pc by Garrison & Kormendy (1976) using photometric and spectroscopic observations. It is a large (> 2°) and evolved H ii region ionized by HD 206267 located near its centre. HD 206267 lies in the Trumpler 37 cluster, which is located in the Cep OB2 association at a distance of about 800 pc. Contreras et al. (2002) estimated the distance to Trumpler 37 as 870 ± 80 pc. The majority of studies towards this H ii region assume a distance of ∼750 pc to the clouds associated with this region. We have likewise adopted a distance of ∼750 pc (Garrison & Kormendy 1976) to this H ii region in our analysis.
We measured the polarization of the stars background to the cloud in order to map the sky component of the B-fields in that cloud, but it is very important to consider the polarization contribution of the foreground dust in the line of sight in order to obtain the intrinsic polarization solely from the dust in the cloud. This contribution can vary depending on the distance of the cloud. For example, this contribution has not been found to change the measured values significantly, as seen in various studies performed on clouds located at distances of less than 500 pc (e.g. Li et al. 2009; Soam et al. 2013). It can, however, affect the polarization measurements if there are relatively small P values (|${\lesssim } 1\,\,\rm{per\,\,cent}$|) and the cloud distance is relatively large (|$\rm \gtrsim\!500\,pc$|). Because the distance of the H ii region studied here is ∼750 pc, we decided to remove the foreground polarization component added to the results by observing some stars located in the foreground to the region. Fig. 1 shows the uncorrected polarization vectors overlaid on the IC 1396 region.
4.2 Subtraction of the foreground polarization component
The polarization caused by the material in the interstellar medium (ISM) along a particular line of sight must be taken into account. We did not notice major change after the ISM contribution subtraction in the polarization results observed towards the cloud IC 63/59 (Soam et al. 2017b) at a distance of ∼200 pc, but we suspect that there may be a significant contribution of the ISM polarization in the results obtained towards the IC 1396 H ii region owing to its distant location (∼750 pc).
In order to subtract the interstellar polarization component from measured values, we searched for stars located within a radius of 1° around the centre of the IC 1396 H ii region with parallax measurements available in the Hipparcos (van Leeuwen 2007) and GAIA2 catalogues (TGAS; Gaia Collaboration 2016). We selected only normal stars, excluding peculiar sources such as emission-line stars, and stars in a binary or multiple systems, as per the information given in Simbad. Stars with values of the ratio between the parallax measurements and their uncertainties ≥ 2 have been considered for the analysis. The six stars with their observed polarization results from this work are listed in Table 4 in ascending order of distance. We also selected normal stars available in a 1° radius from the Heiles Catalogue (Heiles 2000) whose polarization values are available in the catalogue. We have restricted these searches of stars to a distance of 800 pc. The variations of the degree of polarization and position angle corresponding to foreground stars with their distances are shown in Fig. 3. The distribution of the Stokes parameters q and u with distance is shown in Fig. 4. The dotted lines in the plot show the distance of cluster Trumpler 37. In these figures, it can be seen that there are two populations in both q and u that have different P and |$\rm \theta$| values at distances ≤300 pc and greater than 300 pc. It might be possible that the some cloud at a distance between 200 and 300 pc is responsible for the change in the polarization values beyond 300 pc. The stars within the range 300 to 650 pc are the immediate foreground to the clouds in the IC 1396 H ii region. Therefore, we have used the observed values of stars within 300 to 650 pc to correct the foreground contribution.
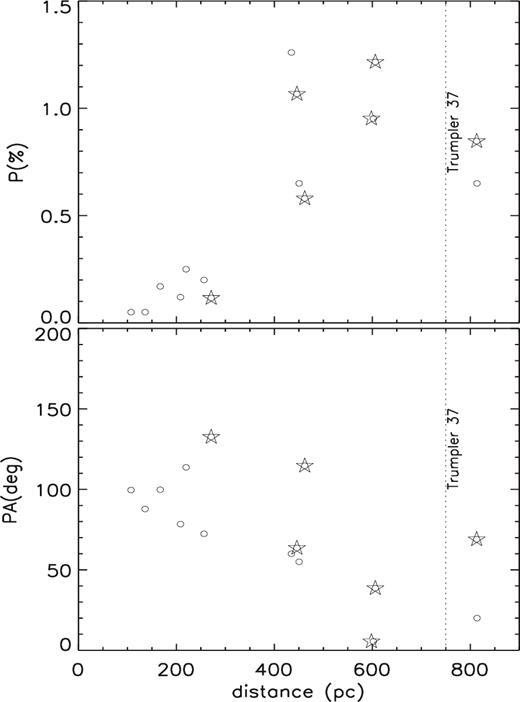
The change in the degree of polarization and the position angles with the distance of the foreground stars are plotted in the upper and lower panels, respectively. The open circles show the stars selected from the Heiles catalogue (Heiles 2000). The targets shown by stars are the foreground stars observed by us. The distances of these stars are taken from the Hipparcos (van Leeuwen 2007) and GAIA (TGAS; Gaia Collaboration 2016) catalogues. The dotted line represents the distance of cluster Trumpler 37.
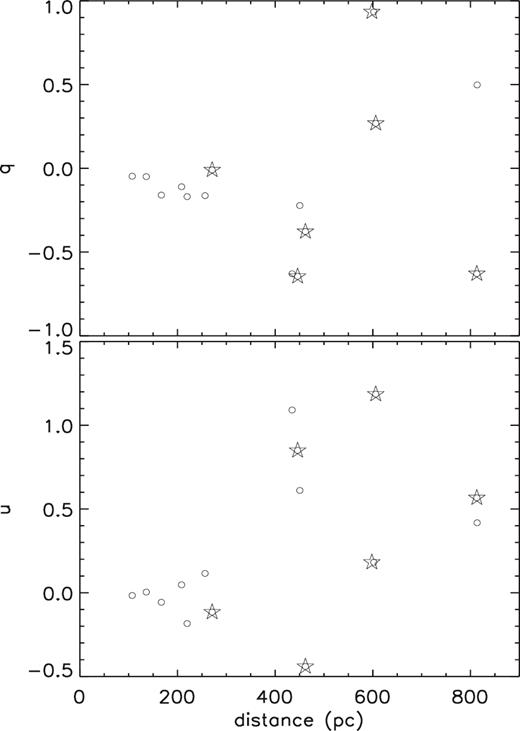
As Fig. 3, except for variations in the Stokes parameters q (upper panel) and u (lower panel) with distance.
Polarization values of observed stars foreground to the IC 1396 region.
| IDStar name | V | P ± εP | θ ± εθ | Da | |
|---|---|---|---|---|---|
| (mag) | ( per cent) | (°) | (pc) | ||
| 1 | HD 207049 | 8.9 | 0.95 ± 0.08 | 5 ± 2 | 379 |
| 2 | HD 206081 | 7.6 | 1.07 ± 0.07 | 64 ± 1 | 446 |
| 3 | HD 209744 | 6.7 | 0.65 ± 0.20 | 55 ± 8 | 450 |
| 4 | HD 210628 | 6.9 | 1.26 ± 0.20 | 60 ± 4 | 480 |
| 5 | HD 239728 | 8.8 | 0.58 ± 0.06 | 115 ± 3 | 568 |
| 6 | HD206267A | 5.6 | 1.02 ± 0.07 | 39 ± 2 | 606 |
In order to obtain the intrinsic polarization from the cloud dust only, we subtracted the polarization values of the foreground stars (shown in Table 4) from our measured values towards the clouds. For this purpose, we followed the procedure discussed in detail in our previous papers (Soam et al. 2013, 2017a). We have overlaid the vectors with corrected polarization angles towards IC 1396A, BRC 38, BRC 37 and BRC 39 in Fig. 5, and these values have been used for further analysis.
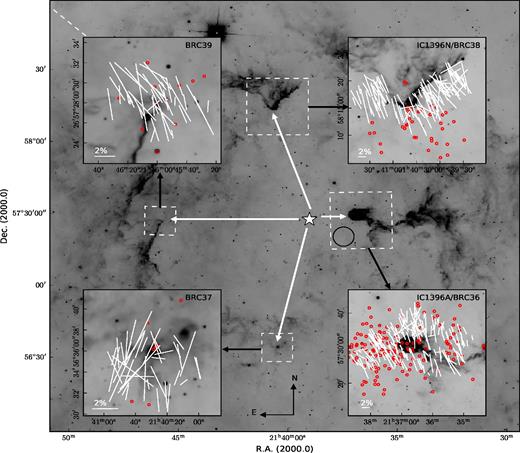
Polarization vectors (after subtracting the foreground polarization) overlaid on WISE 12-|$\mu$|m images of IC 1396A, BRC 37, BRC 38 and BRC 39. Line segments with 2|$\,\,\rm{per\,\,cent}$| polarization are shown to scale the value of P. The dashed line shows the position angle of the Galactic plane at the latitude of the cloud. The positions of young stellar objects (|$\rm H_{\alpha }$| emission stars) distributed towards bright-rimmed clouds are shown using red open circles. Position angles are measured from north increasing eastwards (directions shown in the figure).
4.3 Magnetic field geometry
We carried out a systematic polarization study to map the B-fields in the H ii region IC 1396 by observing the multiple BRCs associated with this region. Fig. 6 shows the colour composite image of the IC 1396 region made using WISE data. The image is labelled with the positions of four BRCs in the north, south, east and west directions. The position of BRC 36 towards IC 1396A is shown using a cyan box at the position coincident with the 850-|$\mu$|m peak emission (Morgan et al. 2008). The ionizing source HD 206267 (spectral type O6.5V) is also located in the image. The directions of ionizing radiation towards the BRCs are also shown. The white line segments plotted on the BRCs represent the mean B-field orientation. The Str|$\rm \ddot{o}$|mgren sphere (Strömgren 1939) created by ionizing radiation from HD 206267 is shown by the dashed circle. The mean values of the B-field direction in these BRCs are inferred from the polarization vectors after correcting for the foreground component. We estimated the incident angles of the ionizing photons towards these BRCs by joining a line from the ionizing source HD 206267 radially to the positions of the 850-|$\mu$|m dust emission peaks in these clouds identified by Morgan et al. (2008). The directions of incident ionizing photons are estimated to be 90° and 86° in IC 1396A and the globule BRC 36, located towards the tail of IC 1396A, respectively. The angles of incident radiation towards BRC 37, BRC 38 and BRC 39 are found to be ∼160°, ∼30° and ∼90°, respectively. Thus the projected offset angles between the incident ionizing radiation and the mean B-field orientation in BRC 37, BRC 38, IC 1396 A and BRC 39 are estimated to be ∼10°, ∼20°, ∼35° and ∼40°, respectively. These results imply that globally the B-fields are slanted with respect to the direction of the ionizing photons in the H ii region IC 1396. In BRC 37, the lowest value of the offset between the B-field direction and the ionizing photons suggests that the ambient B-fields are almost (although not exactly) parallel to the ionizing radiation. The inclinations of the B-fields and ionizing radiation in the other three clouds are more than that in BRC 37. These results can be compared with the 3D MHD simulations published by Henney et al. (2009) and Mackey & Lim (2011), where B-fields in the globules slanted with respect to the ionizing radiation are considered. The B-fields in these BRCs associated with the H ii region IC 1396 (except for BRC 37) are found to be parallel to the Galactic plane. This result is in agreement with the results obtained by Novak et al. (2005) and Li & Henning (2011) in the studies of B-field morphology towards Giant Molecular Clouds (GMCs). It is also apparent in the results towards BRCs associated with the Sh 2-185 region discussed in Soam et al. (2017b).
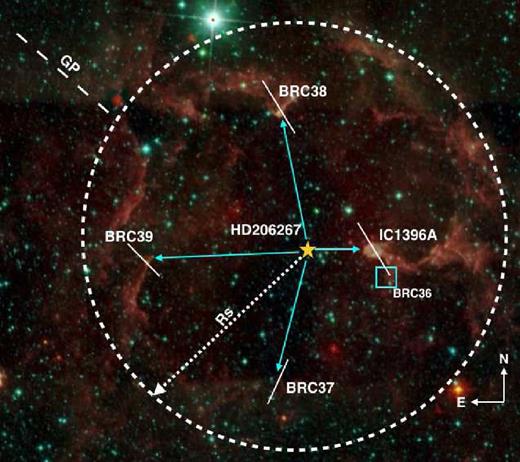
A colour composite image of the IC 1396 region made using WISE data. The image is labelled with the position of four bright-rimmed clouds (BRCs) in the north, south, east and west. The position of the BRC 36 structure, associated with the elephant trunk nebula, is shown with the cyan box at the position of the 850-|$\mu$|m peak emission (Morgan et al. 2008). The ionizing source HD 206267 (spectral type O6.5V) is also located in the image. The white line segments plotted on the BRCs represent the mean B-field orientation in these BRCs. The Str|$\rm \ddot{o}$|mgren sphere (Strömgren 1939) created by ionizing radiation from HD 206267 is shown by the dashed circle.
In order to understand the magnetized evolution of the BRCs associated with the H ii region IC 1396 in different directions and considering the MHD simulations by Henney et al. (2009), we made a cartoon diagram, shown in Fig. 7. The left panel in the figure shows the H ii region formed by gas, dust and ionized material swept by the high-energy UV radiation from HD 206267. The H ii regions interact with the molecular clouds in the vicinity and push away the low-density material faster than the high-density cloud cores. In Fig. 7, we show the pre-existing molecular clumps sitting on the edges of the H ii region. The low-density part of these clumps might have been ionized and pushed away by the expanding H ii region, giving rise to the bright-rimmed structure. The ambient B-fields are shown with the dashed lines. The right upper and lower panels show the fate of the two globules when the field lines are parallel and orthogonal to the ionizing radiation. The diagrams in the right panels can probably explain the magnetized evolution of the BRC 38 and IC 1396A nebulae, respectively. The dynamical and kinematical motions in these BRCs owing to RDI caused by UV radiation will be presented in future papers (Soam et al. in preparation; Neha et al. in preparation) using various low- and high-density molecular gas tracers.
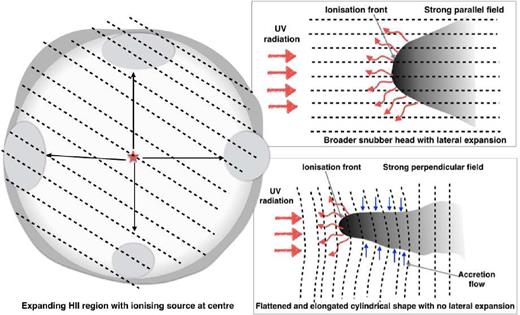
Schematic diagram showing the formation and expansion of an H ii region resulting from UV radiation from a central ionizing source. The formation of bright-rimmed clouds is understood by assuming pre-existing clumps/clouds on the periphery of the Str|$\rm \ddot{o}$|mgren sphere. The fates of molecular clouds in the presence of parallel and perpendicular B-fields are also shown in the right column.
The IC 1396A globule in the H ii region IC 1396 is also known as the elephant trunk nebula. Such a structure, formed by the pure RDI effect, is composed of a dense head at the front and less dense tails (Lefloch & Lazareff 1994; Kessel-Deynet & Burkert 2000; Miao et al. 2009; Bisbas et al. 2011; Haworth et al. 2012). IC 1396A appears to be consistent with the RDI-triggered star formation scenario given in a detailed study by Sicilia-Aguilar et al. (2014) using Herschel and Spitzer data. This is a much larger and more massive globule than the clouds modelled by Bisbas et al. (2011). Hence, the self-gravity in IC 1396A must play an important role in its dynamical evolution owing to its higher mass (∼200 M⊙; Patel et al. 1995; Weikard et al. 1996). Morgan et al. (2004) found that the ionized boundary layer (IBL) pressure in this globule is relatively high compared with the molecular pressure, which creates an appreciable pressure imbalance in the cloud. This suggests that the cloud may be currently undergoing an RDI process causing triggered star formation in this globule (Sicilia-Aguilar et al. 2005).
Fig. 5 shows the foreground-corrected polarization vectors representing the B-field geometry in IC 1396A in the zoomed-in panel. The offset of ∼35° between the mean direction of the B-field and the direction of ionizing radiation suggests that the B-fields are slanted with respect to the direction of the incident photons from HD 206267. In IC 1396A, we noticed that the degree of polarization in some of the sources lying in the high-density region (the inference of the high and low densities are based on the WISE 12-|$\mu$|m emission, as described in Soam et al. (2017b)) is relatively low. The B-field observations in this cloud match the MHD simulations performed by Henney et al. (2009) and Mackey & Lim (2011) in globules with strong initial B-fields slanted to the direction of ionizing radiation. In such cases, the globule acceleration caused by the rocket effect at later stages (0.12 Myr) is not radially away from the ionizing radiation. According to these simulations, the globule flattens swiftly along its longer axis when the B-fields are strong and slanted to the direction of ionizing radiation. In this case, the tail part of the cloud is shadowed and the surrounding material is accreted along the inclined field lines.
The distributions of YSOs (|$\rm H{\alpha }$| emission stars) towards the BRCs studied here are shown with red circles in Fig. 5. The distribution of YSOs correlates with the masses of the clouds, suggesting a greater number of YSOs in more massive clouds, which are relatively closer to the ionizing source. The importance of B-fields in the evolution of dense cores and subsequent star formation can be better understood by probing the field geometries using near-infrared (NIR) and submm polarimetric techniques. This work is limited to investigating the B-fields in the low-density regions of clouds.
Sicilia-Aguilar et al. (2005) and Sicilia-Aguilar et al. (2006), using deep Spitzer photometry, optical photometry and spectroscopy, found a population of >200 H α emission stars with a mixed age population of ∼ 4-Myr-old stars in the central Trumpler 37 cluster and ∼1-Myr-old stars on the front arc of the IC 1396A nebula. In addition to this, some obscured IR-excess stars were found embedded in the cloud. Morales-Calderón et al. (2009) reported the presence of several embedded Class I/II YSOs in this cloud. A total of 24 low-mass and high-accretion-rate T Tauri stars were identified by Barentsen et al. (2011). By investigating the distribution of these stars with different ages and distances from the ionizing source, the above studies proposed that the formation of the stellar population located in front of the IC 1396A nebula was triggered by high-energy radiation from HD 206267. This finding has been supported by the presence of hundreds of YSOs concentrated within and surrounding the nebula, as revealed by high-sensitivity optical and mid-infrared surveys. IC 1396A has a young star |$\rm LkH{\alpha }$|349c in the head part. The outflows from the star |$\rm LkH{\alpha }$|349c created a cavity of ∼0.3 pc in the globule head. This cavity is seen in Infrared Array Camera on the Spitzer Space Telescope 8-|$\mu$|m, |$\rm ^{12}$|CO (J = 1-0) and |$\rm ^{13}$|CO (J = 1-0) maps by Nakano (1989), and the extinction maps obtained from the 2MASS data by Reach et al. (2009), suggesting that the globule is being reshaped from inside.
The foreground-corrected polarization vector revealing the B-field structure in BRC 37 is shown in Fig. 5. The globule axis is almost (but not exactly) aligned with the incident UV radiation. This suggests that the high-energy radiation from HD 206267 might have affected the formation and evolution of this cloud (Williams, Ward-Thompson & Whitworth 2001; Fukuda, Hanawa & Sugitani 2002; Miao et al. 2006). The mean direction of the B-field is aligned with the longer axis of the cloud. The lowest value of the offset of ∼10° (among the BRCs studied in this work) between the ionizing radiation and the B-field direction suggests that the initial B-fields are nearly parallel to the UV radiation. The curvature in the cloud's rim might have been caused by the radiation. The alignment of the B-field geometry of the cloud's longer axis suggests that the B-fields could be dragged away from the ionizing source. The B-fields will eventually be aligned in the direction towards the exciting star, that is, the cloud's longer axis if the B-field is frozen into the gas (e.g. Bertoldi 1989). The structure of the B-fields in the BRC 37 globule is similar to the B-field morphology found in the M16 pillar by Sugitani et al. (2007).
Hydrodynamical simulations towards pillar-like structures such as M16 have been presented by Williams et al. (2001). These simulations suggest that narrow pillar-like structures will often occur in H ii regions with large-scale inhomogeneities, and their evolution may result in extended sequences of radiation-induced star formation. The mass of shocked molecular gas at the head of the column-like structure is interestingly found to be close to the Jeans mass (Williams et al. 2001). BRC 37 is not in pressure equilibrium between the IBL pressure and the molecular pressure (Morgan et al. 2004) and is found to have a star IRAS 21388+5622 associated with outflows (Schwartz et al. 1991) and of age ∼0.3 Myr (Duvert et al. 1990) embedded at the tip of the cloud. The formation of this star might have been triggered by the ionizing radiation. The identification of other near-infrared sources (Sugitani, Tamura & Ogura 1995) nearly aligned with this star and the globule axis suggest sequential star formation. This cloud is also found to contain a young brown dwarf candidate, which is the first reported observational evidence of triggered brown dwarf formation in BRCs (Ikeda et al. 2008).
The B-field geometry inferred from our polarization studies towards BRC 38 is also shown in Fig. 5. This cloud has structural similarities with the IC 63 globule associated with Sh 2-185 and discussed in Soam et al. (2017b). We were not able to observe B-fields in the high-density regions of the cloud BRC 38 using optical polarization techniques. Thus the polarization map in Fig. 5 shows the B-field geometry on the periphery of the cloud. The offset of ∼20° between the direction of the ionizing UV radiation and the mean direction of the B-field in the cloud suggests a slanted B-field geometry with respect to the ionizing radiation. In BRC 38, two features in particular are noticeable. One is that the field lines exhibit two components on the western face of the globule which is looking towards the ionizing radiation. The other is that there is a density enhancement at the tip of the globule (850-|$\mu$|m SCUBA map; Morgan et al. 2004). This may be caused by the accumulation of material as a result of the ionizing pressure. The mean direction of the B-field is almost consistent with the mean B-field direction in the IC 1396A globule, suggesting that the B-fields shown in these two clouds are closely connected to the ambient large-scale B-fields in the H ii region IC 1396. Henney et al. (2009) and Mackey & Lim (2011) presented 3D MHD simulations explaining the cases where initial B-fields are inclined (as found in BRC 38) to the incident ionizing radiation. In these cases, the lateral compression of the neutral globule is opposed by the B-fields, and this results in a broader and snubber globule head with a much simpler internal structure. These cases do not show any accretion in the globule tail because the thermal pressure of the ionized gas at the sides of the globule will not be sufficient to compress the tail's longitudinal B-fields laterally. The photo-evaporation flows are channelled by the B-fields towards the symmetry axis by means of a focusing shock (Henney et al. 2009). These simulation results match our B-field observations in BRC 38.
BRC 38 is found to be undergoing triggered star formation owing to the presence of high-energy photons from the star HD 206267 in the vicinity. IRAS21391+5802 is embedded at the tip of the nebula and is associated with extended bipolar outflows (Sugitani et al. 1989). Beltrán et al. (2002), using millimetre-wavelength observations, revealed three other embedded intermediate- and low-mass sources, named BIMA 1, 2 and 3, in this cloud. The young stars embedded in the cloud and associated with outflows indicate ongoing star formation in the dense core at the tip of BRC 38.
The B-field geometry towards BRC 39 is also shown in Fig. 5. The direction of radiation towards this cloud is ∼90°. There is a clear bending of the B-fields in the head part of this cloud. These results are similar to the curved field geometries found in studies towards LBN 437 (Soam et al. 2013) and B 335 (Davidson et al. 2011). The mean direction of the B-field is slanted with respect to the ionizing radiation from HD 206267. There is a distinguishable elongated density-enhancement feature on the lower rim of this cloud. Some of the vectors are found to be parallel to this feature, suggesting that the material could be following the B-field lines in this region. According to its structural axis orientation and morphology, BRC 39 is an asymmetrical type B cloud, and its formation mechanism can be nicely illustrated by the scenario suggested in Kinnear et al. (2015), which indicates that it might have formed from an initially inclined prolate cloud under the RDI effect.
Fig. 8 shows the schematics adopted from the simulation of Kinnear et al. (2015) in order to understand the modification in the magnetic field as found in BRC 39. The rightmost panel of the figure is a prolate cloud with its structure axis (major axis) inclined to the ionization radiation flux (shown by the red arrow). The global magnetic fields are shown using parallel green lines. After the cloud underwent the RDI process induced by ionizing radiation, the star-facing surface of the prolate cloud was shocked and formed a thin, elongated density-enhancement layer with a highly condensed apex point at the top end, as shown in the rendered density image in the left panel of the figure. This case seems to be very similar to the observed features towards the lower rim of BRC 39, as shown in Fig. 5.
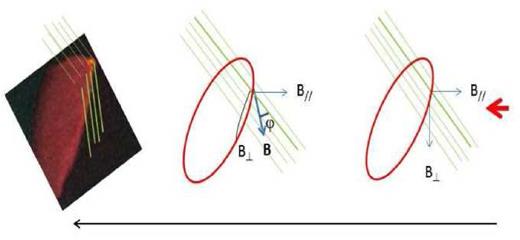
Schematics for depicting the structural evolution of BRC 39 using the simulations from Kinnear et al. (2015). The evolutionary track is shown from right to left, represented by an arrow. Green segments show the global magnetic field lines, and the red arrow indicates the direction of ionizing radiation towards the cloud. Two orthogonal components of the plane of the sky magnetic fields are labelled as |$\rm B_{\parallel }$| and |$\rm B_{\perp }$|.
In Fig. 8, it is seen that the rear side of the cloud is not directly affected by the ionizing radiation. Hence there is no significant change from its initial morphology, and the magnetic field there (green lines shown in the upper part of the cloud) remains the original direction. On the other hand, we can quantitatively analyse the effect on the magnetic fields on the ionizing star-facing side of the cloud (green lines shown in the lower part of the cloud). In the right panel, the prolate cloud is initially embedded in the ambient magnetic field of the H ii region. One of the green lines (the thicker one) can be taken as an example to show how it decomposes into two components, B∥ and B⊥ to the ionization radiation coming from the direction denoted by the red arrow. After the RDI process, B∥ will not change, but the previously perpendicular component B⊥ is curved into the shocked surface layer on the star-facing side (as described in the lower right panel of Fig. 7), as shown by the blue curve in the middle panel of the figure. The total magnetic field |$\boldsymbol {B}$| is now approximately represented by the blue-arrowed thick line in the middle panel, with an angle |$\rm \varphi$| from the original direction (thick green line). The final configuration of the magnetic field as seen in the lower part of BRC 39 is depicted by the parallel green lines, as shown in the left panel of the figure, and is bent from the direction of the original magnetic fields seen in the upper part of the cloud.
BRC 39 is also found to be a cloud with ongoing star formation activity. The presence of an embedded source, IRAS 21445+5712, is revealed with a far-infrared luminosity of |${\sim }96\rm L_{{\odot }}$| (Panwar et al. 2014). Several |$\rm H{\alpha }$| emission stars associated with this cloud are reported by Ogura, Sugitani & Pickles (2002) and Nakano et al. (2012). The ongoing star formation activity is also suggested by the presence of water maser emission (Valdettaro et al. 2005) and two bright bow shocks, HH 865A and HH 865B, emerging from IRAS 21445+5712 (Froebrich et al. 2005).
4.4 Magnetic field strength
The equipartition of kinetic and perturbed magnetic energies was assumed while deriving the original equation. Considering the polarization angle deviation and the velocity dispersion in the line of sight, the strength of the B-fields projected on to the sky could be estimated.
The deviation in |$\rm \theta$| obtained by fitting a Gaussian to the distribution of polarization angles is used to calculate the |$\rm \delta \theta$| in the clouds studied here. The dispersion in |$\rm \theta$| is then corrected by the uncertainty in |$\rm \theta$| using the steps given in Lai et al. (2001) and Franco, Alves & Girart (2010). In this procedure, the dispersion is corrected in quadrature by the polarization angle using Δθ = (σstd2 − 〈σθ〉2)1/2, where the mean error |$\rm \langle \sigma _{\theta }\rangle$| is calculated from 〈σθ〉 = Σσθi/N; here, σθi is the estimated uncertainty and |$\rm \sigma _{std}$| is the standard deviation in the position angle (for details see Soam et al. 2017a). We adopted the CO(J = 1–0) line FWHM from our ongoing molecular line survey of BRCs at the Taeduk Radio Astronomical Observatory (TRAO; Soam et al. in preparation) . We checked the perfect Gaussian profile of CO lines and estimated the average FWHM as |$\rm 2.1\pm 0.61$| and |$\rm 1.51 \pm 0.07 \,km\, s^{-1}$| towards IC 1396A and BRC 37, respectively. CO(1–0) observations towards SFO 38 were affected by the outflow activity from the embedded protostar, and hence we adopted the |$\rm C^{18}O$|(1–0) line width, which is found to be |$\rm 1.31 \pm 0.10 \,km\, s^{-1}$| (Neha et al. in preparation) . The line width of |$\rm ^{13}CO$|(2–1) towards BRC 39 as |$\rm 1.7 \,km\, s^{-1}$| has, owing to the unavailability of CO data, been adopted from Weikard et al. (1996). The volume densities towards these clouds were calculated using information on the hydrogen column density from Morgan et al. (2010), which is found to be |$\rm 16\times 10^{21 } \,cm^{-2}$| towards BRC 39. For the other two clouds, IC 1396A and BRC 38, we considered the average column density to be |$\rm \sim\!10^{22} \,cm^{-2}$| (based on the values given for all other BRCs in Morgan et al. 2010). This value is found to be similar to the column densities obtained by |$\rm CO$|(1–0) and |$\rm C^{18}O$|(1–0) observations (Soam et al., in preparation, Neha et al., in preparation) using the relationship given by Garden et al. (1991). Using only the angular extents of the clouds where polarization observations are made and taking 750 pc as the distance to the IC 1396 H ii region, we estimated the volume densities of IC 1396A, BRC 38 and BRC 39 as |$\rm 9.3\times 10^{3}$|, |$\rm 7.4\times 10^{4}$| and |$\rm 3.8\times 10^{4} \,cm^{-2}$|, respectively. Using the volume density and line-width information in the Chandrasekhar–Fermi (CF) relationship, we estimated the magnetic field strengths as |$\rm \sim 110$|, ∼220 and |${\sim }150\mu$|G towards IC 1396A, BRC 38 and BRC 39, respectively. In the case of BRC 38, we used the polarization values only on the tip of the cloud for estimating the magnetic field strength because we are adopting the |$\rm C^{18}O$|(1–0), optically thin tracer, line width in the calculation of B-field strength. The rest of the polarization measurements are mostly projected outside the cloud part, and therefore we did not use these values. The B-field strength towards BRC 37 has not been estimated owing to the very high dispersion (|$>\!25^{^\circ }$|) in the polarization angle, which breaks one of the assumptions of the CF relationship.
4.5 Pressure budget in BRCs
In order to compare and investigate the importance of the various pressures in the BRCs studied here, we estimated the thermal (Pth), turbulent (Pturb) and magnetic (Pmag) pressures towards these clouds. The IBL pressure (PIBL) values were adopted from Morgan et al. (2004).3 The data sets characterize the physical properties of the IBL of the BRCs. They compare the measured flux (|$\rm \Phi$|) and predicted ionizing fluxes (|$\rm \Phi _{P}$|) incident on the rims of these clouds. The measured ionizing fluxes are found to be lower than the predicted ionizing flux based on the spectral type of the ionizing source and the distance of the cloud from the source. The predicted ionizing fluxes can be considered as the upper limit because the loss in photons caused by absorption from intervening material between the star and the cloud has not been considered by Morgan et al. (2004) also the distance between star and the clouds are projected values. The values of pressures estimated towards the BRCs studied here are shown in Table 5. The various pressures in the BRCs studied here can be compared in the table. The dynamical pressure in the clouds is found to be lower than the external pressure, which suggests that the shock driven by the photoionization could propagate into the molecular cloud, causing it to implode and trigger star formation. The magnetic pressures of the clouds are estimated using the B-field strength over the region where optical polarimetry covers the cloud. The magnetic pressure is found to be lower than the external pressure in these BRCs, except in BRC 38. The magnetic pressure in this cloud is estimated to be about twice the external pressure, suggesting that the fields can support the cloud against external pressure.
Pressure estimation towards the bright-rimmed clouds studied in this work. The values of the ionized boundary layer (IBL) pressure are adopted from Morgan et al. (2004). The temperature information for estimating the thermal pressure is obtained from Sicilia-Aguilar et al. (2014) towards IC 1396A. The temperature information towards BRC 37, BRC 38 and BRC 39 has been taken from Sugitani et al. (2000). In the table, the IBL, thermal, turbulent and magnetic pressures denoted by PIBL, Pth, Pturb, and Pmag, respectively.
| Object | Measured ionizing flux | Predicted ionizing flux | PIBL | Pth | Pturb | Pmag |
|---|---|---|---|---|---|---|
| |$\rm \Phi (10^{18}\,cm^{-2}\,s^{-1})$| | |$\rm \Phi _{P}(10^{18}\,cm^{-2}\,s^{-1})$| | |$\rm (10^{-10} \,erg\, cm^{-3})$| | |$\rm (10^{-10} \,erg\, cm^{-3})$| | |$\rm (10^{-10} \,erg\, cm^{-3})$| | |$\rm (10^{-10} \,erg\, cm^{-3})$| | |
| IC 1396A | 2.4 | 59.6 | 1.0 | 0.05 | 1.7 | 0.6 |
| BRC 37 | 2.0 | 10.2 | 15.0 | 0.12 | 2.6 | – |
| BRC 38 | 2.8 | 13.3 | 11.0 | 0.05 | 1.0 | 21.0 |
| BRC 39 | 1.9 | 9.2 | – | 0.08 | 2.1 | 3.2 |
4.6 Polarization in YSOs
The spectral type and |$\rm H{\alpha }$| equivalent width (EW) for some of the YSOs observed in this work towards IC 1396 are given by Sicilia-Aguilar et al. (2005, 2006) and Choudhury et al. (2010). The spherically distributed circumstellar dust around a central YSO producing infrared fluxes leads to substantial extinction along the line of sight at optical wavelengths. Hence, the infrared-emitting dust must be distributed in a flattened disc-like geometry (Strom 1972). This can cause high polarization when viewed edge-on. Breger & Dyck (1972) detected the intrinsic polarization in several pre-main sequence stars in NGC 2264. The observed infrared excess emission, |$\rm H{\alpha }$| emission and the intrinsic polarization of the YSOs suggest the presence of circumstellar discs around these objects. We found a higher polarization and |$\rm H{\alpha }$| EW associated with the stars with higher extinction. Some of the YSOs have low polarization, even with the high extinction. This may be a result of the dependence of polarization on viewing angle (edge-on or face-on).
5 CONCLUSIONS
We have conducted the first systematic study of B-fields towards multiple BRCs in different directions in the H ii region IC 1396 and at various distances from the same central ionizing source. The star, HD 206267 with spectral type O6.5V, located at a distance of ∼600 pc, is supposed to be the main ionizing source for the H ii region IC 1396. The B-field study of the BRCs in the east, west, north and south give an idea of the complete geometry of the B-field in this region. In order to interpret the B-field geometry, we subtracted the polarization contribution of ISM dust in the line of sight by observing the stars foreground to the clouds. The corrected results were used to interpret the B-field geometries. The orientations of mapped B-fields are found to be parallel to that of the Galactic plane, suggesting a well-connected field structure from larger scales to cloud scale. It seems that the fields lines in the BRCs studied here were slanted to the direction of ionizing radiation prior to being affected by it. The B-fields in BRC 37 and BRC 38 seem to be following the structure of the cloud. In IC 1396A, perhaps as a result of the presence of strong B-fields, the structure of the globule becomes anvilled and elongated in shape. Our results match the MHD simulations conducted towards BRCs to test their magnetized evolution. The fields lines are bent in the head part of BRC 39. BRC 38 represents the case of strong B-fields almost parallel to the direction of ionizing radiation. The B-field strengths are estimated as |$\rm \sim 110$|, ∼220 and |${\sim }150\,\mu$|G towards IC 1396A, BRC 38 and BRC 39, respectively. The pressure budget of these BRCs was tested and it was found that the dynamical pressures in the clouds are lower than the external pressure, which suggests that a shock driven by the photoionization could propagate into the molecular cloud, causing it to implode and trigger star formation.
ACKNOWLEDGEMENTS
This research has made use of the Simbad data base, operated at CDS, Strasbourg, France. We also acknowledge the use of NASA’s SkyView facility (http://skyview.gsfc.nasa.gov) located at the NASA Goddard Space Flight Center. AS thanks KASI for post-doctoral research funding. CWL was supported by the Basic Science Research Program through the National Research Foundation of Korea (NRF) funded by the Ministry of Education, Science and Technology (NRF-2016R1A2B4012593). AS thanks Piyush Bhardwaj (GIST, South Korea) for help during the observations.
Footnotes
WISE image courtesy of NASA, JPL/Caltech, WISE Team.
These authors carried out a radio, optical and infrared wavelength imaging survey of 44 BRCs using the NRAO/VLA Sky Survey (NVSS), Digitised Sky Survey (DSS) and the Midcourse Space eXperiment (MSX) archived data.
REFERENCES
